

Study on Lateral Water Migration Trend in Compacted Loess Subgrade Due to Extreme Rainfall Condition: Experiments and Theoretical Model

Abstract
1. Introduction
2. Materials and Methods
2.1. Test Materials
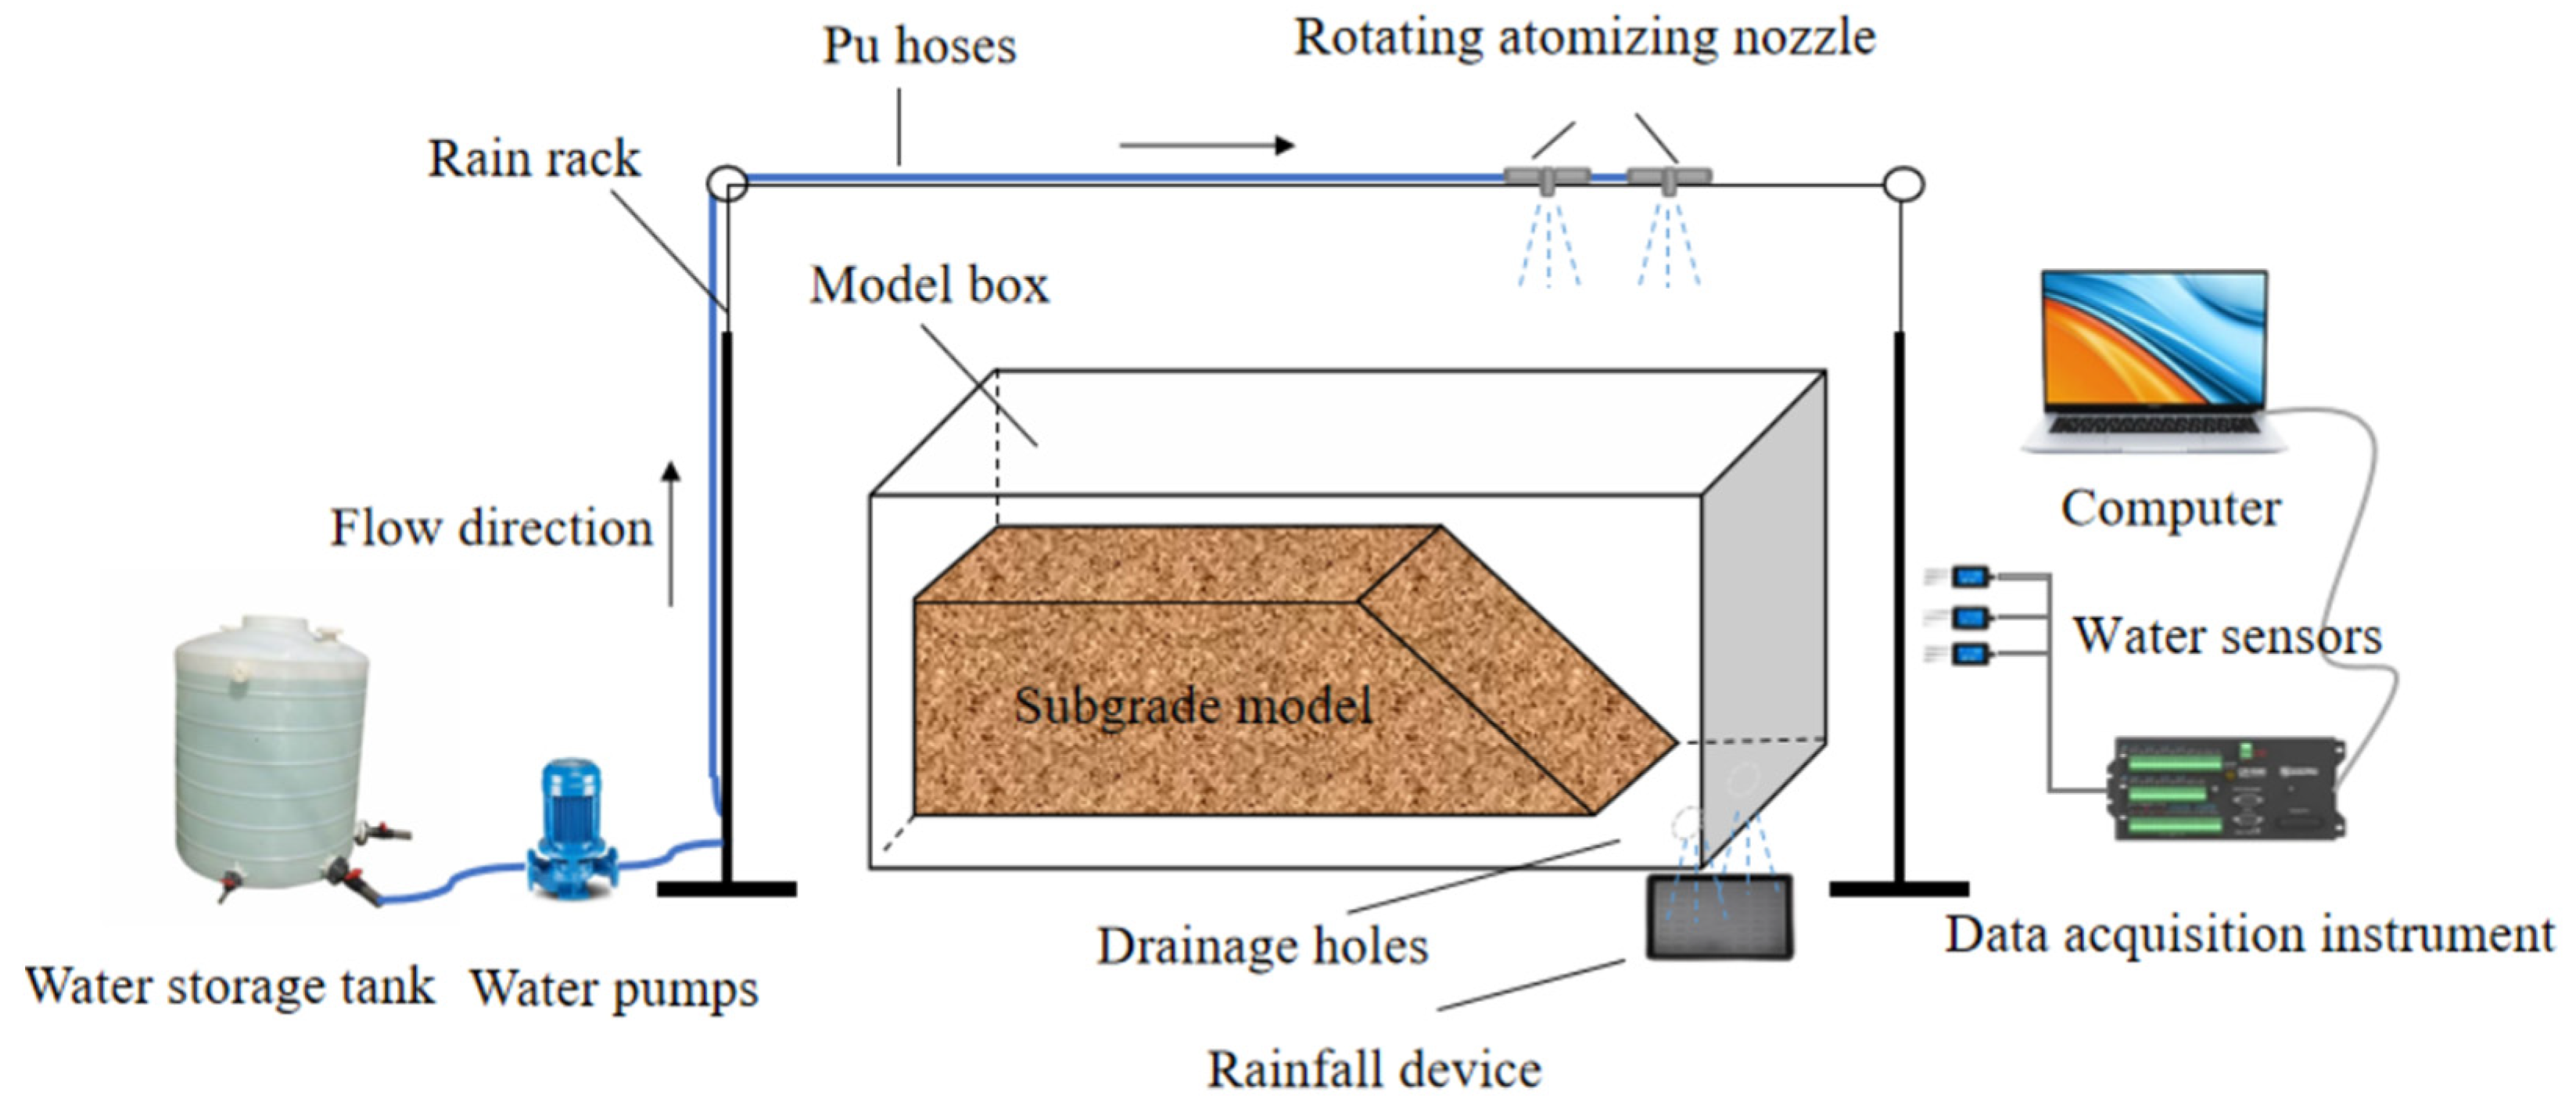
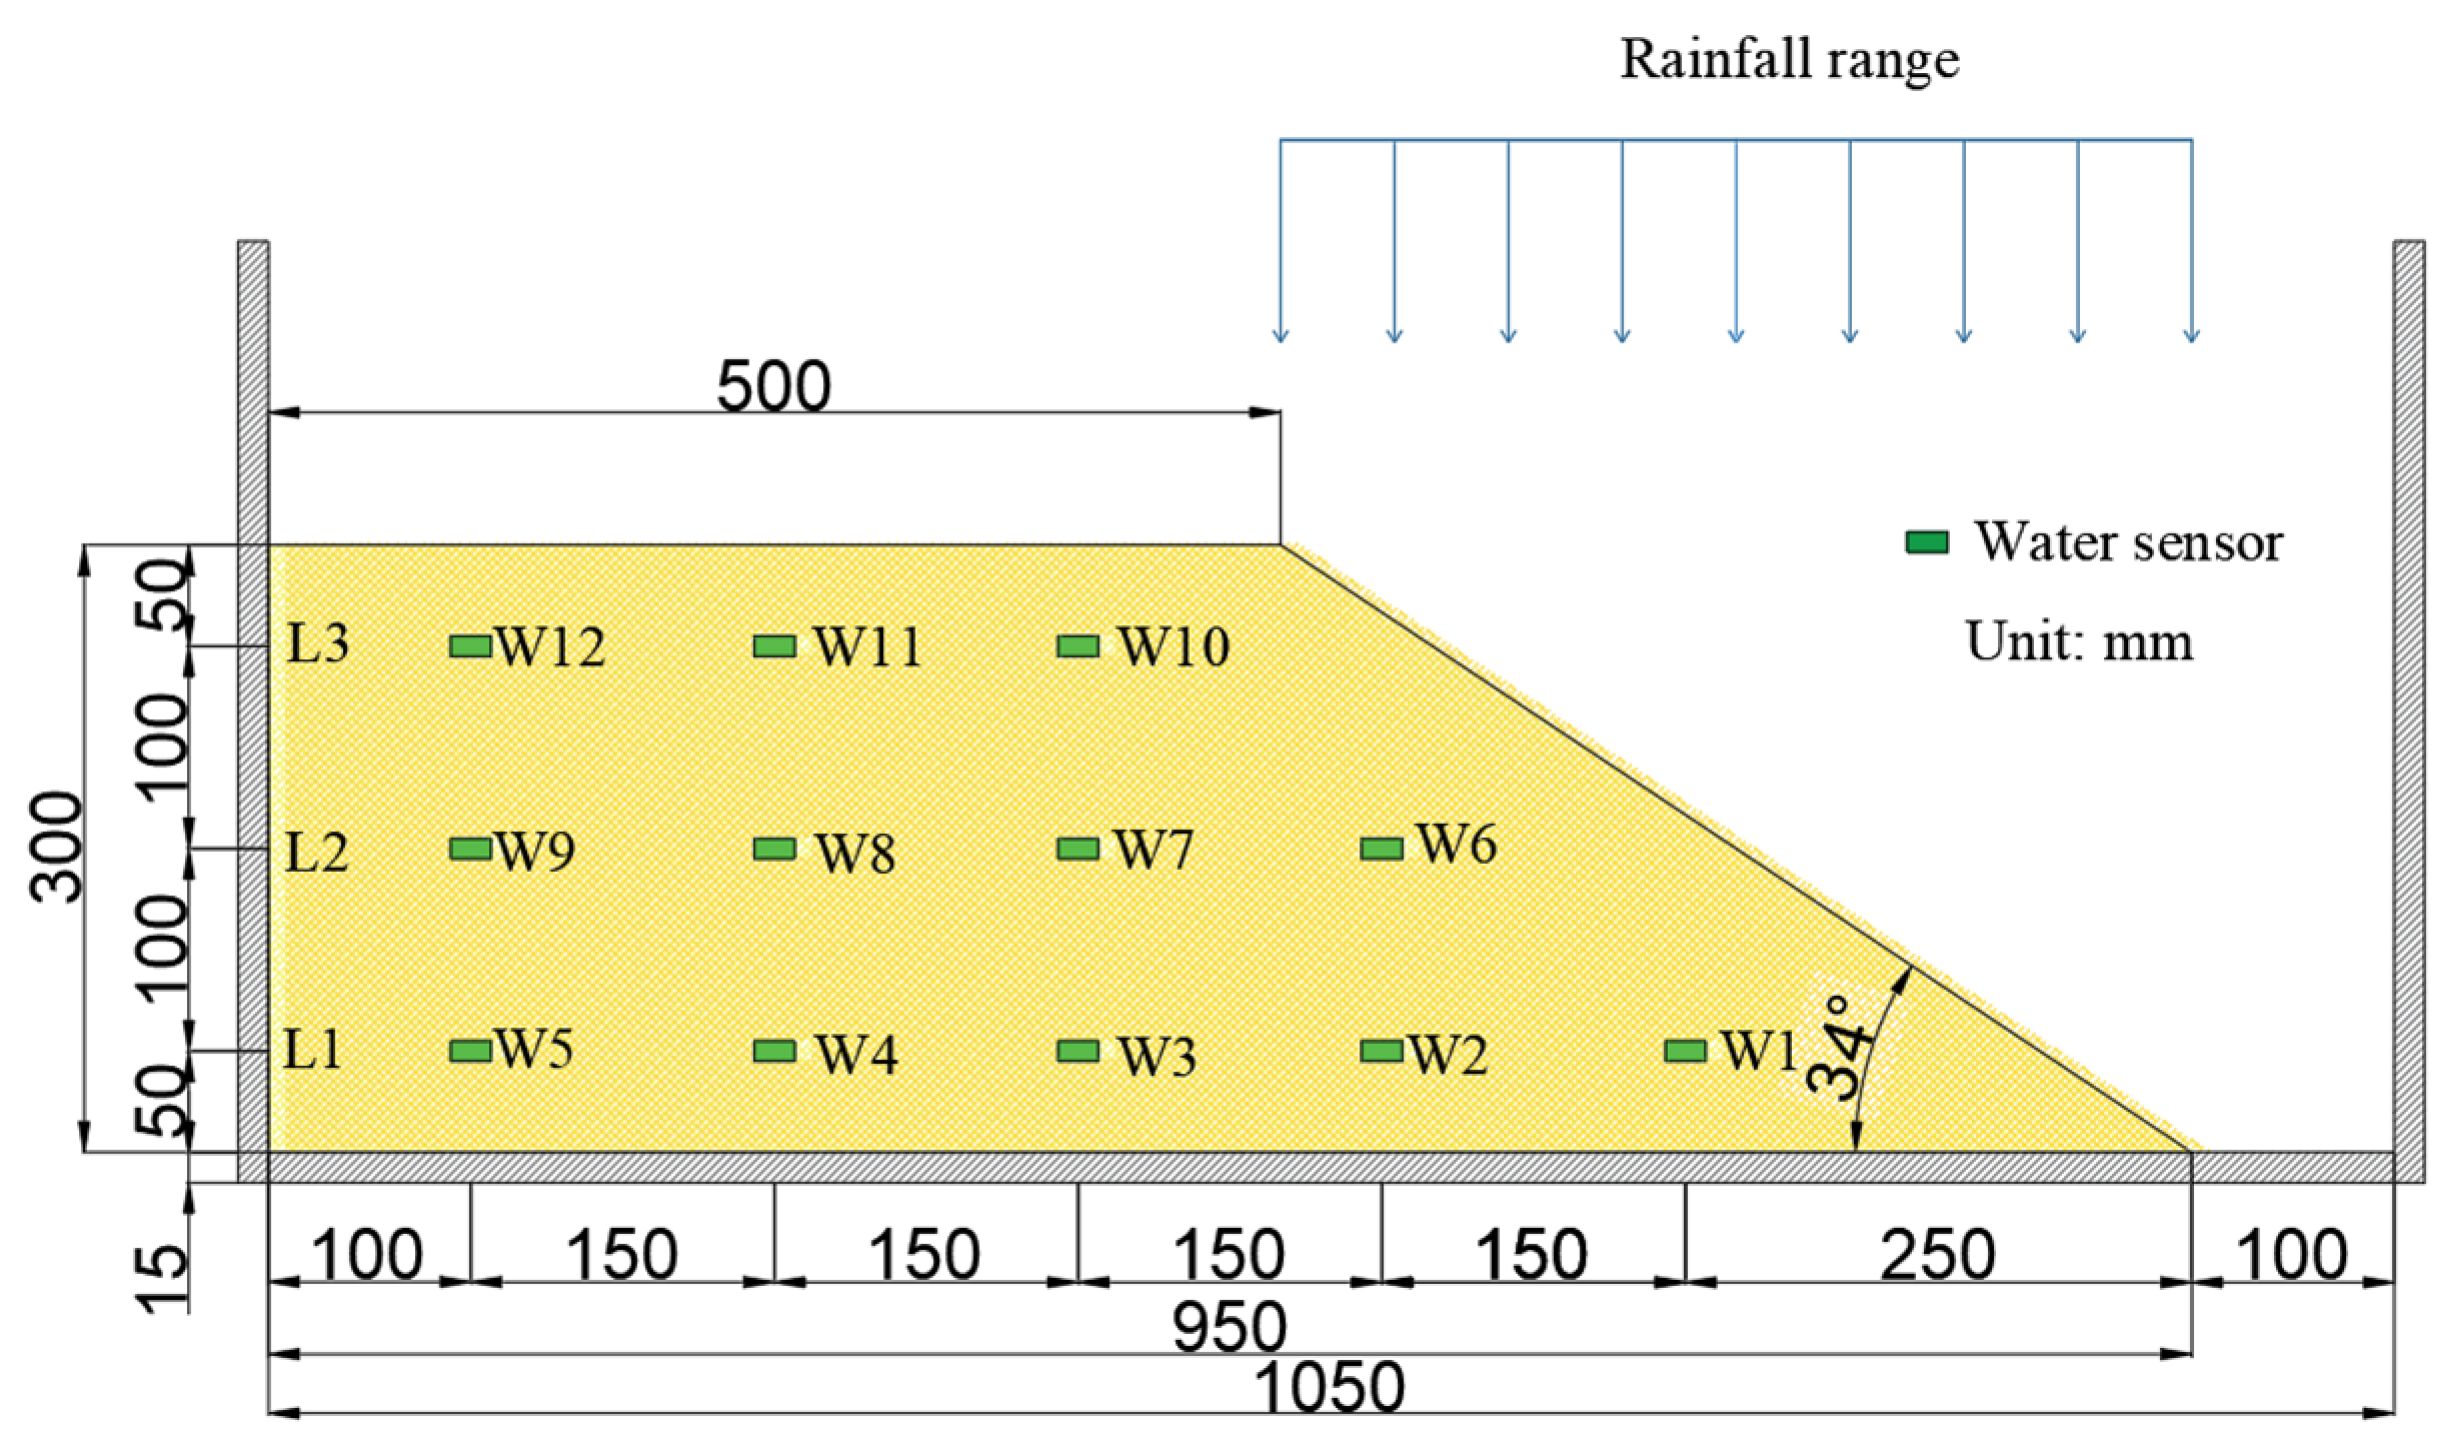
2.2. Test Device
2.3. Test Method
3. Results
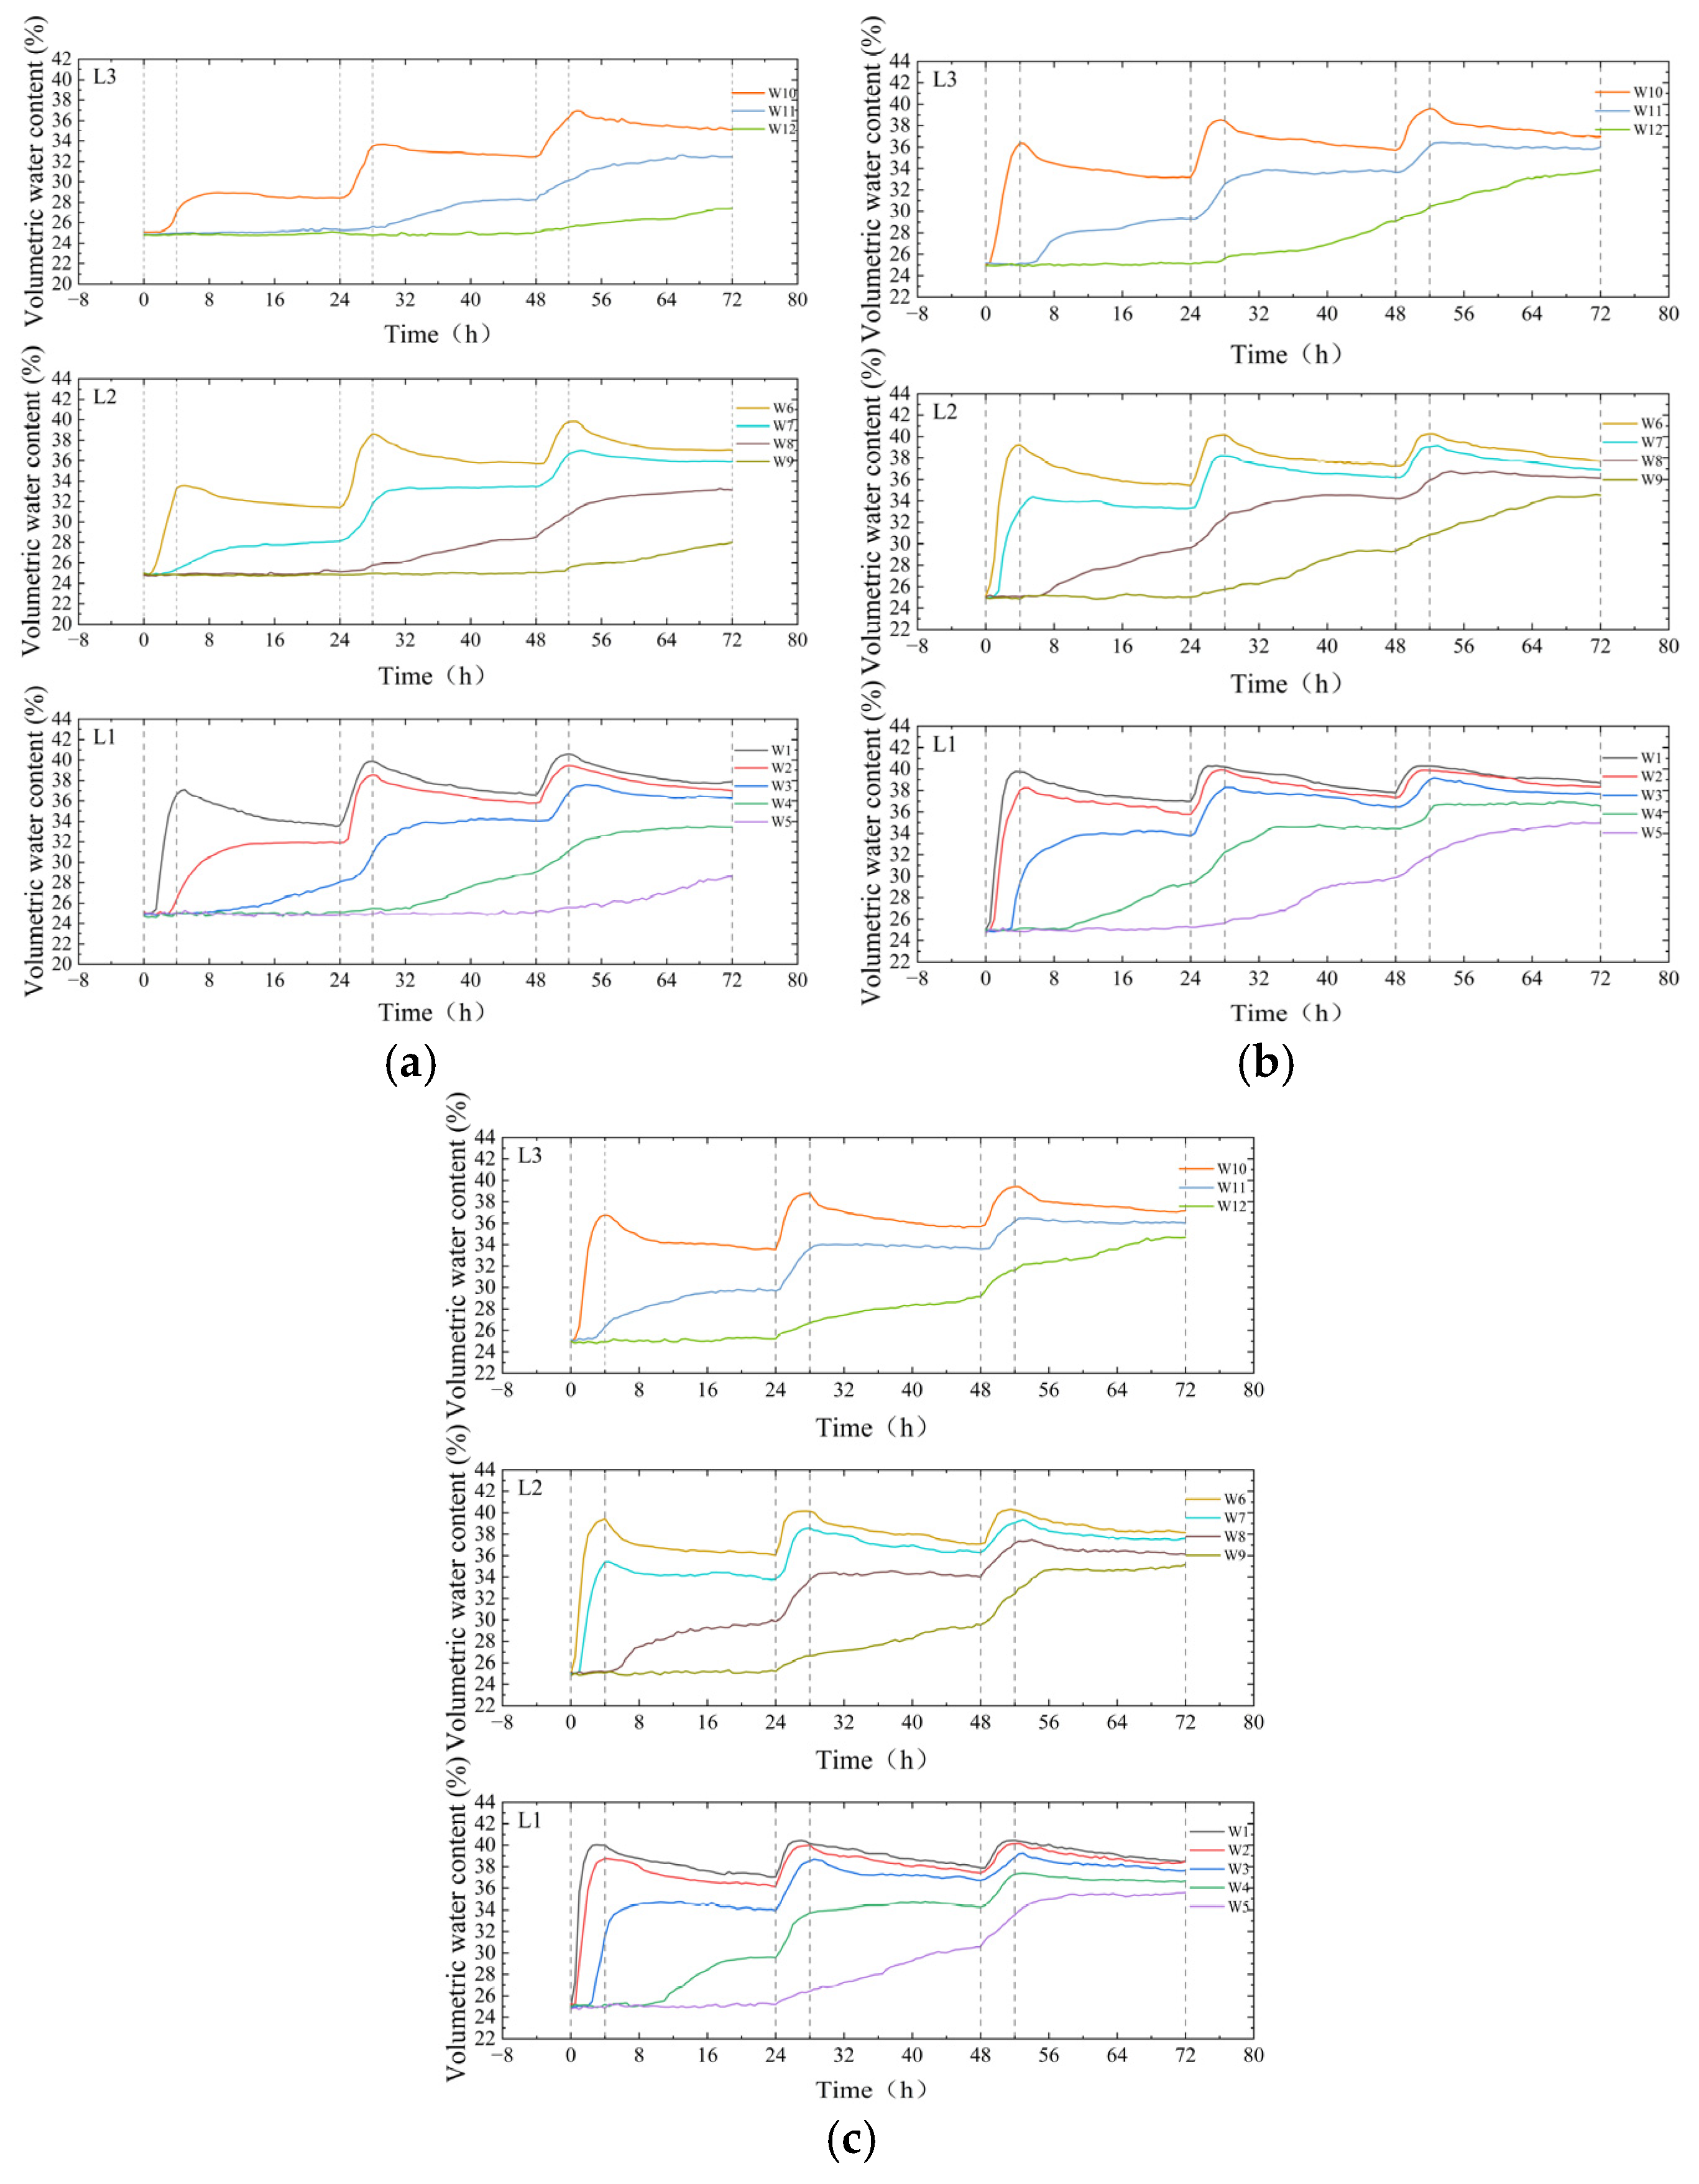
3.1. Extreme Rainfall Effect on the Water Distribution
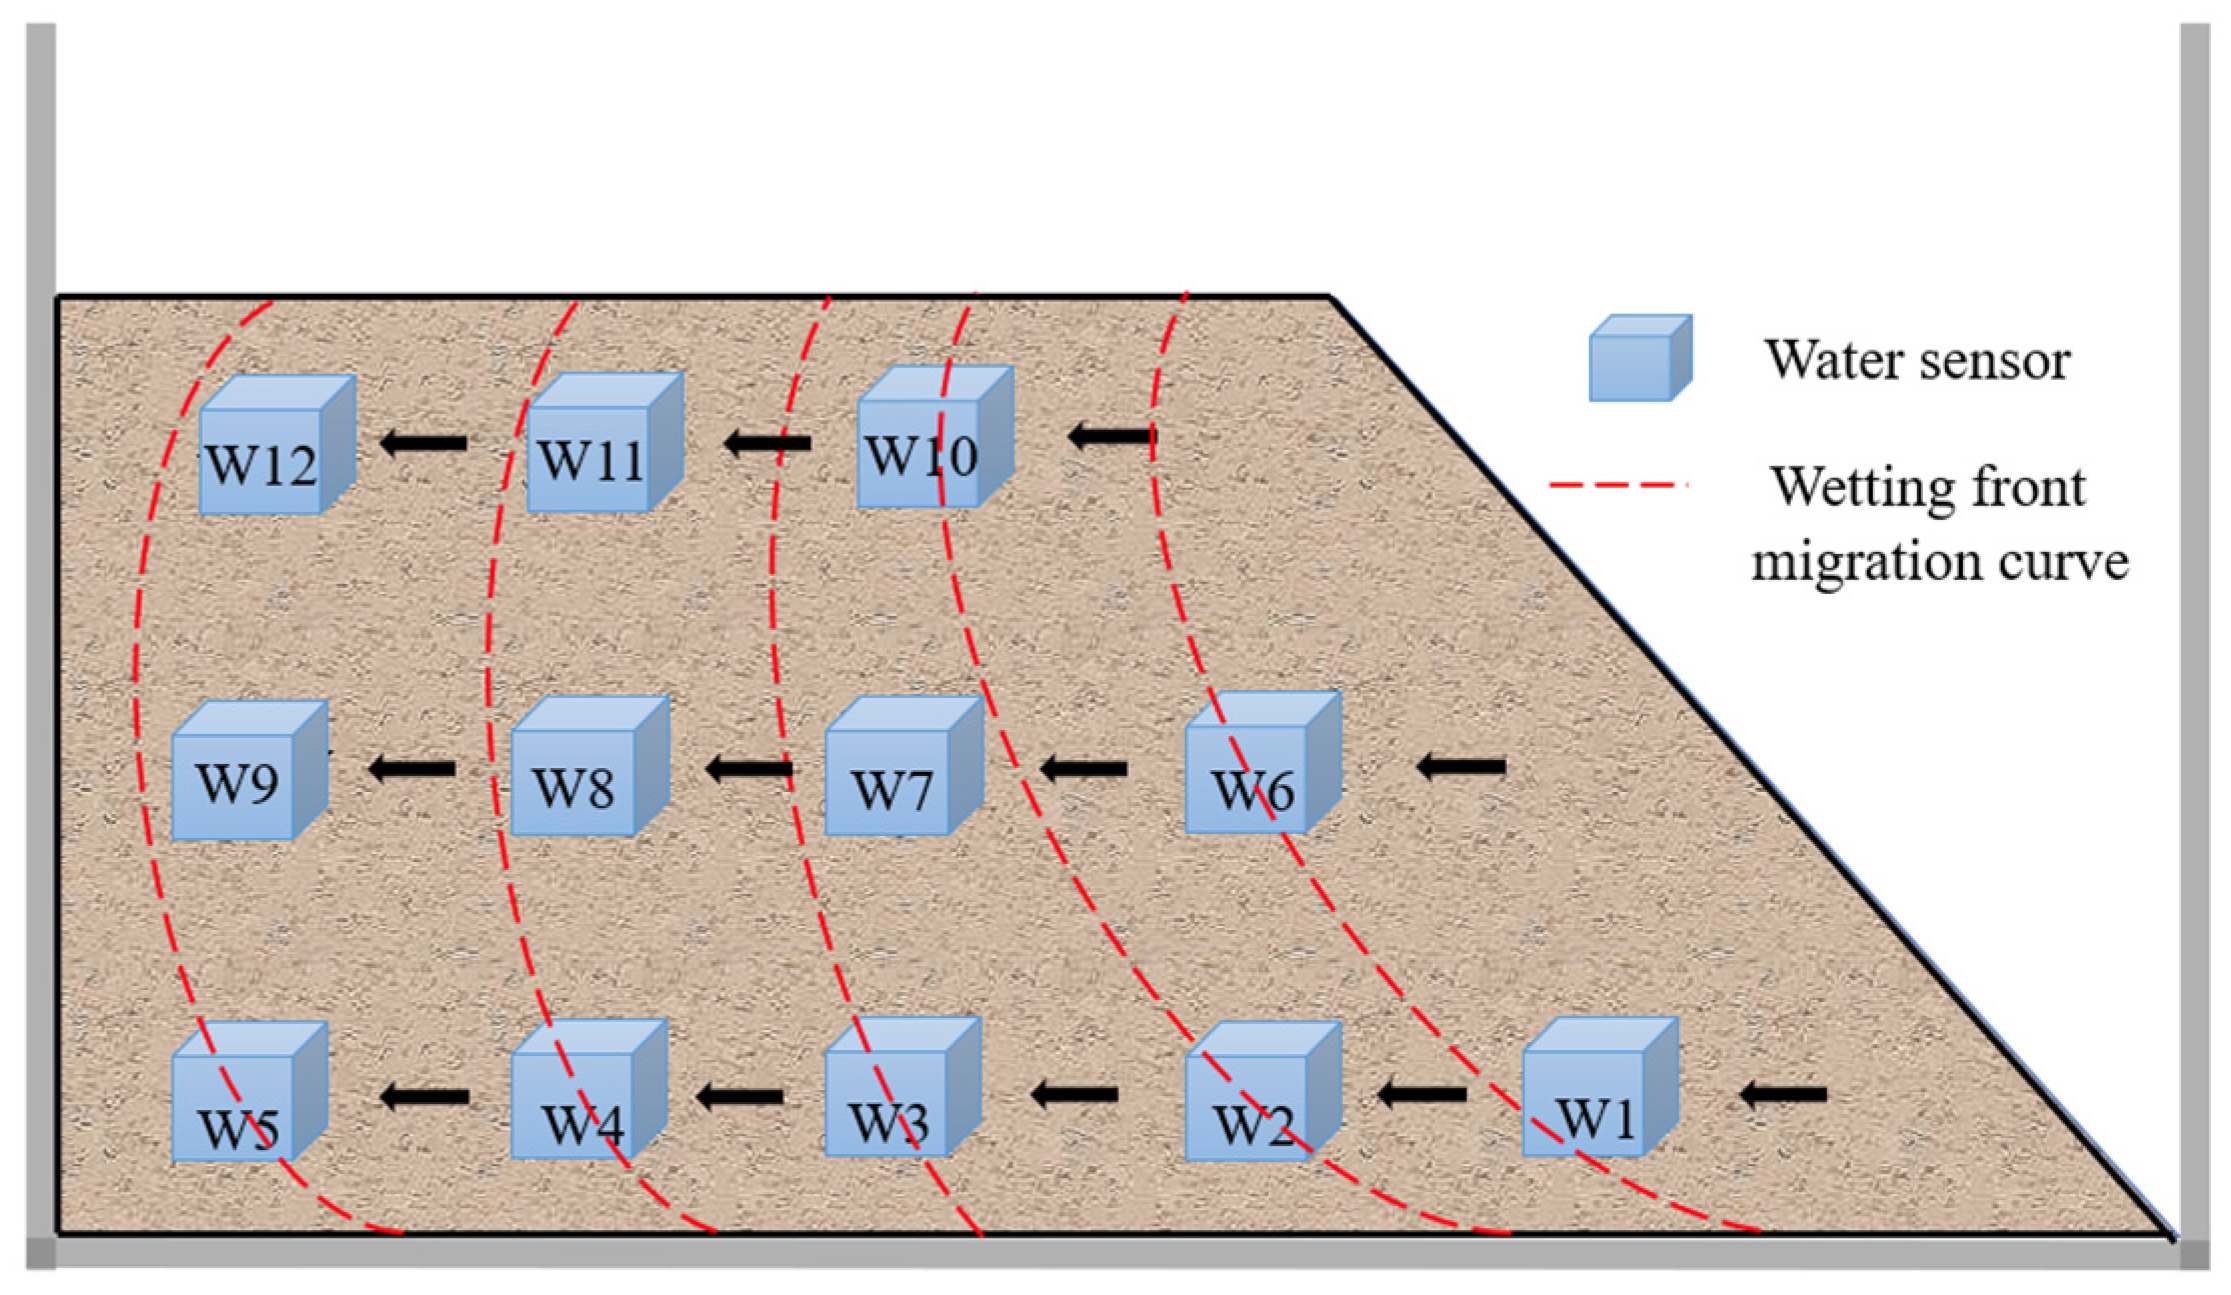
3.2. Extreme Rainfall Effect on the Wetting Front
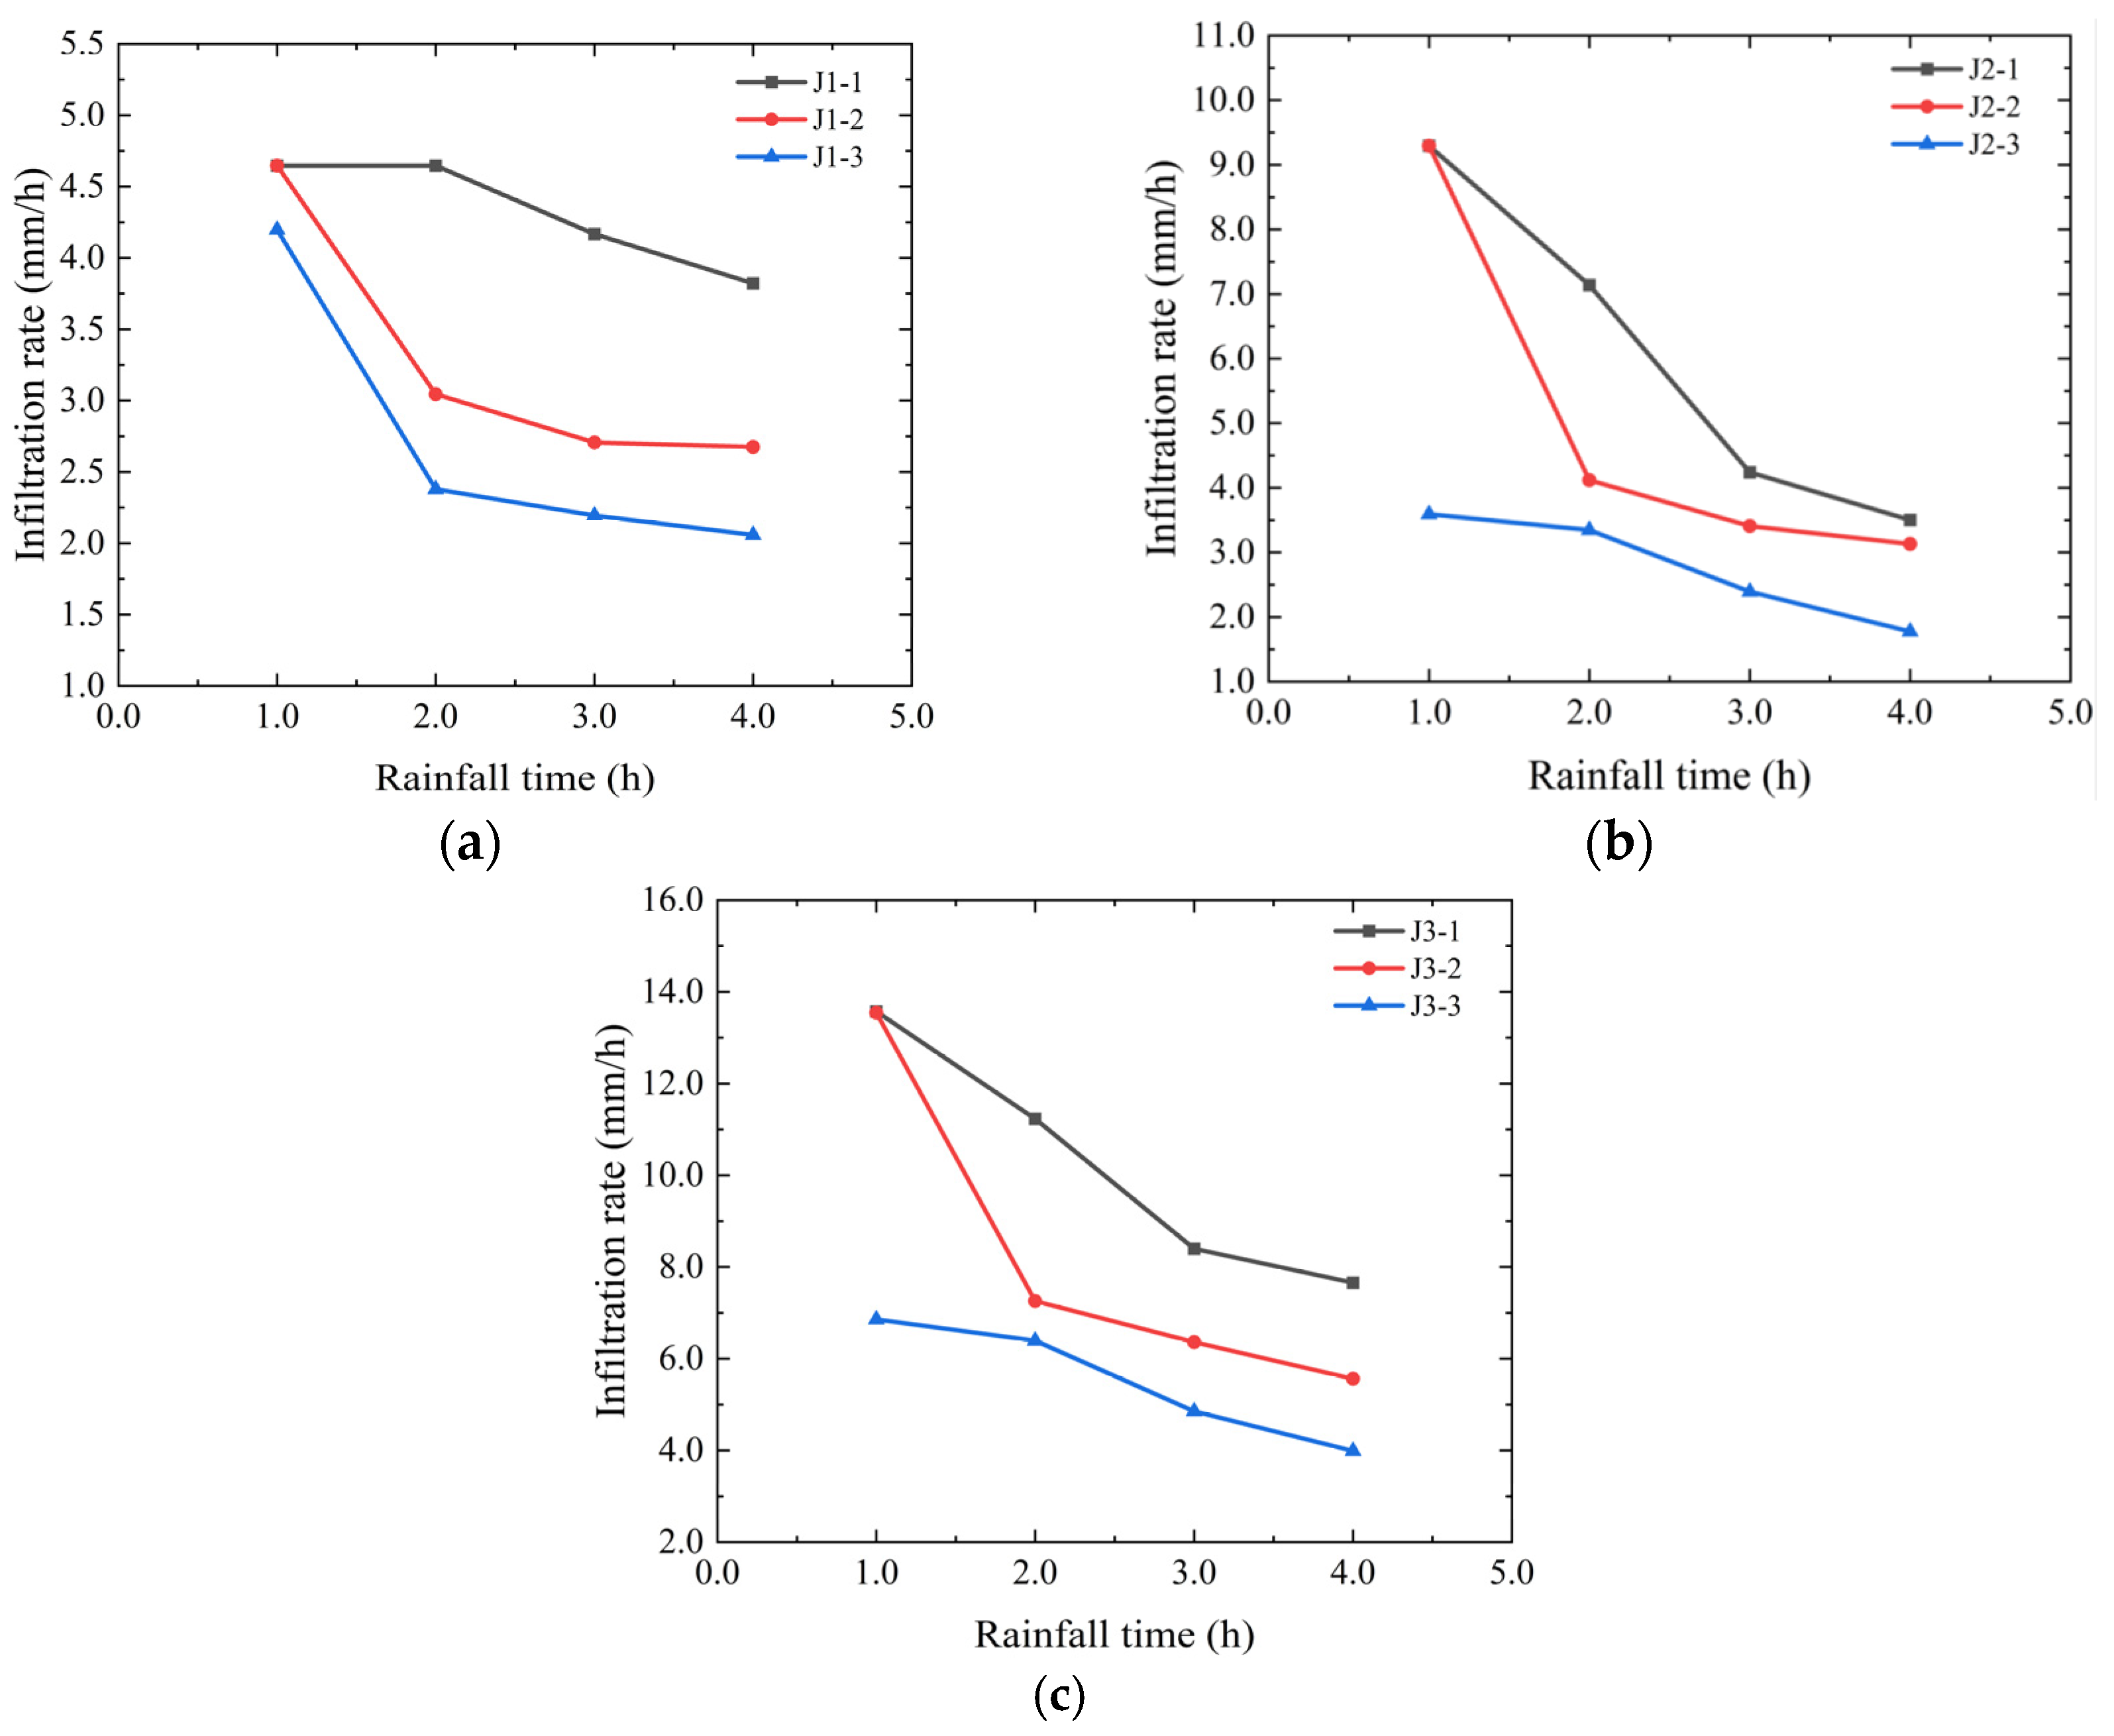
3.3. Extreme Rainfall Effect on Infiltration Rate
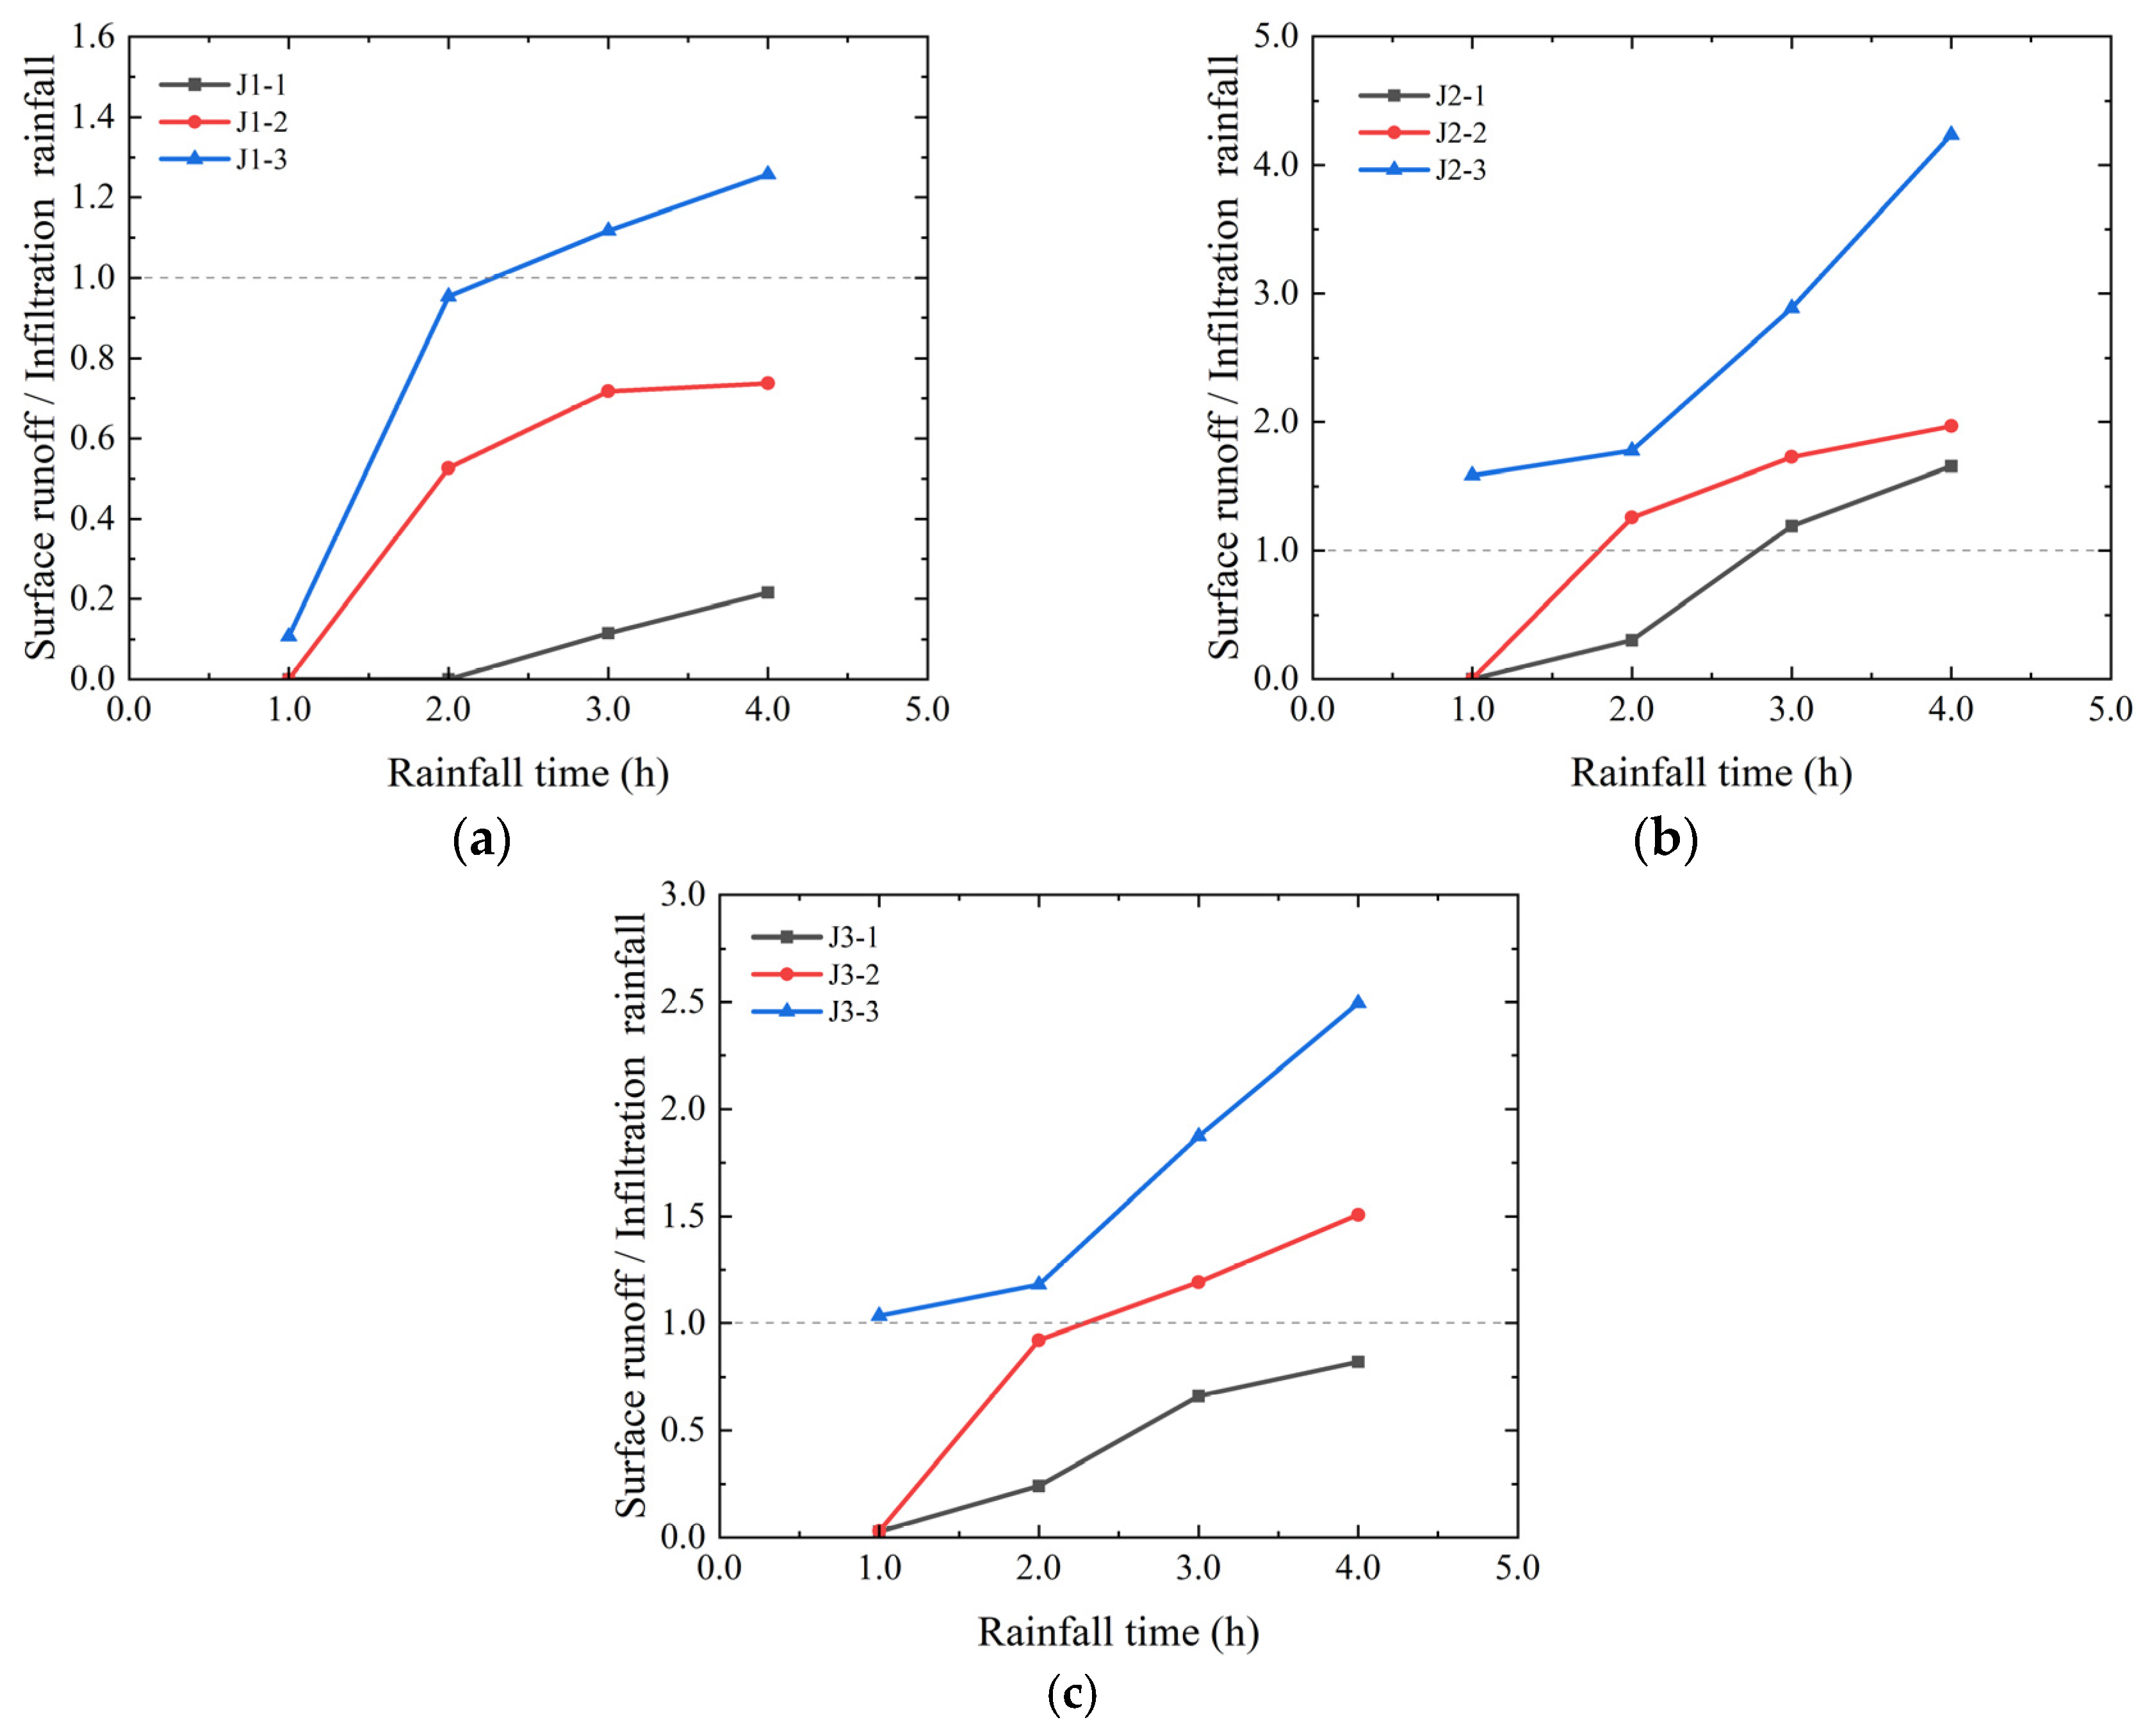
3.4. Extreme Rainfall Effect on the Ratio of Runoff Rainfall to Infiltration Rainfall
4. Lateral Water Migration Model
4.1. Modeling
4.2. Fitting Parameters
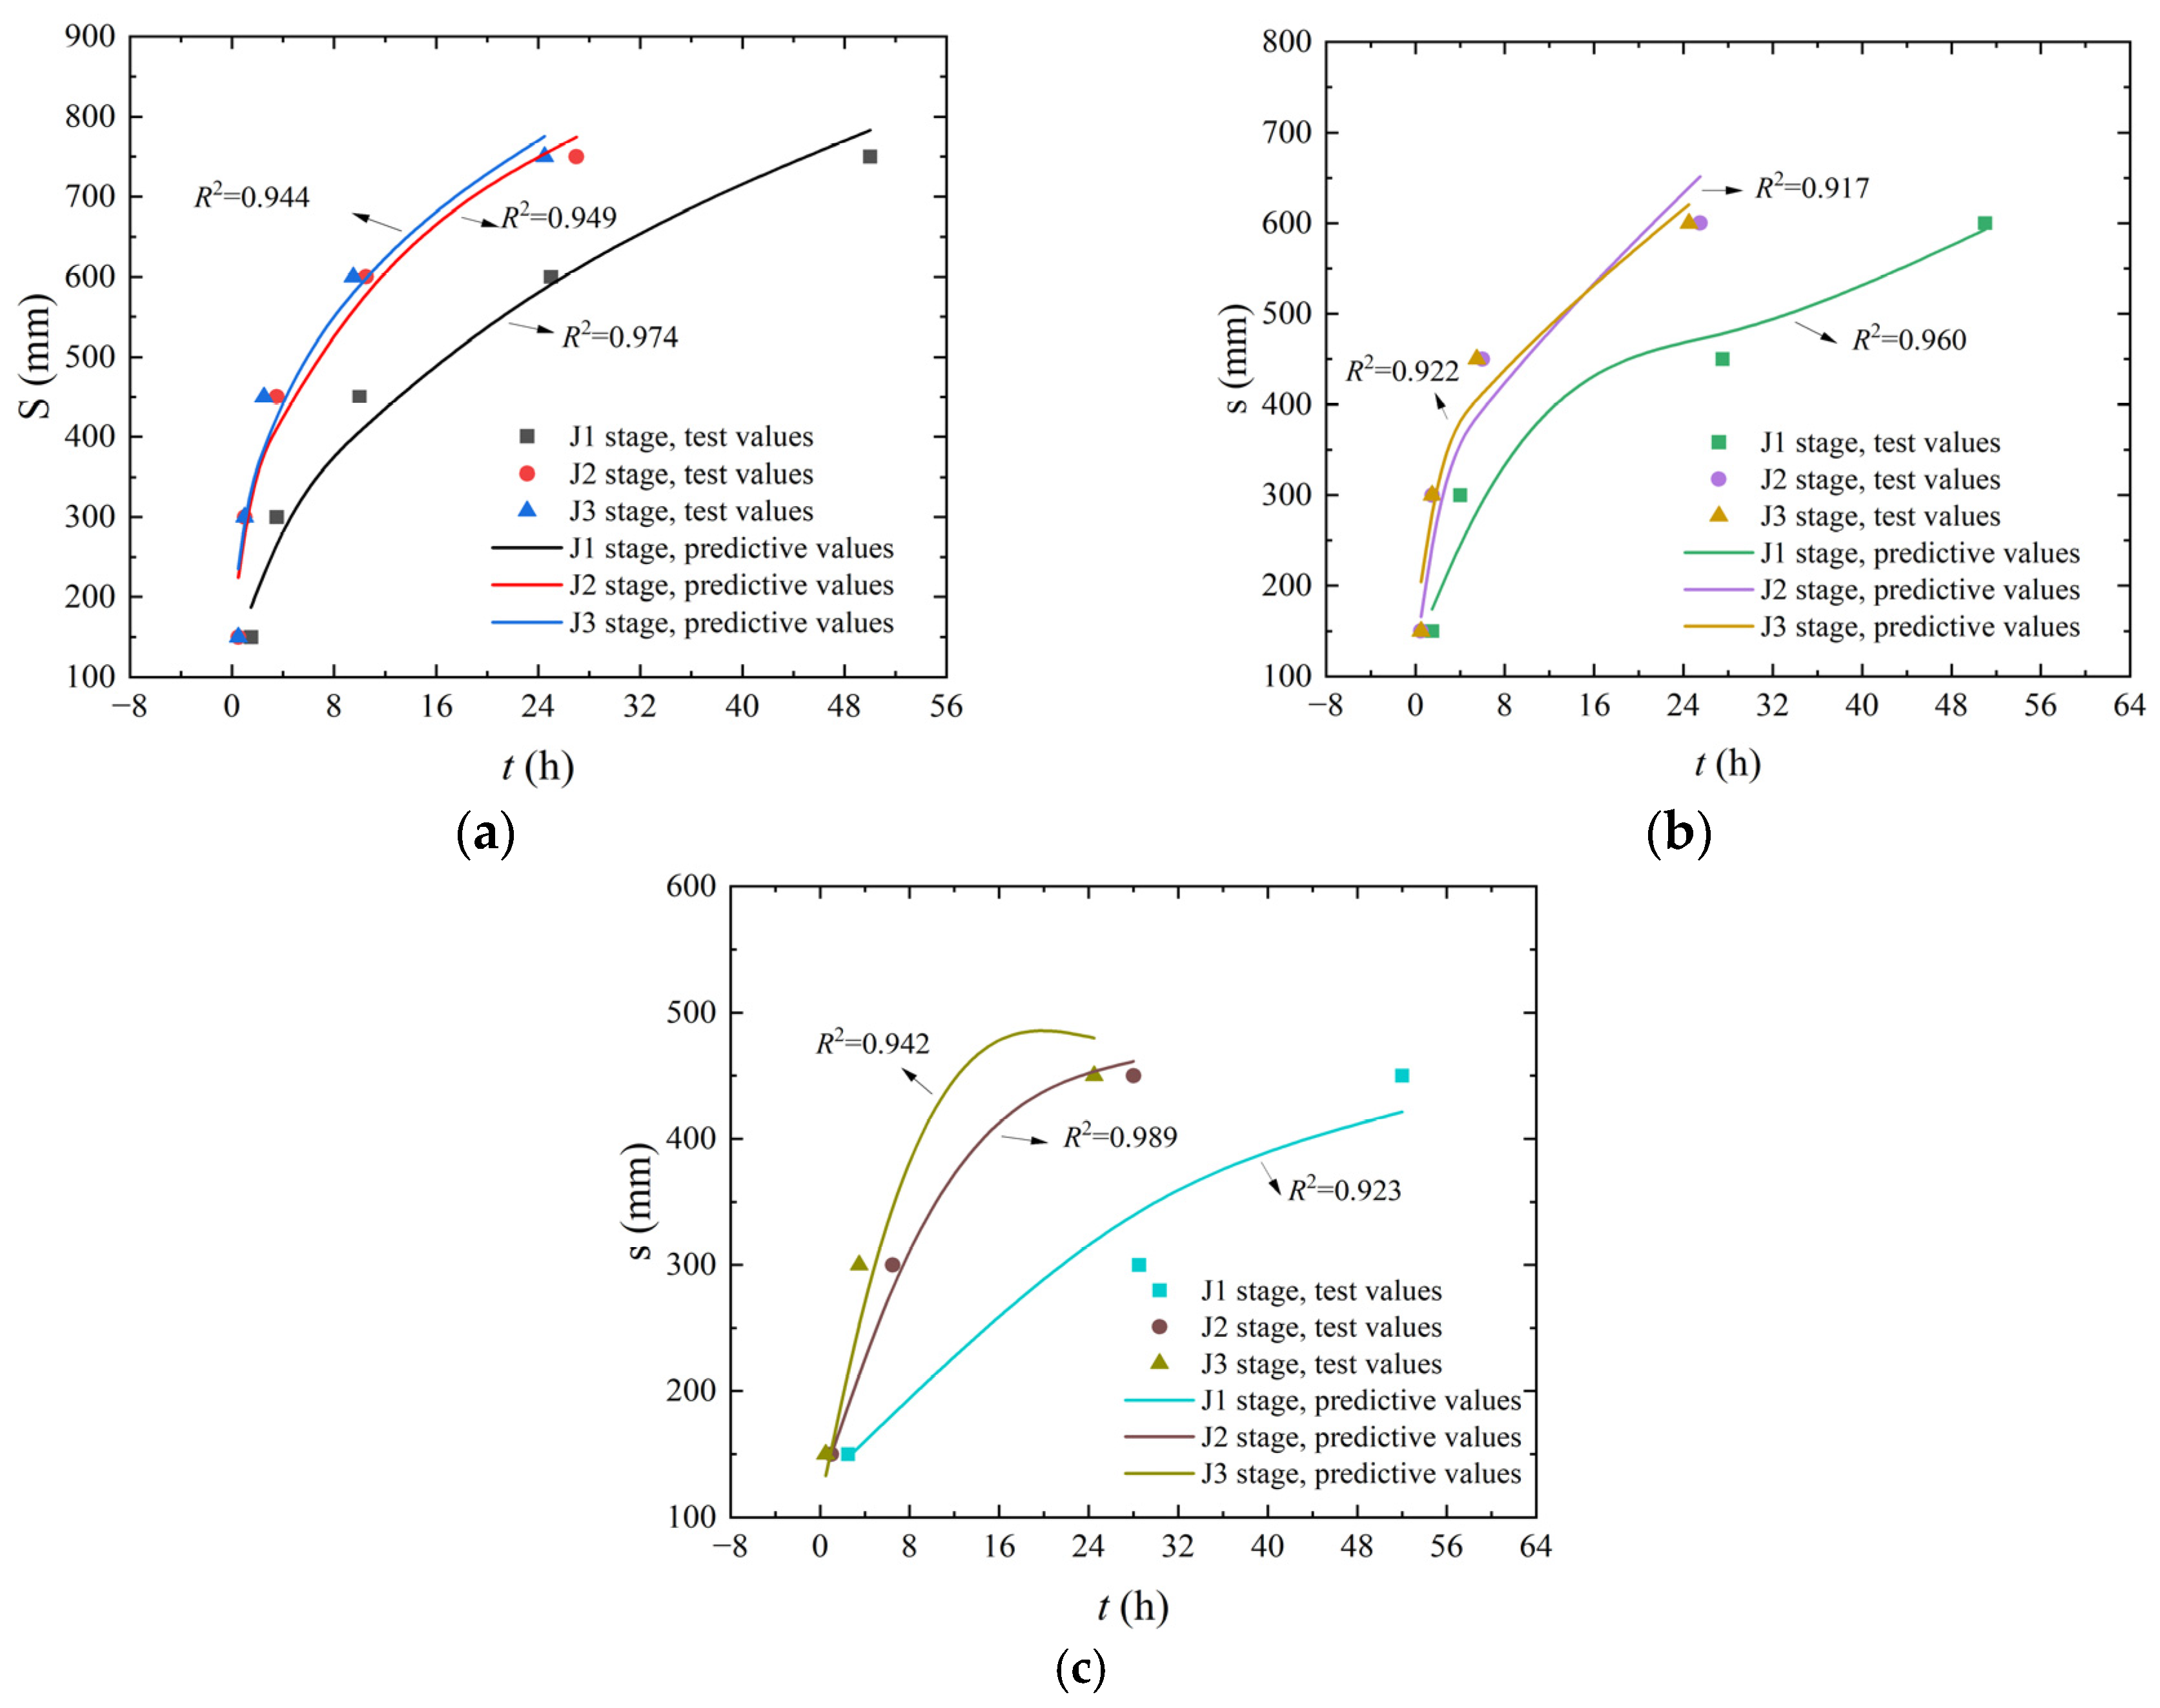
4.3. Model Validation
5. Conclusions
- (1)
- The impact range of a single rainfall event on the soil water content is small. The water content change area continues to expand with the improvement in rainfall intensity and time. The water content increases from the initial value to the peak value, and the peak water content eventually stabilizes at a certain value.
- (2)
- The lateral migration of water has a time hysteresis. The main manifestation is that (a) the sensor closest to the side of the slope changes first, and the water fluctuation is most obvious. The farther the distance, the slower the response and the smaller the fluctuation. (b) Multiple rainfall events have a significant influence on the soil water content far from the slope compared to a single rainfall event. At the same location, there is a situation where the peak water content occurs after the rain stops.
- (3)
- Sensors with the same depth but different positions start to change at different times. This indicated that the horizontal migration rate of the wetting front is different. The migration rate increases with the increase in rainfall intensity. The migration rate of sensor W3 increased by 66.47% and 333.70%, respectively, in the J3 stage compared to the J2 and J1 stages. The horizontal migration rate in the middle and slope toe is higher. The lowest is the slope top.
- (4)
- The infiltration rate gradually decreases and the ratio of surface runoff to infiltration rainfall increases with the increase in rainfall frequency and intensity. As the times of rainfall increase, the time when surface runoff begins to appear becomes earlier and earlier.
- (5)
- A lateral water migration model was proposed and validated. The predicted results of the model are in good agreement with the test, with R2 over 0.90. This indicated that the model was suitable for simulating the development of a lateral water migration model in the subgrade under different working conditions.
- (6)
- In the future, the lateral water migration trend in compacted loess subgrade under extreme rainfall will be further studied using numerical simulation methods.
Author Contributions
Funding
Institutional Review Board Statement
Informed Consent Statement
Data Availability Statement
Conflicts of Interest
References
- Huang, L.M.; Shao, M.A. Advances and Perspectives on Soil Water Research in China’s Loess Plateau. Earth Sci. Rev. 2019, 199, 102962. [Google Scholar] [CrossRef]
- Li, Y.R.; Shi, W.H.; Aydin, A.; Beroya-Eitner, M.A.; Gao, G.H. Loess Genesis and Worldwide Distribution. Earth Sci. Rev. 2020, 201, 102947. [Google Scholar] [CrossRef]
- Assadi-Langroudi, A.; Ng’Ambi, S.; Smalley, I. Loess as a Collapsible Soil: Some Basic Particle Packing Aspects. Quat. Int. 2017, 469, 20–29. [Google Scholar] [CrossRef]
- Zhao, L.Q.; Ma, P.H.; Peng, J.B.; Mu, Q.Y.; Leng, Y.Q.; Zhu, X.H.; Jia, Z.J.; Zhao, J.Y.; He, Z.Y.; Huo, B.Y.; et al. Genesis, Characteristic and Disaster Effects of Loess Meso-interfaces: A Field Geological Investigation. Catena 2025, 251, 108804. [Google Scholar] [CrossRef]
- Zhao, W.H.; Yang, X.J.; Wang, B.Z.; Fan, H.H.; Meng, M.Q.; Zhou, Z. Laws of Water Migration and Settlement at Interface in Loess Filled Areas under Rainfalls. Chin. J. Geotech. Eng. 2022, 44, 1710–1720. [Google Scholar]
- Zhang, C.J.; Zhang, S.Q.; Ning, H.F. Trends of Extreme Weather and Climate Events in China in Recent 60 Years and their Characteristics in 2023. J. Arid. Meteorol. 2024, 42, 536–552. [Google Scholar]
- Liu, L.P. Waterproof and Drainage Diseases of Subgrade and its Prevention Measures in Loess Donga. Appl. Mech. Mater. 2013, 353, 877–880. [Google Scholar] [CrossRef]
- Chen, J.Z.; Xie, C.Y.; Zhang, W.T.; Fu, C.; Shen, J.B.; Yang, B.I.; Li, H.N.; Shi, D.P. Bibliometric Network Analysis. Sustainability 2025, 17, 4176. [Google Scholar] [CrossRef]
- Tang, K.J.; Liu, D.D.; Xie, S.H.; Qiu, J.I.; Lai, J.X.; Liu, T.; Fang, Y. Analysis of Loess Water Migration Regularity and Failure Response of Tunnel Structure under Rainfall Environment. Bull. Eng. Geol. Environ. 2024, 83, 251. [Google Scholar] [CrossRef]
- Zhang, S.B.; Han, T.I.; Lu, Y.N.; Huang, C.Z.; Zhao, P. Experimental Study of Water Migration Characteristics in Compacted Loess Subjected to Rainfall Infiltration. PLoS ONE 2022, 17, e0274265. [Google Scholar] [CrossRef] [PubMed]
- Liu, Z.Z.; Yan, Z.X.; Qiu, Z.H.; Wang, X.G.; Li, J.W. Stability Analysis of an Unsaturated Soil Slope Considering Rainfall Infiltration Based on the Green-Ampt Model. J. Mt. Sci. 2020, 17, 2577–2590. [Google Scholar] [CrossRef]
- Sun, P.; Wang, H.J.; Wang, G.; Li, R.J.; Zhang, Z.; Huo, X.T. Field Model Experiments and Numerical Analysis of Rainfall-induced Shallow Loess Landslides. Eng. Geol. 2021, 295, 106411. [Google Scholar] [CrossRef]
- Zhang, C.L.; Li, T.L.; Li, P. Rainfall Infiltration in Chinese Loess by in Situ Observation. J. Hydrol. Eng. 2014, 19, 06014002. [Google Scholar] [CrossRef]
- Lin, G.C.; Chen, W.W.; Liu, P.; Liu, W. Experimental Study of Water and Salt Migration in Unsaturated Loess. Hydrogeol. J. 2019, 27, 171–182. [Google Scholar] [CrossRef]
- Xu, J.; Wang, S.H.; Wang, Z.Q.; Jin, L.; Yuan, J. Heat Transfer and Water Migration in Loess Slopes during Freeze–thaw Cycling in Northern Shaanxi, China. Int. J. Civ. Eng. 2018, 16, 1591–1605. [Google Scholar] [CrossRef]
- Ren, X.C.; Sun, W.F.; Lan, H.X.; Bao, H.; Li, L.P.; Liu, S.J.; Yan, C.G.; Wang, X.C.; Li, Z.C.; Tian, C.Y. Influence of Tension Cracks on Moisture Infiltration in Loess Slopes under High-intensity Rainfall Conditions. Sci. Rep. 2025, 15, 4488. [Google Scholar] [CrossRef] [PubMed]
- Shen, J.X.; Zhao, B.C.; Wang, T.Y.; Dong, J.Y.; Wang, B.B.; Zhao, Z.Q.; Ge, Y.; Zhou, H.Y. Experimental Research on the Infiltration of Undisturbed Loess Soil Column due to Heavy Rainfall. South North Water Transf. Water Sci. Technol. 2025, 1, 1–12. [Google Scholar]
- Mane, S.; Singh, G.; Das, N.N.; Nagpal, N.; Cosh, M.; Kanungo, A.; Dong, Y. Development of Low-cost Handheld Soil Moisture Sensor for Farmers and Citizen Scientists. Front. Environ. Sci. 2025, 13, 1590662. [Google Scholar] [CrossRef]
- Zheng, C.L.; Li, R.J.; Guan, X.D.; Zhang, S.B.; Bai, W.S. Experimental Study on Rainfall Infiltration Characteristics of Loess Slopes under Different Rainfall Intensities. Chin. J. Geotech. Eng. 2020, 42, 111–115. [Google Scholar]
- JTG/D30-2015; Specifications for Design of Highway Subgrades. Ministry of Transport of the People’s Republic of China: Beijing, China, 2015.
- Guan, X.D.; Li, R.J.; Pan, J.Y.; Sun, P.; Yao, Y.F. Testing and Comparison of Heavy Rainfall Infiltration of Loess Slope at Different Slope Ratios. J. Xi’an Univ. Technol. 2021, 37, 286–294. [Google Scholar]
- GB/T50123-2019; Standard for Geotechnical Testing Method. Construction Ministry of PRC: Beijing, China, 2019.
- Shen, Q.; Zhang, Y.D.; Yan, Y.; Dong, H.Y.; Lei, W.K. Experimental Study on Infiltration Characteristics of Shallow Rainwater in Expansive Soil Slopes at Different Gradients. Water 2025, 17, 642. [Google Scholar] [CrossRef]
- Wu, B.; Zhang, G.R.; Chi, C.; Kong, Y.; Li, D.H.; Ding, Y. Physical Model Study on the Bank Slope of Thick Sandy Soil under Rainfall. Hydro-Sci. Eng. 2023, 1, 113–122. [Google Scholar]
- Du, Y.E.; Hou, J.M.; Chai, J.; Bai, G.B.; Li, X.; Zhang, H.F.; Zhang, Z.A.; Chen, G.Z.; Li, B.Y. Temporal Variation Characteristics of Precipitation Extremes in Xi’an. Environ. Eng. 2022, 40, 41–46. [Google Scholar]
- Sun, X.; Wei, N.; Wang, S.G.; Jang, C.Y.; Wang, J. Study of the Daily Variation of Summer Precipitation in Xi’an. J. Glaciol. Geocryol. 2013, 35, 1176–1182. [Google Scholar]
- Hou, J.M.; Kang, Y.D.; Li, X.; Chen, G.Z.; Luo, H.; Bai, G.B.; Xu, B.; Gao, X.J.; Kong, X.J. Analysis and Countermeasures of Inundation Caused by Heavy Rain in Xi’an. J. Xi’an Univ. Technol. 2020, 3, 1006–4710. [Google Scholar]
- Zhang, G.J.; Cao, M.; Qiu, N.; Gao, S. Spatial and Temporal Variation Characteristics of Precipitation in Xi’an City in Past 50 Years. Acta Agric. Jiangxi 2022, 34, 126–130. [Google Scholar]
- Wang, X.J.; Jiang, R.G.; Xie, J.C.; Zhao, Y. Study on the Variation Characteristics and Driving Mechanism of Precipitation during Flood Season in Xi’an City. J. Nat. Disasters 2020, 29, 138–148. [Google Scholar]
- Hou, L.J.; Wang, Y.; Shen, F.C.; Lei, M.; Wang, X.; Zhao, X.C.; Gao, S.L.; Alhaj, A. Study on Variation of Surface Runoff and Soil Moisture Content in the Subgrade of Permeable Pavement Structure. Adv. Civ. Eng. 2020, 2020, 8836643. [Google Scholar] [CrossRef]
- Liu, M.; Zhou, Y.L. The Characteristics of Water Infiltration in Loess Foundation Were Studied by TDR Moisture Meter. Chin. J. Undergr. Space. Eng. 2019, 15, 817–824. [Google Scholar]
- Wen, G.J.; Deng, W.J.; Liao, P.W. Characteristics Study on Moisture Migration in Soil Slope under Rainfall. J. Chongqing Jiaotong Univ. (Nat. Sci.) 2013, 32, 63–74. [Google Scholar]
- Timsina, R.C. Richards Equation for the Assessment of Landslide Hazards. Bibechana 2025, 22, 30–40. [Google Scholar] [CrossRef]
- Yue, J.W.; Zhang, S.J.; Wang, Z.F.; Xing, X.X.; Yue, M.G.; Lu, J.; Xu, S.P. Rainfall Infiltration Characteristics and Stability Analysis of Rammed Earth City Walls based on Richards Equation. J. Cult. Herit. 2025, 74, 106–119. [Google Scholar] [CrossRef]

| Dry Density (g/cm3) | Maximum Dry Density (g/cm3) | Water Content w (%) | Optimal Water Content (%) | Specific Gravity | Liquid Limit (%) | Plastic Limit (%) | Permeability Coefficient (cm/s) |
|---|---|---|---|---|---|---|---|
| 1.42 | 1.62 | 15.87 | 17.00 | 2.71 | 31.10 | 17.46 | 1.12 × 10⁻⁵ |
| Parameters | Physical Quantity | Dimension | Similarity Relation | Similarity Ratio |
|---|---|---|---|---|
| physical dimension | I | [L] | 15 | |
| permeability coefficient | k | [L][T]−1 | ||
| water content | ω | - | 1 | |
| rainfall intensity | q | [L][T]−1 | ||
| rainfall duration | t | [T] |
| Maximum Dry Density (g/cm3) | Optimal Water Content (%) | Compaction Degree (%) | Slope Ratio | Size (Length × Width × Height) (mm) |
|---|---|---|---|---|
| 1.62 | 17.00 | 92 | 1:1.5 | 950 × 300 × 300 |
| Test Stage | Rainfall Intensity R (mm/h) | Duration of Rainfall D (h) | Duration of Standing S (h) |
|---|---|---|---|
| J1-1 | 4.6478 | 4 | 20 |
| J1-2 | 4.6478 | 4 | 20 |
| J1-3 | 4.6478 | 4 | 20 |
| J2-1 | 9.2951 | 4 | 20 |
| J2-2 | 9.2951 | 4 | 20 |
| J2-3 | 9.2951 | 4 | 20 |
| J3-1 | 13.9427 | 4 | 20 |
| J3-2 | 13.9427 | 4 | 20 |
| J3-3 | 13.9427 | 4 | 20 |
| Number | J1 Stage | J2 Stage | J3 Stage | |||
|---|---|---|---|---|---|---|
| Start Change Time (h) | Rate (mm/s) | Start Change Time (h) | Rate (mm/s) | Start Change Time (h) | Rate (mm/s) | |
| W1 | 1.5 | 2.78 × 10⁻² | 0.5 | 8.33 × 10⁻² | 0.5 | 8.33 × 10⁻² |
| W2 | 3.5 | 2.08 × 10⁻² | 1.0 | 8.33 × 10⁻² | 1.0 | 8.33 × 10⁻² |
| W3 | 10.0 | 6.41 × 10⁻³ | 3.5 | 1.67 × 10⁻² | 2.5 | 2.78 × 10⁻² |
| W4 | 25 | 2.78 × 10⁻³ | 10.5 | 5.96 × 10⁻³ | 9.5 | 5.96 × 10⁻³ |
| W5 | 50.0 | 1.67 × 10⁻³ | 27.0 | 2.53 × 10⁻³ | 24.5 | 2.78 × 10⁻³ |
| W6 | 1.5 | 2.78 × 10⁻² | 0.5 | 8.33 × 10⁻² | 0.5 | 8.33 × 10⁻² |
| W7 | 4.0 | 1.67 × 10⁻² | 1.5 | 4.17 × 10⁻² | 1.5 | 4.17 × 10⁻² |
| W8 | 27.5 | 1.77 × 10⁻³ | 6.0 | 9.26 × 10⁻³ | 5.5 | 1.04 × 10⁻² |
| W9 | 51.0 | 1.77 × 10⁻³ | 25.5 | 2.14 × 10⁻³ | 24.5 | 2.19 × 10⁻³ |
| W10 | 2.5 | 1.67 × 10⁻² | 1.0 | 4.16 × 10⁻² | 0.5 | 8.33 × 10⁻² |
| W11 | 28.5 | 2.63 × 10⁻³ | 6.5 | 7.58 × 10⁻³ | 3.5 | 1.39 × 10⁻² |
| W12 | 52.0 | 1.74 × 10⁻³ | 28.0 | 1.94 × 10⁻³ | 24.5 | 1.98 × 10⁻³ |
| Layer | Parameters | Fit Degree | ||
|---|---|---|---|---|
| α | β | γ | R2 | |
| L1 | 67.500 | 0.328 | 0.408 | 0.915 |
| L2 | 55.800 | 0.315 | 0.348 | 0.908 |
| L3 | 63.200 | 0.285 | 0.338 | 0.896 |
Disclaimer/Publisher’s Note: The statements, opinions and data contained in all publications are solely those of the individual author(s) and contributor(s) and not of MDPI and/or the editor(s). MDPI and/or the editor(s) disclaim responsibility for any injury to people or property resulting from any ideas, methods, instructions or products referred to in the content. |
© 2025 by the authors. Licensee MDPI, Basel, Switzerland. This article is an open access article distributed under the terms and conditions of the Creative Commons Attribution (CC BY) license (https://creativecommons.org/licenses/by/4.0/).
Share and Cite
Hua, X.; Xi, Y.; Li, G.; Kou, H. Study on Lateral Water Migration Trend in Compacted Loess Subgrade Due to Extreme Rainfall Condition: Experiments and Theoretical Model. Sustainability 2025, 17, 6761. https://doi.org/10.3390/su17156761
Hua X, Xi Y, Li G, Kou H. Study on Lateral Water Migration Trend in Compacted Loess Subgrade Due to Extreme Rainfall Condition: Experiments and Theoretical Model. Sustainability. 2025; 17(15):6761. https://doi.org/10.3390/su17156761
Chicago/Turabian StyleHua, Xueqing, Yu Xi, Gang Li, and Honggang Kou. 2025. "Study on Lateral Water Migration Trend in Compacted Loess Subgrade Due to Extreme Rainfall Condition: Experiments and Theoretical Model" Sustainability 17, no. 15: 6761. https://doi.org/10.3390/su17156761
APA StyleHua, X., Xi, Y., Li, G., & Kou, H. (2025). Study on Lateral Water Migration Trend in Compacted Loess Subgrade Due to Extreme Rainfall Condition: Experiments and Theoretical Model. Sustainability, 17(15), 6761. https://doi.org/10.3390/su17156761