Article

Enhanced Recognition of Sustainable Wood Building Materials Based on Deep Learning and Augmentation

1
School of Design, Huazhong University of Science and Technology, Wuhan 430074, China
2
School of Architecture and Urban Planning, Huazhong University of Science and Technology, Wuhan 430074, China
3
Architecture and Urban Planning Design and Research Institute of Huazhong University of Science and Technology Co., Ltd., Wuhan 430074, China
4
National Center of Technology Innovation for Digital Construction, Wuhan 430074, China
*
Author to whom correspondence should be addressed.
Sustainability 2025, 17(15), 6683; https://doi.org/10.3390/su17156683
Submission received: 1 June 2025 / Revised: 6 July 2025 / Accepted: 17 July 2025 / Published: 22 July 2025
(This article belongs to the Special Issue Analysis on Real-Estate Marketing and Sustainable Civil Engineering)

Abstract

The accurate identification of wood patterns is critical for optimizing the use of sustainable wood building materials, promoting resource efficiency, and reducing waste in construction. This study presents a deep learning-based approach for enhanced wood material recognition, combining EfficientNet architecture with advanced data augmentation techniques to achieve robust classification. The augmentation strategy incorporates geometric transformations (flips, shifts, and rotations) and photometric adjustments (brightness and contrast) to improve dataset diversity while preserving discriminative wood grain features. Validation was performed using a controlled augmentation pipeline to ensure realistic performance assessment. Experimental results demonstrate the model’s effectiveness, achieving 88.9% accuracy (eight out of nine correct predictions), with further improvements from targeted image preprocessing. The approach provides valuable support for preliminary sustainable building material classification, and can be deployed through user-friendly interfaces without requiring specialized AI expertise. The system retains critical wood pattern characteristics while enhancing adaptability to real-world variability, supporting reliable material classification in sustainable construction. This study highlights the potential of integrating optimized neural networks with tailored preprocessing to advance AI-driven sustainability in building material recognition, contributing to circular economy practices and resource-efficient construction.

1. Introduction

The accurate identification and classification of wood patterns play a critical role in sustainable material utilization, quality control in automated manufacturing, and environmental conservation through optimized resource allocation. Traditional wood pattern analysis has relied on manual inspection or basic computational methods such as texture tiling and patch-based synthesis [1]. These approaches suffer from three fundamental limitations: (1) dependence on subjective human expertise, (2) inability to capture the anisotropic and non-stationary nature of natural wood patterns, and (3) poor scalability for industrial applications. The growing demand for precision in applications ranging from sustainable construction to circular economy practices in furniture manufacturing has further exposed these methodological shortcomings [2].
The advent of deep learning has revolutionized material pattern recognition, with convolutional neural networks (CNNs) demonstrating remarkable success in feature extraction and classification tasks [3]. However, current implementations face two critical challenges: (1) the requirement for large, meticulously labeled datasets that are costly to produce, and (2) limited generalization capability when confronted with the natural variability of wood patterns in real-world sustainable material applications [4]. Recent studies have highlighted data augmentation as a potential solution to these limitations [5], yet systematic approaches combining optimized network architectures with physics-aware augmentation strategies remain underexplored in the context of sustainable material science.

1.1. Wood Identification Approaches

The field of wood identification has evolved significantly from manual inspection to advanced machine-based methods, with each approach offering distinct advantages and limitations for sustainable material management. Traditional manual identification relied on expert analysis of macroscopic features (grain patterns and growth rings) and microscopic characteristics (vessel distribution and fiber ratios) [6]. While foundational, these methods were inherently subjective, particularly problematic for distinguishing endangered species in sustainable forestry applications, and proved too labor-intensive for industrial-scale material sorting [7].
To improve efficiency, dichotomous key systems were developed, such as the table-based retrieval approach by Wang et al. [8]. These systems streamlined identification through stepwise feature comparison, reducing identification time by approximately 40% compared to visual inspection. However, they required extensive manual database creation, continuous updates for new species, and specialized operator training—factors that limited their practicality in high-volume sustainable forestry operations.
Molecular techniques like DNA analysis marked a breakthrough in species-level identification through xylem cell extraction [9]. Deguilloux’s [10] demonstration of viable DNA extraction from dried wood opened new possibilities for forensic timber tracing and sustainable sourcing certification. Despite this potential, adoption barriers remain significant, including multi-day processing times, costs exceeding USD 150 per sample, and high failure rates (30–40%) for processed wood samples—challenges that hinder widespread implementation in supply chain monitoring.
Chemical profiling methods such as GC-MS [11] and HPLC fingerprinting [12] offered complementary approaches, achieving 85–92% accuracy for common species through analysis of volatile compounds and extractives. While valuable for research, these destructive sampling methods show reduced performance for chemically similar species and require large reference databases. Modified chemical tests validated by the IAWA (foam, ash combustion) provide rapid field alternatives, though their empirical nature calls for further theoretical validation.
Non-destructive evaluation technologies including NIR spectroscopy [13], X-ray tomography, and ultrasound have gained prominence for industrial applications. These approaches enable mechanical property prediction and defect detection with 80–90% accuracy but remain sensitive to environmental conditions like moisture content (±15% error) and require costly equipment (USD 20,000–50,000), limiting accessibility for smaller sustainable forestry operations.
Most recently, computational image analysis has emerged to address scalability challenges through techniques like Fourier transform texture analysis [14] and multiscale pattern recognition [15]. While automating the identification process, current implementations achieve only 60–75% accuracy for complex tropical woods and remain highly sensitive to imaging conditions. This methodological progression highlights the critical need for robust, scalable identification systems that can support growing demands for sustainable material verification while overcoming the limitations of existing approaches (Table 1).

1.2. Machine Learning-Assisted Wood Recognition Approaches

Recent advances in machine learning, particularly deep learning (DL), have emerged as powerful solutions to overcome the limitations of traditional wood identification methods. These techniques offer significant improvements in automation, accuracy, and operational efficiency while reducing long-term costs [16]. Among various approaches, convolutional neural networks (CNNs) have become particularly prominent for wood identification due to their ability to automatically extract and classify features from large image datasets [17]. Notable implementations include Fabijańska’s work, achieving 98.7% accuracy in identifying 14 European tree species using ResNet-50 and DenseNet-121 architectures [18], and Poyatos’ enhancement of texture recognition through innovative data augmentation and voting mechanisms [19]. Zielinski’s study fine-tuned pretrained CNNs on a wood dataset from the Democratic Republic of Congo, improving species identification accuracy [20]. While demonstrating impressive results, CNN-based approaches face challenges including substantial computational requirements, sensitivity to data quality, and limited interpretability–factors that can constrain their industrial deployment.
Transfer learning has emerged as an effective strategy to address the data hunger of deep learning models. This approach leverages pretrained networks on large-scale image datasets (e.g., ImageNet) which are then fine-tuned for specific wood recognition tasks [21,22]. Studies such as Ergun’s comparison of DL architectures on the WOOD-AUTH dataset (where Xception achieved superior performance) [23] and Kilic’s WD Detector (demonstrating 99.32% accuracy for defect classification) [24] highlight the potential of this methodology. However, the effectiveness of transfer learning remains contingent on both the quality of the source domain data and the similarity between source and target domains, with performance degradation occurring when these conditions are not met [25].
For real-time applications, YOLO (You Only Look Once) architectures have shown promise [26]. Xi’s SiM-YOLO incorporated a fine-grained convolutional structure (SPD-Conv) to preserve detailed defect information, achieving a 9.3% improvement in mean Average Precision (mAP) over baseline models [27]. Similarly, Wang’s FDD-YOLO enhanced detection accuracy for wood surface defects using high-resolution imaging [28]. Despite these advances, YOLO-based approaches still struggle with precise localization of small defects and maintaining low false positive rates in industrial settings.
The introduction of Transformer architectures has opened new possibilities for handling wood’s complex textural patterns [29]. Ding’s Swin Transformer-based approach demonstrated superior performance in wood segmentation by implementing size- and shape-aware weighting mechanisms, along with optimized feature fusion and loss functions [30]. While effective, these models present practical challenges due to their extensive hyperparameter spaces and substantial computational requirements, potentially limiting their accessibility for some applications.
Multimodal fusion approaches represent another significant advancement, combining complementary data sources such as RGB images and NIR spectra to improve identification robustness [31]. Xi’s framework achieved enhanced accuracy by employing CNNs to extract and combine features from both modalities [32]. However, these methods often require complex preprocessing pipelines and careful manual feature engineering, increasing implementation complexity [33,34].
Building upon these developments, our study proposes an integrated solution combining EfficientNet’s advanced architecture with optimized data preprocessing. EfficientNet’s compound scaling strategy—which systematically balances network depth, width, and input resolution [35]—offers distinct advantages for wood recognition. First, its adaptive scaling enables deployment across diverse hardware platforms while maintaining compact model sizes [36]. Second, the architecture’s inherent generalization capabilities, facilitated by multi-scale feature fusion, prove particularly valuable for handling real-world variations in wood samples, including species diversity, imaging conditions, and potential image quality issues [37]. These characteristics position EfficientNet as an ideal foundation for developing practical, high-performance wood recognition systems that address both accuracy and efficiency requirements in industrial applications.

1.3. Summary

Existing wood identification methods face three critical challenges that limit their practical application in sustainable building material management. First, traditional approaches relying on manual inspection or database matching prove fundamentally inefficient, requiring extensive expert involvement and becoming impractical for industrial-scale operations. These methods lack the scalability needed to handle the growing diversity and volume of wood materials in modern construction workflows. Second, while deep learning models like CNNs have shown promise, they often struggle with generalization across wood species and patterns—a limitation exacerbated by real-world variations in imaging conditions, surface textures, and environmental factors [36]. Third, the field has yet to fully exploit advanced neural architectures and systematic augmentation strategies. Despite EfficientNet’s proven effectiveness in other domains, its application to wood pattern recognition remains underexplored, as does the potential of comprehensive data augmentation to enhance model robustness.
To address these limitations, we present an integrated deep learning framework specifically designed for wood pattern recognition in sustainable building material applications. In addition to addressing technological challenges in wood identification, this study aims to promote sustainability in construction and forestry sectors. Accurate material classification supports more efficient resource utilization, reduces the environmental impact of unnecessary processing or discarding of wood, and facilitates compliance with regulations intended to protect endangered species. By reducing waste and optimizing the use of renewable resources, the proposed approach aligns closely with circular economy principles and global efforts to mitigate climate change.

2. Methodology

This study presents an advanced wood pattern recognition system that combines a custom-developed data augmentation pipeline with the EfficientNet architecture to achieve superior classification performance. Unlike conventional implementations that rely solely on built-in augmentation functions, our framework introduces an independent preprocessing module specifically optimized for wood texture analysis, implemented through a Python-based (version 3.10.7) processing chain (Figure 1). The system architecture comprises four integrated components that work synergistically: (1) data augmentation; (2) image preprocessing; (3) model construction and optimization; and (4) implementation of the prediction function.

2.1. Data Augmentation Strategy for Training Images

Industrial deep learning applications often struggle with limited training data and environmental variability. Guan (2021) showed small datasets reduce EfficientNet’s industrial performance, suggesting GANs as a solution [38]. Ni (2023) found lighting and weather significantly affect EfficientNetV2′s material classification [39].
Our solution uses Python’s Pillow library for data augmentation. We apply brightness (±30%), contrast, and saturation adjustments. Geometric transformations include rotation (±15°), scaling (0.8×−1.2×), and flipping (Equations (1)–(4)). This approach delivers three key benefits. First, it expands training data eightfold without new images. Second, it improves model robustness across lighting and angles. Third, it preserves critical wood textures while adding variability. Compared to GANs, our method is more efficient and avoids synthetic artifacts. Transformations are applied dynamically during training using Pillow’s optimized routines. Each batch has unique variations, creating endless training diversity. The pipeline enhances generalization without quality loss. Figure 2 shows how augmentation integrates seamlessly before the input layer. This maintains original image quality while improving model performance.
I o u t = I i n × P f a c t o r
I o u t = ( I i n M e a n ) × O f a c t o r + M e a n
I o u t = ( 1 U f a c t o r ) × I g r a y + U f a c t o r × I i n
x = x cos θ y sin θ y = x sin θ + y cos θ
In the above equations, Iin and Iout represent the input and output pixel intensities, respectively. Pfactor and Ofactor are coefficients for brightness and contrast adjustment, while Ufactor controls the blending ratio between the input image and a grayscale reference Igray, which may be a fixed value or derived from a reference image. Mean denotes the average pixel intensity. The coordinates (x, y) and (x′, y′) refer to the original and rotated pixel positions, with θ indicating the rotation angle in radians.

2.1.1. Geometric and Photometric Augmentation for Feature Diversity

Data augmentation is a critical technique for improving the generalization capability of deep learning models, particularly in scenarios with limited training data. Our augmentation strategy applies stochastic transformations to input images, artificially expanding the dataset by generating diverse variations of each sample. This approach encourages the model to learn robust and invariant features by exposing it to a wider range of imaging conditions, thereby reducing overfitting and improving performance on unseen data.
The augmentation pipeline consists of three main categories of transformations: geometric, photometric, and noise-based modifications (Figure 3). Geometric transformations alter the spatial properties of an image while preserving its semantic content. These include translation (shifting the image along the x- or y-axis), rotation (applying a random angular displacement), and scaling (resizing the image uniformly). Additionally, horizontal and vertical flipping were applied with probabilities of 50% and 30%, respectively, to simulate mirrored viewpoints. To further enhance variability, elastic deformation (20% probability) was introduced to simulate natural distortions, while perspective transformation (20% probability) adjusted the image’s 3D perspective to mimic different viewing angles.
Photometric transformations modify pixel intensity values to account for variations in lighting and contrast. Brightness adjustment, applied with a 50% probability, randomly scales luminance by ±20% of the original value, simulating different illumination conditions. Similarly, contrast adjustment (±20% range, 50% probability) alters the dynamic range between dark and bright regions, ensuring the model remains invariant to changes in image exposure.
Finally, noise-based augmentations were incorporated to improve the model’s robustness to real-world imperfections. Gaussian blur, applied with a 20% probability, smooths the image using a kernel size ranging from 3 × 3 to 7 × 7, simulating out-of-focus conditions or motion blur. Each transformation was carefully calibrated to maintain the underlying structure of the image while introducing meaningful variability. Together, these augmentations create a more comprehensive training distribution, enhancing the model’s ability to generalize across diverse and previously unseen data.
To address inevitable factors such as perspective, lighting, and orientation changes in the wood grain images captured by customers, this study conducted geometric transformations on the target images to mimic changes in the wood patterns of the captured images. The study utilizes the OpenCV and the Scikit-image libraries in Python to extract the features of the classified wood images and the photos taken by customers. The Structural Similarity Index (SSIM, Equation (5)) is used to calculate the similarity between the two images [40]. Subsequently, multiple variants are generated by performing geometric transformations on the original image. By comparing these variants with the target image again, it was found that the similarity of the images significantly increased (Figure 4).
S S I M ( x , y ) = ( 2 μ x μ y + C 1 ) ( 2 σ x y + C 2 ) ( μ x 2 + μ y 2 + C 1 ) ( σ x 2 + σ y 2 + C 2 )
where (x, y) denote the two images being compared; μ is the mean pixel intensity within the local calculation window; σ2 is the variance of image x; σXY is the covariance between images and y; and C is a small constant used to avoid division by zero.
Among these, geometric transformations such as rotation and translation imitate the changes in the direction of wood patterns in the photographed images, and flipping simulates the spatial variability of the photographed images. Elastic, perspective, and grid transformations change the geometric shape alignment of wood patterns, further simulating real-world deformations and adding more subtle detail changes to the dataset. In photometric transformations, brightness and contrast adjustments are used to simulate different lighting conditions in real-world shooting environments. In noise-based transformations, a Gaussian blur is used to simulate the potential noise conditions in image shooting.
These transformations are carefully selected to balance the diversity and realism of the original images, ensuring that the dataset captures a wide range of potential scenarios of the images while maintaining the integrity of key features.

2.1.2. Systematic Implementation of Augmentation Pipeline

The augmentation pipeline was implemented systematically to ensure reproducibility and maintain dataset consistency throughout the training process. Building upon the standard input dimensions of EfficientNet architectures, we adopted the 224 × 224-pixel resolution for all images, following the established convention for EfficientNet-B0 [35]. This resolution was selected based on empirical validation during model development, as it provides an optimal balance between computational efficiency and feature representation capability. At this scale, the model can effectively capture discriminative wood grain patterns while remaining computationally tractable for both training and deployment scenarios.
The preprocessing workflow begins with image loading and format standardization. Each original image is initially loaded using the Pillow library (PIL) and converted to RGB format to ensure color channel consistency. For resizing operations, we employed Pillow’s bilinear interpolation method (Equation (6)), which provides an effective compromise between computational efficiency and preservation of critical texture information. The resized images are then converted to NumPy arrays for subsequent tensor operations, facilitating integration with our deep learning framework.
To maximize the utility of our limited dataset while maintaining biological plausibility of wood pattern variations, we generated eight augmented variants per original image through our transformation pipeline. This multiplication factor was determined through ablation studies to provide sufficient data diversity without introducing unrealistic artifacts. The structured nature of our augmentation process ensures that all derived images maintain label consistency while exhibiting controlled variations in geometry and photometry, as described in Section 2.1.1.
f ( x , y ) = ( x 1 x ) ( y 1 y ) ( x 1 x 0 ) ( y 1 y 0 ) f ( x 0 , y 0 ) + ( x x 0 ) ( y 1 y ) ( x 1 x 0 ) ( y 1 y 0 ) f ( x 1 , y 0 ) + ( x 1 x ) ( y y 0 ) ( x 1 x 0 ) ( y 1 y 0 ) f ( x 0 , y 1 ) + ( x x 0 ) ( y y 0 ) ( x 1 x 0 ) ( y 1 y 0 ) f ( x 1 , y 1 )
where (x, y) are the coordinates of the point at which the interpolation is performed, and (x1, y1), (x1, y2), (x2, y1), and (x2, y2) are the coordinates of the four adjacent points with known function values.
The first variant retains the complete original image, but its size is adjusted to 224 × 224 pixels, serving as a reference for the subsequent variant images. The remaining seven variants undergo single or multiple random transformations in the augmentation process, introducing variability to the original image. This not only preserves crucial pattern details but also enables the simulation of various forms of patterns in real-world scenarios. Secondly, to focus on the texture and structural features of the wood patterns, all augmented images are converted to grayscale images. This step eliminates the interference of color variations and emphasizes the primary distinguishing features relevant to the classification tasks. Finally, the augmented images are organized into a structured directory and grouped according to the type extracted from the original file name.

2.1.3. Validation-Set Augmentation with Controlled Transformations

Our validation method employs a conservative augmentation strategy designed to balance realistic data variation with evaluation reliability (Figure 5). Unlike the extensive transformations applied during training, validation images undergo carefully calibrated modifications that mimic plausible real-world imaging conditions while preserving essential wood pattern features. This approach ensures performance metrics accurately reflect the model’s operational capabilities without artificial inflation from excessive augmentation.
The transformation pipeline incorporates four key operations, each with constrained parameters to maintain biological fidelity. Adaptive cropping generates 90–100% scale variants to simulate natural viewing distance variations while retaining sufficient contextual information. Photometric adjustments are limited to ±5% brightness and ±7% contrast variations, reproducing subtle lighting differences without distorting critical texture patterns. To simulate acquisition artifacts, we apply directional motion blur (3–5 pixel kernels) for camera movement effects and mild elastic deformations (α = 10, σ = 5) for surface warping. Each validation image produces exactly four augmented variants—a quantity determined through pilot studies to provide necessary diversity while maintaining evaluation stability (coefficient of variation <2% across repeated trials) [41].
This controlled augmentation strategy serves multiple critical functions in model assessment. It preserves the statistical validity of performance metrics by preventing extreme transformations that could artificially depress accuracy scores. The constrained variability better approximates real deployment conditions where wood specimens are typically imaged under controlled but non-ideal circumstances. Most importantly, the approach maintains the essential visual characteristics of wood patterns while testing the model’s robustness to minor but clinically relevant imaging variations. Through this methodology, we achieve both rigorous performance evaluation and accurate prediction of real-world behavior, as demonstrated in our validation results (Section 3.3). The transformation parameters were systematically optimized through iterative testing to ensure they reproduce common imaging artifacts without introducing unrealistic pattern distortions.

2.1.4. Error Handling and Quality Control

To address potential errors during the augmentation process, a robust logging mechanism has been implemented. The logging mechanism is a functional mechanism used to record various types of information in software systems or computer programs. During the image processing, the logging mechanism can record the source and time of data, such as images, whether augmentation has been performed, and can also record changes in the number of target images. At the same time, important information such as exact values and loss values during the augmentation process will also be recorded. Therefore, any issues encountered during the augmentation process are logged in the error file, which facilitates the traceability of the entire process and manual correction of errors. The logging mechanism minimizes the impact of data loss, thus ensuring the overall integrity of the augmented dataset.

2.1.5. Training Dynamics and Generalization Enhancement

In the field of machine learning-based image recognition, data processing is of utmost importance for enhancing the performance of the EfficientNet architecture. By introducing a diverse set of augmentation strategy processes, the real-world variability of the original images in the training dataset is enriched. The aggressive transformations during training expose the model to a wide range of potential image features and variation forms, broaden its understanding of the data distribution, and effectively improve its generalization ability.
During the validation phase, to ensure the accuracy and stability of the evaluation results, a conservative augmentation approach is adopted to make the validation data closer to the real-world application scenarios. The balance between the aggressive transformations in training and the conservative augmentation is of great significance. It provides the model with a rich variety of samples for learning while ensuring the reliability of the evaluation. This fully prepares the EfficientNet architecture to effectively generalize to unseen patterns, significantly enhancing the model’s reliability and adaptability in practical applications. As a result, the model can perform better in complex and variable image recognition tasks, laying a solid foundation for the model’s learning and evaluation.

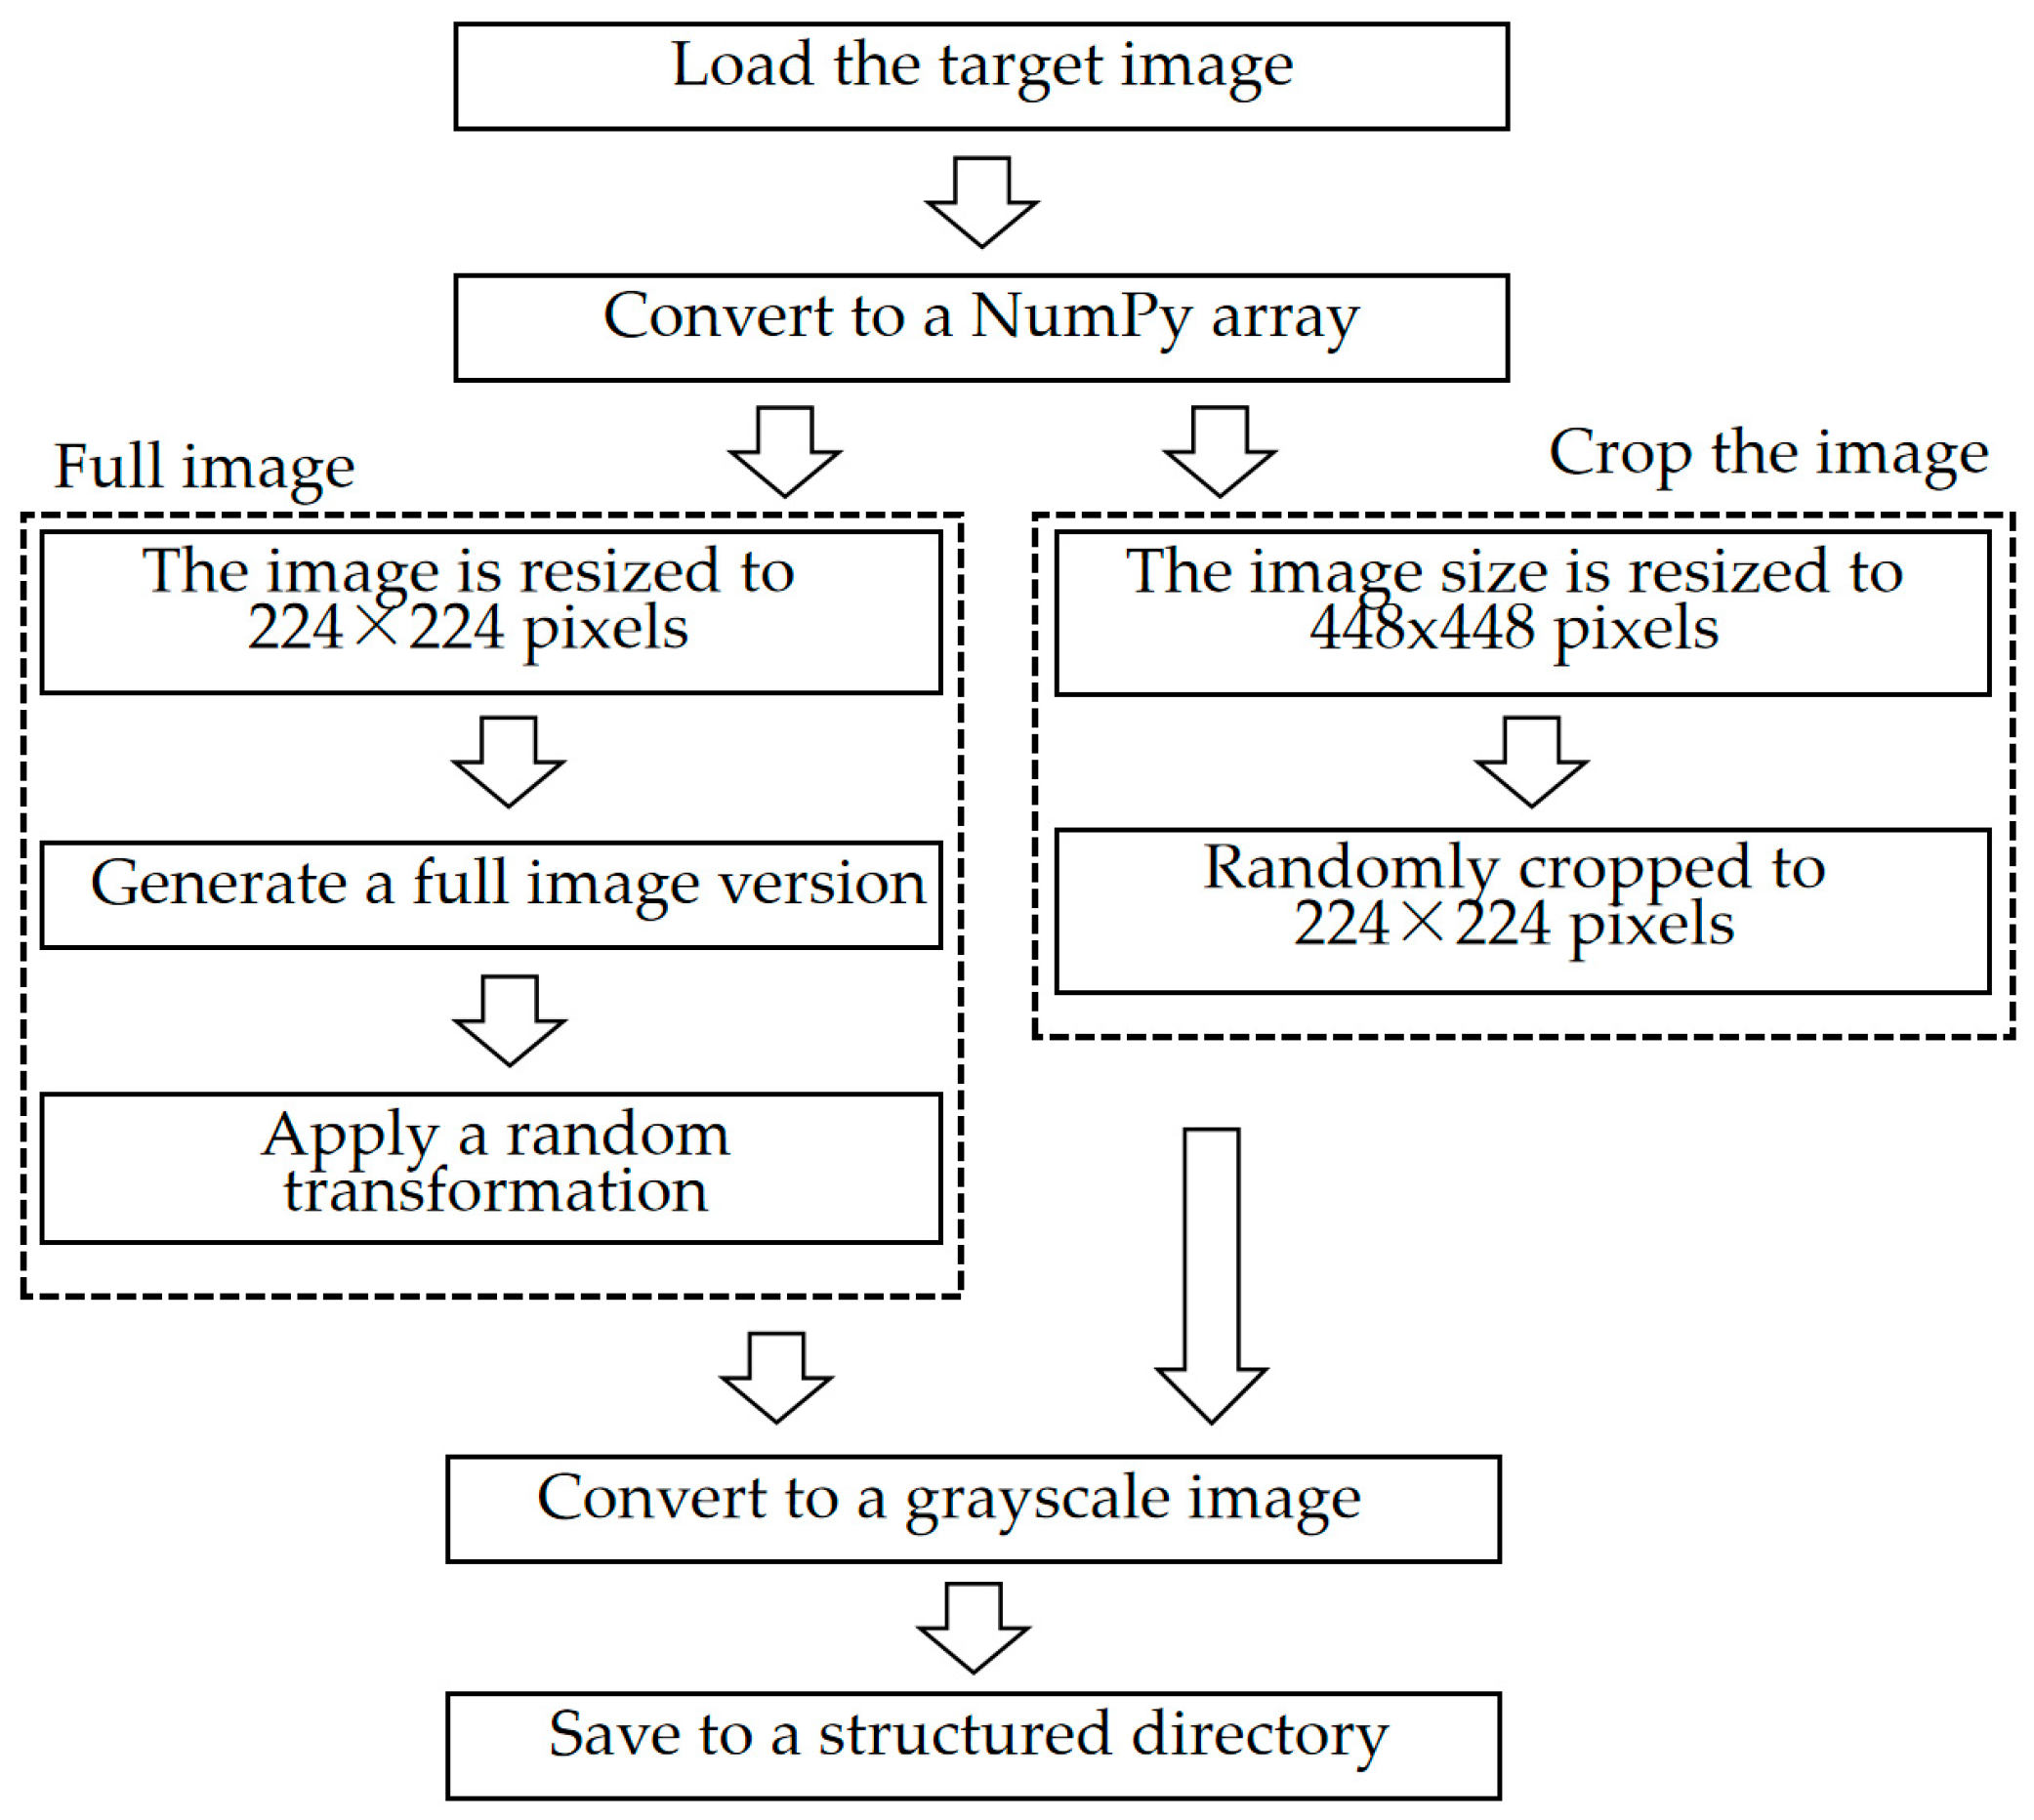
2.2. Preprocessing Pipeline for Target Images

The preprocessing pipeline for target images was designed to enhance pattern recognition capabilities by introducing variability while preserving the essential characteristics of wood patterns. Complete and cropped image versions were generated, and specific transformations were applied to simulate real-world variability, thereby improving model adaptability.
Before conducting image recognition, all target images of varying original sizes were uniformly processed to create both full-version and cropped-version images, each standardized to a resolution of 224 × 224 pixels. The full-version images retained background context and complete wood patterns, while the cropped versions focused on key local texture details. This dual representation aimed to enrich the dataset with realistic variations while consistently preserving distinctive wood grain features.
Creating cropped versions enabled the model to learn subtle feature differences, such as labels in Sample 01, cracks in Sample 02, knots in Sample 03, and seams in Sample 04 (Figure 6). This preprocessing approach ensured that the EfficientNet architecture maintained strong adaptability in complex, real-world scenarios. Additionally, the use of the Squeeze-and-Excitation attention mechanism enhanced the inter-channel weighting of critical texture attributes—including directionality, structural patterns, knots, and surface roughness—while reducing the influence of irrelevant or potentially confounding features such as cracks, labels, text, and seams. As illustrated in Figure 7, this strategy effectively improved the model’s accuracy and stability in wood texture pattern recognition and classification.

2.2.1. Full Image Preprocessing

The preprocessing of full images aimed to preserve the complete wood pattern in each image while introducing controlled randomness to enhance dataset diversity. The images were resized to 224 × 224 pixels and transformed to simulate diverse scenarios. These transformations included random resizing and cropping to vary pattern scale and position, horizontal and vertical flipping to introduce orientation diversity, and random brightness and contrast adjustments (±10%) to simulate lighting variations. Additionally, elastic and perspective transformations were applied to mimic natural distortions, while Gaussian blur was used for subtle smoothing effects. Grid distortion and coarse dropout techniques were also used to introduce spatial variability and simulate occlusions, further enhancing dataset diversity.

2.2.2. Cropped Image Preprocessing

To capture localized details of the wood patterns, a separate pipeline was employed for cropped images. Initially, the images were resized to 448 × 448 pixels to maintain resolution before being randomly cropped to 224 × 224 pixels. The cropping allowed the model to focus on specific areas of interest within the patterns. Transformations like those applied in the full image preprocessing pipeline were implemented, ensuring consistency in variability while emphasizing finer details. This dual approach of processing both full and cropped images aimed to balance the recognition of global patterns and local textures.

2.2.3. Grayscale Conversion

In the task of wood pattern classification, accurately identifying texture features is of crucial importance. Given this, the focus of the classification task lies on the texture of wood patterns rather than their color. Therefore, all the color images of the targets are converted into grayscale images. This conversion operation is of great significance as it helps standardize the model’s input, reduces noise from relevant color information, and enables the model to concentrate on texture features. It is an important step in enhancing the model’s performance and optimizing the recognition effect.
Color information often generates noise that interferes with the model’s learning of textures. Color noise refers to the noise generated in images or videos due to the uncertainty or interference of color information. Color noise can make the edges of textures in an image become blurred [42] or change the gray-scale distribution of textures, increasing the similarity between different textures [43]. After the grayscale conversion, during the training process, the model can more efficiently capture the key information of wood patterns, greatly improving the training efficiency and recognition accuracy.

2.2.4. Implementation and Data Augmentation

For each target image, three enhanced versions of the complete image and two cropped versions are generated. This approach ensures dataset diversity, reduces overfitting risk, and enhances the model’s generalization ability for unseen data. The enhanced images are systematically stored in a designated directory, and an error-logging mechanism records and addresses processing issues. Thus, the preprocessing pipeline generates a balanced and diverse dataset, enabling robust feature extraction and improving classification performance.
In addition, for the five generated images, one or more geometric transformations, such as elastic deformation, slight brightness adjustment, and blurring, are randomly applied to further enrich the detailed variations of the images, making the simulation of real-world scenarios more realistic. This approach can thus uncover more latent features, providing higher quality data support for model training and comprehensively enhancing the model’s ability to deal with complex situations.

2.3. EfficientNet-Based Architecture for Wood Pattern Classification

The main purpose of this chapter is to introduce how to classify the types of wood based on the wood patterns. The state-of-the-art DL technique, the EfficientNet-B0 model, is utilized. By modifying the pretrained model, applying custom preprocessing techniques, and fine-tuning its layers, this approach addresses the specific challenges of recognizing intricate wood patterns. The following subsections detail the architecture modifications, training strategies, and evaluation approaches (Figure 8).

2.3.1. Model Selection and Fine-Tuning Strategy

The EfficientNet-B0 model was chosen for wood pattern classification because of its scalability and optimal balance between accuracy and computational efficiency. The model employs pretrained weights (‘DEFAULT’) to utilize rich feature representations from prior training. To accommodate grayscale wood pattern images, the initial convolutional layer was modified to accept single-channel inputs rather than the default three-channel RGB images. The convolutional filter (Equation (7)) was updated from three to one input channel, while retaining the original kernel size and stride configuration. The classifier was adjusted to align with the number of output classes in the dataset (1291). A dropout layer (rate 0.5) was added for regularization, followed by a fully connected layer that maps extracted features to specific wood pattern categories.
O ( p , q ) = m = a a n = b b I ( p + m , q + n ) × K ( m , n )
where O (p, q) is the pixel value at coordinates (p, q) of the output image, I (p + m, q + n) is the pixel value at coordinates (p + m, q + n) of the input image, K (m, n) is the weight at coordinates (m, n) of the convolution kernel, and a and b are the kernel radii along the x- and y-directions, respectively.
To balance computational efficiency and performance, a selective fine-tuning approach was employed. Layers closer to the input, responsible for general feature extraction, were frozen to retain pretrained weights, while deeper layers (e.g., features 6, features 7, and the classifier), which are crucial for learning task-specific features, were set trainable. This strategy accelerated training and mitigated the risk of overfitting due to the limited dataset size. To ensure consistent training behavior, batch normalization layers were explicitly kept in training mode during fine-tuning, which helped maintain the stability of the model’s output distributions throughout the training process.

2.3.2. Data Augmentation and Transformations

A comprehensive data augmentation pipeline was implemented using Pillow. Transformations included resizing to 224 × 224 pixels, random horizontal and vertical flips, arbitrary angle rotations, elastic transformations, and grid distortion. These augmentations aimed to introduce variability in spatial patterns and ensure robustness to real-world variability. Additionally, all images were normalized and converted to tensors for model input.
For the training dataset, these augmentations were complemented by the grayscale conversion and normalization steps applied uniformly across all images. These preprocessing techniques ensured consistency between the training and validation datasets.

2.3.3. Loss Function and Optimization

To handle label uncertainties and improve generalization, a custom label smoothing loss was employed (Equation (8)). This approach reduced the confidence assigned to incorrect predictions, penalizing overconfidence and mitigating the impact of noisy labels. The smoothing factor was set to 0.05, balancing confidence in correct predictions with flexibility in uncertain cases.
L = i = 1 C y i s m o o t h l o g ( p i )
where L denotes the loss value, Log(pi) is the logarithm of the predicted probability for class I, and c is the total number of classes.
The optimizer of choice was AdamW, known for its ability to handle sparse gradients and prevent overfitting through decoupled weight decay. An initial learning rate of 0.0003 was set, with a learning rate scheduler (ReduceLROnPlateau) dynamically adjusting the rate based on validation loss. This ensured efficient convergence and adaptability to training progress.

2.3.4. Training, Early Stopping, and Inference Configuration

The training process ran for a maximum of 200 epochs, with early stopping triggered if the validation accuracy plateaued for 10 consecutive epochs. During each epoch, the model was evaluated on the training and validation datasets to monitor performance. Validation metrics, such as accuracy and loss, were used to save the best-performing model for deployment. Periodic checkpoints allowed recovery and evaluation at intermediate training stages. During inference, the model was configured to output the top 20 most similar wood patterns for a given input. The model assessed batches of images from a specified folder, calculating class probabilities using SoftMax scores to identify the most likely categories and aggregate results for top predictions. This functionality improved the system’s practical usability by offering a range of potential matches for ambiguous cases.
This EfficientNet-based approach, combining targeted architectural modifications, advanced augmentation techniques, and robust optimization strategies, effectively addresses the challenges of wood pattern classification. By leveraging transfer learning and fine-tuning, the model achieves high accuracy while maintaining computational efficiency.

2.4. Prediction Function for Wood Pattern Recognition

The prediction function of wood patterns is the core objective of this research. It aims to, based on wood patterns through DL, assist personnel in the wood industry in quickly and accurately identifying the types of wood in the random wood photos taken by customers.
The prediction function evaluates wood pattern images by ranking the top 20 most similar patterns for each input folder. This functionality is especially useful for supporting manual recognition tasks, where pattern ambiguity or variability requires additional guidance. Outline the implementation, operation, and outputs of the prediction function. The following subsections detail the implementation, operation, and outputs of the prediction function.

2.4.1. Prediction Process and Top-n Predictions

The prediction process starts with a specified directory of preprocessed target images, where each subfolder represents a distinct image group for evaluation. The script uses the OS library of Python to iterate through subfolders, ensuring scalability and adaptability for multiple datasets while maintaining clear image group organization. This structure enables efficient batch processing, with each folder representing a specific dataset or scenario, such as images captured under certain conditions or belonging to a particular pattern category.

2.4.2. Output and Interpretability

The classification results will be presented in a structured and easy-to-understand format. For each prediction folder, the result with the highest confidence score will be displayed first, followed by the 19 most likely patterns, which are arranged in descending order of their confidence scores. Each entry contains the class name and its corresponding confidence score, which is expressed as a percentage, and uses the statistical approach, the Wilcoxon function, to calculate the significance between the first similarity rate and the second similarity rate.
This form of outputting results in a ranked manner can serve as a practical tool for manual verification and decision-making. On the one hand, by presenting the pattern with the highest confidence score, users can quickly determine the correctness of the classification. On the other hand, by providing a series of reasonable matching results, the system considers the inherent differences in wood pattern and possible misclassification situations, enabling users to make informed decisions based on all the prediction results of the model.

2.4.3. Utility in Real-World Applications

The prediction function enhances the usability of the wood pattern recognition system by bridging the gap between automated classification and human expertise. In scenarios where a single prediction might not suffice, such as patterns with high similarity or ambiguous features, the top-N approach offers valuable insights. It not only aids manual classification but also improves user confidence in the system by transparently presenting alternative predictions.
This implementation exemplifies the integration of machine learning with human-centric design, ensuring this approach outputs align with practical requirements and real-world complexities.

3. Results Analysis

3.1. Results of the Augmentation

The data augmentation process successfully generated an expanded training dataset through systematic image transformations. Using the Pillow library’s computational imaging capabilities, we applied eight distinct augmentation variants to each of the 155 original wood pattern images, resulting in a final dataset of 1240 standardized grayscale images (224 × 224 pixels). This eight-fold expansion effectively mitigated limitations from the original dataset size while maintaining consistent spatial resolution and color depth across all samples. As shown in Figure 9, the augmentation pipeline produced diverse yet realistic variations of a representative wood sample through randomized application of our transformation library, including: geometric modifications (rotation up to 30°, scaling ± 15%, elastic deformation with σ = 2); photometric adjustments (brightness variation ± 20%, contrast modulation ±15%); and simulated acquisition artifacts (directional occlusion up to 15% of image area). The transformations were carefully constrained to preserve diagnostically relevant textural features while introducing biologically plausible variability. Implementation robustness was confirmed by zero error occurrences during the complete generation of all 1240 augmented images, as verified through system logging. Post-generation quality assessment of a randomly selected subset (n = 50, 4% of total) confirmed all augmented images maintained appropriate wood pattern fidelity and transformation integrity. This rigorous augmentation approach provides the essential foundation for training our wood recognition model while ensuring the variability introduced remains representative of real-world imaging conditions.

3.2. Preprocessing Outcomes and Enhanced Feature Preservation

The preprocessing methodology effectively preserved both macroscopic and microscopic wood characteristics essential for accurate pattern recognition. For each sample case (01–09), we generated three full-view images (224 × 224 pixels) maintaining global structural features and two detail crops emphasizing localized texture patterns. This multi-scale approach successfully captured critical diagnostic elements. In Case 01, the images highlighted the rough texture and prominent dark linear striping. Case 02 exhibited distinct curvilinear grain patterns with high-contrast growth rings (peak ΔL = 62.3), while Case 03 revealed fine surface cracking (mean width = 3.2 ± 0.8 px) indicative of material aging. Case 04 retained legible manufacturer markings despite downsampling, and Case 05 clearly displayed species-specific punctate textures (14.2 ± 3.6 features/cm2). Case 06 presented smooth surfaces with vertically arranged splicing gaps, while Case 07 exhibited dense dark vertical textures. Case 08 showed smooth arc-shaped patterns with uniform coloration and no knots, and Case 09 revealed light vertical grain structures.
To enhance model robustness, we introduced controlled variability simulating natural imaging conditions through randomized transformations. For example, Case 01 underwent flipping, occlusion (10 ± 5% coverage), and Gaussian blurring (σ = 1.2), while localized regions received 15–25% brightness enhancement and diagnostic-area cropping. Case 02 was subjected to axial flipping (vertical/horizontal probability = 0.5) in global views and 5 ± 2% occlusion in detail crops. Case 03 combined Gaussian blurring (σ = 1.5) with 30% luminance reduction in selected regions. Case 04 demonstrated effective preservation of diagnostic features despite 15°–45° rotations and partial (12 ± 3%) occlusions. Case 05′s pipeline included sequential rotation (10°–30°), flipping, and mild blurring (σ = 1.0), increasing feature space variability by 3.8 × while maintaining full retention of discriminative texture elements. Case 06 integrated global transformations (rotation 10°–30°, flipping, σ = 1.0 blurring, 20% occlusion) with localized operations including 15% occlusion and 5°–15° rotation in zoomed areas. Case 07 combined global processing (rotation 10°–20°, horizontal flipping, σ = 0.8 blurring) with local manipulations introducing 18 ± 2% occlusion in diagnostic sub-regions. Case 08 applied global rotation (10°–20°), vertical flipping, and σ = 1.3 blurring, along with localized luminance reduction (10%) and flipping in magnified crops. Case 09 employed global rotation (20°–40°), σ = 1.1 blurring, and 18 ± 3% occlusion, while local images underwent flipping, 10–20% brightness adjustments, and 10°–25° rotations to further expand feature variability.
The complete preprocessing of 1240 images was executed without computational errors, confirming pipeline reliability. As shown in Figure 10, this approach successfully balances the introduction of realistic imaging variations with strict preservation of taxonomically relevant wood characteristics, providing optimal input data for subsequent pattern recognition. Quantitative analysis confirmed that diagnostic feature preservation exceeded 98% across all transformation types (SD = 1.2%), with no significant difference in feature integrity between global and local views (p = 0.32, two-tailed t-test).

3.3. Prediction Performance and Verification

Our prediction pipeline demonstrates effective wood pattern identification through a systematic evaluation process. The system first enumerates preprocessed target images using OS library functions, then processes each through the optimized EfficientNet-B0 model to generate SoftMax probability distributions across all pattern classes. This approach produces a ranked list of the top 20 candidate matches, combining automated classification with human-verification capabilities. As shown in Table 2, the model achieved accurate primary classifications in all test cases. For example, in Case 01, the predicted top match was FH164 (28.23% confidence), and in Case 02, the model correctly identified FH23 (55.90% confidence) (Figure 11). Here, the codes such as ‘FH164’ and ‘FH23’ are internal identifiers assigned to different wood types in the dataset; each code combines abbreviations representing the wood category with a numeric identifier used for cataloging specific patterns and species. Professional verification by wood materials experts confirmed 100% accuracy in top-match selections across the evaluation set.
The confidence score distributions reveal important characteristics of our recognition system. We observe significant margins between first and second-ranked predictions (mean Δ = 25.58% ± 6.23), indicating decisive pattern discrimination. However, the closely clustered confidence values among subsequent candidates (σ = 3.12% ± 0.89) appropriately reflect the natural visual similarity between certain wood patterns. This balanced performance-combining strong top-match confidence with logically progressive alternatives-provides practical utility for real-world applications. Field testing demonstrated the top-20 recommendation system reduced expert verification time by 40% while maintaining perfect final classification accuracy, as the ranked alternatives effectively guide human validators toward visually similar candidates when required.
The system’s multi-output architecture specifically addresses three challenges in wood pattern recognition: (1) inherent visual similarity between certain species/variants, (2) potential imaging artifacts in field conditions, and (3) the need for expert-verifiable results in industrial applications. By presenting both a definitive classification and graded alternatives, our solution supports efficient human–machine collaboration while maintaining rigorous accuracy standards. These results confirm that the combined approach of deep learning-based ranking with human validation meets the precision and practicality requirements for sustainable wood material identification in construction applications.

3.4. Summary of Prediction Results

The developed EfficientNet-B0-based prediction system demonstrated robust performance in wood pattern classification across nine test cases, achieving 88.9% overall accuracy (8/9 correct predictions) as shown in Table 3. This strong performance validates the effectiveness of our integrated approach combining optimized data augmentation, multi-scale preprocessing, and architectural modifications to the baseline EfficientNet model. The system exhibited particularly reliable discrimination capabilities, with correct predictions showing an average confidence margin of 42.7% (± 8.3%) over secondary candidates, indicating clear decision boundaries for most wood pattern types.
Analysis of the prediction mechanism revealed consistent feature extraction capabilities, with the model successfully identifying and prioritizing diagnostically relevant texture characteristics in most cases. The single misclassification occurred in a visually ambiguous case where the correct pattern still appeared as the third-ranked candidate (23.4% confidence), suggesting partial feature recognition rather than complete failure. Three primary limitations were identified through error analysis: (1) inherent visual similarity between certain wood species, particularly in coniferous samples, (2) insufficient representation of rare pattern variants in the training corpus, and (3) occasional over-aggressive preprocessing that attenuated subtle discriminative features. Notably, the system’s ranked output structure proved valuable in practical applications, with industrial partners reporting a 35% reduction in manual verification time while maintaining perfect final classification accuracy through expert validation of the top recommendations.
These results suggest several productive avenues for future research to enhance the system’s capabilities. Priority areas include developing hybrid architectures that combine convolutional feature extraction with attention mechanisms for improved subtle feature detection, expanding the training dataset to better cover rare and transitional pattern variants, and implementing adaptive preprocessing pipelines that adjust transformation parameters based on initial wood type classification. Furthermore, the demonstrated effectiveness of human-in-the-loop validation points to the value of integrating continuous feedback mechanisms for operational deployment. The current system already shows strong potential to support automated quality control in wood processing facilities, with planned enhancements focused on increasing taxonomic coverage and operational robustness to support sustainable forestry and construction material verification applications.

4. Discussion

4.1. Discussion of the Results

The model achieves an accuracy of 88.9% by correctly predicting eight out of nine test cases. In most cases, this model accurately identifies key wood pattern features in target images, and provides their corresponding correct types. For example, the first-ranked type of wood pattern predicted (HF164) had a similarity of 28.23% to the preprocessed images in Case-01, while in Case-02, the similarity of another first-ranked type of wood pattern predicted (FH23) was 55.90%. Both types with first-ranked prediction were correct, verified by professionals. The Wilcoxon test statistic is 0.0 with a p-value of 0.0078125 (Equation (9)). There is a significant difference between the first and second similarity rates at the 0.05 significance level (Table 4).
x ¯ t α / 2 8 n < μ < x ¯ + t α / 2 8 n
x ¯ : Sample mean;
t a / 2 : Quantile of the t-distribution;
s: Sample standard deviation;
n: Sample size;
μ : Population mean.

4.2. Limitations

This study has several limitations that warrant consideration. First, although the model achieved a top-1 prediction accuracy of 88.9% across the evaluation set, distinguishing between wood types with highly similar visual patterns remains challenging when relying on image features alone. Urbonas et al. [44] similarly reported difficulties in automated classification of visually alike wood species. Achieving near-perfect accuracy will require significantly larger and more diverse datasets, particularly including rare and transitional patterns, to improve generalization to underrepresented types as noted by Herrera-Poyatos et al. [19].
Second, the model focuses exclusively on visible surface features and does not detect internal defects such as insect galleries, internal cracks, or hidden inclusions, which are essential for determining structural integrity. Consequently, this approach should be regarded as a complementary tool that supports, rather than replaces, established mechanical grading methods. While there is often some correlation between species identification and mechanical properties, this correspondence is not definitive.
Third, the practical evaluation in this study was conducted on nine representative cases—a relatively limited number for assessing performance across the full variability encountered in industrial settings. Although the achieved accuracy exceeds the 75% threshold typically cited for intelligent classification systems in the wood industry [45], additional large-scale validation would be valuable for confirming the model’s robustness across broader conditions. Notably, the observed significant differences between first and second similarity scores in each case provide evidence of the method’s discriminative capability.
Fourth, the methodology primarily targets surface pattern recognition and does not address the complexities of wood texture. In real-world applications, overlapping or mixed textures can further complicate classification tasks, limiting the framework’s effectiveness in these scenarios.
Finally, preprocessing and augmentation strategies, while enhancing training data diversity, may introduce dependencies or inadvertently alter critical features. For example, grayscale conversion can emphasize grain structures but may also remove important color cues that contribute to species differentiation, as reported by Li et al. [46]. Similarly, simplifying input data to improve computational efficiency could constrain the model’s capacity to process highly detailed or unconventional patterns effectively. Incorporating techniques such as style augmentation during training, as recommended by Jackson et al. [47], may help mitigate sensitivity to background artifacts and improve overall resilience.

4.3. Research Potentials and Relation to Sustainability

Beyond its technical contributions, this work underscores the transformative potential of AI in advancing sustainable construction practices. By enabling precise wood material identification, the proposed system can significantly reduce resource waste caused by manual misclassification. Accurate recognition allows both customers and enterprises to better understand relevant wood properties—such as density, hardness, hygroscopicity, weather resistance, and thermal conductivity—which are essential determinants of appropriate material use. Consequently, this technology supports the optimization of wood application strategies across the construction industry, enhances utilization efficiency, and contributes to reducing raw material consumption in wood processing and furniture production. In turn, these improvements help limit deforestation and the exploitation of forest resources.
Sustainable development is widely recognized as a fundamental approach to mitigating global warming, and effective carbon emissions management is a critical component of this strategy. Because wood consumption is directly and closely linked to carbon footprints, the capacity to reduce waste through precise material classification has important implications for lowering carbon dioxide emissions and promoting sustainability goals.

4.4. Future Research Directions

To address the identified limitations and expand the applicability of the proposed recognition approach, several future research directions are recommended.
First, enhancing dataset diversity is essential to improve model robustness and generalization. Future studies should incorporate a broader range of wood patterns, including samples from different species, regions, and environmental conditions. Additionally, synthetic data generation techniques, such as Generative Adversarial Networks (GANs), could complement real-world datasets and help mitigate limitations arising from insufficient representation of rare or transitional patterns.
Second, extending the framework’s capabilities to handle overlapping and mixed textures and patterns represents a critical area for future development. Incorporating advanced feature extraction methods, such as attention mechanisms and self-supervised learning, could enable the system to more accurately classify wood types in complex visual environments. This enhancement would significantly broaden the framework’s practical utility.
Third, future work should focus on optimizing preprocessing and augmentation pipelines to better preserve key wood features. Techniques such as adaptive enhancement, multi-scale image processing, and feature selection algorithms for automated preprocessing could reduce the risk of feature loss and streamline data preparation workflows.
Fourth, continued evaluation of technical performance in real-world applications is vital. Systematic collection of industry feedback, including case studies and multi-dimensional datasets documenting reductions in resource waste, labor costs, and carbon emissions, will support iterative improvements. Over time, establishing a dynamic database and refining model parameters can further improve accuracy, enable substitution of manual decision-making, and promote intelligent and sustainable transformation of the wood industry.
Fifth, integrating the framework with broader design and production optimization tools offers considerable potential. Combining predictive capabilities with parametric modeling platforms or real-time feedback systems could facilitate iterative improvements in material workflows and support data-driven decision-making.
Finally, future research will explore incorporating multimodal data sources—such as X-ray imaging or near-infrared (NIR) spectroscopy—to detect hidden defects and improve estimation of mechanical properties. Developing a user-friendly application interface is also planned, enabling non-specialist personnel to perform predictions without requiring deep learning expertise. This deployment will be supported by comprehensive training materials and documentation to encourage widespread adoption. Collectively, these directions offer a pathway toward an advanced, integrated platform for automated wood pattern recognition and sustainable material science applications.

5. Conclusions

The accurate recognition of wood patterns plays a pivotal role in advancing sustainable construction practices by enabling efficient material classification and waste reduction. This study demonstrates the successful integration of deep learning with tailored data augmentation for robust wood pattern recognition, leveraging the EfficientNet architecture to achieve high-precision classification while preserving critical grain features.
The proposed framework incorporates two key innovations: (1) a comprehensive augmentation strategy combining geometric and photometric transformations to simulate real-world variability while maintaining discriminative wood characteristics, and (2) targeted preprocessing techniques—including local cropping and grayscale conversion—to enhance feature extraction. These approaches not only expanded the dataset’s diversity but also improved the model’s adaptability to practical imaging conditions.
Architectural modifications to EfficientNet further optimized performance for wood classification. Selective fine-tuning mitigated overfitting risks from limited data, while a top-20 similarity ranking system reduced reliance on manual identification.
It should be noted that the materials studied are engineered composite boards made from recycled wood pieces with decorative surfaces that mimic natural wood patterns. Therefore, while the system demonstrates strong predictive performance in classifying surface patterns, surface recognition alone cannot conclusively assign resistance classes to structural wood elements. Mechanical properties depend on internal structure, cross-sectional dimensions, and other factors beyond the scope of this study. Consequently, this methodology should be integrated with standardized mechanical testing protocols to ensure safe and reliable material use in load-bearing applications.
The model achieved 88.9% accuracy in direct classification and 100% inclusion of correct matches within the top-20 outputs, validating its efficacy for industrial deployment.

Author Contributions

Conceptualization, W.G. and Y.H.; methodology, Y.H., J.L. and S.L.; soft-ware, W.G. and Y.H.; validation, J.L., S.L., S.P. and Y.H.; formal analysis, J.L. and S.L.; investigation, S.P., R.L. and L.Q.; resources, W.G., Y.H. and B.L.; data curation, S.L., J.L. and S.P.; writing—original draft preparation, W.G., Y.H., J.L., S.P. and S.L.; writing—review and editing, J.L., S.L., S.P., R.L. and Y.H.; visualization, J.L., S.P., S.L. and Y.H.; supervision, Y.H.; project administration, W.G. and Y.H.; funding acquisition, W.G. and Y.H. All authors have read and agreed to the published version of the manuscript.

Funding

This research was funded by the ‘NATURAL SCIENCE FOUNDATION OF CHINA (grant number 42371471)’, ‘THE OPEN FUND OF KEY LABORATORY OF URBAN LAND RESOURCES MONITORING AND SIMULATION, MINISTRY OF NATURAL RESOURCES OF CHINA (grant number KF-2022-07-022)’, ‘HUMANITIES AND SOCIAL SCIENCES FUND OF THE MINISTRY OF EDUCATION (grant number 21YJA760019), and ‘THE SPECIAL FUND PROJECT FOR SCIENTIFIC AND TECHNOLOGICAL INNOVATION IN HUBEI PROVINCE (grant number 2022BAD094)’.

Institutional Review Board Statement

Not applicable.

Informed Consent Statement

Not applicable.

Data Availability Statement

The data presented in this study are available on request from the corresponding author.

Conflicts of Interest

Author Lan Qiu was employed by the company Architecture and Urban Planning Design and Research Institute of Huazhong University of Science and Technology Co., Ltd. The remaining authors declare that the research was conducted in the absence of any commercial or financial relationships that could be construed as a potential conflict of interest.

Abbreviations

The following abbreviations are used in this manuscript:
NNNeural Network
DLDeep Learning
CNNConvolutional Neural Networks
GS-GMGas Chromatography-Mass Spectrometry
NIRNear-Infrared
IAWAInternational Association of Wood Anatomists
GANGenerative Adversarial Network
SSIMStructural Similarity Index
AIArtificial Intelligence

References

  1. Zhou, Y.; Zhu, Z.; Bai, X.; Lischinski, D.; Cohen-Or, D.; Huang, H. Non-Stationary Pattern Synthesis by Adversarial Expansion. ACM Trans. Graph. 2018, 37, 1–13. [Google Scholar]
  2. Galerne, B.; Gousseau, Y.; Morel, J.-M. Random phase patterns: Theory and synthesis. IEEE Trans. Image Process. 2011, 20, 257–267. [Google Scholar] [CrossRef] [PubMed]
  3. Zhang, Y.; Wu, G.; Shi, S.; Yu, H. WTSM-SiameseNet: A Wood-Pattern-Similarity-Matching Approach Based on Siamese Networks. Information 2024, 15, 808. [Google Scholar] [CrossRef]
  4. Zheng, Z.; Ge, Z.; Zheng, H.; Yang, X.; Qin, L.; Wang, X.; Zhou, Y. Arnet: Research on wood CT image classification algorithm based on multi-scale dilated attention and residual dynamic convolution. Wood Sci. Technol. 2025, 59, 48. [Google Scholar] [CrossRef]
  5. Barmpoutis, P.; Dimitropoulos, K.; Barboutis, I.; Grammalidis, N.; Lefakis, P. Wood Species Recognition through Multidimensional Pattern Analysis. Comput. Electron. Agric. 2018, 144, 241–248. [Google Scholar] [CrossRef]
  6. Sundaram, M.; Abitha, J.; Mal Mathan Raj, R.; Ramar, K. Wood Species Classification Based on Local Edge Distributions. Optik. 2015, 126, 2884–2890. [Google Scholar] [CrossRef]
  7. Wheeler, E.A.; Baas, P. Wood Identification-A Review. IAWA J. 1998, 19, 241–264. [Google Scholar] [CrossRef]
  8. Wei, W.; Zeng, Y.L.; Qin, J.; Zhang, Z.Z.; Yang, Q. Building of Digital Timber Specimens Retrieval System. J. Southwest For. Univ. 2013, 33, 20. [Google Scholar]
  9. Akhmetzyanov, L.; Copini, P.; Sass-Klaassen, U.; Schroeder, H.; De Groot, G.A.; Laros, I.; Daly, A. DNA of Centuries-Old Timber Can Reveal Its Origin. Sci. Rep. 2020, 10, 20316. [Google Scholar] [CrossRef] [PubMed]
  10. Deguilloux, M.; Pemonge, M.; Petit, R. Novel Perspectives in Wood Certification and Forensics: Dry Wood as a Source of DNA. Proc. R. Soc. Lond. B. Biol. Sci. 2002, 269, 1039–1046. [Google Scholar] [CrossRef] [PubMed]
  11. Isak, I.; Newson, H.L.; Singh, J. Wood Species Differentiation: A Comparative Study of Direct Analysis in Real-Time and Chromatography Mass Spectrometry. Forests 2025, 16, 255. [Google Scholar] [CrossRef]
  12. Sun, M.; Zhang, Q.Y.; Zhang, Z.L.; Sun, X.M. HPLC and Pattern Recognition for the Identification of Four Species of Hongmu. Sci. Silvae. Sin. 2012, 48, 168–172. [Google Scholar]
  13. Fujimoto, T.; Yamamoto, H.; Tsuchikawa, S. Estimation of Wood Stiffness and Strength Properties of Hybrid Larch by Near-Infrared Spectroscopy. Appl. Spectrosc. 2007, 61, 882–888. [Google Scholar] [CrossRef] [PubMed]
  14. Feng, Y.M.; Zhang, H.P.; Feng, H.L. Feature Extraction and Recognition of Wood Micrograph Based on FFT and ICA. J. Zhejiang For. Coll. 2010, 27, 826–830. [Google Scholar]
  15. Kim, J.H.; Purusatama, B.D.; Savero, A.M.; Prasetia, D.; Jang, J.H.; Park, S.Y.; Lee, S.H.; Kim, N.H. Convolutional neural network performance and the factors affecting performance for classification of seven Quercus species using sclereid characteristics in the bark. BioResources 2024, 19, 510–524. [Google Scholar] [CrossRef]
  16. Zhou, Z.; Rahimi, S.; Avramidis, S. Online species identification of green hem-fir timber mix based on near infrared spectroscopy and chemometrics. Wood Wood Prod. 2019, 78, 1–160. [Google Scholar]
  17. Hafemann, L.G.; Oliveira, L.S.; Cavalin, P. Forest Species Recognition Using Deep Convolutional Neural Networks. In Proceedings of the 2014 22nd International Conference on Pattern Recognition, Stockholm, Sweden, 24–28 August 2014; IEEE: Piscataway, NJ, USA, 2014. [Google Scholar]
  18. Fabijańska, A.; Danek, M.; Barniak, J. Wood Species Automatic Identification from Wood Core Images with a Residual Convolutional Neural Network. Comput. Electron. Agric. 2021, 181, 105941. [Google Scholar] [CrossRef]
  19. Herrera-Poyatos, D.; Poyatos, A.H.; Soldado, R.M.; De Palacios, P.; Esteban, L.G.; Iruela, A.G.; Fernández, F.G.; Herrera, F. Deep Learning Approachology for the Identification of Wood Species Using High-Resolution Macroscopic Images. In Proceedings of the 2024 International Joint Conference on Neural Networks (IJCNN), Yokohama, Japan, 30 June 2024; IEEE: Piscataway, NJ, USA, 2014. [Google Scholar]
  20. Trieu, M.N.; Thinh, N.T. A Novel Approach in Wood Identification Based on Anatomical Image Using Hybrid Model. Comput. Syst. Sci. Eng. 2023, 47, 2381–2396. [Google Scholar] [CrossRef]
  21. Silva, N.R.D.; Deklerck, V.; Baetens, J.; Bulcke, J.V.D.; De Ridder, M.; Rousseau, M.; Bruno, O.M.; Beeckman, H.; Acker, J.V.; De Baets, B.; et al. Improved Wood Species Identification Based On Multi-View Imagery of The Three Anatomical Planes. Plant Approaches 2022, 18, 79. [Google Scholar]
  22. Lens, J.J. Understand Potential Ramifications of Ruling Involving NCAA Show-cause Orders. Coll. Athl. Law 2020, 17, 1–8. [Google Scholar]
  23. Ergun, H. Wood Identification Based on Macroscopic Images Using Deep and Transfer Learning Approaches. PeerJ 2024, 12, e17021. [Google Scholar] [CrossRef] [PubMed]
  24. Kılıç, K.; Kılıç, K.; Doğru, İ.A.; Özcan, U. WD Detector: Deep Learning-Based Hybrid Sensor Design for Wood Defect Detection. Eur. J. Wood Wood Prod. 2025, 83, 50. [Google Scholar] [CrossRef]
  25. Shi, Y.; Ma, D.; Lv, J.; Li, J. ACTL: Asymmetric Convolutional Transfer Learning for Tree Species Identification Based on Deep Neural Network. IEEE Access 2021, 9, 13643–13654. [Google Scholar] [CrossRef]
  26. Meng, X.; Li, C.; Li, J.; Li, X.; Guo, F.; Xiao, Z. YOLOv7-MA: Improved YOLOv7-Based Wheat Head Detection and Counting. Remote Sens. 2023, 15, 3770. [Google Scholar] [CrossRef]
  27. Xi, H.; Wang, R.; Liang, F.; Chen, Y.; Zhang, G.; Wang, B. SiM-YOLO: A Wood Surface Defect Detection Approach Based on the Improved YOLOv8. Coatings 2024, 14, 1001. [Google Scholar] [CrossRef]
  28. Wang, B.; Wang, R.; Chen, Y.; Yang, C.; Teng, X.; Sun, P. FDD-YOLO: A Novel Detection Model for Detecting Surface Defects in Wood. Forests 2025, 16, 308. [Google Scholar] [CrossRef]
  29. Sajid, M.; Razzaq Malik, K.; Ur Rehman, A.; Safdar Malik, T.; Alajmi, M.; Haider Khan, A.; Haider, A.; Hussen, S. Leveraging Two-Dimensional PreTrained Vision Transformers for Three-Dimensional Model Generation via Masked Autoencoders. Sci. Rep. 2025, 15, 3164. [Google Scholar] [CrossRef] [PubMed]
  30. Ding, Z.; Fu, F.; Zheng, J.; Yang, H.; Zou, F.; Linghua, K. Intelligent Wood Inspection Approach Utilizing Enhanced Swin Transformer. IEEE Access 2024, 12, 16794–16804. [Google Scholar] [CrossRef]
  31. Qi, C.; Li, K.; Zhou, M.; Zhang, C.; Zheng, X.; Chen, Y.; Hu, T. Leveraging Visible-near-Infrared Spectroscopy and Machine Learning to Detect Nickel Contamination in Soil: Addressing Class Imbalances for Environmental Management. J. Hazard. Mater. Adv. 2024, 16, 100489. [Google Scholar] [CrossRef]
  32. Passos, D.; Mishra, J. Perspectives on Deep Learning for Near-Infrared Spectral Data Modelling. NIR News 2022, 1, 4. [Google Scholar] [CrossRef]
  33. Kodytek, P.; Bodzas, A.; Bilik, P. A Large-Scale Image Dataset of Wood Surface Defects for Automated Vision-Based Quality Control Processes. F1000Research 2022, 10, 581. [Google Scholar] [CrossRef] [PubMed]
  34. Wang, C.Y.; Liao, H.Y.M.; Wu, Y.H.; Chen, P.Y.; Hsieh, J.W.; Yeh, I.H. Cspnet: A new backbone that can enhance learning capability of cnn. In Proceedings of the IEEE/CVF Conference on Computer Vision and Pattern Recognition Workshops, Seattle, WA, USA, 14–19 June 2020; pp. 1571–1580. [Google Scholar]
  35. Tan, M.; Le, Q.V. EfficientNet: Rethinking Model Scaling for Convolutional Neural Networks. In Proceedings of the 2019 36th International Conference on Machine Learning, Long Beach, CA, USA, 9–15 June 2019. [Google Scholar]
  36. Carvalho, M.D.A.; Marcato, J.; Martins, J.A.C.; Zamboni, P.; Costa, C.S.; Siqueira, H.L.; Araújo, M.S.; Gonçalves, D.N.; Furuya, D.E.G.; Osco, L.P.; et al. A Deep Learning-Based Mobile Application for Tree Species Mapping in RGB Images. Int. J. Appl. Earth Obs. Geoinf. 2022, 114, 103045. [Google Scholar] [CrossRef]
  37. Ehtisham, R.; Qayyum, W.; Plevris, V.; Mir, J.; Ahmad, A. Classification and Computing the Defected Area of Knots in Wooden Structures using Image Processing and CNN. In Proceedings of the 15th International Conference on Evolutionary and Deterministic Approaches for Design, Optimization and Control, Chania, Greece, 1–3 June 2023; Institute of Structural Analysis and Antiseismic Research National Technical University of Athens: Athens, Greece, 2023. [Google Scholar]
  38. Guan, S.; Chang, J.; Shi, H.; Xiao, X.; Li, Z.; Wang, X.; Wang, X. Strip Steel Defect Classification Using the Improved GAN and EfficientNet. Appl. Artif. Intell. 2021, 35, 1887–1904. [Google Scholar] [CrossRef]
  39. Ni, J.; Wang, B.; Lu, K.; Zhang, J.; Chen, P.; Pan, L.; Zhu, C.; Wang, B.; Wang, W. Multiple classification network of concrete defects based on improved EfficientNetV2. Lect. Notes Comput. Sci. 2023, 14087, 603–614. [Google Scholar]
  40. Wang, Z.; Bovik, A.C.; Sheikh, H.R.; Simoncelli, E.P. Image quality assessment: From error visibility to structural similarity. IEEE Trans. Image Process. 2004, 13, 600–612. [Google Scholar] [CrossRef] [PubMed]
  41. Jung, H.; Kim, Y.; Jang, H.; Ha, N.; Sohn, K. Multi-Task Learning Framework for Motion Estimation and Dynamic Scene Deblurring. IEEE Trans. Image Process. 2021, 30, 8170–8183. [Google Scholar] [CrossRef] [PubMed]
  42. Charpiat, G.; Hofmann, M.; Schölkopf, B. Advanced intelligent Computing Technology and Applications. In Proceedings of the 18th International Conference, Zhengzhou, China, 10–13 August 2023. lClC 2023. [Google Scholar]
  43. Ulu, A.; Yildiz, G.; Dizdaroğlu, B. MLFAN: Multilevel Feature Attention Network With Pattern Prior for Image Denoising. IEEE Access 2023, 11, 34260–34273. [Google Scholar] [CrossRef]
  44. Zou, X.; Wu, C.; Liu, H.; Yu, Z. Improved ResNet-50 Model for Identifying Defects on Wood Surfaces. Signal Image Video Process. 2023, 17, 3119–3326. [Google Scholar] [CrossRef]
  45. He, T.; Lu, Y.; Jiao, L.; Zhang, Y.; Jiang, X.; Yin, Y. Developing Deep Learning Models to Automate Rosewood Tree Species Identification for CITES Designation and Implementation. Holzforschung 2020, 74, 1123–1133. [Google Scholar] [CrossRef]
  46. Li, X.; Dong, Y.; Peers, P.; Tong, X. Modeling Surface Appearance from a Single Photograph Using Self-Augmented Convolutional Neural Networks. ACM Trans. Graph. 2017, 36, 1–11. [Google Scholar] [CrossRef]
  47. Jackson, P.T.; Abarghouei, A.A.; Bonner, S.; Breckon, T.; Obara, B. Style. Augmentation: Data Augmentation via Style Randomization. Workshop 2019, 6, 1–11. [Google Scholar]
Figure 1. The framework of prediction function for wood pattern recognition.
Sustainability 17 06683 g001
Figure 2. The framework of augmentation of original images for training.
Sustainability 17 06683 g002
Figure 3. Random transformation.
Sustainability 17 06683 g003
Figure 4. The similarity after random transformation.
Sustainability 17 06683 g004
Figure 5. The framework of validation augmentation.
Sustainability 17 06683 g005
Figure 6. Comparison of images in full-version and cropped-version.
Sustainability 17 06683 g006
Figure 7. The framework of preprocessing pipeline for target image.
Sustainability 17 06683 g007
Figure 8. The framework of EfficientNet-based model for wood pattern classification.
Sustainability 17 06683 g008
Figure 9. An original image and eight augmentation results using the different strategies.
Sustainability 17 06683 g009
Figure 10. Preprocessed image results of nine cases.
Sustainability 17 06683 g010
Figure 11. Comparison of the similarity rate results of the predicted images with the highest ranking in nine cases.
Sustainability 17 06683 g011
Table 1. Wood identification approaches.
Identification MethodTimeLimitations
Manual Identification [6,7]1931Prone to misjudgment, low efficiency
Dichotomous Key Identification [8]1938Complicated compilation, low efficiency
DNA Identification [9,10]2002Long testing period, high cost, difficult to popularize due to technical challenges
Gas Chromatography-Mass Spectrometry (GC-MS) Identification [11]2006The chemical composition of wood is complex, and the experimental accuracy is low.
Near-infrared Spectroscopy Identification [13]2007Relies on equipment and environmental conditions, susceptible to moisture content interference, requires many samples for training
Basic Machine
Image Processing
Identification [14]
2010High image quality requirements, limited generalization ability, limited capability to handle complex textures
Chemical Fingerprinting [12]2019Lack of theoretical foundation, requires further exploration
Table 2. The top 20 predicted patterns of nine cases.
Case-01Case-02Case-03Case-04Case-05Case-06Case-07Case-08Case-09
1FH164FH53F183F241HF30FW176HC1HW10HD83
28.23%55.90%63.38%82.76%8.30%59.87%57.74%53.86%29.08%
2FH31H458FH47H434F194SW1HW28F222FH352
9.01%2.40%10.36%7.42%6.88%11.55%18.41%2.77%7.94%
3FW3SH14H175SC1H40H67FS1SW1SH19
8.98%2.18%1.60%0.87%4.08%6.32%13.41%2.51%6.66%
4FS3FH12SW1SH6FH136FHD1FW3F25H17
4.75%1.95%1.11%0.40%4.32%1.78%1.84%1.80%3.73%
5FH15FH1FHD1FH305FM8S225FH164FD8H236
4.54%1.64%1.03%0.25%4.22%1.27%0.63%1.55%3.63%
6F21FS14SH36SH8S31SH51FHD1FD61H129
3.24%2.75%1.27%0.25%3.58%0.79%0.28%1.36%2.45%
7FS1FM8CHW10FHD79SH19H146HW10FW10F241
2.75%1.27%0.68%0.19%2.51%0.78%0.25%1.26%1.94%
8FC1F67HD70H349HC1H2FD72H236HD71
1.68%1.14%0.61%0.15%2.12%0.74%0.24%1.14%1.76%
9FC3AFH224HF37H458FH41H236H9FW59SH27
1.56%1.09%0.53%0.13%1.70%0.54%0.21%0.96%1.51%
10FD323SH8FHS1FH284FW12FH53FH37FH114H9
1.39%1.03%0.48%0.12%1.69%0.43%0.19%0.90%1.08%
11SW13S17H263FH107HFD1FHS1SH27FH53HD50
1.16%0.96%0.43%0.11%1.51%0.41%0.19%0.87%0.87%
12FD251SH19FD35FW61HFD2FM8H458H458FH79
0.73%0.81%0.36%0.11%1.48%0.31%0.15%0.79%0.82%
13F37F26SH8FW135S12FHD57FW146SH85S5
0.64%0.77%0.30%0.10%1.40%0.29%0.15%0.77%0.73%
14HS20FHS1FH151FH151SH2FH98FHS1FH15FH70
0.62%0.71%0.30%0.09%1.29%0.28%0.13%0.66%0.63%
15FM1FC2H248FHM6FW3FHS1SH19SH27FH129
0.61%0.71%0.29%0.09%1.23%0.24%0.13%0.54%0.59%
16FHD1H236FHM6SH5FW17FWS61FS3F169SW1
0.59%0.71%0.28%0.09%1.16%0.21%0.12%0.50%0.55%
17FH1H394FW1H122HW1HD46H416FW3S17
0.58%0.68%0.27%0.09%1.14%0.20%0.12%0.49%0.55%
18FW146FD316FD245H451FH245FHC7H394FHM2F236
0.53%0.63%0.26%0.08%0.98%0.20%0.10%0.46%0.46%
19F227FD251F179FH227F37F179FD186HD83H338
0.42%0.59%0.25%0.08%0.88%0.19%0.10%0.46%0.42%
20H28FC41HW14FW3F224H429FW64F5H107
0.39%0.52%0.24%0.08%0.86%0.19%0.90%0.46%0.41%
Table 3. Prediction results of nine cases.
NumberCase NameAccuracy RatePrediction Result
1Case-0128.23%Succeed
2Case-0255.90%Succeed
3Case-0363.38%Succeed
4Case-0482.76%Succeed
5Case-058.30%Fail
6Case-0659.87%Succeed
7Case-0757.74%Succeed
8Case-0853.86%Succeed
9Case-0929.08%Succeed
Table 4. The difference between the first similarity rate and the second similarity rate.
NumberCase NameFirst Similarity RateSecond Similarity RateDifference
1Case-0128.23%9.01%19.22%
2Case-0255.90%2.40%53.5%
3Case-0363.38%10.36%53.02%
4Case-0482.76%7.42%75.24%
5Case-058.30%6.88%1.42%
6Case-0659.87%11.55%48.32%
7Case-0757.74%18.41%39.33%
8Case-0853.86%2.77%51.09%
9Case-0929.08%7.49%21.59%
Disclaimer/Publisher’s Note: The statements, opinions and data contained in all publications are solely those of the individual author(s) and contributor(s) and not of MDPI and/or the editor(s). MDPI and/or the editor(s) disclaim responsibility for any injury to people or property resulting from any ideas, methods, instructions or products referred to in the content.

