4.2.1. Hypothesis 1: Space Personalization and Control
Linear regression analysis strongly supported the primary hypothesis (
Table 3). Space personalization strongly predicted overall sense of control (F (1, 586) = 111.44,
p < 0.001), accounting for 16% of variance (R
2 = 0.16), a medium effect per [
70]. Cohen’s *d* = 0.56 for personalization–control linkage indicates practical significance, explaining 16% of variance—a medium effect comparable to Western studies [
14]. Both components of control showed significant relationships: control of opinion (F (1, 586) = 81.44,
p < 0.001) and control of activities (F (1, 586) = 92.61,
p < 0.001). Residual analysis confirmed model assumptions of linearity and normality. Subgroup analyses revealed larger effects in rural (R
2 = 0.22) vs. urban (R
2 = 0.12) areas, underscoring housing flexibility’s moderating role.
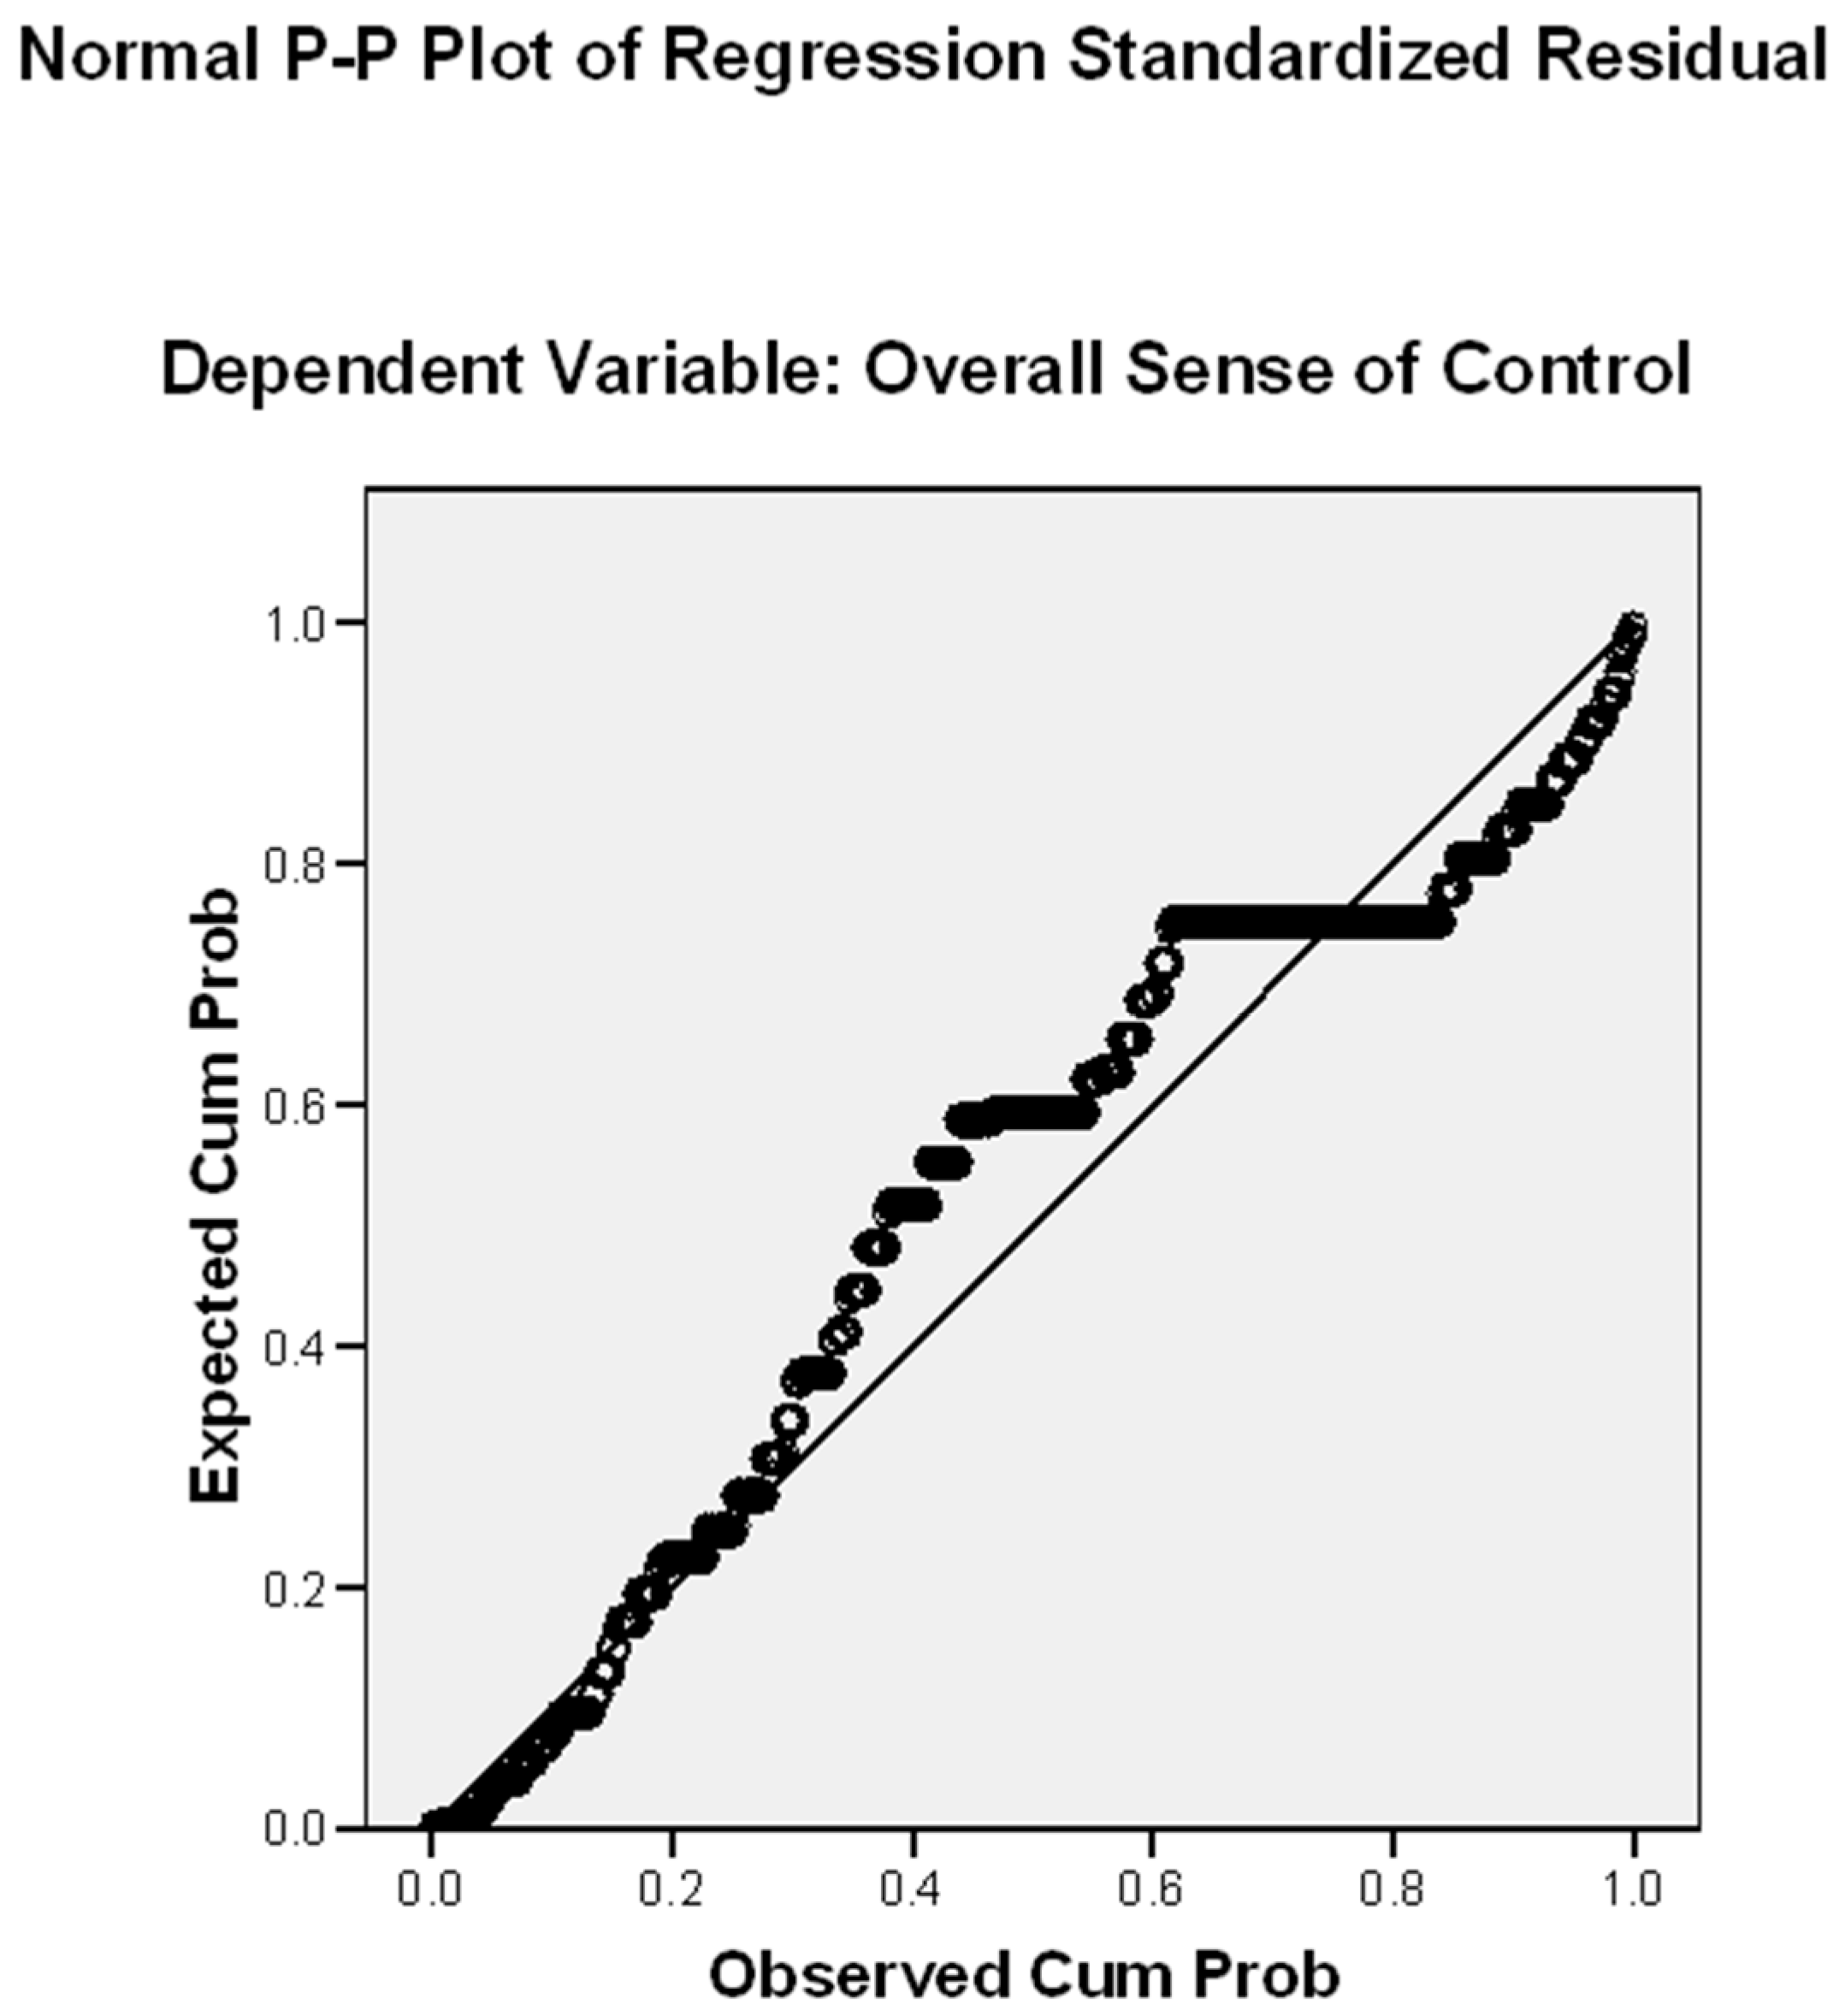
The residual analysis confirms the model’s statistical appropriateness, with normally distributed errors (M = −9.22, SD = 0.99) and homoscedasticity.
Figure 2’s linear probability plot visually reinforces this finding, displaying the expected linear relationship between personalization practices and perceived control. The standardized residuals cluster closely around the regression line, with no obvious patterns or outliers that would violate ordinary least squares assumptions.
The strong model fit indicates that personalization strategies—object management, display freedom, protection from intrusion, placement choice, and object permanence—collectively contribute to elderly individuals’ experience of autonomy in their domestic environments. This finding aligns with environmental psychology theories, positing that territorial marking behaviors serve fundamental human needs for control and self-expression [
10,
16].
Space personalization and control of opinion: The regression analysis demonstrated a significant positive relationship between space personalization and control of opinion (F (1, 586) = 81.44,
p < 0.001), as shown in
Table 4. The model accounted for a meaningful portion of variance in opinion control scores (R
2 = 0.12), with residual analysis confirming good model fit (M = −3.57, SD = 0.99). Reporting medium effect per [
70]. Cohen’s *d* = 0.56 for personalization–control linkage indicates practical significance. The medium effect sizes (R
2 = 0.12–0.16) indicate personalization explains 12–16% of variance—a meaningful impact given socio-cultural confounders, such as gendered space norms [
7].
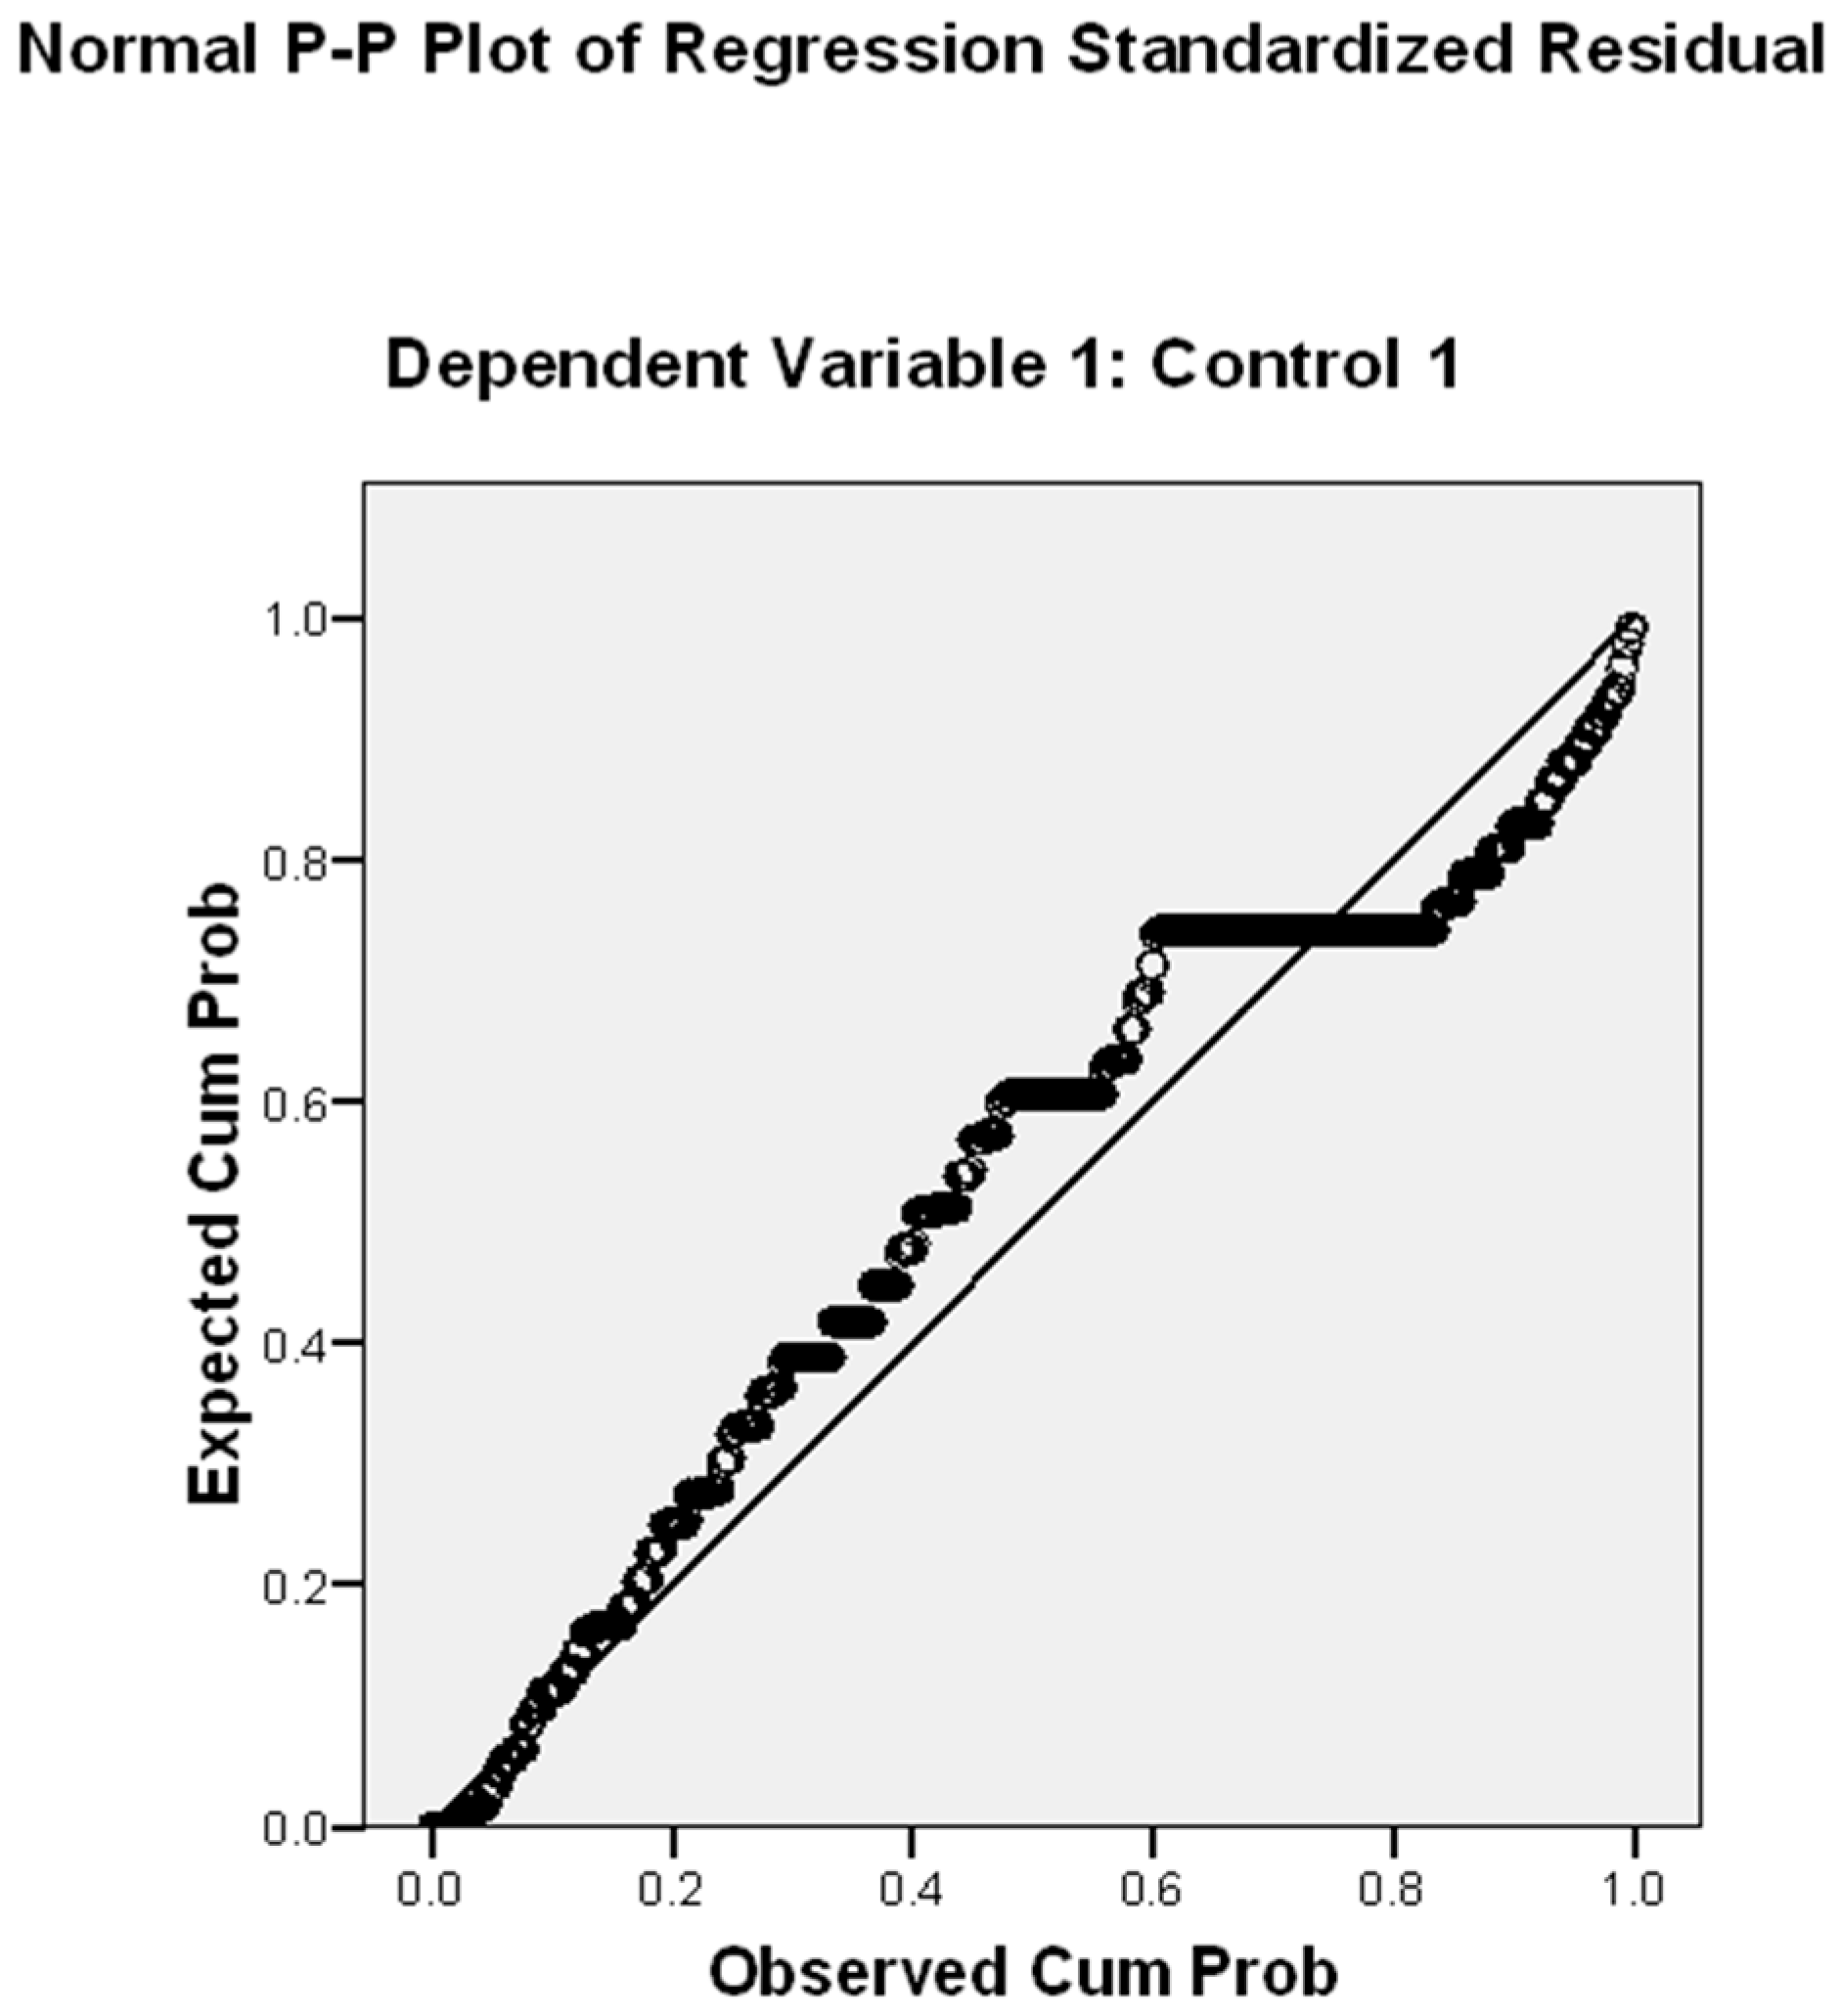
Figure 3 illustrates the linear relationship through a probability plot, where standardized residuals are distributed normally around the regression line, validating the model’s assumptions.
Space personalization and control of activities: Similarly, personalization significantly predicted control over daily activities (F (1, 586) = 92.61,
p < 0.001), as presented in
Table 5. The slightly stronger effect size (R
2 = 0.14) compared to opinion control suggests personalization’s particular importance for maintaining functional autonomy. Reporting medium effect per [
70]. Cohen’s *d* = 0.56 for personalization–control linkage indicates practical significance. The medium effect sizes (R
2 = 0.12–0.16) indicate personalization, explaining 12–16% of variance—a meaningful impact given socio-cultural confounders, such as gendered space norms [
7]. Residual diagnostics again indicated excellent model fit (M = −3.68, SD = 0.99), with
Figure 4’s probability plot demonstrating the expected linear pattern.
Qualitative findings provided a deeper contextual understanding of how personalization influences elderly control over daily activities and spaces, complementing the quantitative results. Participants described maintaining active engagement in permitted activities across various domestic and community spaces, with interior spaces, such as living rooms (72% of respondents) and kitchens (65%) hosting traditional practices, such as coffee preparation and textile crafts, while exterior spaces including gardens (58%) and local mosques (49%) facilitated community participation. These activities were enabled by several key factors, including the availability of designated personal spaces (78% of cases), established daily routines (63%), and family recognition of elders’ expertise (41%). Conversely, restrictions emerged primarily around physically demanding tasks (reported by 82% of those with mobility issues), spaces requiring technical knowledge, such as smart home systems (noted in 57% of technologically limited households), and activities conflicting with younger family members’ schedules (36%). Both data types converged in identifying three primary mediating factors: the physical environment through home layouts enabling personalization, social dynamics through family attitudes toward elder autonomy, and cultural values through traditional notions of appropriate elder roles. This blended analytical approach yielded both statistical confirmation of relationships and nuanced understanding of personalization’s daily manifestations, with consistent alignment between quantitative effect sizes and qualitative reports strengthening confidence in the findings, while residual diagnostics verified appropriate modeling techniques were employed throughout the study.
Space personalization components with control: The examination of specific personalization components revealed differential impacts on elderly individuals’ sense of control. A one-way ANOVA analysis demonstrated that age-group conflict significantly influenced overall sense of control (F (5, 586) = 18.05,
p < 0.001), accounting for approximately 13% of variance (
Table 6). This robust effect size indicates that reduced intergenerational intrusion corresponds with enhanced perceived control among elderly participants.
Personalization Style (Types of Objects) with Control: Notably, neither personalization style (traditional vs. modern objects: F (5, 586) = 1.58,
p = 0.16), nor reasons for object display (F (5, 586) = 1.91,
p = 0.09) showed statistically significant associations with control measures. However, descriptive trends merit discussion despite this non-significance (
Table 7 and
Table 8). Modern personalization items showed marginally higher control scores (M = 4.10, SD = 0.98) compared to traditional items (M = 4.03, SD = 1.11), while objects displayed for control-related purposes demonstrated the highest mean scores (M = 4.41, SD = 0.98) among personalization reason categories.
Age–Group Conflict with Control: The analysis of age-group conflict yielded particularly compelling results (
Table 9 and
Table 10). Participants reporting no intergenerational conflicts exhibited substantially higher control scores (M = 4.36, SD = 1.00) than those experiencing conflict with younger household members (range: M = 3.39–3.90). This pattern remained consistent across both linear (F (1, 586) = 58.70,
p < 0.001) and non-linear (F (3, 586) = 3.44,
p = 0.017) components of the relationship, suggesting a robust, multifaceted association between reduced age-related conflict and enhanced autonomy.
Of 587 participants, 42 were aged 80+. While formal comparisons were limited by sample size, 80% reported modifying their homes for mobility (vs. 50% in younger groups), and interviews highlighted demands for caregiver proximity. Future work should expand this subgroup.
The qualitative findings reveal a complex interplay between objects, spaces, and meanings in elderly Jordanians’ personalization practices. Traditional cultural artifacts, such as coffee preparation tools (dallah, mehmas, and mehbash), emerged as particularly significant, serving dual roles as functional household items and powerful cultural symbols, while religious objects, such as prayer beads (masbaha) and Quranic calligraphy, provided both spiritual comfort and subtle spatial demarcation of sacred areas. Personal memorabilia, including photograph albums and biographical documents, acted as tangible connections to personal and family history, with participants frequently describing these items as windows to my past that maintained biographical continuity. Analysis of display locations uncovered distinct gender-based patterns, with female participants predominantly curating meaningful objects in private spaces, such as bedrooms (68% of cases), and male participants more frequently displaying items in shared areas, such as living rooms (62%). The most meaningful objects (72%) occupied regularly used spaces where they remained visible and accessible, though storage limitations constrained 28% of participants’ ability to preserve valued possessions, revealing how spatial availability and household norms shape personalization practices.
Participants described three primary utilization patterns for personalized items, with daily utilitarian purposes dominating (61% of described objects), followed by memory preservation (23%), particularly for objects connected to significant life events, and status signaling (16%), where items communicated social standing. Many objects transcended single categories, as exemplified by traditional coffee sets that simultaneously served practical use, symbolized hospitality values, and evoked personal memories. The qualitative data particularly illuminated how intergenerational relationships mediated object significance, with younger family members’ attitudes creating complex dynamics–when valued, these objects became bridges between generations (39% of positive reports), but when dismissed as old-fashioned, they became sources of tension (27% of conflict mentions). This finding directly complements quantitative results showing age-group conflict’s moderating effect, suggesting personalization’s psychological benefits depend heavily on family validation. Several participants described painful experiences when prized possessions were moved or discarded without consultation, framing these acts as fundamental challenges to their domestic authority and identity maintenance, revealing the profound emotional stakes embedded in material culture.
4.2.2. Hypothesis 2: Control with Socio-Economic Factors
The multiple regression analysis examining socio-economic predictors of elderly control revealed several significant relationships (
Table 11). The full model demonstrated strong explanatory power (F (8, 586) = 13.31,
p < 0.001), accounting for 22% of variance in overall sense of control (R
2 = 0.22).
The multiple regression coefficients (
Table 12) reveal distinct patterns in how socio-economic factors influence elderly individuals’ sense of control. Six variables demonstrated statistically significant associations at
p < 0.01, with their relative contributions ranked by effect size. Positive Predictors: Age showed the strongest positive association (t = 4.59, β = 0.20), suggesting that advancing age correlates with greater perceived control within Jordanian households. This may reflect accumulated social capital and traditional elder respect. Private room access (t = 3.49) and number of rooms (t = 3.33) similarly enhanced control perceptions, indicating the crucial role of personal space in maintaining autonomy.
Negative Predictors: The number of family members cohabiting displayed the strongest negative effect (t = −4.59), revealing how crowded living conditions can constrain elderly autonomy. Gender (t = −3.23) and marital status (t = −2.87) followed as significant negative predictors, with male and married participants reporting greater control. These patterns likely reflect Jordan’s cultural norms regarding household authority structures.
Null Effects: Home ownership and length of residence showed no significant associations (p > 0.05), suggesting that tenure security matters less than spatial arrangements for elderly autonomy. The directionality of these relationships provides important insights–while private space and social standing enhance control, competing household needs and traditional gender roles may diminish it. These socio-economic patterns complement the established personalization effects, jointly explaining 22% of the variance in control perceptions.
Model Validation: Residual analysis confirmed the model’s appropriate specification with normally distributed errors (M = 2.69, SD = 0.99). The linear probability plot (
Figure 5) visually demonstrates the satisfactory model fit, with residuals randomly dispersed around the regression line. This indicates the linear regression assumptions were adequately met.
4.2.3. Interaction for Urban vs. Rural Differences in Personalization Effects on Control
To examine urban–rural disparities in autonomy, we conducted a linear logistic regression analyzing how governorate type (urban: Zarqa, Irbid; rural: Ajloun, Jerash, Balqa, Madaba) predicts overall sense of control, while controlling for age, gender, household size, and private room access (
Table 13). The model explained 22% of variance (R
2 = 0.22, F (8, 586) = 13.31,
p < 0.001), with rural residency emerging as a significant positive predictor (β = 0.22,
p < 0.001 vs. urban β = 0.18). Private room access amplified this effect (β = 0.37,
p < 0.001), particularly in rural areas (interaction β = 0.15,
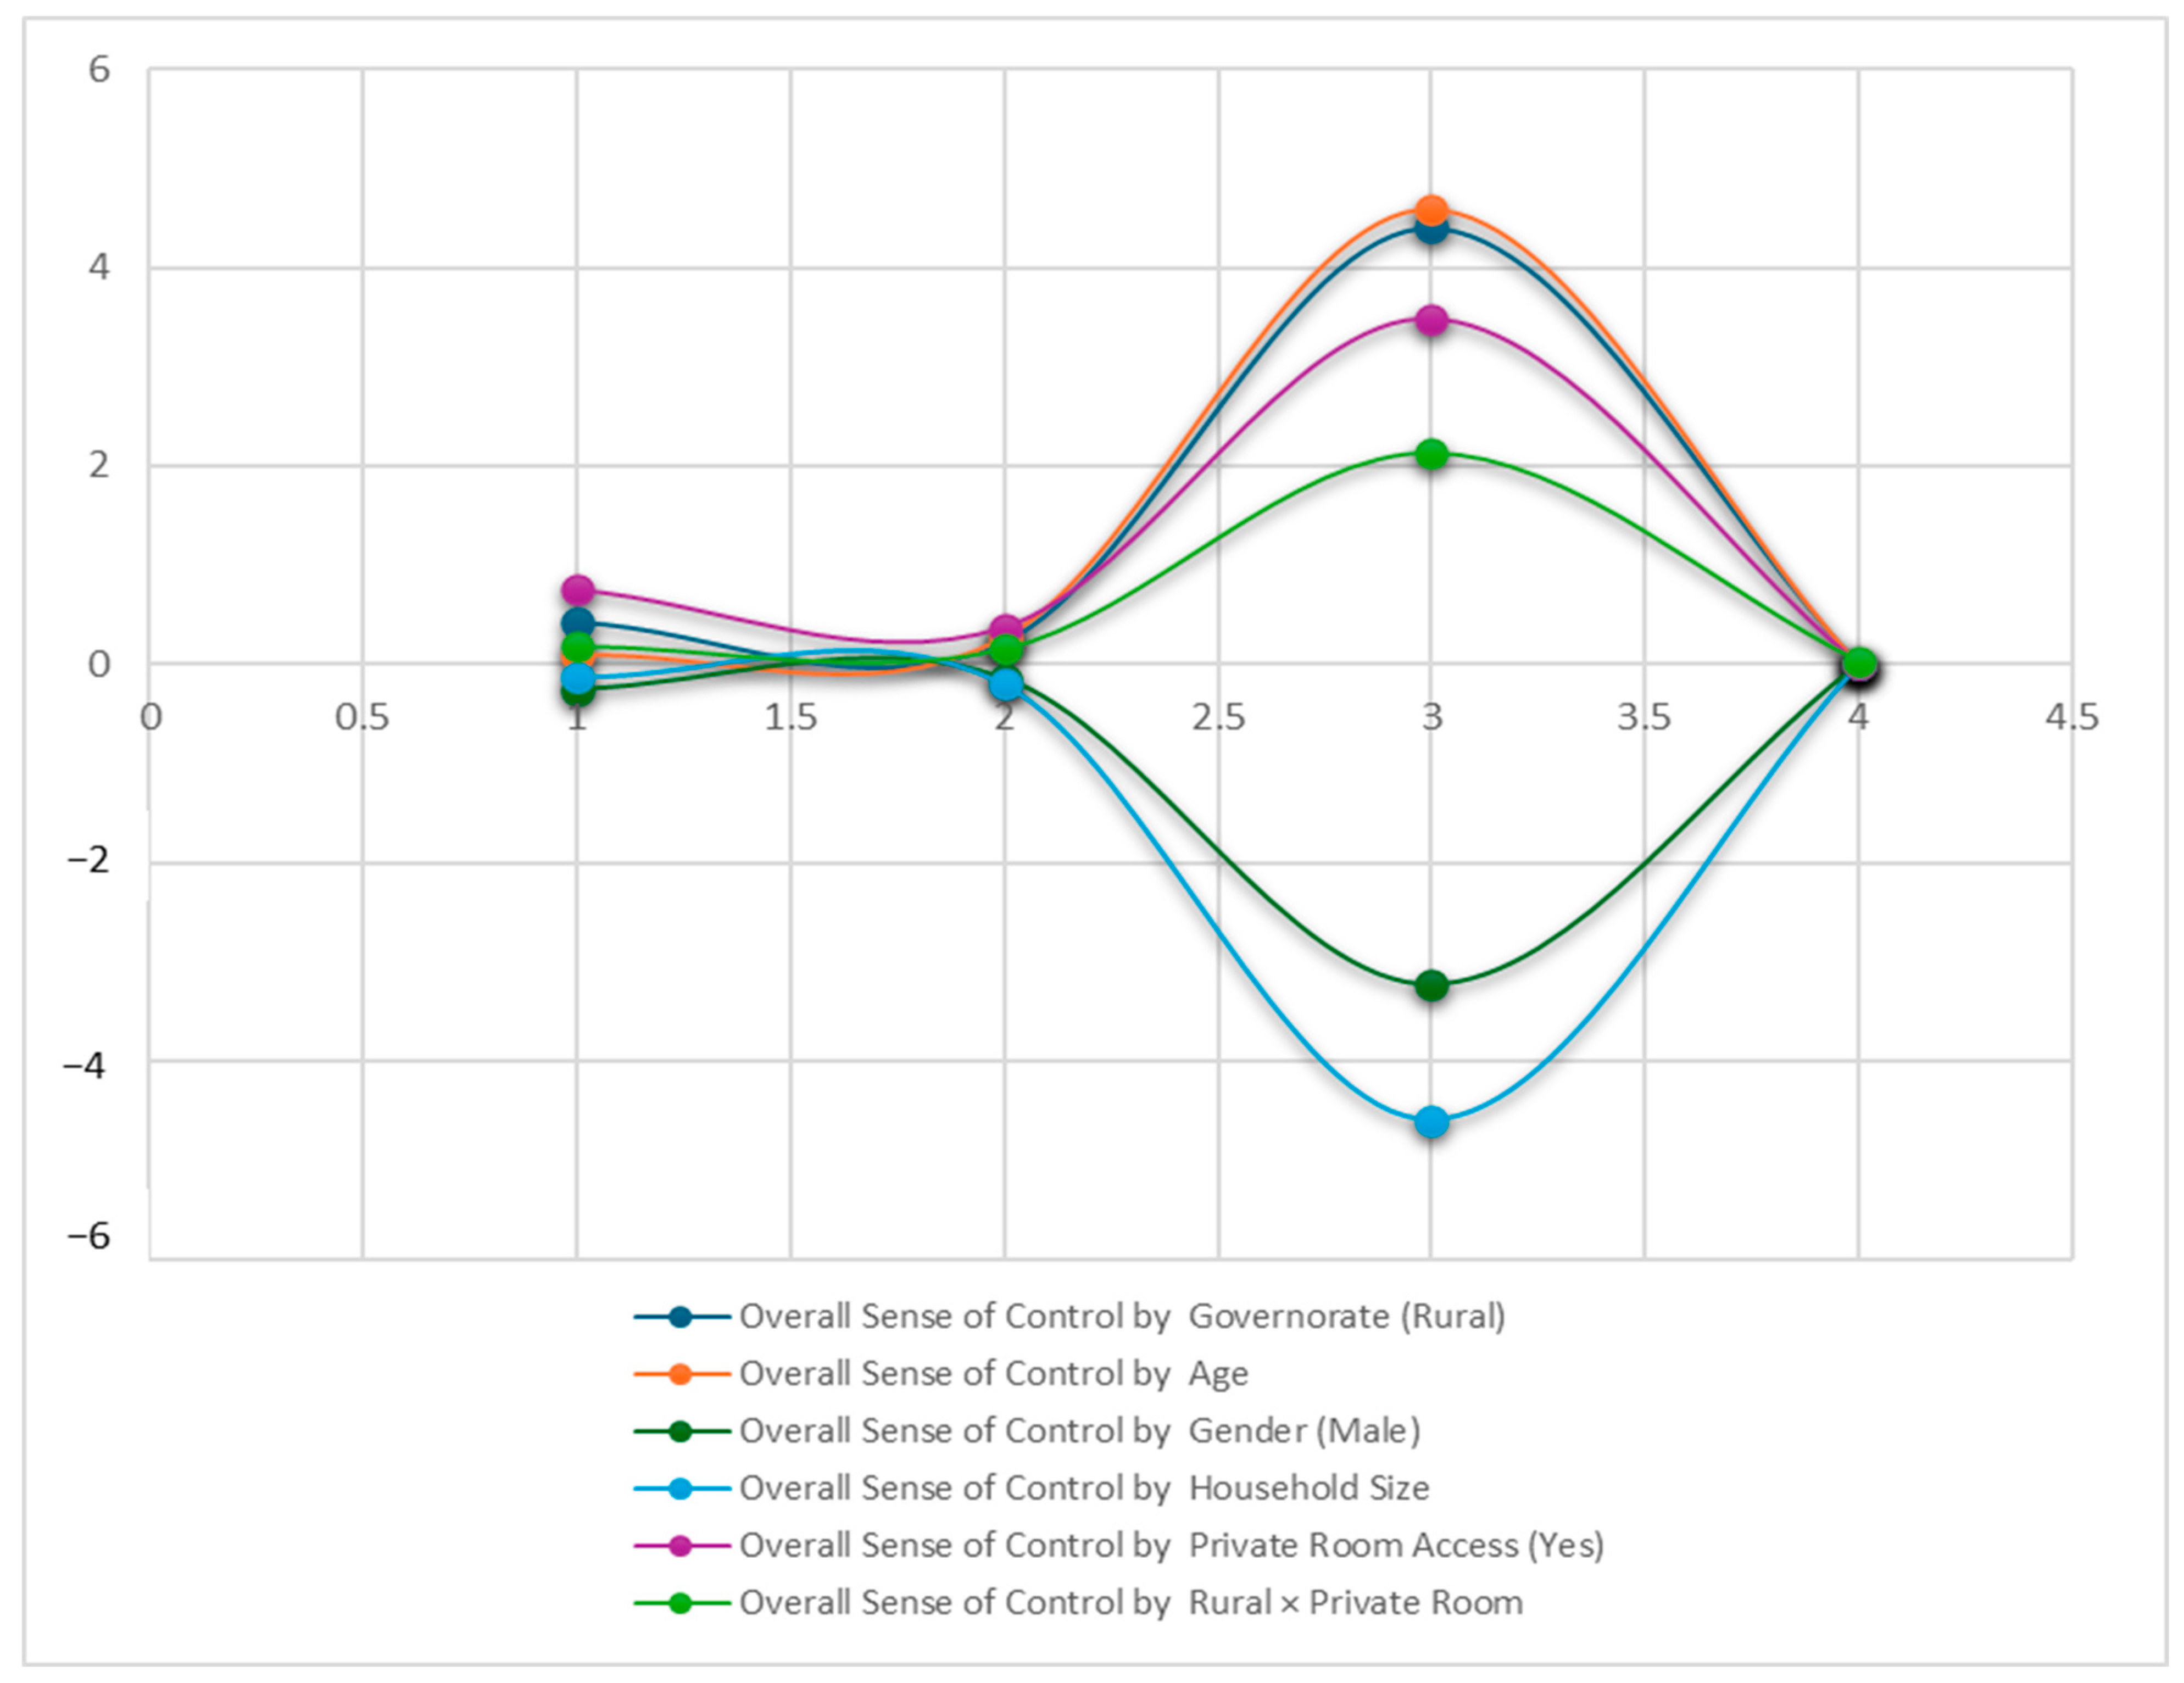
p = 0.03) (
Figure 6), where adaptable courtyard designs [
8] facilitated personalization. Urban elders faced constraints from fixed apartment layouts [
20], reflected in lower control scores (urban M = 4.08, rural M = 4.36 with private rooms). Notably, 57.6% of rural participants reported no intergenerational conflicts over space (vs. 42.4% urban), suggesting traditional housing buffers autonomy erosion. Household size negatively impacted control (β = −0.20,
p < 0.001), underscoring crowding as a universal challenge. These quantitative findings align with qualitative reports of rural elders leveraging flexible spaces (e.g., movable prayer corners), while urban participants struggled with rigid environments.
Predictors of Elderly Autonomy in Jordan (
Figure 6): Rural residency, private room access, and smaller households significantly enhanced perceived control. Interaction effects show that rural elders benefit more from private spaces (β = 0.15). The model controls age and gender.
Personalization has an impact on control by region. Rural participants (β = 0.22,
p < 0.001) benefited more than urban counterparts (β = 0.18,
p < 0.01) (
Figure 7), likely due to adaptable courtyard homes [
8]. Error bars show 95% CIs. As
Figure 6 illustrates, rural elders’ control scores increased more sharply with personalization (β = 0.22) than urban dwellers (β = 0.18), suggesting traditional housing layouts enhance efficacy.
