Article

Dynamic Evaluation for Subway–Bus Transfer Quality Referring to Benefits, Convenience, and Reliability

School of Rail Transportation, Soochow University, Jixue Road No. 8, Suzhou 215131, China
*
Author to whom correspondence should be addressed.
Sustainability 2025, 17(15), 6684; https://doi.org/10.3390/su17156684
Submission received: 7 May 2025 / Revised: 7 July 2025 / Accepted: 13 July 2025 / Published: 22 July 2025

Abstract

The integration of urban bus and subway services is critical for attracting passengers and for the sustainable development of public transit, as it helps to boost ridership with an extensive service that combines the attractions of buses and subways. To identify barriers in transferring from bus to subway or vice versa at different periods of the day, this research develops the popular evaluation indices found in the literature and revises them to reflect the most critical attributes of transfer quality. Thus, the deficiencies of transferring from subway to bus or vice versa are independently examined. Motivated by the changes in the indices at different periods, the day is divided into multiple periods. Then, dynamic transfer-volume-based TOPSIS is developed, instead of assigning index weights based on period sequence. The index weight is revised to emphasize the peak periods. Taking a case study in Suzhou, the barriers to inter-modal transfer are identified between subways and buses. It is found that subway-to-bus transfer quality is only one-third of that of bus-to-subway transfers due to the great changes in bus runs (19–45 vs. 14–26), lower bus coverage rates (0.42–0.47 vs. 0.50–0.55), and larger deviation of connected POIs (9.0–9.4 vs. 1.1–1.8), as well as the lower reliability of connected bus lines (0.3–0.47 beyond peaks vs. 0.58 and 0.96). Multi-faceted implementations are recommended for inter-modal subway-to-bus transfers and bus-to-subway transfers, respectively. The research provides insights on enhancing bus–subway transfer quality with finer detail into different periods, to encourage the loyalty of transit passengers with more stable and reliable bus as well as transit service.

1. Introduction

Transfer extends public transit service both intra-modally and inter-modally to better attract passengers and enhance its sustainability [1]. Transfer provides passengers with more choices to reach destinations that may be inaccessible by a single route or mode. Transfer is also emphasized as a way to connect newly built subway routes with neighboring bus routes to deliver passengers extensively. According to the statistics, 48% of subway trips are connected to bus trips in Melbourne [2], and 56% of commuters make a single transfer between bus and subway in Madrid. Note that transfer impedance is significantly larger compared with in-vehicle time [3], where passengers can be faced with more tasks and difficulties, including getting out of the current vehicle, walking to the connection point, keeping an eye on the coming vehicle, and getting onto the target vehicle. In addition, passengers usually get impatient and complain a lot when they wait a long time at transfer points [4]. Thus, transfer evaluation and the pertinent improvement of the identified weak attributes may significantly improve the quality of connected public transit services. Also, a comprehensive bus-transit transfer level may extend the research on integrated public transit for resilient and high-quality trip services [5,6,7,8].
Transfer evaluation includes two fundamental components, i.e., evaluation indices and evaluation methods, which can be developed for bus–bus, subway–subway transfer, and bus–subway transfer. For bus–bus transfers, it is found that long waits at transfer points strongly drive the reduction and cessation of transit use [9]. Actually, a long wait is one of the most negative experiences of riding a bus, which is comparable to the delay of being unable to board a crowded bus. To diagnose transfer problems, the indices of the number of connected lines, average transfer distance, average wait time, and the proportion of transfer volume at the transfer stop are incorporated into data envelop analysis, where the transfer nodes with high transfer rate and transfer volumes receive higher evaluation scores [10]. Moreover, transfer is more attractive to passengers with mandatory trip purposes, while it is not statistically related to trip distance [11]. To decode the factors of transfer behaviors, the attributes of bus service frequency, reliability, bus stop locations, travel time, night service, comfort, and information provision are analyzed, finding that bus service reliability and frequency are critical to transfer, followed by comfort, information, and night service [12]. The timeliness of bus service is also proven to be the most effective measure to improve the overall transfer satisfaction [13].
For subway–subway transfer, factors such as a long walking distance [14], crowded transfer environment, and walking up/down stairs [15] strongly affect transfer efficiency and reduce passenger transfer satisfaction. Compared to the above factors, the fare for subway transfers is less important [16]. In addition to the above indices, the attributes of information facilities, the area of waiting spaces, station temperature, and facility convenience can also be employed to evaluate transfer quality [17]. It is also found that transfers between different subway lines can be less efficient if they are managed by different operators [14]. Further, studies on transfer indices may come to different results for different cities due to passengers’ sensitivity to the same indices. For example, the indices of physical factors of accessibility, road crossings, and vertical circulation influence transfer comfort to a greater degree in India compared to Germany [18].
When it comes to bus–subway transfers, it is found that wait time at bus stops is the most important factor affecting transfer experience in Bangkok, Thailand [19]. Factors such as safety and security, transfer environment, signposting, comfort, convenience, and accessibility are also important in the assessment of bus and subway transfer [20]. Specifically, bus arrival frequency is the weakest point in subway–bus transfer [21], and transfer penalty is a critical factor in transfer satisfaction [22]. Short transfer distances and high service frequency may well improve transfer efficiency [23]. For a more detailed transfer evaluation, the crowdedness of buses and walking distance are determinants of bus–subway transfer satisfaction, and bus punctuality and walking environment are closely related to transfer quality [24]. Weather also significantly influences transfer behaviors, which are discouraged with high temperatures, heavy rain, low visibility, or strong wind [25]. In addition, the coverage rate of points of interest (POIs) [26,27,28] and connection reliability [29,30,31] at connected stops also have a great impact on subway–bus transfer. Population density also positively affects subway–bus transfer efficiency, while company density works negatively in Seoul [32].
Further, inter-modal transfer evaluation can be distinguished between bus-to-subway and subway-to-bus transfers. To the best of our knowledge, there is very limited research that separates bus-to-subway transfer analyses from those of subway-to-bus. One exception is that Wu et al. [33] distinguish the impact of weather variables on bus–subway and subway–bus, pointing out that strong wind, heavy rain, and high temperature increase transfer ridership of the subway-to-bus mode, but reduce that of bus-to-subway transfer. Thus, we identify the research gap in the separate discussion of inter-modal transfer either from subway to bus or the opposite. That is critical for understanding the overall transfer experience, which plays a pivotal role in designing effective transfer systems.
Table 1 summarizes the commonly used indices in designing in public transit transfer evaluation with references to the relevant studies. Drawing on the well-accepted and popular indices on the inter-modal transfer between bus and subway services, categorization into benefits, convenience, and reliability is proposed. Note the subjective index of transfer comfort is not involved in the research, because of its variation and uncertainty in passenger feeling.
A comprehensive evaluation method is employed to quantify the level of transit transfer across multiple dimensions. The popular methods include the techniques for order preferences by similarity to ideal solutions (TOPSIS), analytic hierarchy process [34], grey evaluation method [35], and data envelopment analysis [10,25,36]. Among these methods, TOPSIS provides the optimal alternative with the shortest distance to a positive ideal solution and the longest distance from a negative ideal solution [37], which has been widely applied to the transportation evaluation of service quality, customer satisfaction, and sustainability, etc. For example, TOPSIS may be adopted to evaluate public transit service [38] or evaluate airline efficiency [39]. Note that TOPSIS primarily focuses on horizontal static data, failing to consider index changes over time [40].
Oriented to the dynamic index values throughout a day, TOPSIS can be incorporated with the time dimension to reflect the different index levels in the different periods [41]. For example, dynamic TOPSIS makes use of panel data to rank the green development level of coal-resource-based cities at different stages to propose the corresponding policy recommendations [40]. Considering the temporal variation in subway–bus transfer levels, dynamic TOPSIS is employed to calculate the index levels and weights in the different periods. This allows us to dig into the periodic difference in the transfer quality between subway and bus services, which may change rapidly in the different periods. If we do not divide a day into multiple periods, we can come to only one value for a whole day, which is not capable of reflecting the changes and the difference in transfer quality throughout a day. To examine transfer quality in detail and to trace the changes in transfer quality, we divide a day into discrete periods and the index value and weight are calculated in response for a delicate description of transit transfer.
The contributions of the research are three-fold. First, an improved index system for transfer evaluation is established, focusing on transfer benefits, convenience, and reliability. The index system is based on real-world data and applicable to both subway-to-bus and bus-to-subway inter-modal transfers. Specifically, we incorporate the evaluation indices of the count of connected runs, coverage rate of connected stops/stations, count of connected POIs, transfer time, transfer distance, connection line reliability, and transfer time variability. Second, dynamic evaluations of bus–subway transfer are implemented with a revised method of the existing dynamic TOPSIS [40,41], which assigns weights based on the transfer volume of each. In the proposed method, the period with a higher transfer volume is given more weight. Third, the proposed indices and methods are validated with an empirical case study, where transfer quality is evaluated dynamically for both subway-to-bus and bus-to-subway transfer. The case study reveals that the quality of subway-to-bus transfer is significantly lower than that of bus-to-subway, which inspires recommendations for multi-faceted improvements in inter-modal transfer aimed at enhancing transfer quality in both directions.
The remainder of the paper is organized as follows. Section 2 defines the indices of bus–subway transfer evaluation, followed by the data extraction and dynamic TOPSIS Section 3. Section 4 presents a case study and discusses the results to validate the proposed index system and evaluation method. Section 5 concludes the paper.

2. Indices for Bus–Subway Transfer Evaluation

Bus–subway transfer allows passengers to make use of both bus and subway services, extending their travel options and improving availability to more destinations in a convenient and reliable manner. To evaluate transfer quality, a comprehensive set of indices is established, focusing on three main indices: transfer benefits, convenience, and reliability. Table 2 summarizes the index system used in the research to categorize these indices accordingly. The notations D + and D refer to the set of positive and negative indices, respectively.

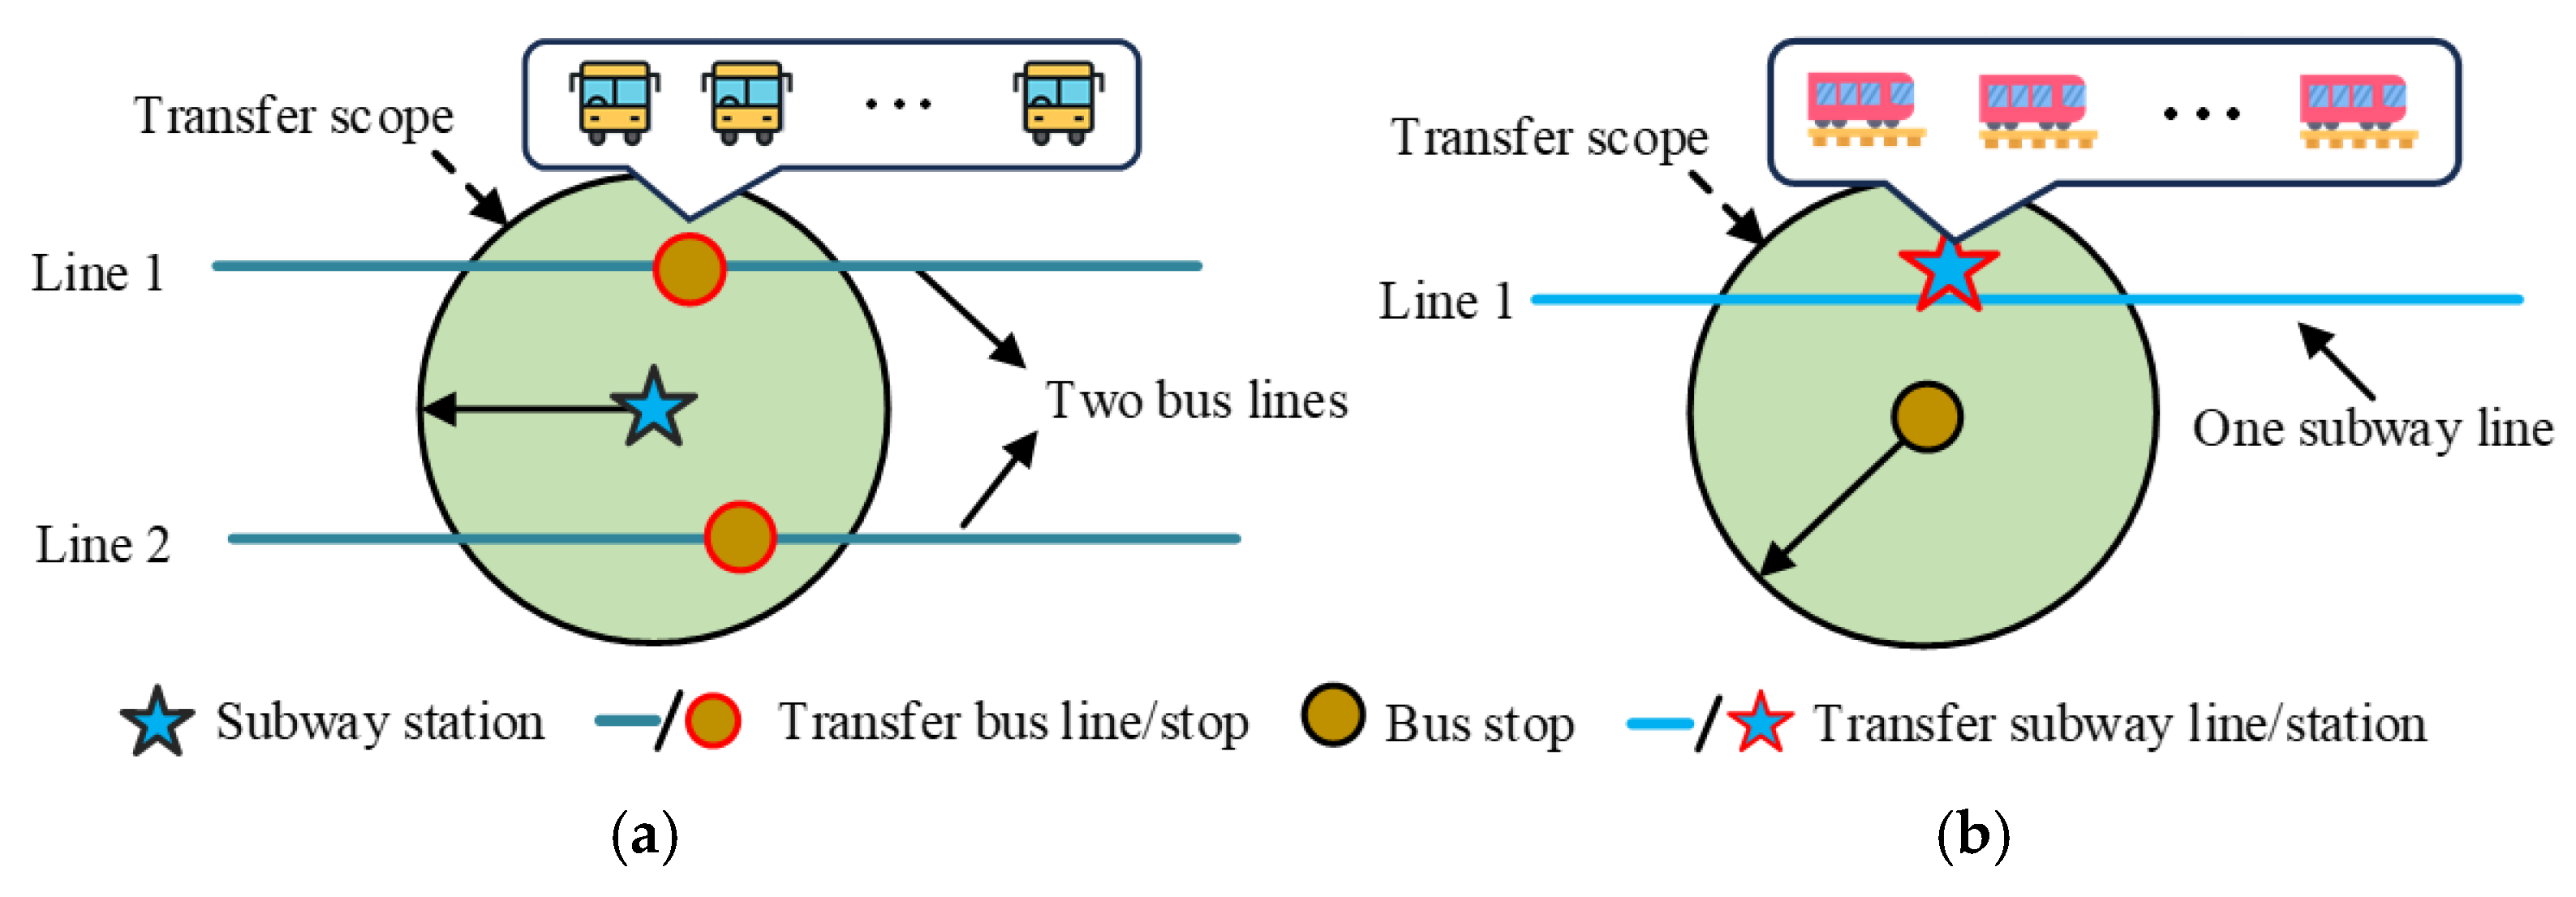
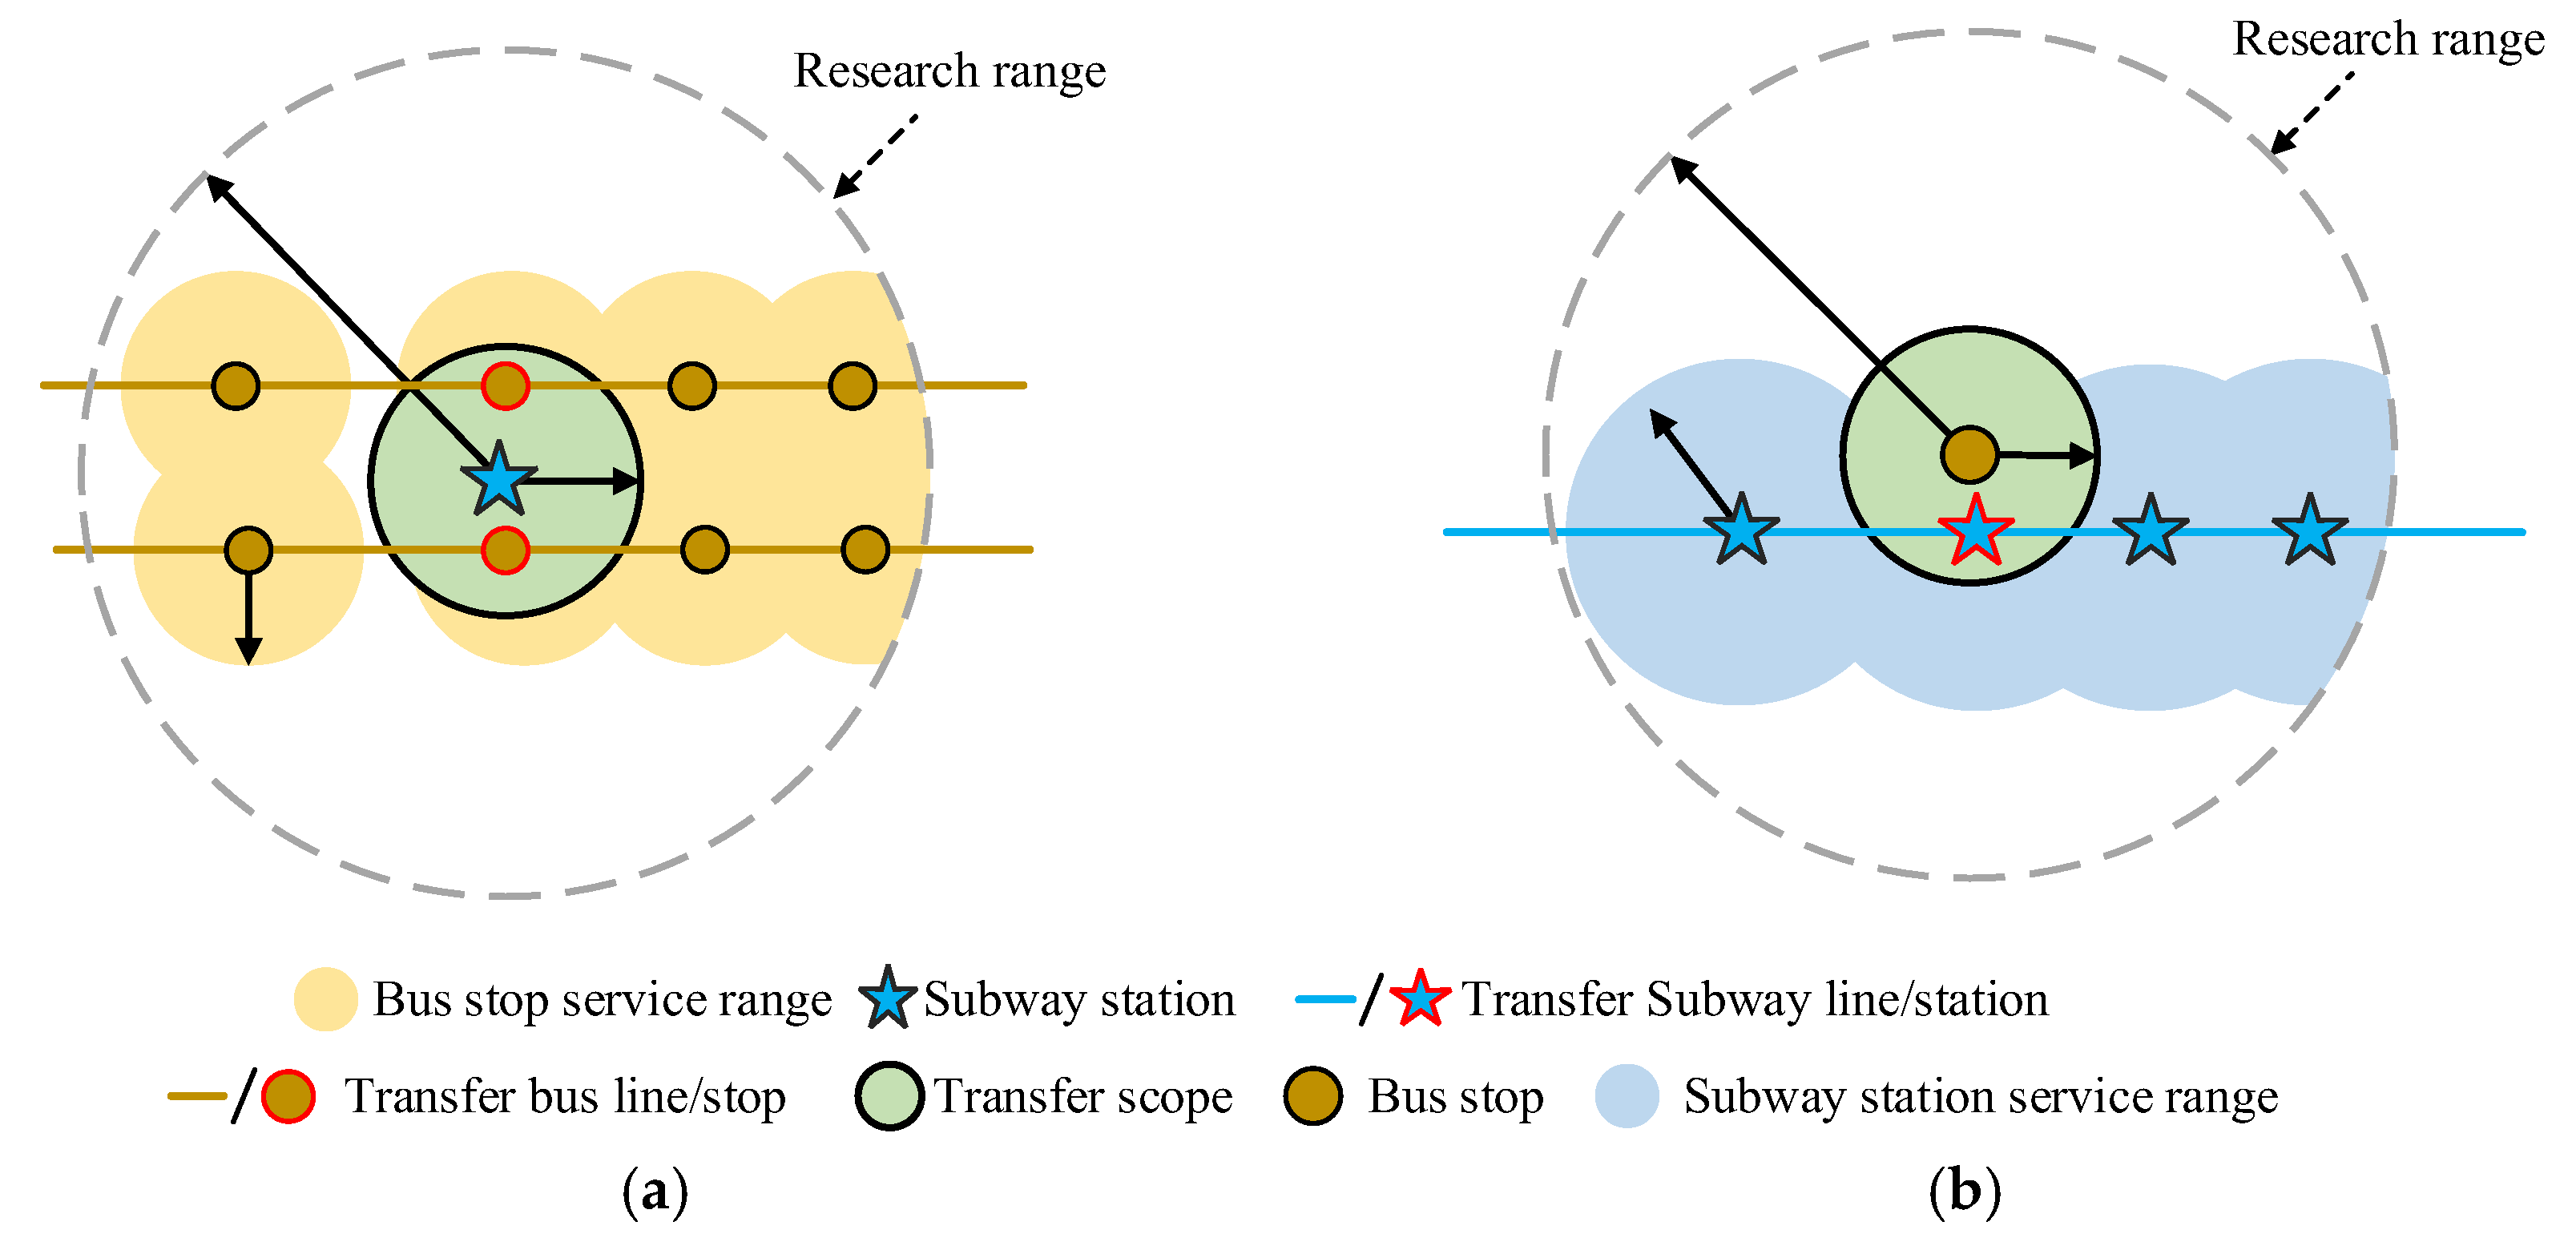
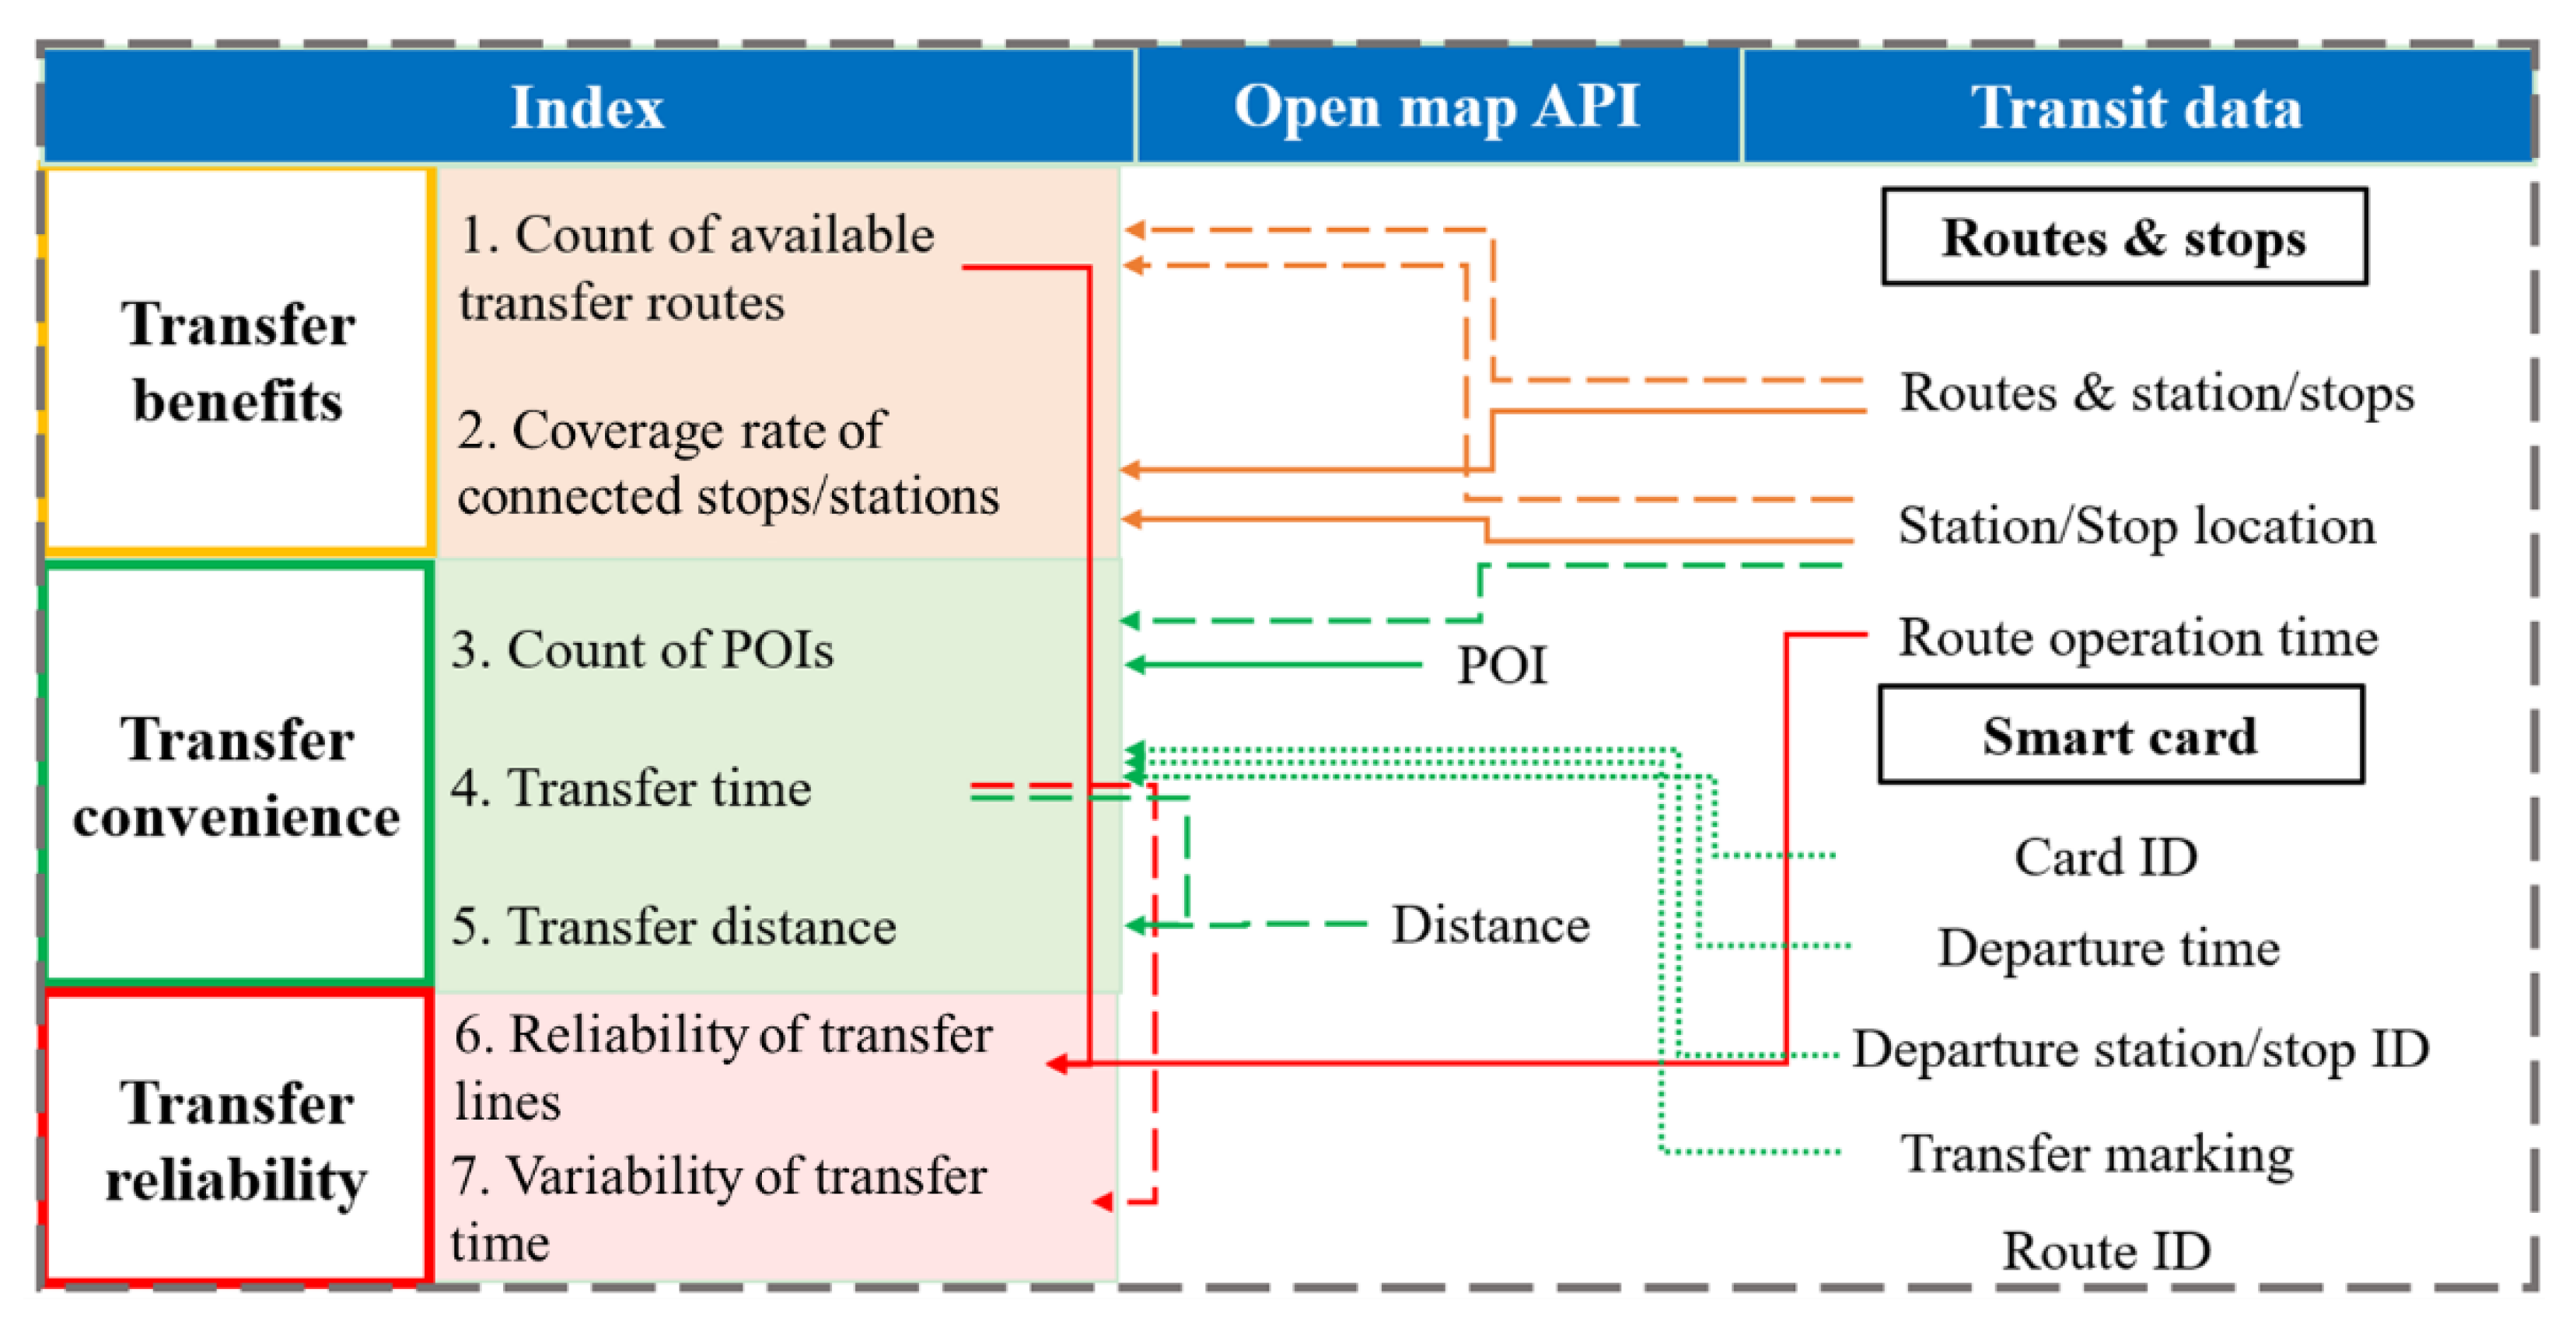
2.1. Transfer Benefits

Transfer benefits refer to the service advantages that passengers gain from the transfer process. Specifically, this includes the ability to reach a wider range of destinations via transfer between subway and bus services. The key indices for assessing transfer benefits include the following three.
Count of connected runs. This index measures the average number of buses or subway vehicles that can be taken within the transfer range, typically between 200 to 800 m [42] from the transfer point. That is, the count of connected runs is the sum of service frequency of each route at the transfer point. Thus, when one transfer point is connected to high-frequency routes, the index returns a higher evaluation result to reflect the advantages of a frequent transit service. Figure 1 shows the conception of the count of connected runs.
The index of connected runs is given by
R s , j t = i = 1 N s , j t f i t H t
R b , j t = i = 1 N b , j t f j , i t H t
where R s , j t and R b , j t refer to the count of connected buses at subway station j or connected subway trains at bus stop j in the period t , N s , j t and N b , j t represent the count of bus lines connected to subway station j or subway lines connected to bus stop j in period t , f i t represents the count of service shifts of route i in period t , and H t is the count of hours in period t .
Coverage rate of connected stops/stations. This index evaluates the spatial reach of the transfer network. It is calculated as the ratio of the total service area covered by the connected stops and stations to the defined research range. This helps us to access how well the transfer point connects passengers to various destinations. Figure 2 shows the conception of the coverage rate of connected stops/stations.
Count of connected POIs. This index considers the number of significant geographical points, such as shopping malls, officials, residential areas, and parks, that are accessible from the transfer point [43]. A greater number of connected POIs indicates more potential benefits for passengers using the transfer point [44]. Figure 3 illustrates the conception of the count of connected POIs in the service range of the transfer point.

2.2. Transfer Convenience

Transfer convenience refers to how easily passenger can navigate the transfer process, minimizing delays and making the experience more efficient. The main indices used to evaluate transfer convenience include the following two.
Transfer time. This refers to the time passengers spend transferring from one vehicle to another. It includes in-station and out-of-station walking times and the waiting time at the transfer point. The transfer time is weighted according to transfer volume to reflect the actual passenger experience at different times. Figure 4 illustrates the meaning of transfer time, which is composed with in-station walk, out-station walk, and wait time at the transfer point. Note the in-station walk time is collected with filed survey, and the time between tap-out/in and swiping on the bus is collected with a smart card.
Transfer time is given by
T s , j ¯ t = i = 1 M j t p j , i t × t j , i t 85 % 15 % i = 1 M j p j , i t
T b , j ¯ t = i = 1 B j t p j , i t × t j , i t 85 % 15 % i = 1 B j p j , i t
where T s , j ¯ t and T b , j ¯ t are the transfer time at subway station j or bus stop j in the period t ; parameters M j t and B j t are the number of bus stops connected to subway station j and the number of subway stations connected to bus stop j in the period t , respectively; p j , i t and t j , i t mean the transfer volume and transfer time from transfer point j to the connected point i in the period t . Note that the passenger transfer time may vary greatly. Here, transfer time extracted with smart card data is refined between the 15th and 85th percentile value, to avoid extremely small or large values that are related to non-transfer activities.
Transfer Distance: This index measures the physical distance between the transfer point and departure point. A shorter transfer distance contributes to a smoother, easier transfer experience. The transfer distance of subway-to-bus and bus-to-subway is given by
D s , j ¯ t = i = 1 M j t p i , j t × d j , i i = 1 M j t p i , j t
D b , j ¯ t = i = 1 B j t p i , j t × d j , i j = 1 B j t p i , j t
where D s , j ¯ t and D b , j ¯ t are the average transfer distance of subway station j or bus stop j in period t , respectively; d j , i refers to the distance between transfer point j and the connected point i .

2.3. Transfer Reliability

Transfer reliability accesses the consistency and predictability of the transfer process. This is critical for ensuring passengers’ trust in the service, particularly during peak times of periods of high demand. The relevant indices for evaluating transfer reliability are the following two.
Reliability of connected lines. This index quantifies the reliability of the connected bus and subway lines by comparing the number of routes in operation to the total available routes. A higher ratio indicates more reliable service. Figure 5 illustrates the changes in the count of connected lines at a subway transfer station. That is, bus and subway routes may start and end service at different times of the day, causing changes in the count of the lines connected to a transfer point [45].
The reliability of connected lines is given by
C s , j t = M j t m a x t M j t
C b , j t = B j t m a x t B j t
where C s , j t and C b , j t refer to the connection reliability of subway station j or bus stop j in the period t ; M j t and B j t are the number of remaining connected bus or subway lines of subway or bus station j in period t .
Variability of transfer time. It measures the fluctuation in transfer times between subway and bus services. A higher variability suggests greater uncertainty in transfer times, negatively impacting the transfer experience. Here, the standard variation in transfer time [46] is adopted to represent transfer time variability, given by
R s , j t = i = 1 M j p j , i × S j , i i = 1 M j p j , i
R b , j t = i = 1 B j p j , i × S j , i i = 1 B j p j , i
where R s , j t and R b , j t are the transfer time fluctuations of subway station j or bus stop j ; S j , i refers to the standard variation in transfer time from transfer point j to the connected point i , which is calculated with the data from the transit card, where transfer time is adopted if it falls in the range of 15th and 85th percentile to avoid the extreme data.

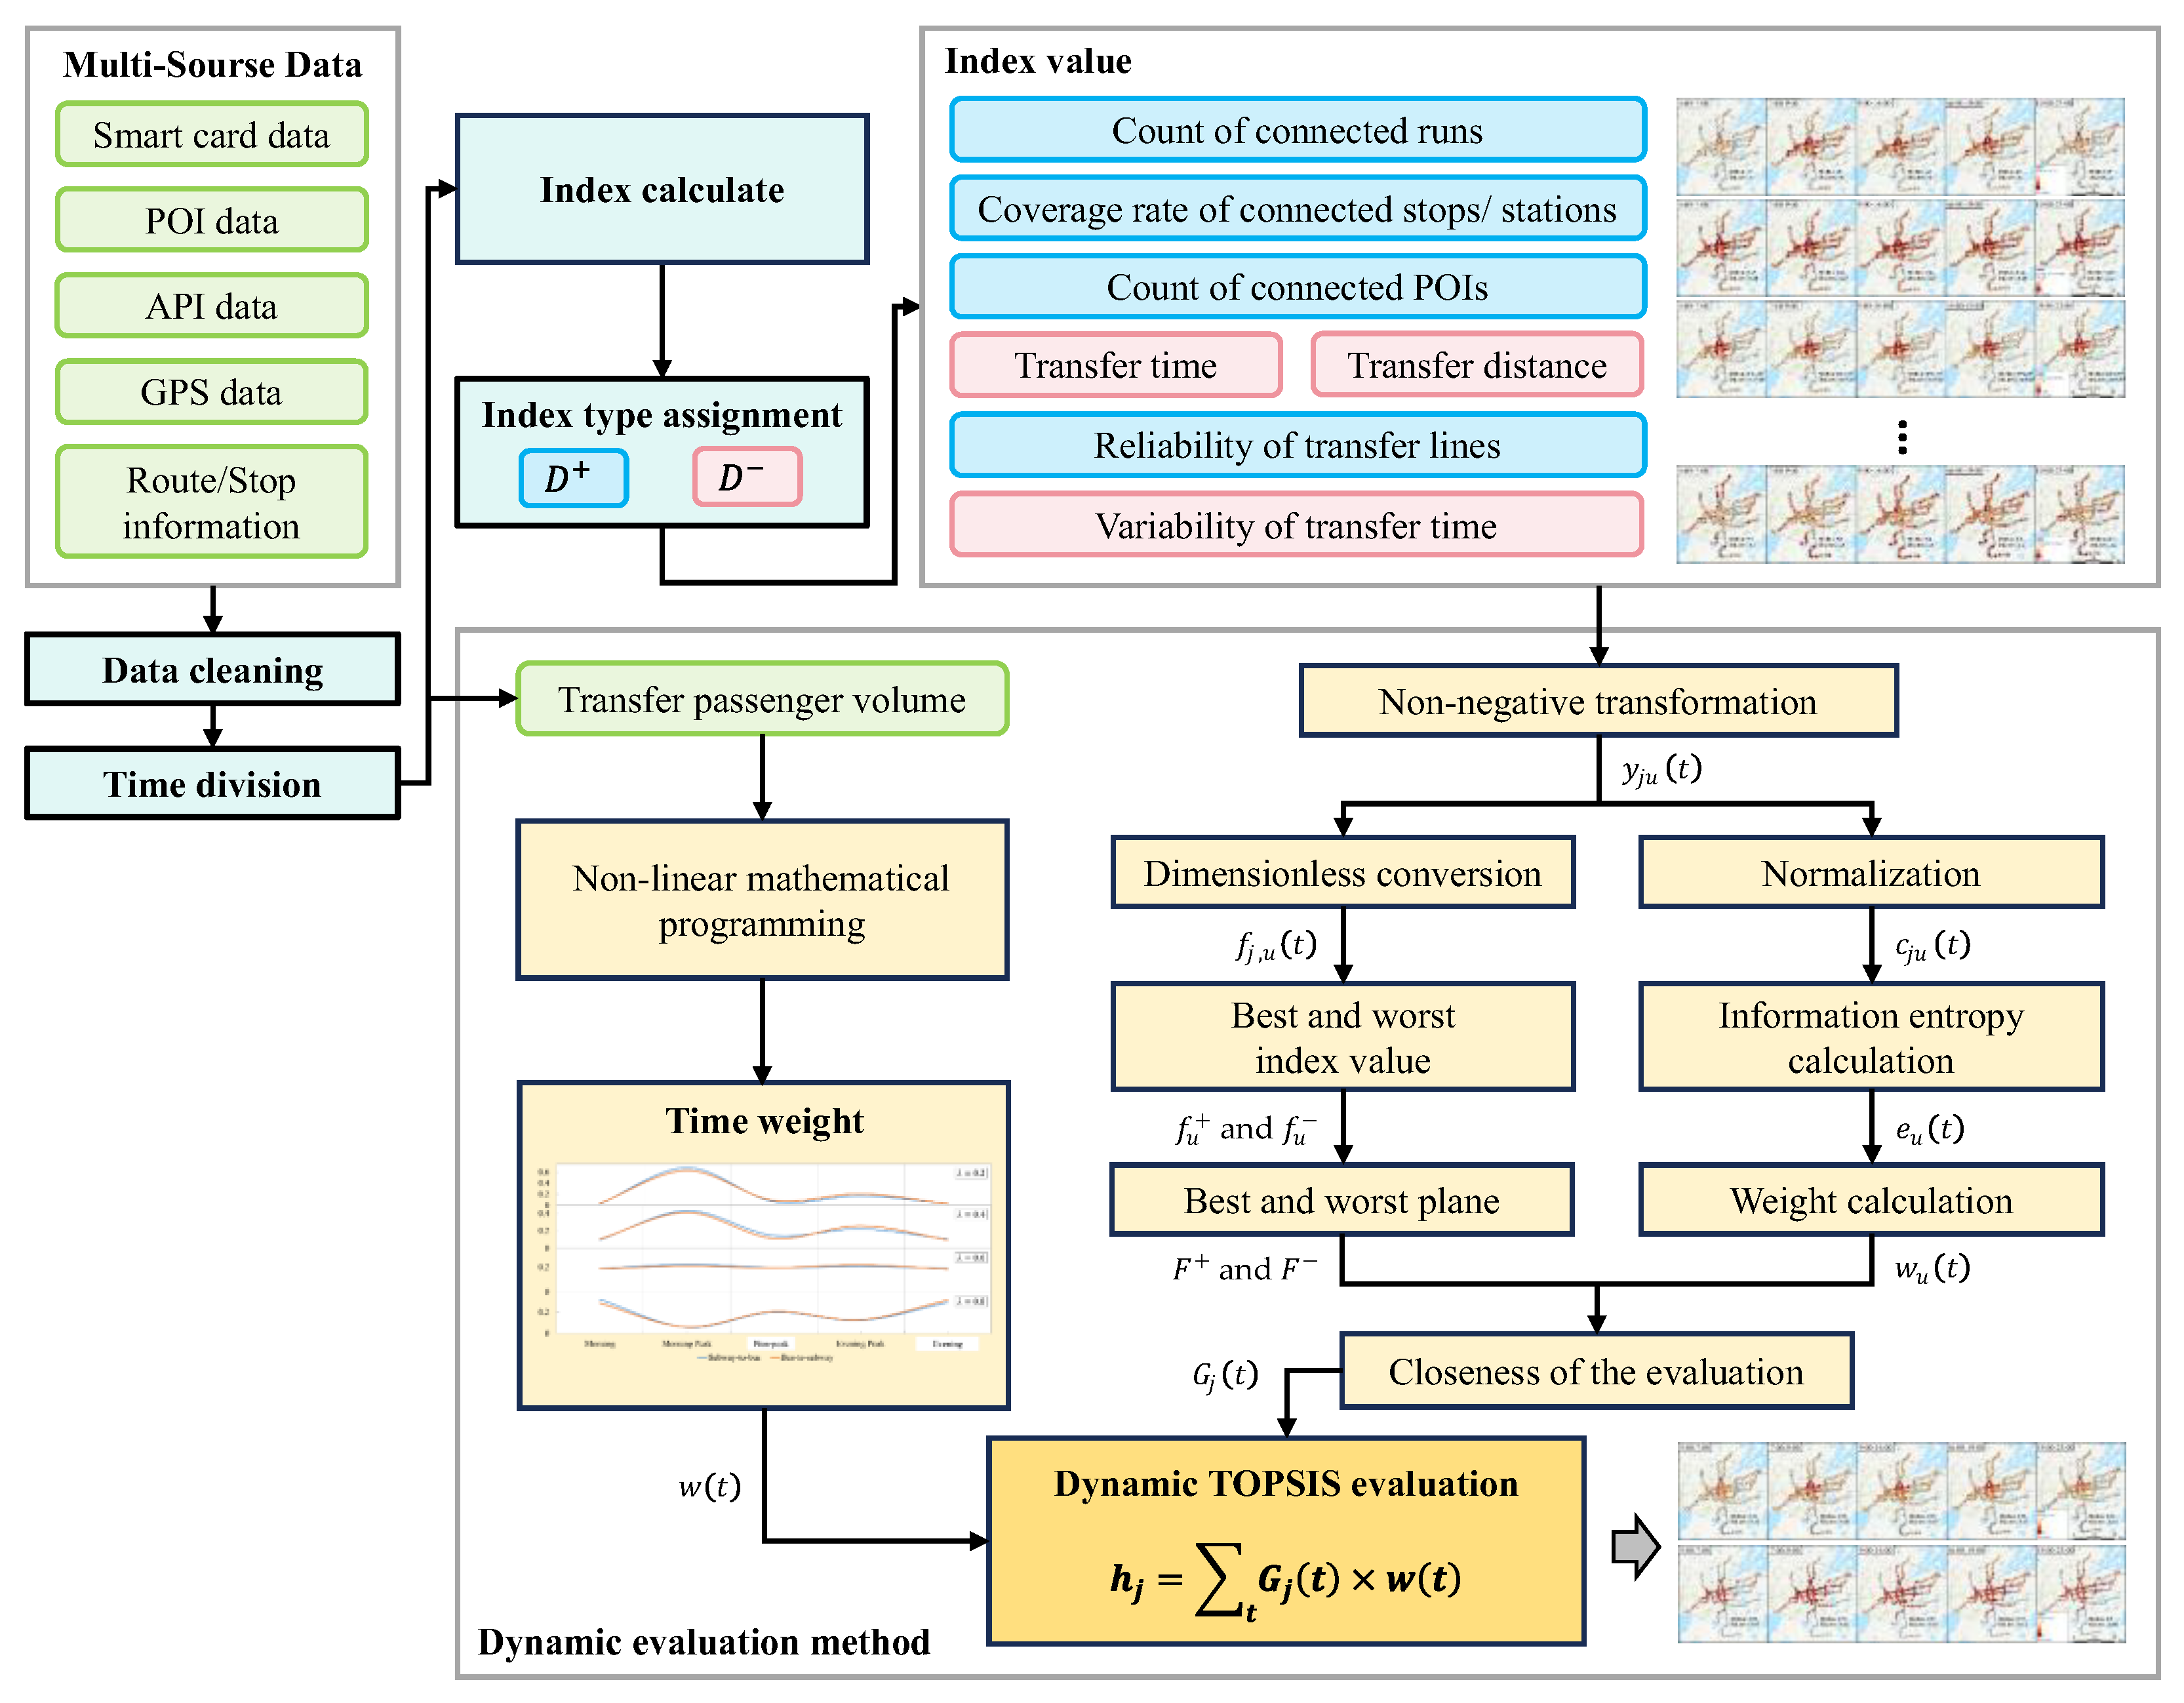
3. Data Extraction and Dynamic Evaluation Method

3.1. Logical Framework and Multi-Source Data

The evaluation of bus–subway transfer quality requires a structured method with support from comprehensive data. Figure 6 shows the logical framework for data processing, which outlines the flow of data extraction, processing, and analysis. Multi-source data is utilized to ensure the accuracy and robustness of the evaluation.
Figure 7 provides a detailed breakdown of the data types required for each index, including POI and stop/station distance data from application program interface (API), transit routes/stops information, and smart card data from bus and subway companies. These datasets are crucial for accurate assessment, as they ensure that every factor influencing transfer quality is accounted for.

3.2. Dynamic Evaluation Method

Given the dynamic nature of public transportation systems, where bus and subway operations vary throughout the day, a time-sensitive approach is required to evaluate transfer quality effectively. To address this, a dynamic TOPSIS method is proposed to reflect the temporal fluctuations in transfer conditions. Unlike traditional static TOPSIS, which uses fixed weights for evaluation indices, the dynamic version incorporates the influences of varying transfer volumes across different periods of one day. The dynamic TOPSIS evaluation value is given by
h j = t G j t × w t
where h j represents the evaluation value of transfer point j , G j t represents the closeness of the evaluation of transfer point j to that of the optimal point, and w t is the temporal weight at time t . Parameter G j t is given by
G j t = S j t S j + t + S j t
where S j + t and S j t refer to the distance from transfer point j to the best and worst transfer point in the period t , which are calculated with
S j + t = u w u t × F u + f j u t 2
S j t = u w u t × F u f j u t 2
The notation w u t indicates the weight of index u in period t ; F u + and F u refer to the best and worst values of index u over all the transfer points in all the periods.
Parameter w u t is given by
w u t = 1 e u t u 1 e u t
where e u t means the information entropy of index u in period t . Weight based on entropy helps to avoid biases from experts or decision-makers to emphasize the coordination among the transfer points. The smaller the entropy value, the more important the index. The notation e u t is calculated with
e u t = 1 ln J j c j u t × ln c j u t
where notation J means the count of transfer points, c j u t is the proportion of index u for transfer point j over the sum of all the transfer points in period t , given by
c j u t = y j u t j y j u t
where y j u t is the value of non-negative index u for transfer point j in period t , given by
y j u t = d j u t                                                               i f   d i j D + m a x j [ d j u t ] d j u t             i f   d i j D  
for the positive index D + and negative index D , respectively. That is, y j u t is equal to the index value for the positive index, the larger value of which means a better performance, while y j u t of the negative index is equal to the maximal value over all the transfer points minus the original value. This progress guarantees consistent directionality over all indices.
The notation f j u t refers to the dimensionless data of positive index u for transfer point j in period t , given by
f j u t = y j u t y t
where y t is the average of y j u t for all transfer points and indices at period t . In the following, the best and worst index values (i.e., f u + and f u ) for index u over all objects are calculated with
f u + = m a x t m a x j f j u t
f u = m i n t m i n j f j u t
The best plan F + and the worst plan F in all periods of Equations (13) and (14) are given by
F + = f 1 + , f 2 + , , f u + ,
F = f 1 , f 2 , , f u ,
where the notations f u + and f u refer to the best and worst values of all periods. With respect to time weight w t of Equation (13), the following non-linear mathematical programming has been proposed in the literature:
Mi n t w t ln w t
s . t .   λ = t T t T 1 × w t ,       0 λ 1 t w t = 1 ,     0 w t 1
where λ is the time degree. When λ = 0.5 , it means that all the periods are of equal importance; when λ < 0.5 , the earlier periods are more emphasized; when λ > 0.5 , the later periods are of larger weight. Thus, the original time-based dynamic TOPSIS tends to relate weight with time sequence, which is not applicable in transport service, where the period with larger ridership is more likely to be emphasized. Here, the time-sensitive model is revised to be ridership-based for period weight calculation. It is admitted that the indices can be related to ridership, which is employed to reflect the different impact of one transit station or stop to all the transfer points. Thus, although ridership is incorporated into both index weight and index value, the proposed method is reasonable where the period with more transfer passengers is assigned a larger weight. Thus, the above model of Equations (26) and (27) is revised as follows:
min t w t ln w t
s . t .   λ = t m a x t q t q t m a x t q t × w t ,       0 λ 1 t w t = 1 ,     0 w t 1
where q t is the total number of transfer passengers in period t . The non-linear programming model is solved with a constrained non-linear optimization method based on sequential least squares, to effectively handle the minimization of the entropy-based objective with equality and bound constraints [47,48].

4. Case Study and Results Discussion

4.1. Case Study Area and Transit System

Suzhou, Jiangsu, China, is selected as the case study area due to its comprehensive public transit development. The GDP of Suzhou ranks sixth over all Chinese cities. It has developed a well-integrated public transit network consisting of 5 subway lines and nearly 700 bus lines in 2023. The city’s consistent focus on improving inter-modal transfers makes it an ideal candidate for this study, which may provide us with insights into the inadequacy of the implementations that have been developed with limited theoretical research. These insights may be borrowed by other cities if they share a great scale of bus and transit service or if they are on the way to it.
The case study examines subway-to-bus and bus-to-subway transfers, with the research focusing on a 5 km and 10 km radius surrounding subway stations and bus stops, respectively. These distances correspond to the average travel distances for bus and subway trips in the city. Removing the subway stations that are not connected to a bus service, a total of 128 subway stations and 275 bus stops are included in the analysis. Data was collected over a five-day period from August 12 to 16, 2023. Figure 8 displays the trend of hourly average transfer passengers, with a noticeable peak in subway–bus transfers between 7:00–9:00 AM, and 16:00–19:00 PM, corresponding to the morning and evening rush hours. These patterns highlight the importance of considering time-sensitive variations in transfer quality. Therefore, one day is divided into five periods: morning (5:00 to 7:00), morning peak (7:00 to 9:00), non-peak (9:00 to 16:00), evening peak (16:00 to 19:00), and evening (19:00 to 23:00).
Figure 9 compares the period weight for subway–bus transfers using the revised transfer volume-based model against varying λ values. It is observed that, with λ = 0.4 , the revised model based on transfer passenger count emphasizes both the weight of the morning and evening peak, different from that with λ = 0.2 where the morning peak is extremely emphasized, and from that with λ = 0.6 where the weight difference is slight. Thus, the proposed model sets λ = 0.4 .

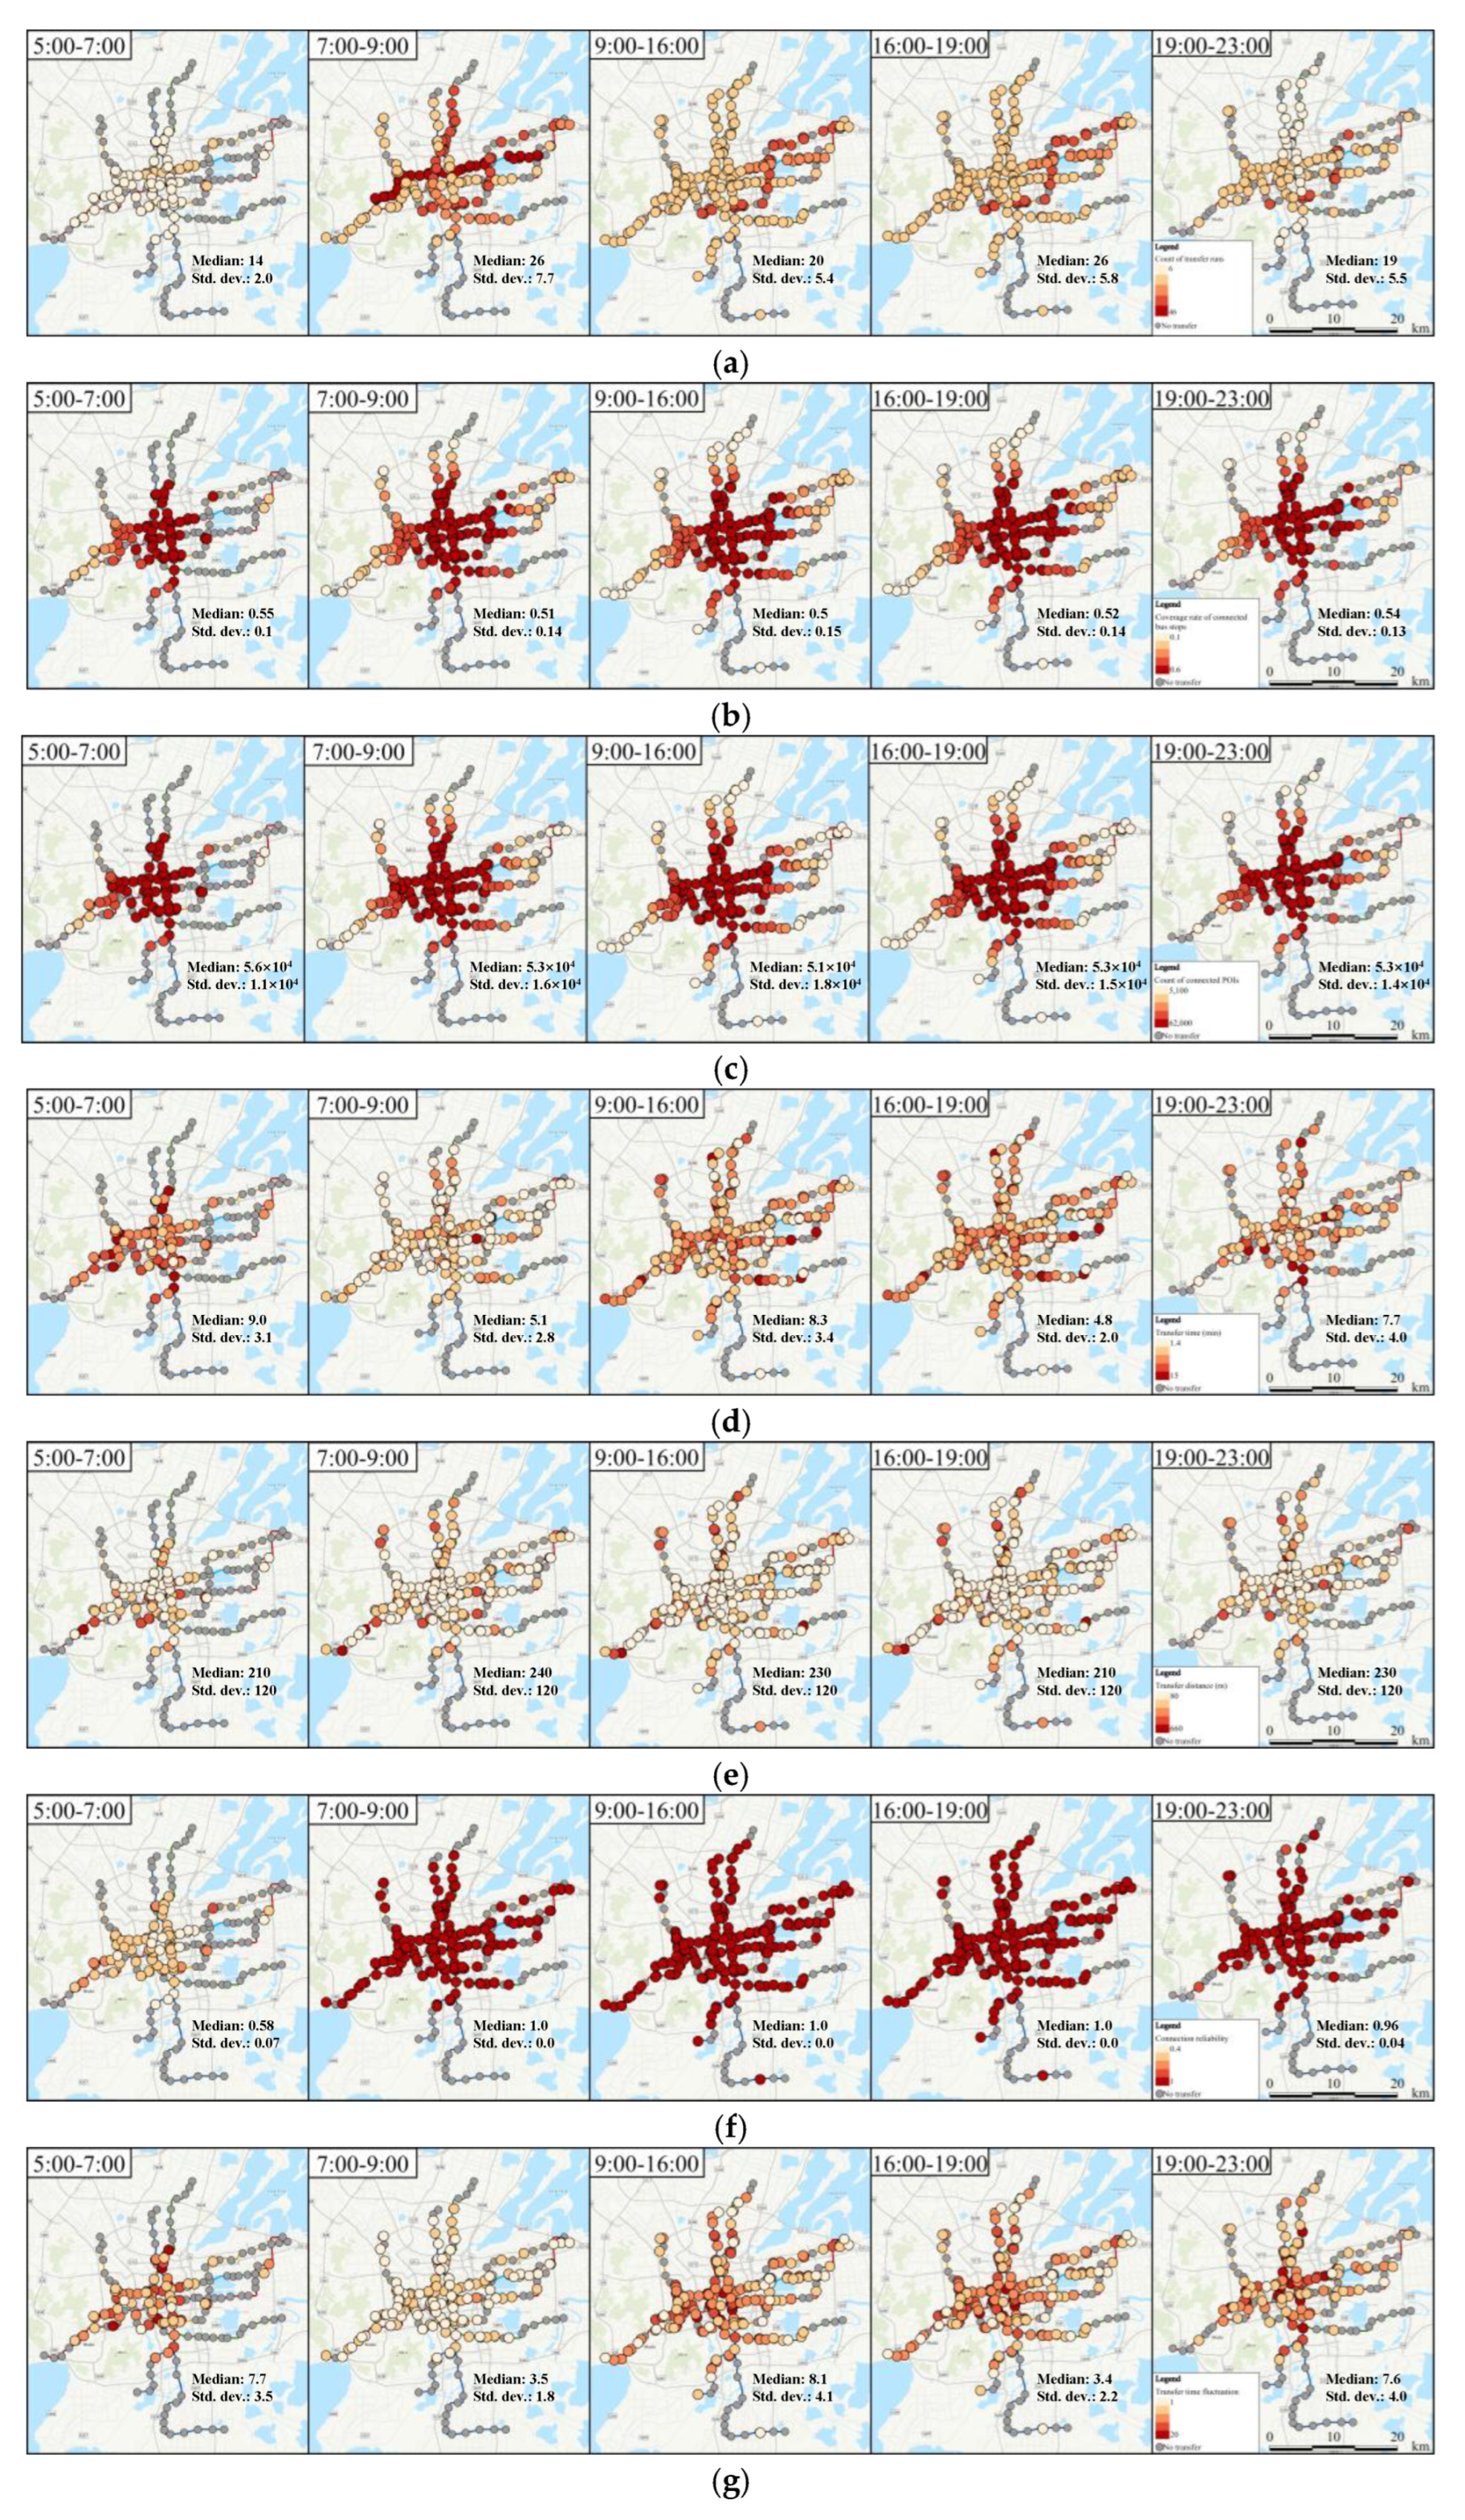
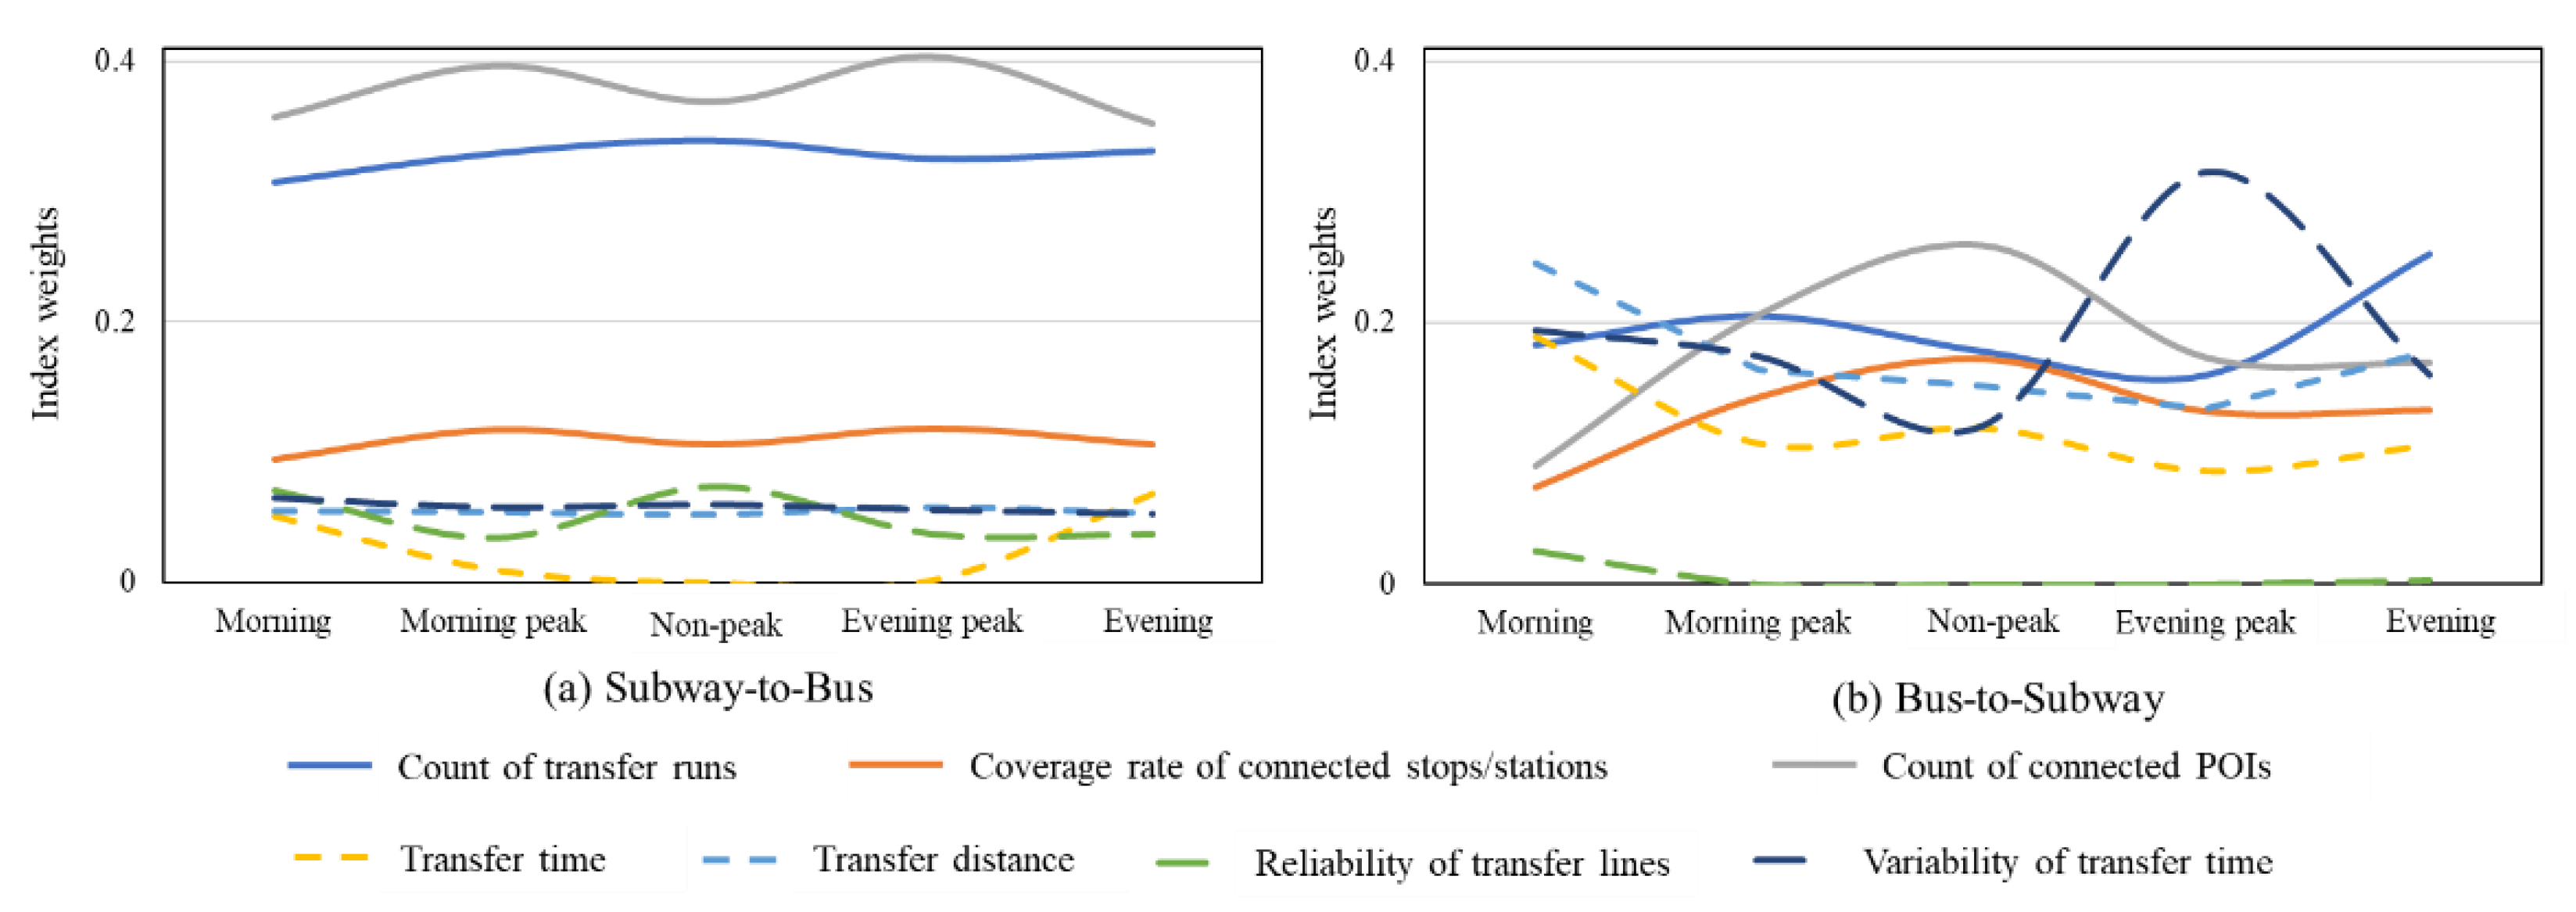
4.2. Results Discussion

Figure 10 shows the evaluation results for each transfer point of subway–bus in the different periods. Notably, the subway-to-bus transfer is consistently lower than the transfer quality of bus-to-subway. Figure 11 is the boxplot of inter-modal transfer evaluation, where the dot refers to the mild outliers that are beyond the range of higher quantile plus one and half times of the gap between 25th and 75th values. It is observed that the service level of bus-to-subway transfer is significantly higher than that of subway-to-bus with Mann–Whitney U test (i.e., 99% confidence level). Specifically, the inter-modal transfer level of subway-to-bus transfer is averaged to be 0.16, while that of bus-to-subway is of 0.48. This stark difference highlights the need for targeted improvements in subway-to-bus transfer infrastructure and service, especially during high-demand periods. That will help to enhance passenger loyalty to transit services and contribute to bus ridership improvement and subway ridership intensity after the strike of COVID-19 [49,50] and against the rapid development of subways all over the world.
Figure 12 provides a detailed analysis of the indices that influence subway-to-bus transfer quality. The indices exhibit significant variation across different periods, except the indices of the coverage rate of bus stops, count of POIs, and transfer distance. The results imply that the bus service is generally stable with physical attributes, while the operational attributes change significantly. Specifically, the count of transfer runs is quite low in the morning and evening except in the central area. When it comes to the indices of transfer time as well as its reliability, we observe more bus stops with quite long transfer times (≥20 min) and great variability (≥20 min) in the non-peak, which can be explained by many passengers being less sensitive to time delay in the day compared to the early morning and late night. The index of the reliability of transfer lines stays high in the day, and drops significantly in the morning and evening. The analysis on the indices of subway-to-bus transfer emphasizes the importance of coordinating bus services with subways to improve transfer quality and reduce transfer impedance.
Conversely, Figure 13 shows the spatial and temporal distribution of the evaluation indices for bus-to-subway transfers. While bus-to-subway transfers show similar variation, the overall quality is higher. The index of the count of transfer runs is low in the morning, which increases rapidly in the morning peak, drops to around 20 in the inter-peak, and increases to 26.7 in the evening peak. In contrast, the indices of transfer time and its variability show an inverse trend of being reduced significantly in the peak period, while increases in the other periods especially in the morning. The index of the reliability of transfer lines is low in the morning, which boosts to 1 in all the following periods.
Figure 14 shows the index weights for each period. In Figure 14a, subway-to-bus transfer assigns the largest weight to the count of connected POIs, followed by the connected transfer runs, and coverage rate. In contrast, the other evaluation indices share the remaining weight, with the weight of transfer time being the smallest. Figure 14b shows the index weights for bus-to-subway transfer, with the weights of reliability of transfer lines being the smallest. The weight value can be explained with the entropy of each index, where the smaller the entropy, the larger the weight. Combining the above three figures, Figure 15 shows the correspondence of each index and weight across all the periods, where the dot refers to the mild outliers mentioned before. In the following, we come to the recommended implementations for the improvement of subway–bus transfer service.
The above findings extend the results from the existing research on the separate discussion of subway-to-bus and bus-to-subway transfer [33]. Without the effect of special weather such as strong wind, heavy rain, or high temperature on specific dates, the transfer from bus to subway can be more attractive in a reliable style due to the attractive service provided by subways, with respect to service shifts, transfer point coverage rate, and line operation, as well as POI count. That motivates us to pay more attention to subway-to-bus transfer, to better address the bottleneck in mutual interaction between bus and transit.

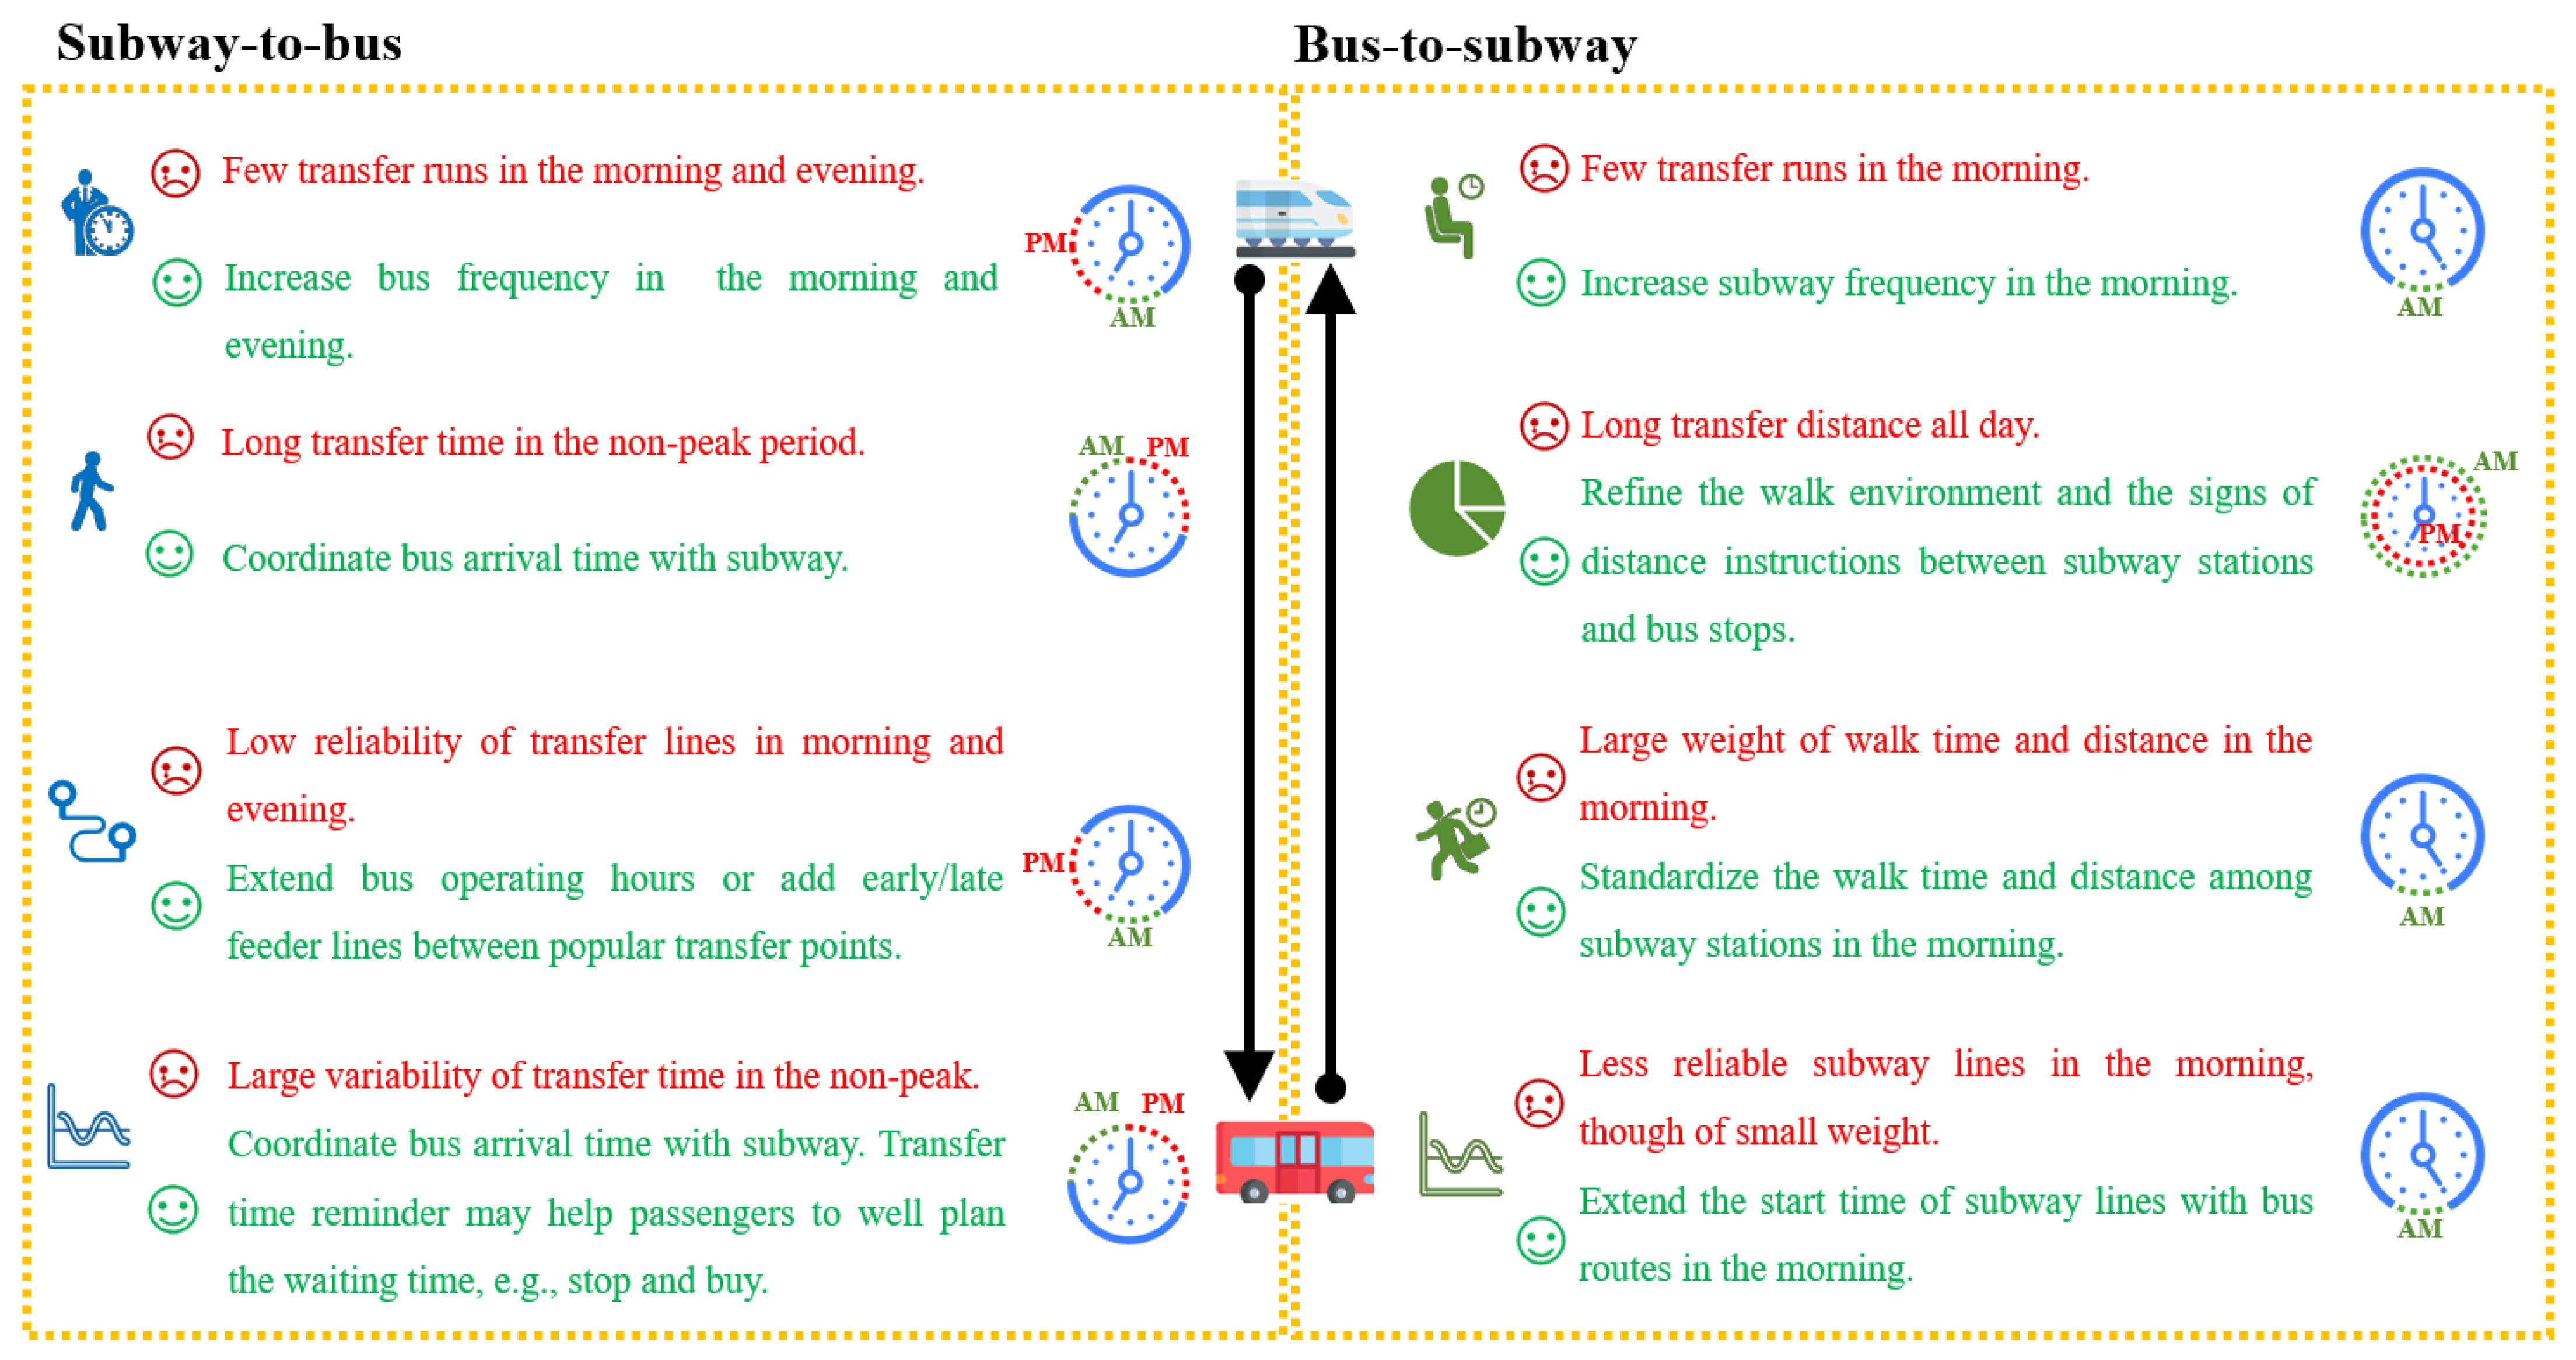
4.3. Implications and Recommendations

Based on the above evaluation results, multiple implementations can be made to enhance transfer quality. Figure 16 summarizes the multi-faceted countermeasures to the bottlenecks of subway–bus transfer. This allows us to focus on the critical indices in different periods, making improvements in finer detail for enhancing transit efficiency against financial constraints. For subway-to-bus transfer, it is recommended to increase the frequency and extend the operating hours of the connected bus lines, particularly in the morning and evening peak periods. Coordinating bus arrival times with subway schedules can reduce waiting times and improve transfer efficiency. When it comes to bus-to-subway transfer, the implementations are suggested to increase the connected subway runs in the morning, reduce transfer distance, standardize the transfer time and distance in the morning, and extend the subway start time in the morning.
These findings suggest a more targeted approach to improving subway-to-bus and bus-to-subway transfers, tailored to the specific challenges of different periods. Thus, the operator and government may utilize the insights to adjust investments and operation strategies for efficient and integrated transit service.

5. Conclusions

Oriented to bus–subway transfer, this research presents a comprehensive evaluation of subway-to-bus and bus-to-subway transfer quality, employing a revised dynamic TOPSIS method to account for temporal variations in transfer conditions. The evaluation framework is based on three key criteria: transfer benefits, transfer convenience, and transfer reliability. Transfer benefits refer to three indices: the count of transfer runs, the coverage rate of connected stations/stops along the transfer lines, and the count of POIs near the connected stations/stops. Second, transfer convenience is analyzed with respect to transfer time and distance, which are averaged over all the passengers at all the connected stations/stops. Note that transfer time is selected between the 15th and 85th percentiles, to avoid an overly short or long transfer time. Transfer reliability is reflected by the ratio of connected routes to the total connected routes, and the standard deviation of transfer time. Dynamic TOPSIS is revised to comprehensively evaluate the subway–bus transfer system, with the index weight positively related to the transfer volume to weight the transfer points with larger transfer flows more heavily than those with smaller transfer flows.
Our case study validates the proposed subway–bus transfer evaluation with the transit network in Suzhou, China. Referring to the changes in transfer passenger flow, one day is divided into five periods, where the period between 23:00 and 5:00 is excluded from analyses because most transit routes stop operation. It is found that the weights of the subway-to-bus transfer index vary to a larger degree compared to those of bus-to-subway transfer, which can be explained by the larger entropy of subway-to-bus transfer, in comparison to the stable bus-to-subway service over the entire area. The results show that bus-to-subway transfer competes with subway-to-bus transfer thanks to the higher level of connected transit runs and connection reliability and the reduced transfer time fluctuation. Multi-faceted implementations are recommended for the improvement of subway–bus transfer: For subway-to-bus transfer, increase the frequency and extend the service time span of the connected bus lines in the morning and evening, and coordinate bus arrival time with the subway. For bus-to-subway transfer, increase the connected subway runs in the morning, reduce transfer distance, standardize the transfer time and distance in the morning, and extend the subway start time in the morning. The targeting recommendations avoid unnecessary investment and promote the attraction and sustainability of the improvement.
The limitations of the research can be summarized in three main aspects. First, the applicability of the proposed method has yet to be validated for other cities, including bus-dominated cities. Second, the suggestions addressing the barriers to bus–subway transfers require further verification under various real-world constraints. Third, differences in passenger demand across weekdays, weekends, and holidays should be considered to better capture the dynamic nature of transfer behaviors. Future research will focus on the multi-faceted implementations of bidirectional subway–bus transfer, taking into consideration constraints such as finance, maintenance, and fleet availability. Additionally, by incorporating variations in passenger ridership across different days, coordination between subway and bus services can enhance overall transit efficiency, increase ridership, and support the sustainability of the transit system.

Author Contributions

The authors confirm contribution to the paper as follows: study conception and design: H.J.; modeling and solving: J.G., H.J., Z.S. and J.W.; data collection: H.J., Z.S. and X.Z.; analysis and manuscript preparation: H.J., M.C. and X.Z. All authors have read and agreed to the published version of the manuscript.

Funding

This work has been funded by the National Natural Science Foundation of China (Grant No. 52002261).

Institutional Review Board Statement

Not applicable.

Informed Consent Statement

Not applicable.

Data Availability Statement

All data is available on request.

Conflicts of Interest

The authors declare no conflict of interest.

References

  1. Seaborn, C.; Attanucci, J.; Wilson, N.H.M. Analyzing multimodal public transport journeys in London with smart card fare payment data. Transp. Res. Rec. 2009, 2121, 55–62. [Google Scholar] [CrossRef]
  2. Currie, G. Quantifying spatial gaps in public transport supply based on social needs. J. Transp. Geogr. 2010, 18, 31–41. [Google Scholar] [CrossRef]
  3. Garcia-Martinez, A.; Cascajo, R.; Jara-Diaz, S.R.; Chowdhury, S.; Monzon, A. Transfer penalties in multimodal public transport networks. Transp. Res. Part A Policy Pract. 2018, 114, 52–66. [Google Scholar] [CrossRef]
  4. Mohring, H.; Schroeter, J.; Wiboonchutikula, P. The values of waiting time, travel time, and a seat on a bus. RAND J. Econ. 1987, 18, 40–56. [Google Scholar] [CrossRef]
  5. Liu, Z. Evaluating the dynamic resilience of the multi-mode public transit network for sustainable transport. J. Clean. Prod. 2022, 348, 131350. [Google Scholar] [CrossRef]
  6. Liu, Z. Resilience-based post-disaster repair strategy for integrated public transit networks. Transp. B Transp. Dyn. 2024, 12, 1–25. [Google Scholar] [CrossRef]
  7. Liu, X. How to make service better? A review on developing service-oriented public transit systems. Transp. Rev. 2025, 1–24. [Google Scholar] [CrossRef]
  8. Zhao, J. Joint optimisation of regular and demand-responsive transit services. Transp. A Transp. Sci. 2023, 19, 1987580. [Google Scholar] [CrossRef]
  9. Carrel, A.; Halvorsen, A.; Walker, J.L. Passengers’ perception of and behavioral adaptation to unreliability in public transportation. Transp. Res. Rec. 2013, 2351, 153–162. [Google Scholar] [CrossRef]
  10. Chen, J.; Liu, H.; Ma, Y.; Li, X. Performance evaluation of bus transfer nodes based on Advanced Public Transportation System data. In Proceedings of the International Conference on Smart Transportation and City Engineering, Chongqing, China, 10 November 2021; Volume 12050, pp. 491–496. [Google Scholar]
  11. Fan, A.; Chen, X.; Wang, Y.; Kou, W. All-stop, skip-stop, or transfer service: An empirical study on preferences of bus passengers. IET Intell. Transp. Syst. 2018, 12, 1255–1263. [Google Scholar] [CrossRef]
  12. Basbas, S. Evaluation of bus transfer stations from the passenger’s point of view. WIT Trans. Built Environ. 2006, 89, 10. [Google Scholar] [CrossRef]
  13. Weng, J.; Di, X.; Wang, C.; Wang, J.; Mao, L. A bus service evaluation method from passenger’s perspective based on satisfaction surveys: A Case Study Beijing China. Sustain 2018, 10, 2723. [Google Scholar] [CrossRef]
  14. Kim, C.; Kim, S.W.; Kang, H.J.; Song, S.M. What makes urban transportation efficient? Evidence from subway transfer stations in Korea. Sustainability 2017, 9, 2054. [Google Scholar] [CrossRef]
  15. Ye, J.; Chen, J.; Bai, H.; Yue, Y. Analyzing transfer commuting attitudes using a market segmentation approach. Sustainability 2018, 10, 2194. [Google Scholar] [CrossRef]
  16. Sadhukhan, S.; Banerjee, U.K.; Maitra, B. Commuters’ perception towards transfer facility attributes in and around subway stations: Experience in Kolkata. J. Urban Plan. Dev. 2015, 141, 04014038. [Google Scholar] [CrossRef]
  17. Kim, J.; Schmöcker, J.D.; Yu, J.W.; Choi, J.Y. Service quality evaluation for urban rail transfer facilities with Rasch analysis. Travel Behav. Soc. 2018, 13, 26–35. [Google Scholar] [CrossRef]
  18. Sil, A.; Chaniotakis, E.; Roy, U.K.; Antoniou, C. Exploring satisfaction for transfers at intermodal interchanges: A comparison of Germany and India. J. Public Transp. 2022, 24, 100005. [Google Scholar] [CrossRef]
  19. Cherry, T.; Townsend, C. Assessment of potential improvements to subway–bus transfers in Bangkok, Thailand. Transp. Res. Rec. 2012, 2276, 116–122. [Google Scholar] [CrossRef]
  20. Chauhan, V.; Gupta, A.; Parida, M. Demystifying service quality of Multimodal Transportation Hub (MMTH) through measuring users’ satisfaction of public transport. Transp. Policy 2021, 102, 47–60. [Google Scholar] [CrossRef]
  21. Huang, H.; Ji, C. Evaluation of Different Traffic Modes Connecting Regional Metro Stations--A case study in Dishui Lake Station. Highlights Sci. Eng. Technol. 2023, 37, 89–96. [Google Scholar] [CrossRef]
  22. Yang, M.; Zhao, J.; Wang, W.; Liu, Z.; Li, Z. Subway commuters’ satisfaction in multi-type access and egress transferring groups. Transp. Res. Part D Transp. Environ. 2015, 34, 179–194. [Google Scholar] [CrossRef]
  23. Wu, P.; Xu, L.; Zhong, L.; Gao, K.; Qu, X.; Pei, M. Revealing the determinants of the intermodal transfer ratio between subway and bus systems considering spatial variations. J. Transp. Geogr. 2022, 104, 103415. [Google Scholar] [CrossRef]
  24. Cheng, Y.H.; Tseng, W.C. Exploring the effects of perceived values, free bus transfer, and penalties on intermodal subway–bus transfer users’ intention. Transp. Policy 2016, 47, 127–138. [Google Scholar] [CrossRef]
  25. Chen, Z.; Huang, Z.; Yang, L.; Zheng, P. Evaluation of Transfer Efficiency between Subway and Bus Based on the Interval Number Ranking Method by Employing Probability Reliability: Taking Ningbo for Example. Discret. Dyn. Nat. Soc. 2021, 2021, 9125605. [Google Scholar] [CrossRef]
  26. Wang, W.; Wang, Y.; Correia, G.H.A.; Chen, Y. A network-based model of passenger transfer flow between bus and metro: An application to the public transport system of Beijing. J. Adv. Transp. 2020, 2020, 6659931. [Google Scholar] [CrossRef]
  27. Liu, D.; Rong, W.; Zhang, J.; Ge, Y.E. Exploring the Nonlinear Effects of Built Environment on Bus-Transfer Ridership: Take Shanghai as an Example. Appl. Sci. 2022, 12, 5755. [Google Scholar] [CrossRef]
  28. Chen, E.; Ye, Z.; Wang, C.; Zhang, W. Discovering the spatio-temporal impacts of built environment on metro ridership using smart card data. Cities 2019, 95, 102359. [Google Scholar] [CrossRef]
  29. Chakrabarti, S.; Giuliano, G. Does service reliability determine transit patronage? Insights from the Los Angeles Metro bus system. Transp. Policy 2015, 42, 12–20. [Google Scholar] [CrossRef]
  30. Ceder, A.; Le Net, Y.; Coriat, C. Measuring public transport connectivity performance applied in Auckland, New Zealand. Transp. Res. Rec. 2009, 2111, 139–147. [Google Scholar] [CrossRef]
  31. Suman, H.K.; Bolia, N.B. A review of service assessment attributes and improvement strategies for public transport. Transp. Dev. Econ. 2019, 5, 1. [Google Scholar] [CrossRef]
  32. Lee, E.H.; Lee, H.; Kho, S.Y.; Kim, D.K. Evaluation of transfer efficiency between bus and subway based on data envelopment analysis using smart card data. KSCE J. Civ. Eng. 2019, 23, 788–799. [Google Scholar] [CrossRef]
  33. Wu, P.; Li, J.; Pian, Y.; Li, X.; Huang, Z.; Xu, L.; Li, G.; Li, R. How Determinants Affect Transfer Ridership between Subway and Bus Systems: A Multivariate Generalized Poisson Regression Analysis Method. Sustainability 2022, 14, 9666. [Google Scholar]
  34. Gu, H.; Ren, Z. Operation and Planning of Hangzhou Subway Lines--Route Planning Based on Analytic Hierarchy Process. Highlights Sci. Eng. Technol. 2023, 37, 370–379. [Google Scholar] [CrossRef]
  35. Chen, S.; Leng, Y.; Mao, B.; Liu, S. Integrated weight-based multi-criteria evaluation on transfer in large transport terminals: A case study of the Beijing South Railway Station. Transp. Res. Part A Policy Pract. 2014, 66, 13–26. [Google Scholar] [CrossRef]
  36. Ning, K.; Jiancheng, W.; Qingshuai, S.H.I.; Zhe, L.I.U. A Method for Evaluating Transfer Efficiency Between Bus and Subway Based on Data Envelopment Analysis. Transp. Inf. Secur. 2022, 40, 89–96. [Google Scholar]
  37. Majumdar, B.B.; Dissanayake, D.; Rajput, A.S.; Saw, Y.Q.; Sahu, P.K. Prioritizing subway service quality attributes to enhance commuter experience: TOPSIS ranking and importance satisfaction analysis methods. Transp. Res. Rec. 2020, 2674, 124–139. [Google Scholar] [CrossRef]
  38. Hassan, M.N.; Hawas, Y.E.; Ahmed, K. A multi-dimensional framework for evaluating the transit service performance. Transp. Res. Part A Policy Pract. 2013, 50, 47–61. [Google Scholar] [CrossRef]
  39. Barros, C.P.; Wanke, P. An analysis of African airlines efficiency with two-stage TOPSIS and neural networks. J. Air Transp. Manag. 2015, 44, 90–102. [Google Scholar] [CrossRef]
  40. Long, R.; Li, H.; Wu, M.; Li, W. Dynamic evaluation of the green development level of China’s coal-resource-based cities using the TOPSIS method. Resour. Policy 2021, 74, 102415. [Google Scholar] [CrossRef]
  41. Jiang, Y.; Zhang, J.; Asante, D.; Yang, Y. Dynamic evaluation of low-carbon competitiveness (LCC) based on improved Technique for Order Preference by similarity to an Ideal Solution (TOPSIS) method: A case study of Chinese steelworks. J. Clean. Prod. 2019, 217, 484–492. [Google Scholar] [CrossRef]
  42. Huang, J.; Lu, J. Research on Pedestrian Space System: Planning and Design’. Mod. Urban Res. 2007, 22, 48–53. [Google Scholar]
  43. Jiang, S.; Alves, A.; Rodrigues, F.; Ferreira, J., Jr.; Pereira, F.C. Mining point-of-interest data from social networks for urban land use classification and disaggregation. Comput. Environ. Urban Syst. 2015, 53, 36–46. [Google Scholar] [CrossRef]
  44. Wexler, N.; Fan, Y. Transitway investment and nearby commercial gentrification. Multimodal Transp. 2022, 1, 100015. [Google Scholar] [CrossRef]
  45. Szeto, W.Y.; Wang, A.B. Reliable network design under supply uncertainty with probabilistic guarantees. Transp. A Transp. Sci. 2016, 12, 504–532. [Google Scholar] [CrossRef]
  46. Gu, Y.; Fu, X.; Liu, Z.; Xu, X.; Chen, A. Performance of transportation network under perturbations: Reliability, vulnerability, and resilience. Transp. Res. Part E Logist. Transp. Rev. 2020, 133, 101809. [Google Scholar] [CrossRef]
  47. Pan, Y.; Chen, S.; Li, T.; Niu, S.; Tang, K. Exploring spatial variation of the bus stop influence zone with multi-source data: A case study in Zhenjiang, China. J. Transp. Geogr. 2019, 76, 166–177. [Google Scholar] [CrossRef]
  48. Pfeiffer, K.; Kheddar, A. Sequential hierarchical least-squares programming for prioritized non-linear optimal control. Optim. Methods Softw. 2024, 39, 1104–1142. [Google Scholar] [CrossRef]
  49. Jiang, S.; Cai, C. Unraveling the dynamic impacts of COVID-19 on metro ridership: An empirical analysis of Beijing and Shanghai, China. Transp. Policy 2022, 127, 158–170. [Google Scholar] [CrossRef]
  50. Wang, Z.; Jin, H.; Zhang, Y.; Yang, X. Exploration on boosting bus ridership in the post-pandemic era referring to bus rider behavior changes. Alex. Eng. J. 2024, 109, 685–701. [Google Scholar] [CrossRef]
Figure 1. Illustration of the count of transfer runs. (a) Subway-to-bus. (b) Bus-to-subway.
Sustainability 17 06684 g001
Figure 2. Illustration of the coverage rate of connected stops from the transfer point. (a) Subway-to-bus. (b) Bus-to-subway.
Sustainability 17 06684 g002
Figure 3. Illustration of the count of connected POIs. (a) Subway-to-bus. (b) Bus-to-subway.
Sustainability 17 06684 g003
Figure 4. Transfer time illustration. (a) Subway-to-bus. (b) Bus-to-subway. The downward and upward arrows refer to getting off and onto the bus, respectively.
Sustainability 17 06684 g004
Figure 5. Count of connected lines at transfer points in the different periods. Bus lines 2 and 3 are less reliable which are out of operation before 7:00.
Sustainability 17 06684 g005
Figure 6. Methodology diagram of the logic framework of data processing.
Sustainability 17 06684 g006
Figure 7. Logic framework of data processing. The arrow refers to the correspondence of the source data and the derived index.
Sustainability 17 06684 g007
Figure 8. Period segmentation against hourly transfer passengers.
Sustainability 17 06684 g008
Figure 9. Period weight against different λ values for subway–bus transfer.
Sustainability 17 06684 g009
Figure 10. Dynamic evaluation for bus–subway transfer. (a) Subway-to-bus. (b) Bus-to-subway.
Sustainability 17 06684 g010aSustainability 17 06684 g010b
Figure 11. Boxplot of subway–bus transfer evaluation.
Sustainability 17 06684 g011
Figure 12. Spatial and temporal distribution of the indices on subway-to-bus transfer evaluation. (a) Count of transfer runs. (b) Coverage rate of bus stops. (c) Count of connected POIs. (d) Transfer time. (e) Transfer distance. (f) Reliability of transfer lines. (g) Variability of transfer time.
Sustainability 17 06684 g012aSustainability 17 06684 g012b
Figure 13. Spatial and temporal distribution of bus-to-subway transfer evaluation. (a) Count of transfer runs. (b) Coverage rate of subway stations. (c) Count of connected POIs. (d) Transfer time. (e) Transfer distance. (f) Reliability of transfer lines. (g) Variability of transfer time.
Sustainability 17 06684 g013
Figure 14. Index weight for two transfer modes.
Sustainability 17 06684 g014
Figure 15. Correspondence of each index and weight across all the periods.
Sustainability 17 06684 g015
Figure 16. Recommended implementations to improve subway–bus transfer quality.
Sustainability 17 06684 g016
Table 1. Popular indices of transit transfer evaluation.
IndicesModesReferencesUsage
Benefits
Count of transfer routesAll modes10, 19, 26, 27, 33Revised
POIsBus–subway, bus–bus9, 23, 26, 28Adopted
Coverage rateSubway–bus25, 30, 32Adopted
Transfer costSubway–bus24-
Transfer volumeBus–bus10-
Convenience
Transfer timeAll modes10, 11, 16, 19, 23, 25, 26Adopted
Walking distanceAll modes10, 11, 22, 23, 27Adopted
Ease of wayfindingBus–subway20-
Count of passagewaysBus–subway, bus–subway33-
InformationBus–bus9-
FrequencyBus–bus9-
Comfort
SafetySubway–subway, bus–subway14, 18, 19, 20, 23-
FacilityBus–subway19, 20-
EnvironmentSubway–subway, subway–bus16, 22-
WeatherSubway–bus, bus–subway23, 32-
Reliability
Reliability of connected linesSubway–bus29, 30, 31Adopted
Variability of transfer timeBus–bus, subway–bus9, 12, 13, 22Adopted
Table 2. Indices of bus–subway transfer evaluation.
IndicesExplanationType
Benefits
Count of connected runsAverage number of buses or subways that can be taken within the transfer range in the specified period. D +
Coverage rate of connected stops/stationsRatio of the sum of the service area of the stops on the connected lines in operation to the research range in the specified period. D +
Count of connected POIsCount of distinct geographical points that one can be interested in. D +
Convenience
Transfer timeTime when a passenger gets off the subway (or bus) before departing on a bus (or subway), weighed with transfer volume. D
Transfer distanceDistance between the transfer point and the departure point. D
Reliability
Reliability of transfer linesRatio of the routes in operation to the total routes connected to a transfer point. D +
Variability of transfer timeStandard variation in the transfer time between subway and bus service. D
Disclaimer/Publisher’s Note: The statements, opinions and data contained in all publications are solely those of the individual author(s) and contributor(s) and not of MDPI and/or the editor(s). MDPI and/or the editor(s) disclaim responsibility for any injury to people or property resulting from any ideas, methods, instructions or products referred to in the content.

