Article

GIS-Driven Spatial Planning for Resilient Communities: Walkability, Social Cohesion, and Green Infrastructure in Peri-Urban Jordan

1
Department of Architecture, School of Architecture and Built Environment, German Jordanian University, Amman 11180, Jordan
2
Architecture Department, College of Architecture and Design, Prince Sultan University, Riyadh 11586, Saudi Arabia
*
Author to whom correspondence should be addressed.
Sustainability 2025, 17(14), 6637; https://doi.org/10.3390/su17146637
Submission received: 19 May 2025 / Revised: 3 July 2025 / Accepted: 14 July 2025 / Published: 21 July 2025

Abstract

Amman’s rapid population growth and sprawling urbanization have resulted in car-centric, fragmented neighborhoods that lack social cohesion and are vulnerable to the impacts of climate change. This study reframes walkability as a climate adaptation strategy, demonstrating how pedestrian-oriented spatial planning can reduce vehicle emissions, mitigate urban heat island effects, and enhance the resilience of green infrastructure in peri-urban contexts. Using Deir Ghbar, a rapidly developing marginal area on Amman’s western edge, as a case study, we combine objective walkability metrics (street connectivity and residential and retail density) with GIS-based spatial regression analysis to examine relationships with residents’ sense of community. Employing a quantitative, correlational research design, we assess walkability using a composite objective walkability index, calculated from the land-use mix, street connectivity, retail density, and residential density. Our results reveal that higher residential density and improved street connectivity significantly strengthen social cohesion, whereas low-density zones reinforce spatial and socioeconomic disparities. Furthermore, the findings highlight the potential of targeted green infrastructure interventions, such as continuous street tree canopies and permeable pavements, to enhance pedestrian comfort and urban ecological functions. By visualizing spatial patterns and correlating built-environment attributes with community outcomes, this research provides actionable insights for policymakers and urban planners. These strategies contribute directly to several Sustainable Development Goals (SDGs), particularly SDG 11 (Sustainable Cities and Communities) and SDG 13 (Climate Action), by fostering more inclusive, connected, and climate-resilient neighborhoods. Deir Ghbar emerges as a model for scalable, GIS-driven spatial planning in rural and marginal peri-urban areas throughout Jordan and similar regions facing accelerated urban transitions. By correlating walkability metrics with community outcomes, this study operationalizes SDGs 11 and 13, offering a replicable framework for climate-resilient urban planning in arid regions.

1. Introduction

Rapid urbanization and population growth in Amman, Jordan, have transformed the city’s demography and spatial structure, presenting mounting challenges for both social cohesion and environmental sustainability. Since the early 2000s, Amman’s population has more than doubled, reaching an estimated 4.5 million residents in 2020 and projected to climb to 6.4 million by 2025 [1,2]. This surge is fueled by natural increase and recurrent waves of migration from surrounding regions, creating a complex urban fabric marked by social diversity and dynamic settlement expansion. However, these demographic shifts have fueled a pattern of sprawling, car-centric development, particularly in peri-urban and marginal areas, with profound implications for social connectivity and climate resilience.
The predominance of automobile-oriented planning in Amman has led to fragmented neighborhoods characterized by deteriorated walkability, weak social ties, and a decline in public life [3,4]. This car-centric urban expansion exacerbates climate vulnerabilities, notably through the intensification of the urban heat island effect, increased air pollution, and heightened flood risk [1,5]. The proliferation of impervious surfaces, such as asphalt roads and parking lots, combined with the loss and fragmentation of green spaces, limits natural cooling and undermines stormwater infiltration. Furthermore, recent studies indicate a significant rise in Amman’s average summer temperatures and the frequency and intensity of sudden precipitation events, which increase susceptibility to heat stress and flash floods, particularly in vulnerable districts [1,5]. These dynamics are most pronounced in peri-urban neighborhoods, where developmental pressures often outpace the provision of adequate infrastructure.
Residential areas increasingly lack safe walkways, green infrastructure (GI), and shared public spaces, impairing opportunities for neighborly interaction and a sense of belonging [6,7]. Efforts by the Greater Amman Municipality, such as the Transport and Mobility Master Plan (2010) and new pedestrian infrastructure guidelines, have yet to realize a comprehensive vision for sustainable mobility or spatial integration. This is evidenced by the growing vehicle ownership rate, which exceeded an annual growth of 8.3% in 2017 [8]. Consequently, the increasing reliance on cars has not only heightened traffic congestion and air pollution but has also shaped a built environment that remains largely inhospitable to walking and social interaction.
The interplay between urban form and climate resilience is particularly critical in arid regions like Jordan, where rising temperatures and water scarcity exacerbate existing vulnerabilities. Sádaba et al. (2024)’s [9] ‘resilient streets’ framework underscores the dual role of pedestrian infrastructure in fostering social cohesion and climate adaptation—a gap our study addresses in Jordan’s peri-urban context. Peri-urban areas, often characterized by ad hoc development and inadequate infrastructure, face compounded risks due to their spatial isolation and limited access to municipal services. For instance, the lack of shaded pedestrian pathways in Deir Ghbar not only discourages walking but also intensifies heat exposure during summer months, disproportionately affecting elderly and low-income residents. This underscores the urgency of integrating climate adaptation into walkability planning, as pedestrian-friendly design can simultaneously mitigate urban heat island effects (UHI) and foster social connectivity, a dual benefit that remains understudied in Middle Eastern contexts.
Importantly, urban form and land-use patterns are now recognized as critical levers for climate adaptation and mitigation [10,11]. Walkable neighborhoods, characterized by interconnected street networks, higher residential density, vibrant mixed land uses, and continuous green corridors, can reduce car dependency, cut greenhouse gas emissions, and support ecosystem services, such as urban cooling and localized flood mitigation [12,13]. Interventions like street tree planting and permeable pavements can further strengthen climate resilience by lowering surface temperatures and improving water management.
Despite mounting evidence of the benefits of walkability and green infrastructure for urban sustainability, empirical studies investigating these relationships in Jordan, particularly in peri-urban and marginal contexts, remain scarce. Most existing research has overlooked how built environment attributes intersect with climate adaptation and social outcomes at the neighborhood scale [14,15]. Furthermore, there is limited application of advanced geospatial methods to quantitatively link objective walkability metrics with measures of community cohesion in the Middle East and North Africa regions.
Urban walkability is a critical component of sustainable city planning, influencing both environmental health and community well-being. Foundational texts, such as Gehl (2010) [16], examine the interplay between urban design and pedestrian behavior, offering invaluable insights into how physical spaces shape social interactions and mobility patterns. Frank et al. (2022) [13] further investigate the effects of built environments on public health, establishing a clear narrative that links urban planning with physical activity levels and overall community health. Moreover, the integration of green infrastructure into urban design has emerged as a vital strategy for enhancing resilience and community engagement. Chadwick (2012) [17] illustrate the multifaceted benefits of urban greening initiatives, emphasizing their role in promoting ecological sustainability and improving community dynamics. These studies provide a necessary lens through which to view the potential impacts of green infrastructure on enhancing walkability and fostering social cohesion.
Recent empirical research utilizing spatial analysis techniques also contributes significantly to our understanding of walkability metrics in urban contexts. Manaugh and El-Geneidy (2011) and D’Haese et al. (2014) [14,15] present compelling evidence of how various walkability indicators can be operationalized in urban planning frameworks, offering methodologies that inform our own analysis in this study. By situating our research within this rich tapestry of scholarly discourse, we aim to elucidate the complex relationships between walkability, green infrastructure, and community cohesion in the peri-urban context of Deir Ghbar, ultimately advancing the dialogue on sustainable urbanization.
To address this gap, the present study investigates the role of walkability and green infrastructure as climate adaptation strategies for resilient, cohesive communities in Amman, with a focus on the peri-urban district of Deir Ghbar. Specifically, this research asks: how do spatial characteristics of the built environment, such as street connectivity, land use, and green corridors, influence both the sense of community and climate resilience in rapidly urbanizing, marginal neighborhoods?
This study aims to (1) quantify objective walkability and green infrastructure attributes using GIS-based metrics; (2) assess their relationship with residents’ sense of community through spatial regression analysis; and (3) map the spatial distribution of vulnerability and resilience indicators at the census-block level. By positioning Deir Ghbar as a representative peri-urban model, this research aspires to enhance the evidence base for spatial planning practices that directly support the United Nations Sustainable Development Goals (SDGs), notably SDG 11 (Sustainable Cities and Communities) and SDG 13 (Climate Action).
This work fills a significant knowledge gap at the intersection of urban form, social cohesion, and climate adaptation in the Jordanian context. It provides actionable guidance for urban planners and policymakers seeking to foster inclusive, sustainable, and climate-resilient neighborhoods, both within Amman and across cities facing similar urban transitions in the Global South.

2. Literature Review

2.1. Residential Urban Accessibility and Walkability

Urban accessibility, the ease with which residents can reach goods, services, and opportunities, has been a cornerstone of sustainable planning and transport research for decades. Recent work by Ibrahim et al. (2024) [18] demonstrates how spatial multi-criteria analysis can quantify neighborhood morphologies’ impact on walkability, aligning with our composite index approach (land-use mix and connectivity). Their findings validate the necessity of context-specific metrics for peri-urban areas like Deir Ghbar. This builds on foundational frameworks from Geurs and Van Wee (2004) [19], who identify the interplay of land use patterns, transportation systems, temporal factors, and user characteristics as fundamental components that dictate community accessibility. Residential accessibility is not merely a function of distance, but reflects the density, quality, and distribution of land uses in relation to effective and equitable transportation means. Studies consistently demonstrate that neighborhoods featuring compact forms, higher population and dwelling densities, interconnected street networks, and diverse land use patterns foster enhanced accessibility [20,21]. Such conditions support shorter travel distances, a greater share of active and public transport modes, and improved physical and social well-being for inhabitants.
These relationships are particularly salient in the Middle Eastern context, where rapid urbanization has often resulted in negative externalities, such as congestion, pollution, physical inactivity, and social exclusion. As Handy and Clifton (2001) [22] argue, the placement of retail and essential services near residential neighborhoods is critical for promoting pedestrian accessibility and reducing car dependency. Accessibility, therefore, serves as a foundation for interventions aimed at both fostering livability and framing climate-resilient urban development.

2.2. Walkability and Green Infrastructure as Climate Adaptation in the Middle East

The literature on objective walkability assessments underscores the multitude of built environment factors that influence how, and how much, people walk in urban neighborhoods. Key walkability attributes include the land-use mix, street connectivity, retail density, and residential density [11,13,15]. When neighborhoods provide a high degree of street connectivity, higher concentrations of households, and a rich mix of residential, commercial, and public amenities, walking becomes a more attractive and feasible choice [23,24]. Walkability metrics also extend beyond density and connectivity to the quality and character of the pedestrian environment. Studies have highlighted the importance of street design, the availability and continuity of sidewalks, road-crossing ease, perceived and actual safety, and the presence of green features, such as street trees and urban landscaping [10,25]. These features not only stimulate walking as part of daily activity, but they also reinforce a sense of place and collective identity at the neighborhood scale [11].
In recent years, research and policy discourse have acknowledged the significant role of green infrastructure as a cornerstone of urban climate adaptation and resilience, especially in arid and semi-arid contexts like the Middle East [1,5]. GI interventions, including tree-lined streets, shaded sidewalks, permeable pavements, rain gardens, and urban pocket parks, not only increase walkability and public health outcomes but also directly mitigate urban climate vulnerabilities, such as heat island effects and flood risk [26]. The integration of GI with walkable spatial structures is especially relevant for peri-urban Jordan, where landscapes are rapidly transforming and where infrastructure capacity often lags behind population growth.
Street connectivity and mixed land use, both central to walkability frameworks, are inherently aligned with GI principles since they enable green corridors, support stormwater infiltration, and reduce the extent and impacts of impervious surfaces [5,10]. Climate-resilient design in Middle Eastern cities, such as water-efficient landscaping and the prioritization of urban shade, arises as both an adaptation to increasing heat extremes and a health imperative, reducing surface and air temperatures and supporting thermal comfort for pedestrians [1].
While the global literature emphasizes the role of green infrastructure (GI) as a cornerstone for urban climate adaptation and resilience, contributing to urban cooling, stormwater management, and improved public health outcomes [5,10,26], applications in the Middle Eastern context require tailored approaches due to arid conditions and cultural preferences. For example, traditional sikka (alleyway) networks in historic Arab cities like Cairo and Damascus demonstrate how shaded, narrow pathways naturally enhance thermal comfort and social interaction, a design legacy largely absent in modern car-centric developments. Cultural adaptations in streetscape design are further explored by Addas and Alserayhi (2020) [27], who identify shaded arcades and wind-catching architectural features as key elements for pedestrian comfort in Saudi Arabian cities. Their work reinforces the need to adapt walkability frameworks to regional climatic and cultural norms, rather than importing Eurocentric models.
Recent studies in Riyadh and Dubai further reveal that native drought-resistant vegetation (e.g., Ziziphus spina-christi) can reduce surface temperatures by up to 4 °C while requiring minimal irrigation. However, such solutions are rarely implemented in Jordan’s peri-urban fringe, where imported planning models prioritize vehicular access over microclimatic design. This gap highlights the need for context-sensitive GI frameworks that align walkability with ecological and cultural sustainability. Recent studies in hot–humid Gulf cities empirically validate the cooling effects of urban vegetation. Al-Hajri et al. (2025) [28] measure temperature reductions of 2.5–4.1 °C in streets with dense native tree canopies in Bahrain and Qatar, underscoring the potential for similar interventions in Jordan’s arid climate. Their findings align with this study’s emphasis on street trees as a dual strategy for thermal comfort and walkability.
The climate of Amman, the study area, is characterized by hot and dry conditions throughout the year. According to a study conducted by UN Habitat (2022) [1] examining Amman’s Spatial Profile, average temperature readings indicate a significant seasonal fluctuation: spring (March to May) averages 18 °C, summer (June to August) typically reaches 28 °C, autumn (September to November) averages around 20 °C, and winter (December to February) dips to an average of 8 °C. This range is crucial when considering heat stress in urban environments, particularly for vulnerable demographics, including the elderly, infants, and those with pre-existing health conditions.
The dynamic nature of urban heat vulnerability further complicates walkability planning. Lau et al. (2023) [29], employing multi-source data, reveal that heat risk exhibits significant spatiotemporal variation, fluctuating diurnally and seasonally. Consequently, a walkable route that is thermally comfortable in the morning may become a health hazard by midday. This temporal instability necessitates a more nuanced understanding of pedestrian exposure beyond static urban form metrics [29]. Ignoring these dynamics risks creating walkable networks that are unusable during critical periods, particularly heatwaves, thereby limiting their public health utility and excluding thermally sensitive populations. Research has shown that high temperatures can adversely impact pedestrian comfort in hot and arid regions. A significant study by UN Habitat (2022) [1] investigates the urban heat island effect in Amman, revealing that streets enriched with ample vegetation can experience air temperature reductions of up to 4 °C (7.2 °F). Furthermore, Jun et al. (2015) [30] emphasizes the necessity for design strategies focused on reducing heat stress, suggesting interventions such as incorporating shading devices like trees, canopies, or umbrellas, along with using insulating pavements and developing eco-friendly public spaces designed for natural ventilation.
Additionally, a systematic review by Aflaki et al. (2017) [31] underscores global methodologies for mitigating heat island effects in urban settings and highlights the effectiveness of green infrastructure elements, such as urban forests, rooftop gardens, and community green spaces, crafted for thermal comfort and recreational purposes. This body of literature provides valuable insights that can inform the walkability assessment in Amman by emphasizing the interplay of urban design, climate considerations, and pedestrian comfort. Moreover, while most studies addressing urban vegetation’s impact on outdoor thermal comfort have focused on hot–humid climates—such as those in Bahrain, Qatar, and Saudi Arabia—research by Jun (2015) [30] demonstrates that densely vegetated urban areas can reduce air temperatures significantly, with reductions noted at up to 2.9 °F (1.6 °C), alongside substantial decreases in surface radiation. This indicates the critical need for tailored assessments of urban environments within Amman, specifically looking at how variations in solar radiation, vegetation cover, and other factors influence walkability and outdoor comfort.
Crucially, the evidence points to green and blue infrastructure (GBI) as a primary mediator for mitigating heat-related health risks within walkable environments. Research by Lau et al. (2023) [29] demonstrates that urban greenery, through shading and evapotranspiration, significantly reduces ambient temperatures and surface heat, directly enhancing thermal comfort for pedestrians. This cooling effect is not merely an amenity; it is a vital public health intervention. Integrating robust GBI—such as street trees, green corridors, and parks—along walking routes transforms walkable designs from potentially hazardous pathways into resilient, health-promoting corridors [29]. By actively lowering local temperatures, GBI enables safe physical activity during warmer periods, protects vulnerable populations, and amplifies the co-benefits of walkability, including improved air quality and mental well-being [29].
Finally, the intersection of heat vulnerability and walkability demands an equity-focused approach. Studies mapping socio-spatial disparities in heat risk, such as that conducted by Lau et al. (2023) [29] in Hong Kong, reveal that vulnerable populations often reside in areas with deficient GBI and high urban heat island intensity. Therefore, promoting truly healthy walkable neighborhoods requires prioritizing cooling interventions, such as targeted tree planting and green space development, within these high-risk, often underserved communities [29]. Integrating heat vulnerability assessments into walkability planning ensures that investments in pedestrian infrastructure deliver equitable health benefits, safeguarding all residents’ right to safe mobility and outdoor activity in a warming climate.

2.3. Walkability Indices, GIS Applications, and Climate-Resilient Urban Planning

GIS-based methods have revolutionized the ability to objectively assess, quantify, and visualize walkability at multiple scales within urban areas. Pioneering work by Leslie et al. (2007) [11] and others have developed composite walkability indices integrating net residential density, intersection density (as a proxy for street connectivity), land-use entropy (to capture the diversity of land uses), and, in some studies, retail or commercial floor area ratios [13,24]. These indices are spatially applied to census blocks or similar urban divisions, enabling granular insights into patterns of accessibility and pedestrian-friendliness. GIS approaches also facilitate the mapping of green infrastructure assets, such as parks, tree canopy coverage, and permeable surfaces, permitting a nuanced understanding of how GI and built environment features co-distribute in urban form [14]. This technical capacity is increasingly critical in the context of climate resilience: spatial analysis can identify not only hot spots of low walkability or social vulnerability, but also opportunities for targeted GI interventions that maximize cooling, infiltration, and equitable amenity access [5,32].
Recent reviews and frameworks from the IPCC and the European Commission stress the importance of integrating walkability, GI, and social considerations into urban climate adaptation strategies. In cities like Amman, facing the twin pressures of population growth and escalating climate hazards, this integrated approach is essential for delivering sustainable, climate-resilient communities [1].

2.4. Sense of Community, Social Cohesion, and Urban Form

A robust body of research confirms that neighborhoods with higher walkability and inclusive urban design foster a stronger sense of community and higher levels of social cohesion) [3,33,34]. Sense of community describes a multifaceted construct involving feelings of belonging, shared identity and history, reinforcement of social relationships, and neighborhood-level engagement [7,35]. Neighborhood environments that offer public gathering spaces, accessible green infrastructure, and pedestrian-oriented form are especially effective in building and sustaining this sense of collective belonging [4,6].
Furthermore, the health and psychological benefits derived from strengthened community ties are well-established. A supportive neighborhood context endowed with walkable, green public spaces has been linked to higher life satisfaction, reduced incidences of loneliness and depression, and improved physical health outcomes [12,34]. Conversely, car-centric, fragmented environments may act as barriers to interaction, exacerbating feelings of isolation, deepening socioeconomic divides, and undercutting the well-being of marginalized groups [33,35]. Critically, while the positive association between walkability and sense of community is well-reported in the literature, gaps persist in quantifying these relationships in rapidly urbanizing, peri-urban Middle Eastern settings, where the combined impacts of social, spatial, and environmental vulnerabilities intersect most acutely.

2.5. Knowledge Gaps and Rationale for This Study

Despite global evidence attesting to the synergies between walkability, green infrastructure, and resilient community outcomes, significant regional gaps remain. Comparative studies integrating GIS-based walkability analysis, GI assessment, and community-level social outcomes in the Middle East, particularly in the context of peripheral or marginal urban growth, are rare [14,15]. Likewise, the interface between spatial planning and ACC strategies, especially for secondary cities and marginal peri-urban zones, is under-theorized and empirically limited.
This research addresses these gaps by examining the objective built-environment correlates of both social cohesion and climate resilience in Deir Ghbar, a rapidly transforming peri-urban district in Amman. This study advances the literature by (1) integrating contemporary green infrastructure and climate adaptation frameworks with established walkability indices, (2) utilizing advanced GIS spatial analytical methods, and (3) situating the findings within the context of SDG targets for sustainable urbanization and climate action (SDGs 11 and 13). In doing so, this paper provides new empirical insights and practical recommendations for leveraging spatial planning as a tool for building resilient, equitable, and adaptive communities in Jordan and beyond.

3. Methodology—GIS-Driven Assessment of Walkability and Social Cohesion

This study adopted a quantitative, correlational research design to assess the impact of objective walkability on the sense of community in the peri-urban Deir Ghbar neighborhood of Amman. The approach integrated GIS spatial analysis and household survey data to provide a multi-scalar perspective on built environment attributes and social outcomes.

3.1. Research Design and Hypotheses

This study employed a spatially explicit, correlational design to investigate how walkability metrics influence social cohesion in peri-urban neighborhoods. This research addresses two key inquiries:
(1)
Spatial Inquiry:
  • How do objectively measured built-environment attributes (street connectivity, land-use mix, and retail/residential density) correlate with a sense of community across census blocks?
  • What is the spatial distribution of walkability and its relationship with community resilience?
(2)
Policy Inquiry: What GIS-derived insights can inform climate-resilient planning in marginalized peri-urban areas?
To answer these, we integrated GIS-based spatial analysis (land-use maps, street networks, and building footprints) with household survey data (n = 380) to measure the sense of community. Spatial regression (OLS) then quantifies relationships between walkability metrics and social outcomes at the census-block level, providing actionable insights for climate-resilient urban planning.

3.2. The Study Area and the Marginality of Deir Ghbar’s Periphery

This research was conducted in Deir Ghbar, a contemporary residential district in western Amman. With a total area of 1.9 km2, the neighborhood comprises 0.6 km2 of streets and 1.3 km2 of land parcels (Figure 1). Figure 1 shows the official division of Deir Ghbar census blocks within the context of Amman, Jordan. The inset map displays the location of the study area, highlighting Deir Ghbar’s position relative to significant landmarks and neighborhoods in Amman, thereby contextualizing the site within the broader urban landscape.
Deir Ghbar is characterized by fragmented street networks, limited pedestrian facilities, and the absence of commercial amenities within walking distance, requiring residents to rely on private automobiles or access neighboring districts for their daily needs. This spatial disconnection has pronounced effects on the neighborhood’s peripheral inner areas, where essential urban services and green spaces are sparse, and walkability is notably poor. The distribution of building types and census blocks is illustrated in Figure 2.
Deir Ghbar’s residential fabric consists of three main housing typologies (A, B, and C), with Types A and B representing high-income, low-density zones that dominate the neighborhood (87% of the land area). The spatial distribution of these housing types is shown in Figure 3.

3.3. Study Population and Sampling

This study aimed to achieve a comprehensive representation of the Deir Ghbar neighborhood, which contains a total population of 17,450 residents (9112 males and 8338 females) distributed among 4679 households, as reported by the Department of Statistics [2]. All households across the neighborhood’s 50 census data blocks (CDBs) were eligible for inclusion in the sampling frame (see Figure 1).

3.3.1. Sample Size Determination

The required minimum sample size was calculated using the Krejcie and Morgan formula (1970) [36], which is widely used for determining sample sizes in finite populations to achieve statistically significant results. Based on this formula and the total number of households (n = 4679), the minimum recommended sample size was approximately 380 households. This number ensures a 95% confidence level with a 5% margin of error, which is considered appropriate for social and spatial studies on this scale [36].

3.3.2. Sampling Technique

Sampling was conducted using a random proportional cluster approach. The 50 CDBs defined the neighborhood’s spatial clusters. The total calculated sample size (380) was proportionally allocated across these clusters, resulting in the selection of approximately 8 households per CDB (380 ÷ 50 = 7.6, rounded up to 8 for even sampling coverage in each block).

3.3.3. Sampling Procedure

Within each CDB, households were selected using systematic random sampling. The minimum number of households in any single CDB was 62. Starting from a random point, every fifth residential unit was approached for participation, proceeding sequentially along one side of the street and continuing vertically in multi-story buildings. In apartment complexes, units were counted starting from the right-hand side on each floor until the fifth unit was reached. If a selected household declined participation or was unavailable, the enumerators moved to the next eligible unit until the target of eight completed responses per CDB was reached. This procedure ensured both randomness and spatial dispersion of the sample, minimizing intra-block sampling bias.

3.4. Data Collection Procedures and Instruments

In order to enhance the credibility and repeatability of this research, we provide explicit details regarding the sources and years of collection for the key data utilized in the analysis. The spatial data for walkability analysis was obtained from the Greater Amman Municipality and the Department of Statistics. Specifically, we used land-use maps (2020), street centerline maps (2019), retail location maps (2020), and building footprints (2017). By incorporating this information, we allow readers to evaluate the authority and reliability of the data used in this study.

3.4.1. Questionnaire

The data collection was based on structured, face-to-face interviews with the heads of the households. The participants were given a detailed introduction and assurances of confidentiality. The questionnaire included a structured set of items designed to assess the respondents’ sense of community. This construct was measured using a five-point Likert scale, where respondents indicated their level of agreement with each statement, ranging from 1 (Strongly Disagree) to 5 (Strongly Agree). The specific items included in the scale were as follows:
  • Feeling at Home: ‘I feel at home in my neighborhood.’
  • Neighborhood Solidarity: ‘Residents in my neighborhood help each other.’
  • Relationships with Neighbors: ‘I have strong relationships with my neighbors.’
  • Community Events: ‘There are community events in my neighborhood that I enjoy attending.’
  • Neighborhood Cooperation: ‘Neighbors work together for the good of the community.’
These items were adapted from the established literature in community studies (e.g., Chavis & Wandersman, 1990 [7]) and aimed to capture various dimensions of the sense of community, including belonging, engagement, and social relationships. The overall internal consistency of the scale was evaluated using Cronbach’s alpha, which yielded a coefficient of 0.87, indicating good reliability of the measurement.

3.4.2. GIS Data Sources

The spatial data underpinning the walkability analysis were acquired from the Greater Amman Municipality (GAM) and the Department of Statistics (DoS). Geographic vector datasets used in this study included the following:
  • Land-use maps for analysis of land-use mix.
  • Street centerline maps for measuring street connectivity.
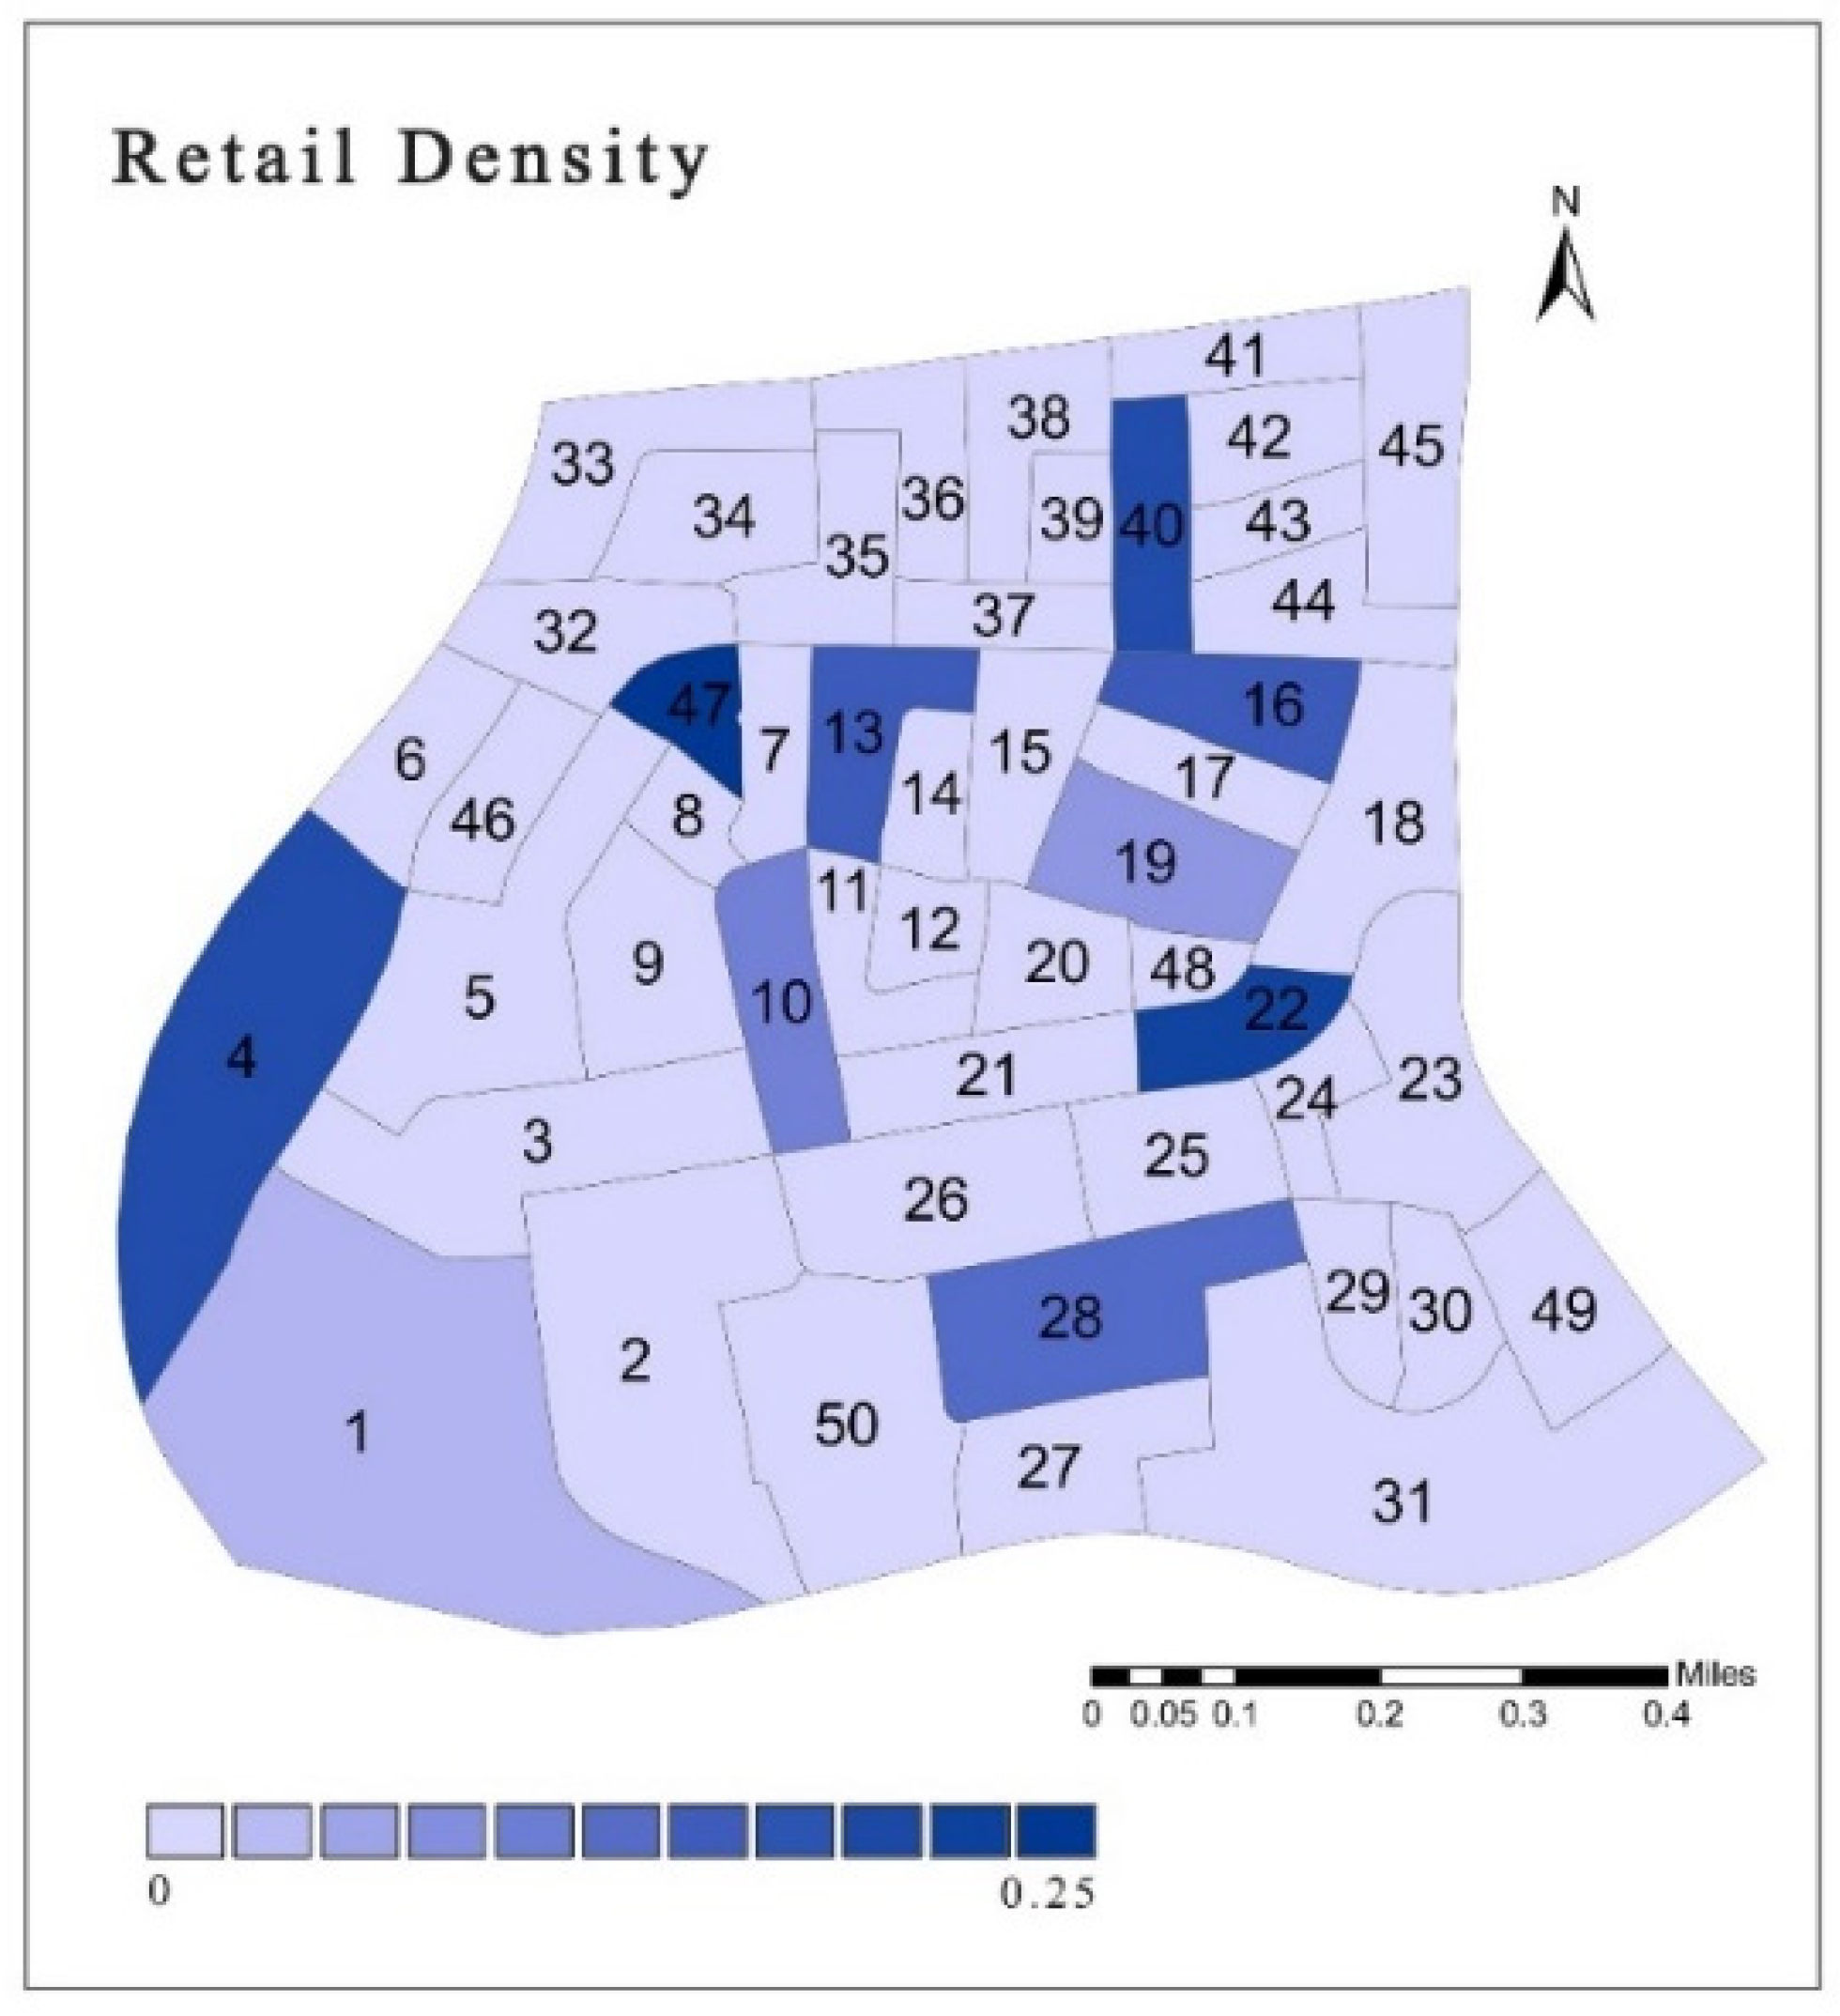
  • Maps of retail locations to evaluate retail density by CDB.
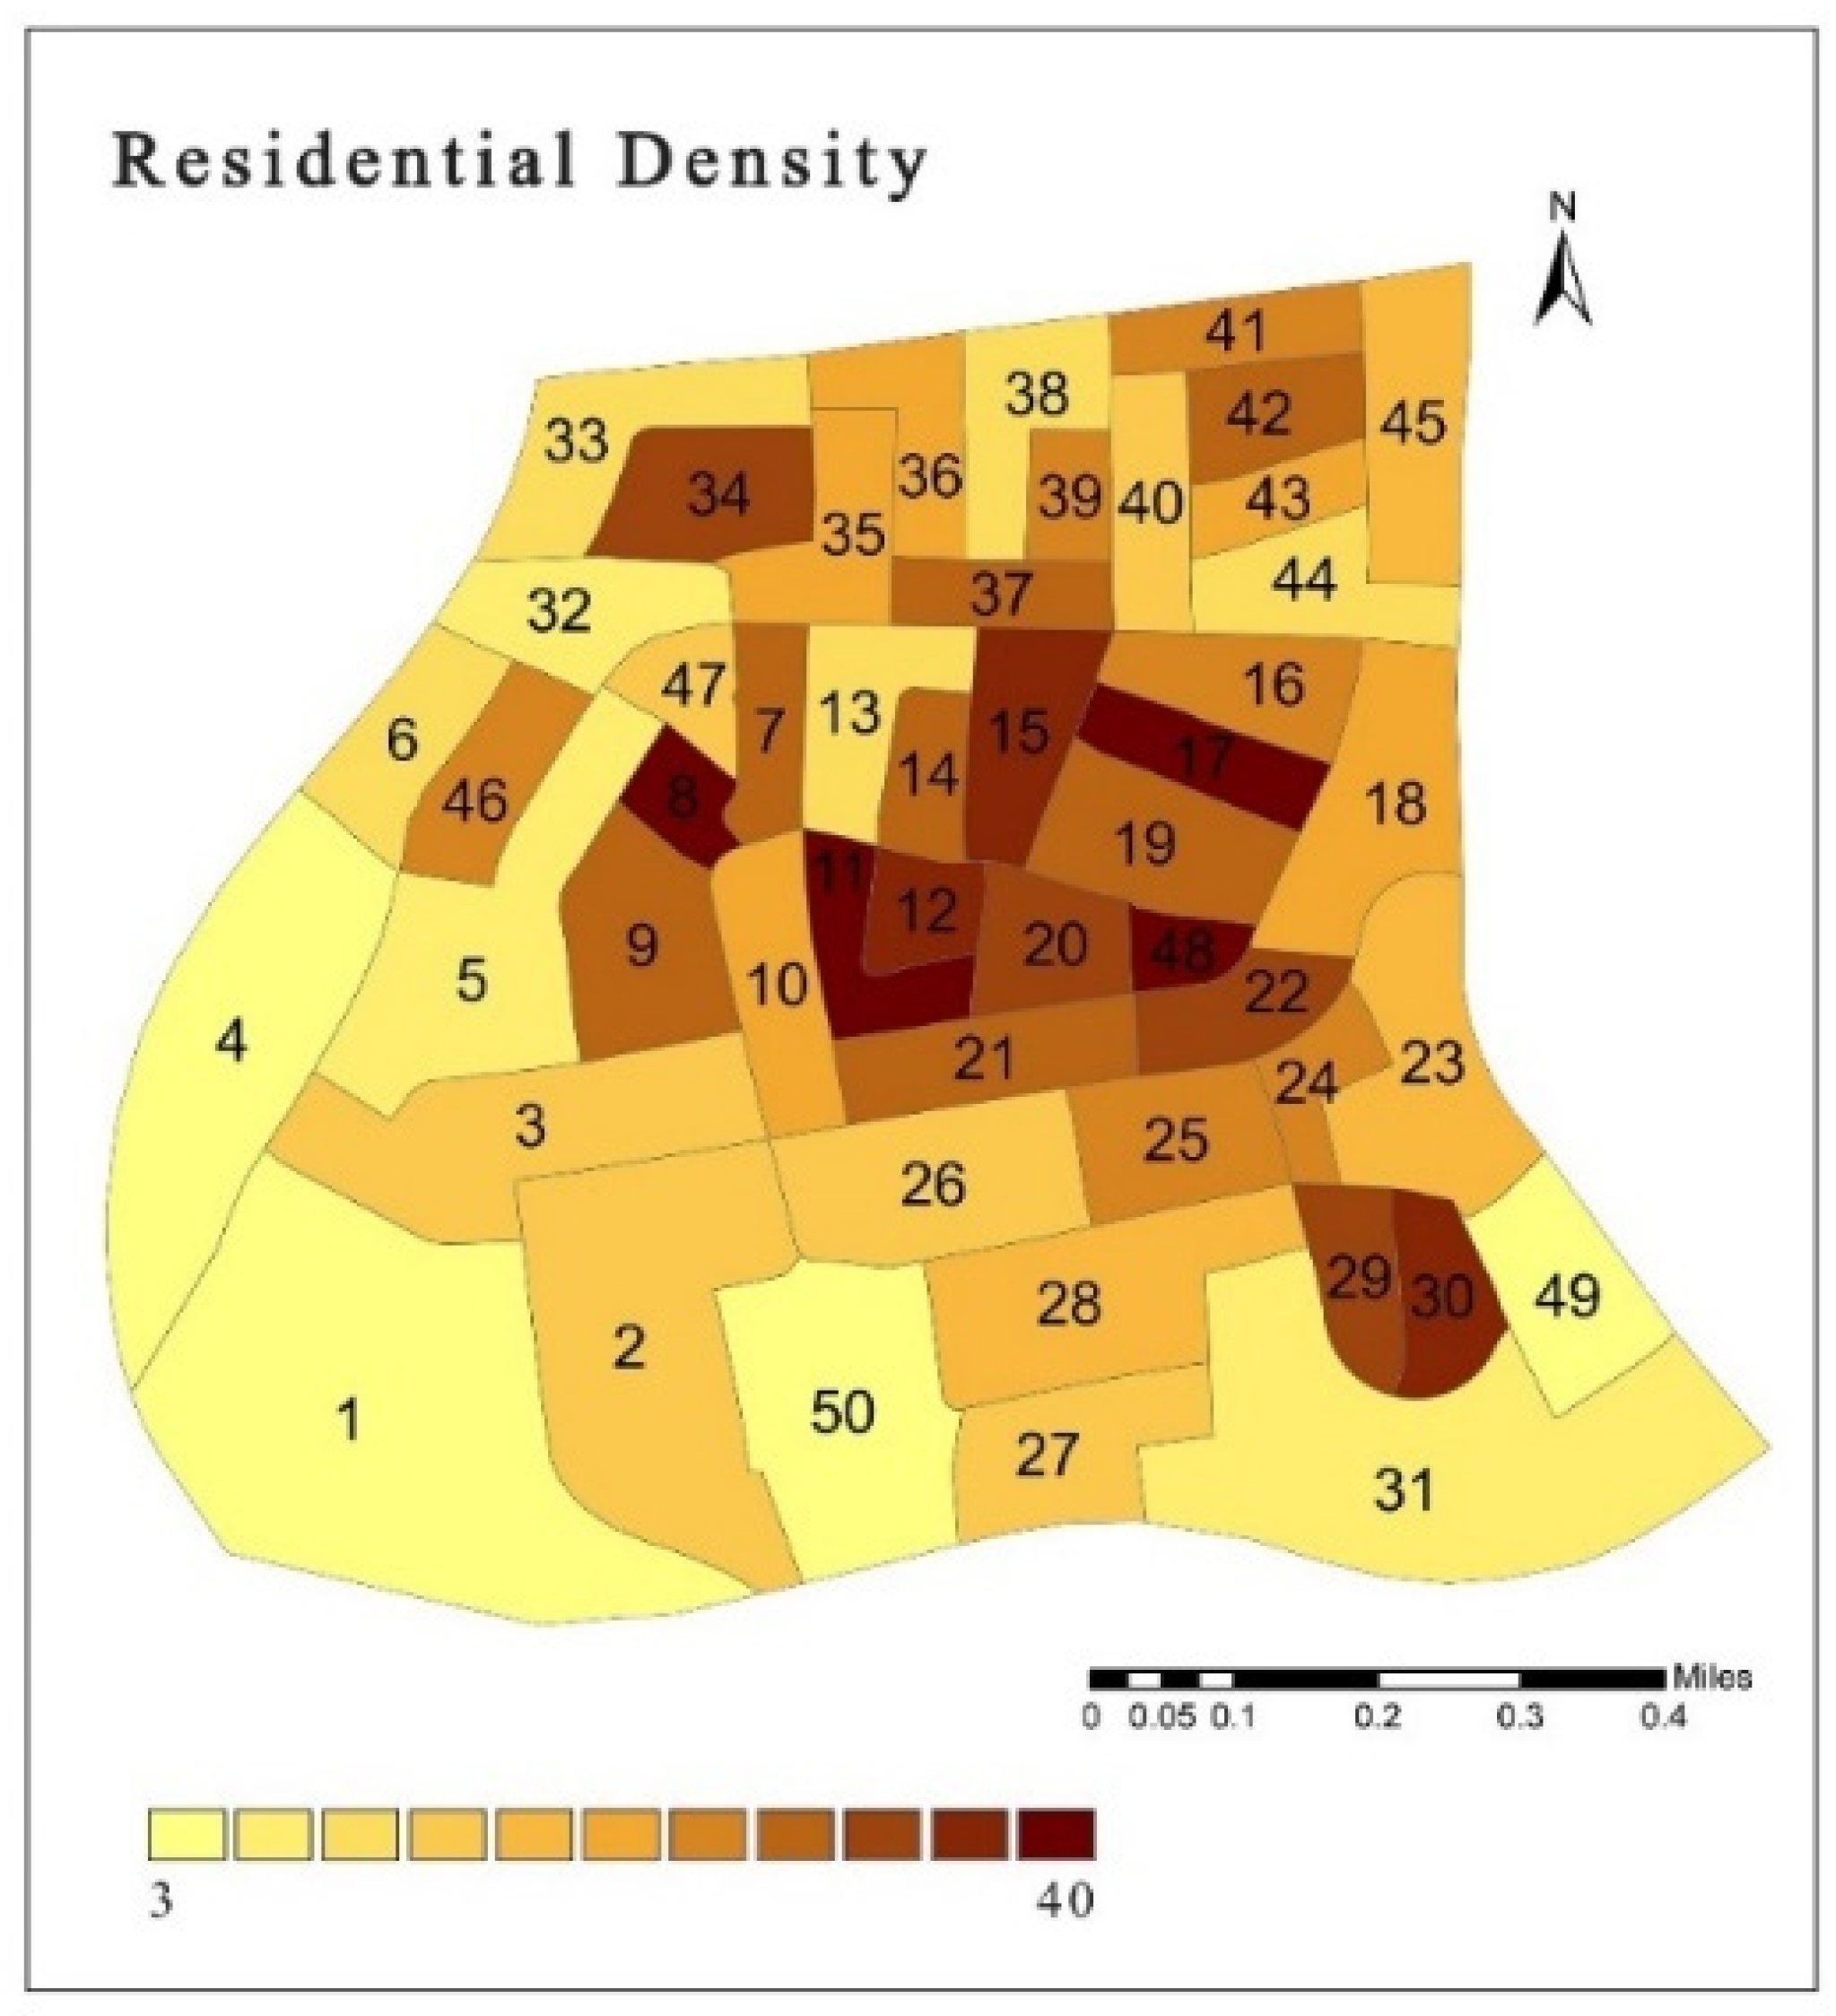
  • Building footprints and building height maps to determine residential density across the neighborhood.
These datasets provided spatial boundaries (census blocks) and built environmental attributes necessary for all subsequent GIS-based measurements and mapping.

3.5. Operationalization of Key Variables

3.5.1. Objective Walkability Index

Following established methods [11,13], objective walkability was defined using four principal components, as follows:
  • Land-use mix: Calculated as the ratio of non-residential land to the area of each CDB, expressed as a proportion on a scale of 0–1, and binned into five levels in GISs.
  • Street connectivity: Assessed by counting the total number of street intersections (nodes) within each block, divided by block area in acres, and collapsed into five ordinal levels.
  • Retail density: Quantified as the number of retail uses per acre within each census block, similarly scaled and categorized.
  • Residential density: Operationalized as the number of households per unit area in acres, computed from official statistics, and expressed on a scale comparable to the other measures.
In calculating the comprehensive walkability score for Deir Ghbar, we selected four principal components: land-use mix, street connectivity, retail density, and residential density. These indicators were chosen based on empirical evidence that demonstrates their significance in fostering pedestrian-friendly environments.
One of the primary justifications for this selection is grounded in the existing literature, which suggests that a diverse land use is crucial for increasing accessibility and reducing reliance on motor vehicles [13].
The land-use mix evaluates the effectiveness of how varied the use of spaces (commercial, residential, etc.) is within each census block (CDB), which is critical in fostering walkability. The land-use mix encourages diverse uses within neighborhoods, such as grocery stores, schools, parks, kindergartens, hair salons, fitness facilities, and other everyday services. When the land-use mix is high, it is more likely that these services are available within walking distance from home, which encourages residents to walk to these destinations. Similarly, street connectivity enhances access and mobility. In neighborhoods with high street connectivity—such as well-connected grid layouts with frequent intersections—residents can access destinations more efficiently on foot, benefiting from minimal detours, multiple route choices, and shorter direct routes to schools or shops. This reduces reliance on cars while encouraging pedestrian activity. Conversely, areas with sparse street networks, like Deir Ghbar’s periphery, force longer indirect paths that discourage walking. Furthermore, higher residential density (e.g., 40 households/acre in CDB 48) creates a critical mass of pedestrians, while greater retail density (e.g., 0.25 establishments/acre in CDB 47) ensures essential services remain within convenient walking distance, further supporting walkable communities. Retail density also promotes closer proximity to essential services, as higher retail density indicates the availability of more commercial services within a walkable distance from home. Moreover, residential density supports higher pedestrian volumes, meaning more residents choose walking as their travel behavior. Future research may explore the application of distance weights to retail density to assess its impact more effectively.
Similarly, street connectivity, measured by the number of intersections within each CDB, is essential. Interconnected street networks encourage pedestrian movement and facilitate easier access to community resources [10]. While motor vehicle lanes often deter pedestrian activity—particularly when designed as wide roads without crossings—their integration into neighborhood networks can still enhance overall connectivity when properly planned. The key lies in complementary pedestrian infrastructure: continuous sidewalks, clearly marked crosswalks, traffic calming measures, and shaded crossings. In Deir Ghbar’s central blocks, for example, arterial roads that incorporate these features successfully balance vehicular and pedestrian needs. Effective design must, therefore, mitigate pedestrian deterrence through three essential elements: unbroken sidewalk networks, safe crossing opportunities, and reduced traffic speeds—all critical for achieving walkability objectives.
The treatment of retail density reflects the accessibility of essential services within walking distance. This metric is significant for promoting pedestrian activity and social interaction, particularly in contextually car-centric urban environments [22]. Lastly, residential density, which reflects the number of households per unit area, is crucial because higher densities contribute to the viability of neighborhoods supporting walkable infrastructures, in addition to fostering social interactions among residents [11]. Regarding potential distance weights applied to retail density, future research can build upon this foundational work by exploring distance decay functions to evaluate how proximity influences the effective walkable score. We recognize that several other indicators, such as sidewalk availability, pedestrian safety, and the quality of streetscapes, could enhance the comprehensiveness of the walkability index. However, for this study, we prioritize these four indicators, given their established relevance in the existing literature and the context of the Deir Ghbar neighborhood.
In assigning a comprehensive walkability score by summing up the standardized sub-component values of the land-use mix, street connectivity, retail density, and residential density, it is crucial to recognize that the influence of each of these indicators on walkability can vary significantly. Therefore, an evaluation of potential weightings for these indicators is warranted to enhance the accuracy and reliability of the walkability index employed in this study. To effectively address this concern, we acknowledge that a weighted composite index for walkability can provide a more nuanced representation of walkability in Deir Ghbar. The previous literature suggests that different factors contribute disproportionately to pedestrian activity [15]. For example, research shows that while the land-use mix is essential for fostering diverse environments where walking is attractive, residential density may exert a stronger influence on actual pedestrian volumes due to higher population concentrations in these areas [11]. The basis for setting weights can be derived from empirical studies that have quantified the relationship between each walkability sub-component and walking behavior. For instance, Landis et al. (2001) [37] framework assigns weights to components based on their visibility and perceived importance to walkability, leading to improved predictive capacities regarding pedestrian behavior in urban settings [37].
Our initial assessment focuses on equal weighting for simplicity due to the exploratory nature of this study; however, we recognize the potential for enhanced robustness through weighted analyses. Incorporating weights could also serve to address variations in community perceptions of each factor’s significance. Future research should investigate the appropriate weightings for each factor based on their empirical impact on pedestrian activity. For example, studies indicate that residential density often exerts a stronger influence on walking behaviors compared to other indicators [37]. Hence, future models may benefit from integrating these weighted analyses to enhance the accuracy of predictions regarding community cohesion attributes.
All variables were mapped and spatially visualized at the CDB level using GIS tools. A composite objective walkability score for each block was then generated by summing these standardized component values.

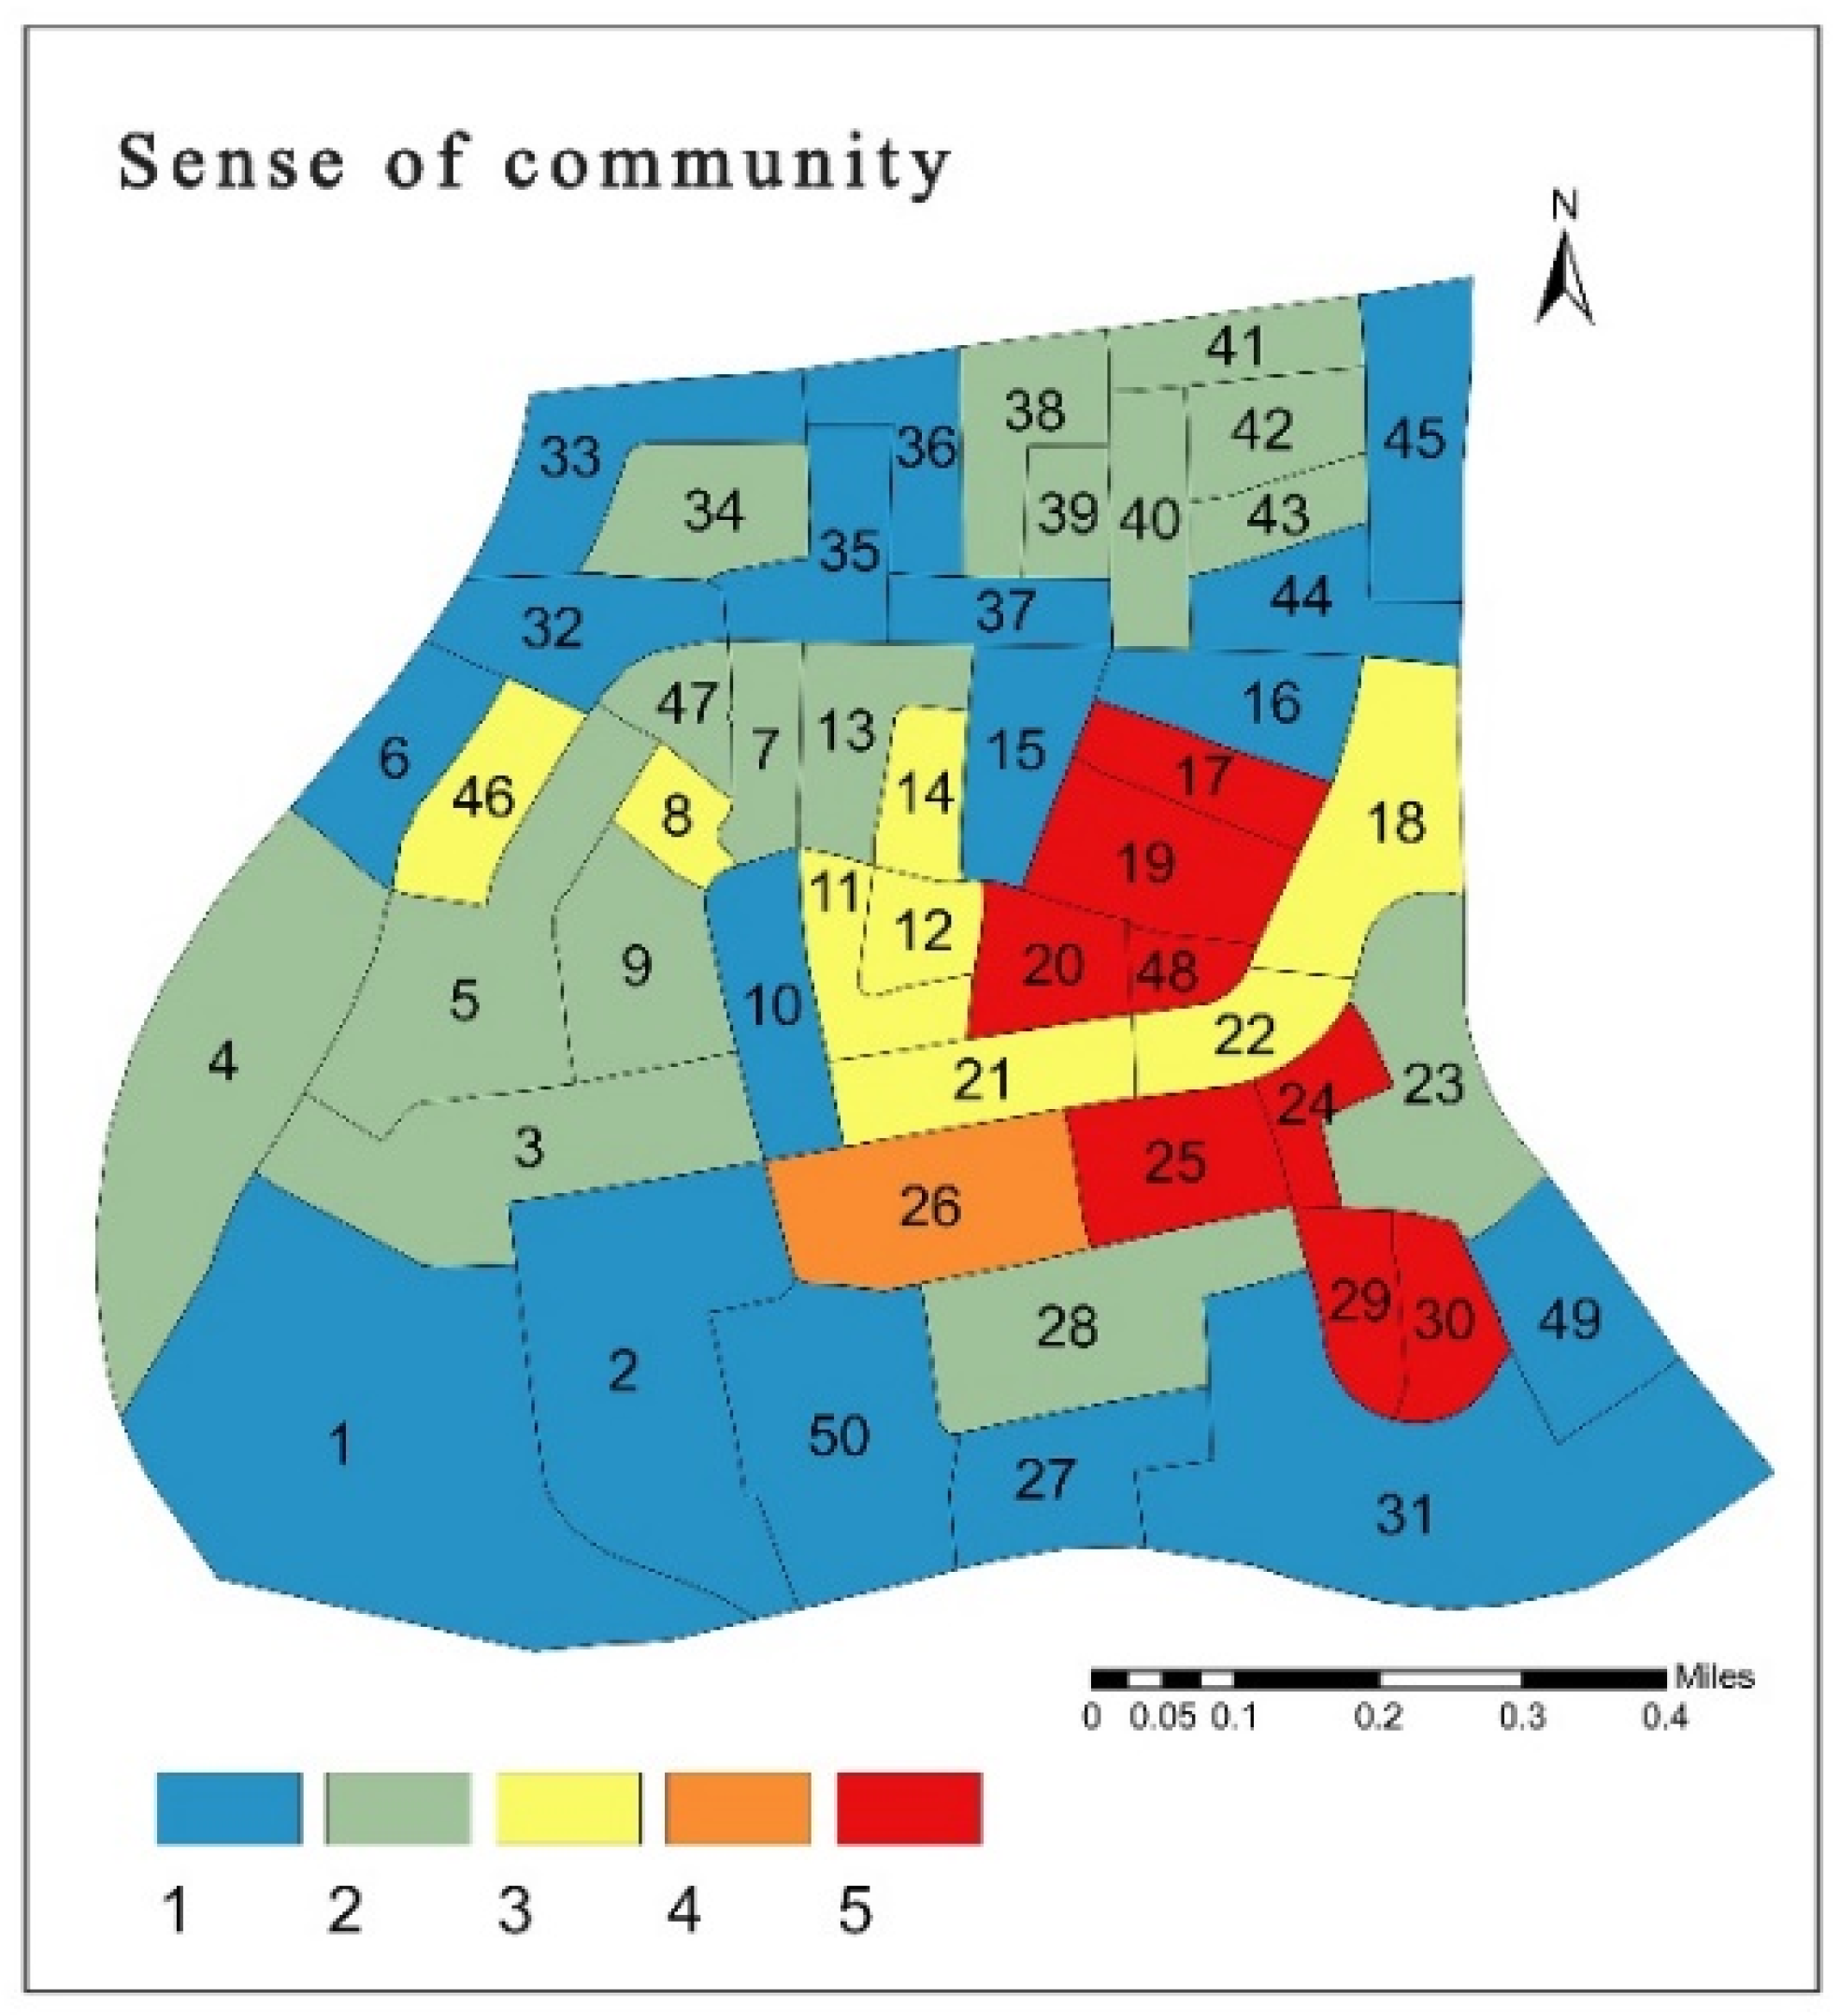
3.5.2. Sense of Community Variable

The survey data on the sense of community were averaged for each CDB (total points earned across households divided by the number of respondents in the block) and spatially mapped to show the heterogeneity of community sentiment across the neighborhood.

3.6. Integration of Green Infrastructure in Methodology

In this study, green infrastructure was systematically integrated into the methodology to assess its influence on walkability and community resilience. Utilizing GIS technology, we quantified various GI elements—including tree canopy coverage, the presence of parks, and permeable surfaces—across the study area of Deir Ghbar. These metrics were crucial for evaluating how GI contributes to enhancing the walking environment, which, in turn, promotes pedestrian activity and social interaction. As identified in the Methodology section, we utilized spatial analysis to map the distribution of these GI components in relation to the walkability indices derived from pedestrian connectivity and residential density measures.
Research has consistently shown that areas with increased GI not only provide ecological benefits—such as stormwater management and urban cooling—but also significantly improve pedestrian comfort and safety [5,10]. For instance, shaded sidewalks generated by street trees can lower surface temperatures, mitigating heat stress and making walking a more appealing choice for residents, especially during the hotter months [28]. Furthermore, the presence of parks and green spaces fosters a sense of community and encourages outdoor social gatherings, contributing further to walkability. The findings of our spatial regression analysis also revealed a strong correlation between the extent of GI elements and residents’ sense of community, affirming that successful pedestrian-oriented planning must incorporate attractive and functional green spaces to be truly effective. Thus, by embedding GI into our methodological framework, we demonstrate that it is a fundamental component in enhancing walkability, ultimately making it a preferred urban design option for sustainable and resilient neighborhoods.

3.7. Spatial Analysis and GIS Modeling

GISs served as the central analytic platform, facilitating visualization, multi-variable spatial overlay, and statistical analysis across census blocks. The workflow integrated GIS layers for land use, streets, retail, and buildings at the CDB level, followed by the calculation of walkability attributes and sense of community per block. The survey and spatial data were merged using GIS join tools, while spatial regression (Ordinary Least Squares, OLSs) tested the associations between walkability subcomponents and the sense of community, evaluating whether higher walkability scores predicted stronger community ties at the spatial–unit level. Model residuals and significance were visualized via histograms and hotspot/coldspot maps to identify spatial clusters of association strength. The OLS regression model explicitly tested H1–H3 by quantifying the relationship between walkability components (independent variables) and sense of community (dependent variable), controlling for spatial autocorrelation (Moran’s I).
In this study, Ordinary Least Squares (OLS) regression was selected as the primary analytical method due to its effectiveness in modeling the relationship between independent variables (walkability components) and a single dependent variable (sense of community). The OLS regression is particularly advantageous in this analysis because it provides an efficient and unbiased estimate of the coefficients associated with each predictor variable when the assumptions of linearity, independence, homoscedasticity, and normality are met. The OLS regression assumes (1) a straight-line relationship between variables, (2) data points are unrelated (no hidden patterns), (3) consistent variability in errors, and (4) normally distributed residuals. Additionally, OLS allows for the incorporation of multiple independent variables simultaneously, enabling us to assess the relative contribution of each walkability metric to the sense of community observed in Deir Ghbar. Furthermore, the use of OLS supports straightforward interpretation of the results, facilitating the communication of findings to both academic and policy-oriented audiences. By employing this method, we aim to provide robust insights into how specific attributes of the built environment influence social cohesion, thereby informing future urban planning and policy decisions. While OLS regression assumes linearity, our Moran’s I test confirmed spatial independence (p > 0.05), validating the model’s robustness for neighborhood-scale analysis.
Before conducting spatial regression analysis, we performed a Moran’s I test to assess spatial autocorrelation in the variables involved. This test is crucial for validating the presence of spatial patterns, thereby ensuring that subsequent hot spot analyses yield reliable results. Should the data demonstrate significant autocorrelation, this provides a basis for interpreting clusters with confidence. If not, we will adjust the findings and discuss potential biases arising from simple regression analysis that does not account for spatial dependencies. While this study focuses on spatial metrics, future work could integrate simulation tools like ENVI-met (version 4.4.5) (used by Hegazy & Qurnfulah, 2020 [38]) to quantify how street orientation and building height ratios in Deir Ghbar influence pedestrian-level microclimates. Their findings in Jeddah confirmed that north–south street alignments reduced heat exposure by 15% compared to east–west orientations, suggesting actionable design guidelines for Amman.

3.8. Ethical Considerations

The study protocol was approved by the Institutional Review Board of German Jordanian University (Decision No. GS-F-26/2020). Informed consent was obtained from all survey participants, and the data were managed in accordance with research ethics standards. This methodology enabled a detailed, spatially explicit analysis of the relationship between walkability and the sense of community in a marginal peri-urban neighborhood. By systematically mapping and quantifying built environment attributes alongside community outcomes, the approach provides actionable evidence for targeting planning interventions in similar contexts.
The methodology employed in this study comprehensively supports the claims made in the abstract regarding walkability as a climate adaptation strategy through the systematic use of GIS-based spatial regression analysis and objective walkability metrics. By quantitatively assessing key components of the physical environment, such as street connectivity, residential density, land-use mix, and green infrastructure distribution, we can identify how these factors interact to influence both pedestrian behavior and environmental outcomes. Research has demonstrated that increased walkability brings about a reduction in vehicle dependency, thereby contributing to lower vehicle emissions as residents opt for walking and cycling over driving [13]. Furthermore, the integration of green infrastructure, measured through variables such as the presence of trees, parks, and permeable surfaces, directly addresses the urban heat island (UHI) effect by providing shade and cooling mechanisms that enhance thermal comfort in densely built environments [5]. The use of GISs allows for spatial visualization of how these elements are distributed throughout Deir Ghbar, enabling us to pinpoint areas where pedestrian-oriented design can foster both social cohesion and climate resilience. Thus, the combined application of spatial analysis and walkability metrics substantiates the assertion that adopting walkability-focused urban planning can deliver pivotal climate adaptation benefits.

4. Analysis

4.1. Digital Data Sources and GISs

The analysis began with assembling digital GIS shapefiles of Deir Ghbar, referenced to the national coordinate system used in Jordan. These included vector datasets detailing land use, street centerlines, retail locations, and building footprints with heights. All data were mapped and analyzed using GIS software (version 10.6), facilitating the objective, spatially explicit measurement of walkability and related variables.

4.2. SPSS Projection on GIS Maps

The field-collected survey data were integrated with the spatial datasets in GISs, using the census data blocks (CDBs) as the join key. This enabled simultaneous quantitative and spatial analysis. A GIS-based spatial regression analysis model was developed, visualizing the relationship between the survey-derived measures of sense of community and GIS-calculated walkability attributes across all CDBs. The integration of SPSS (version 26) and GIS data formed the basis for subsequent mapping and regression analyses.

4.3. Sense of Community

The spatial distribution of sense of community, computed as the mean score per census data block (CDB) from household surveys, reveals pronounced heterogeneity across Deir Ghbar (Figure 4). The lowest values were consistently found on the periphery, representing inner areas with both spatial and social marginalization, particularly in low-density zones dominated by Types A and B housing, which are furthest from amenities and green spaces. Conversely, the central CDBs and those with higher residential density, notably Type C housing zones, registered the highest sense of community, reflecting stronger neighborhood solidarity, social relationships, and a deeper sense of belonging. This contrast underscores the double marginalization of peripheral areas, marked by reduced social interaction and limited access to essential services.
The peripheral, low-value blocks in Deir Ghbar illustrate how limited walkability, weak social cohesion, and reduced access to amenities intersect, amplifying vulnerability during heat events, service outages, or emergencies. These spatially and socially marginalized zones, lacking green infrastructure and resilient access routes, demonstrate that socioeconomic marginalization is also a climate risk. Residents in these areas face greater isolation and weakened social networks, hindering collective response during climate-related crises. This pattern underscores the urgent need to address spatial exclusion as a critical vulnerability in an era of increasing climate stress.

4.4. Objective Walkability and Component Analysis

The land-use mix scores vary significantly across Deir Ghbar, with the lowest values in entirely residential blocks and higher scores in census data blocks (CDBs) containing non-residential spaces, primarily near central and arterial roads (Figure 5). This measure, calculated as the area of non-residential use divided by each CDB’s total acreage, revealed that only 16 of 50 CDBs had any non-residential presence, ranging from 0.2 (CDB 41) to just 0.0063 (CDB 1). Street connectivity follows a similar centrality pattern, with the highest intersection densities in the neighborhood’s internal grid, contrasting with the cul-de-sac-dominated periphery. Retail density is highly concentrated, with only 10 CDBs containing retail spaces, leaving 40 reliant on car travel for basic services. Residential density peaks at the center (40 households per acre in CDB 48) and declines toward the edges (as low as 3 in CDB 1), reinforcing the neighborhood’s inward-focused walkability gradient.
Each walkability attribute was analyzed spatially, as follows:
Land-Use Mix: Calculated as the area of non-residential use divided by each CDB’s total area (in acres). Sixteen CDBs exhibited some non-residential use, while the remaining thirty-four were entirely residential (zero value for land-use mix). The results ranged from a high of 0.2 in CDB 41 to a low of 0.0063 in CDB 1.
Street Connectivity: Determined by the number of street branches per node within/across each CDB, divided by the block area (acres). The greatest value was 8 (CDB 8), and the lowest was 1 (CDB 50) (Figure 6).
Retail Density: Measured as the number of retail uses per acre in each block, ranging from a high of 0.25 (CDB 47) to a low of 0.02 (CDB 1). Ten CDBs featured any retail; forty had none (Figure 7).
Residential Density: Calculated as the number of households per block area (acres), ranging from a high of 40 (CDB 48) to a low of 3 (CDB 1). For mapping, scores were collapsed into 10 levels (1–10) (Figure 8).
All these metrics reveal pronounced spatial disparities. Low walkability components cluster in peripheral inner areas, overlapping with the zones of the lowest sense of community, manifesting multidimensional marginalization.
Total Objective Walkability: The four metrics were summed per block for a composite index, mapped in Figure 9. The values ranged from 4.03 (minimum, CDB 1) to 48 (maximum, CDB 48).
The composite walkability score (Figure 9), calculated by summing the standardized subcomponent values, reveals a clear spatial pattern: the high-scoring blocks are clustered centrally, while the low-scoring blocks, typically marginalized areas, form a contiguous peripheral band. These outer zones not only demonstrate poor walkability but also lack essential infrastructure and green amenities, highlighting their multidimensional vulnerability. The findings show a striking spatial correlation, where walkability deficits coincide precisely with marginalized inner areas facing compounded social and environmental resilience challenges.

4.5. Spatial Modeling Hypothesis Relationships Using GIS Spatial Statistics

By merging the quantitative survey (sense of community) and objective walkability indices in the GIS, each CDB could be systematically analyzed. To facilitate comparison, both variables were scaled 1–5. Spatial regression and hotspot analyses were applied to assess the proposed connections between walkability, social cohesion, and vulnerable zones.

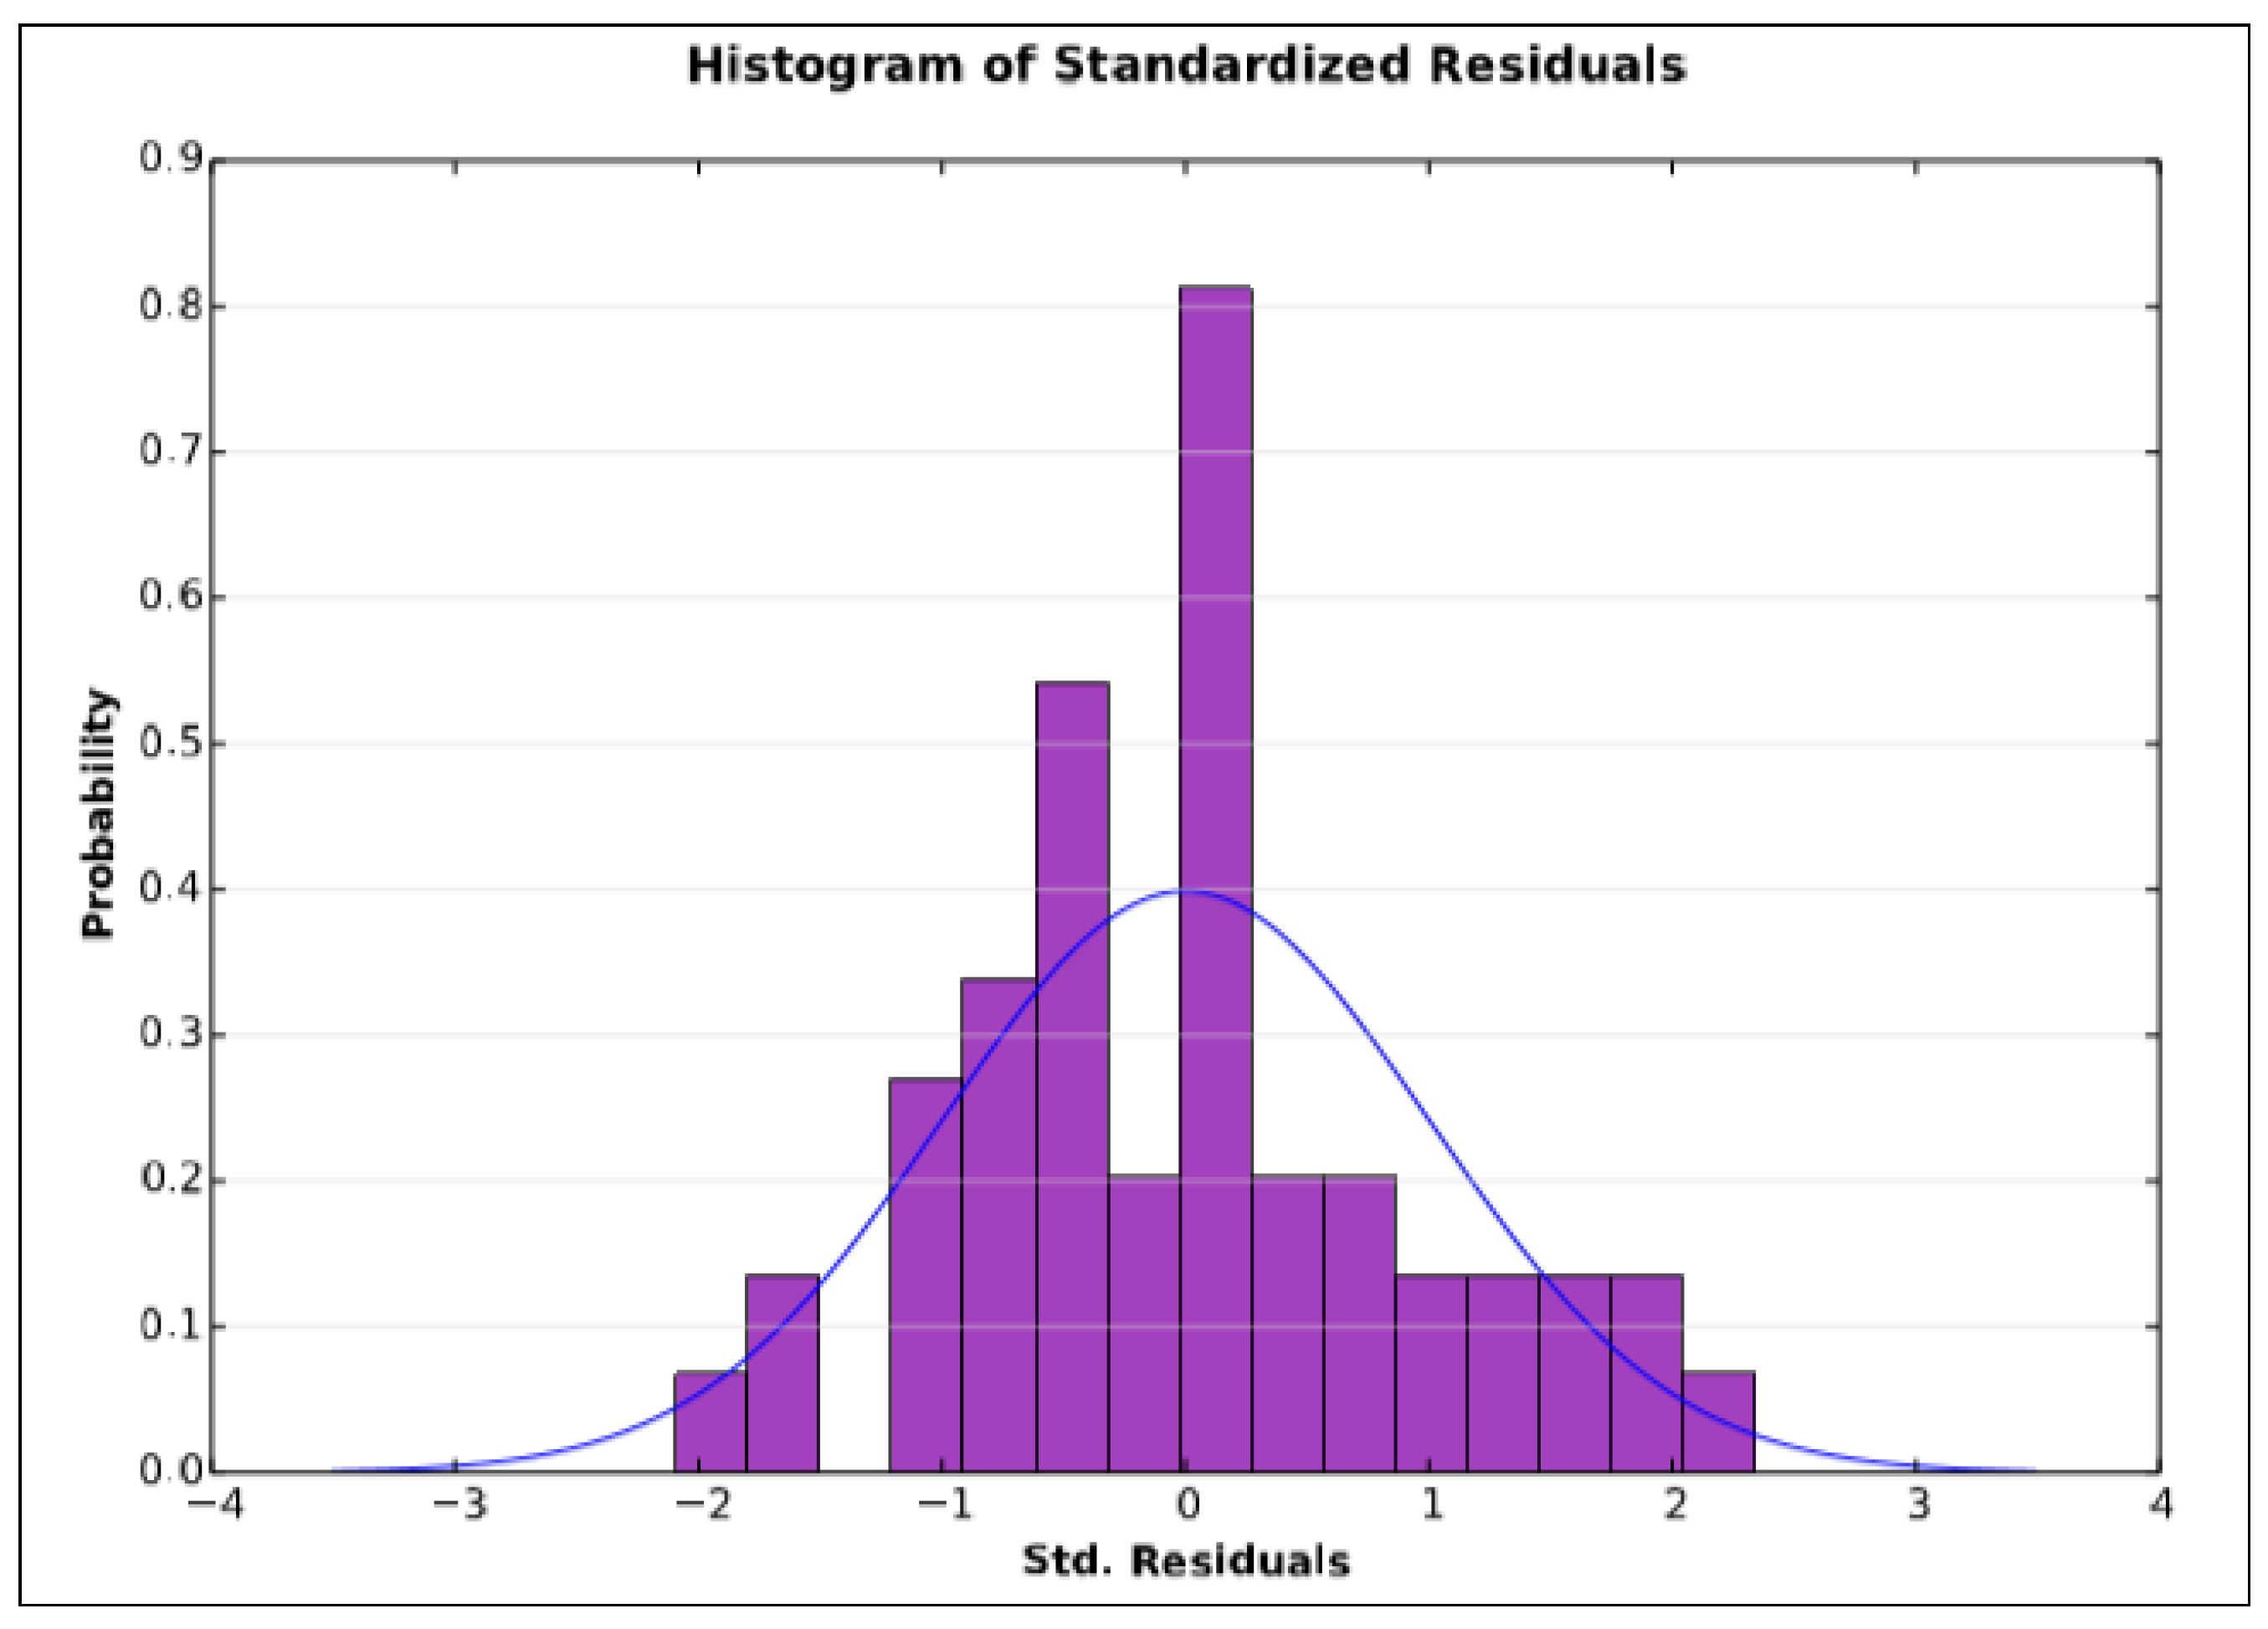
4.5.1. Spatial Regression Analysis for Sense of Community by Objective Walkability

Using GIS-based Ordinary Least Squares (OLS) regression to test whether objective walkability and its components influence sense of community, we found a statistically significant relationship at the block level (joint F-statistic, p = 0.001; Table 1, Figure 10). While the land-use mix, street connectivity, and retail density showed positive but non-significant associations, residential density emerged as the only walkability subcomponent with a significant direct effect—each unit increase predicted a 0.43-point rise in sense of community scores (t = 2.13, p = 0.02). These results confirm that walkability metrics, particularly residential density, help explain variations in community cohesion across neighborhoods.
The OLS regression results (Table 2) reveal distinct patterns among the walkability subcomponents. The land-use mix showed no significant effect on community cohesion (β = 0.001, t = 0.01, p = 0.99), as did street connectivity (β = 0.26, t = 1.10, p = 0.25) and retail density (β = 0.002, t = 0.01, p = 0.99). However, residential density demonstrated a significant positive relationship (β = 0.43, t = 2.13, p = 0.02), indicating that neighborhoods with higher household concentrations tend to foster stronger community bonds.
The regression analysis yielded several key insights (Table 2). Most notably, residential density demonstrated the strongest positive effect on community cohesion (β = 0.43, p = 0.02), underscoring its importance in fostering social connections. In contrast, both the land-use mix and retail density showed negligible impacts (p > 0.99)—a finding likely attributable to their limited presence in peripheral blocks, as visible in Figure 5 and Figure 7. While street connectivity did not reach statistical significance (p = 0.25), its positive coefficient suggests potential benefits could be realized through targeted improvements, such as adding pedestrian shortcuts to mitigate the isolating effects of cul-de-sac designs.
The histogram of standard residuals in Figure 11 confirms the model’s proper specification, displaying a normally distributed curve when all objective walkability subcomponents were included. The model appeared to be properly specified when all the subcomponents of objective walkability were added, as the histogram of standard residuals appeared to be a normally distributed curve. Objective residential density and the objective land-use mix were the only subcomponents of objective walkability that recorded a significant spatial impact on sense of community. Deir Ghbar residents had a high sense of community when they had a high objective residential density and a high objective land-use mix.
Key finding: Only residential density had a statistically significant (and positive) spatial effect on the sense of community, emphasizing the vulnerability of low-density peripheral zones.

4.5.2. Hotspot Analysis of Sense of Community by Objective Walkability—Spatial Test

The spatial hotspot analysis (Figure 12) reveals statistically significant clusters where walkability correlates with the sense of community. Hot spots (red blocks), predominantly in central, dense zones, show strong positive associations between high walkability and community cohesion. In contrast, cold spots (blue blocks) cluster along the periphery, where this relationship is weakest and socioeconomic marginalization is most acute, characterized by low walkability, diminished social cohesion, and heightened vulnerability during climate stresses due to inadequate green infrastructure and limited emergency access. These findings highlight how peripheral blocks with both environmental and social deficiencies represent at-risk areas requiring targeted intervention, while non-significant associations (yellow blocks) complete the spatial pattern.

4.6. Marginalized Inner Areas and Priority for Adaptation

The overlay of objective walkability data with socioeconomic profiles and the observed pattern of social fragmentation makes clear that Deir Ghbar’s inner areas, namely its peripheral, low-density blocks, are not only spatially marginalized but also represent priority zones for adaptation to climate change. These blocks lack walkable access to amenities, contain sparse green infrastructure, and show the lowest sense of neighborhood solidarity. Their compounded vulnerability highlights the urgent need for targeted ACC (Adaptation to Climate Change) interventions, such as streetscape greening, connectivity improvements, and neighborhood-scale GI retrofits.
The results demonstrate a clear spatial pattern where peripheral blocks with the lowest walkability coincide with socioeconomic and community marginalization, exacerbating climate vulnerability due to insufficient green infrastructure, poor accessibility, and weakened social networks. These findings strongly support prioritizing adaptive interventions, such as green infrastructure upgrades and pedestrian network improvements, in these marginalized inner areas, as they represent the most critical zones for targeted action. Such measures directly align with SDG 11’s sustainable urban development goals, and this special issue’s focus on climate resilience, addressing both immediate risks and systemic inequities through inclusive planning strategies.
The spatial clustering of cold spots in peripheral blocks aligns with broader patterns of infrastructural neglect observed in Global South cities, where urban expansion often outpaces service provision. These zones exhibit a ‘double vulnerability’: not only do they lack sidewalks and green cover, but their cul-de-sac-dominated layouts also impede emergency vehicle access during climate-related disasters (e.g., flash floods). Conversely, central hotspots mirror findings from Latin American barrios (e.g., Medellín’s escalator-equipped neighborhoods), where targeted pedestrian infrastructure investments reduced social exclusion. This suggests that Deir Ghbar’s periphery could benefit from similar adaptive retrofitting, such as converting dead-end streets into permeable greenways or installing shaded bus stops to bridge last-mile connectivity gaps. Such interventions would address both immediate walkability deficits and long-term climate resilience.

5. Discussion

The findings of this study underscore the critical relationship between walkability, green infrastructure, and social cohesion in Deir Ghbar, reinforcing insights found in the recent literature regarding the significance of urban form on community well-being. For instance, studies such as those by Frank et al. (2010) and Leslie et al. (2007) [11,13] highlight that walkable environments not only enhance mobility but are also pivotal in fostering social interaction and community ties. Our research aligns with these findings, revealing that as walkability increases, so does the sense of community, echoing assertions made by French et al. (2013) [3] about the importance of urban design in promoting social engagement.
However, a critical evaluation of our methodology reveals certain limitations inherent in the OLS regression approach. While OLS was suitable for establishing initial associations, it assumes linear relationships and may miss complex interactions between variables contributing to community cohesion. Alternative approaches, such as structural equation modeling or mixed-methods designs, could provide more depth by capturing nonlinear dynamics and contextual factors that influence the relationships observed [10,14]. This is particularly relevant in addressing community resilience in rapidly urbanizing regions, where socioeconomic variances can produce significantly varied outcomes. Furthermore, the limited scope of our spatial analysis, confined to census block data, may not fully encapsulate the nuanced characteristics of neighborhoods. Future research endeavors might benefit from incorporating qualitative methods, such as focus groups or interviews, to gain deeper insights into community perceptions and experiences related to walkability and public space use. This approach could be particularly valuable in diverse cultural contexts, as local customs and practices play a vital role in shaping social dynamics in urban environments [1].
For researchers interested in conducting similar studies in different contexts, we recommend deploying a mixed-methods approach that includes both quantitative and qualitative data collection methods. This could enhance the understanding of local conditions and variability, ultimately leading to more tailored urban planning interventions. Additionally, context-sensitive metrics that account for cultural and geographic differences should be emphasized when evaluating walkability and social cohesion in various settings.
In summary, our study provides significant contributions to the understanding of walkability and its impacts on social cohesion, yet it also opens avenues for deeper inquiry and more refined methodologies. Engaging with interdisciplinary approaches that consider both environmental and social factors will be essential for advancing research in urban studies globally.

5.1. Revisiting Spatial Inequities: Sense of Community and Urban Form

The spatial autocorrelation analysis (Moran’s I) confirmed significant clustering of low-walkability and low-cohesion zones in Deir Ghbar’s periphery (p < 0.05), validating the need for targeted interventions. These clusters—identified as statistically significant cold spots—align with areas lacking green infrastructure and pedestrian amenities. This spatial dependency underscores that inequities are not randomly distributed but stem from systemic planning biases, reinforcing the urgency of prioritizing these zones for climate-resilient retrofits (e.g., shaded sidewalks and mixed-use zoning) to disrupt cycles of marginalization.
The spatial analysis of Deir Ghbar confirms that the sense of community is not evenly distributed but maps closely onto both the physical form and road network topology. These patterns mirror broader trends in the urban sustainability literature. Staessen et al. (2024)’s [39] artistic socio-spatial analysis reveals how peri-urban residents perceive marginalization—a dimension our GIS-based study could augment with future participatory mapping to contextualize the ‘cold spots’ identified in Figure 12. This pattern is clearly visible in Figure 13, which overlays the sense of community scores onto a recent satellite image, showing the lowest values consistently occurring at the neighborhood periphery.
Notably, the land-use mix did not significantly predict the sense of community (β = 0.001, p = 0.99; Table 2), contrasting with the findings from Western urban contexts [13]. This aligns with Manaugh & El-Geneidy’s (2011) [14] observations in peri-urban areas, where cultural preferences for residential homogeneity may supersede mixed-use benefits. In Deir Ghbar, shared religious spaces (e.g., neighborhood mosques) and extended family clusters appear to sustain social ties despite land-use uniformity—a phenomenon warranting qualitative investigation through methods like ethnographic mapping.
The peripheral CDBs, situated along highways and major arterial roads, are distinguished by low-density housing, limited pedestrian infrastructure, and high exposure to vehicular traffic. This physical fragmentation is mirrored socially, with peripheral residents reporting diminished neighborhood solidarity and fewer social ties compared to those in more centrally located, higher-density areas.
A more granular view (Figure 14) reveals that Type C housing, typified by higher densities and better street connectivity, supports the strongest sense of community. Low-density Type A and B housing, on the other hand, is associated with weaker social cohesion, reinforcing the long-observed link between urban density and community fabric [3,6].
As noted, this study employs spatial regression analysis to identify significant correlations between walkability and social cohesion. However, it is essential to clarify that such associations do not imply direct causation. While enhanced walkability may indeed promote social cohesion, it is equally plausible that communities with inherently strong social ties exhibit greater levels of both cohesion and walking behaviors [3]. This suggests the presence of underlying factors that contribute to this connection, warranting further exploration of mediation mechanisms. Notably, factors such as the number and quality of communal spaces may provide critical opportunities for social interaction, thereby fostering a stronger sense of community and stimulating walking behaviors. Such considerations align with existing research that highlights the significance of social engagement in enhancing well-being and community connectivity [4]. Future studies should aim to comprehensively assess these mediating variables to elucidate the dynamics of how environmental features influence community cohesion and individual behaviors.
The application of spatial regression analysis based on Geographic Information Systems (GISs) in this research serves as a critical methodological approach for understanding the relationships between walkability, green infrastructure, and community cohesion. However, it is important to acknowledge the limitations inherent in this method, which can impact the interpretation and generalizability of the findings. First, spatial regression analysis assumes that the relationships among variables are linear, which may not accurately capture the complexity of human behavior in urban environments. For example, community cohesion may be influenced by nonlinear factors, such as cultural dynamics or historical contexts that are not fully addressed in a conventional linear regression framework. Future studies could benefit from exploring nonlinear models that might better encapsulate the variables at play.
Second, the effectiveness of spatial regression is contingent upon the quality and granularity of the input data. While our study utilized high-quality data sources from the Greater Amman Municipality and the Department of Statistics, variations in data accuracy and recency can still introduce potential bias into the results. It is crucial to recognize that the geographic and temporal resolution of the data can greatly influence the robustness of the analysis and the subsequent findings. Third, spatial autocorrelation, while tested prior to conducting the regression analysis, does not account for all forms of spatial dependency. For instance, the presence of omitted variable bias—where critical predictors may not be included in the model due to data limitations—can further distort the inherent relationships being examined. This element introduces uncertainty regarding whether observed correlations represent true relationships or merely artifacts of the model chosen.
Lastly, while this study provides valuable insights into the relationship between walkability and community cohesion, the context-specific findings may not be generalizable to other geographic areas without adjustment. The different cultural, socioeconomic, and environmental backgrounds of other urban areas could lead to varying outcomes when employing similar methodologies. In summary, while the spatial regression analysis offers essential quantitative insights into how built environments impact community dynamics, acknowledging these limitations is essential for contextualizing the findings and guiding future research endeavors. By elucidating these aspects, the current research can provide a stronger foundation for subsequent studies that seek to expand on the relationships within urban settings.

5.2. Walkability, Marginalization, and Climate Vulnerabilities

Objective walkability scores (Figure 15) confirm that spatial inequalities are accompanied by significant differences in built environment quality. The center of Deir Ghbar, where building density and road connectivity are greatest, achieves the highest levels of walkability. Conversely, the southern and peripheral blocks are characterized by fragmented networks, car-oriented design, poor retail access, and sparse green infrastructure.
These findings underscore a double marginalization of inner peripheral areas: not only do such blocks experience weaker social cohesion, but they are also deprived of spatial qualities, such as walkable access to amenities or resilient green infrastructure, critical for adaptation to climate impacts. Socioeconomic marginalization is thus tightly coupled with climate vulnerability. Low-walkability zones have fewer shaded sidewalks, reduced access to potential cooling from vegetation, and face higher risks if emergency access is required during heatwaves or storms. This pattern mirrors broader trends in the urban sustainability literature: vulnerable groups are often concentrated in car-centric, infrastructurally isolated inner areas, which are also least prepared for climate-related risks [1,5].
These findings resonate with the urban resilience paradox observed in rapidly growing cities: while denser cores benefit from economies of agglomeration, their peripheries suffer from systemic disinvestment. In Deir Ghbar, this paradox manifests as a feedback loop, where low walkability reduces social cohesion, which in turn diminishes collective advocacy for infrastructure improvements. The peripheral blocks’ lack of shaded pathways mirrors challenges documented in Saudi Arabia by Addas and Alserayhi (2020) [27], where car-centric expansions have ignored traditional cooling strategies. Retrofitting these areas with shaded walkways—inspired by Islamic urban design principles—could simultaneously enhance thermal comfort and social cohesion.
Breaking this cycle requires participatory GIS (PGIS) methods to empower marginalized residents in planning processes, as demonstrated by UN Habitat’s work in Nairobi’s informal settlements. By integrating community-reported walkability barriers (e.g., unsafe crossings) with spatial data, planners could prioritize interventions that simultaneously enhance mobility, equity, and climate adaptation, an approach directly aligned with SDG 11’s call for inclusive and sustainable urbanization.
Microclimate modeling allows for a nuanced analysis of localized conditions, such as temperature variations, humidity levels, and wind patterns, which can directly inform urban design strategies aimed at climate adaptation. Studies have shown that microclimate models can effectively simulate the cooling effects of green infrastructure, such as urban forests and green roofs, which are essential for mitigating urban heat island (UHI) effects [38]. By employing tools like ENVI-met or similar simulation software, future research could quantify how various urban configurations influence pedestrian comfort and health outcomes under extreme climate conditions, thereby informing targeted interventions that enhance walkability and resilience [32]. Moreover, integrating microclimate data with our existing GIS-based assessment could lead to a more comprehensive understanding of the interdependencies between built environments, social networks, and climatic factors, ultimately allowing urban planners to design neighborhoods that foster both community cohesion and environmental sustainability.
While this study underscores the role of green infrastructure interventions—such as continuous street tree canopies and permeable sidewalks—in enhancing pedestrian comfort and urban ecological functions, it is essential to further articulate the correlations between green infrastructure, walkability indicators, and community cohesion. Green infrastructure can significantly contribute to improving walkability through its ability to create more inviting and functional pedestrian environments. Continuous street tree canopies not only provide shade, which reduces thermal discomfort during warmer months, but they also enhance the aesthetic appeal of neighborhoods. Studies have shown that attractive streetscapes can encourage walking among residents, enhancing pedestrian flow and fostering a sense of community. Additionally, the presence of trees has been linked to increased property values and community pride, which can further encourage social interactions among neighbors.
Permeable sidewalks, another example of green infrastructure, help mitigate urban heat and manage stormwater effectively. By maintaining an effective drainage system, these sidewalks reduce standing water and flooding, contributing to a safer environment for pedestrians, especially after rainfall. The physical safety and comfort afforded by such infrastructure can lead to more walking and greater interaction among residents, thereby enhancing community cohesion as individuals feel more secure and connected to their surroundings. Moreover, the interplay between green infrastructure and community cohesion can be examined through the lens of social equity. Accessibility to green spaces and pedestrian-friendly infrastructure allows for greater community engagement across diverse socioeconomic groups. For instance, studies indicate that neighborhoods with higher access to green infrastructure see stronger social ties and more active participation in community events. This interaction is critical in peri-urban contexts like Deir Ghbar, where social networks can be otherwise strained due to fragmented development and infrastructure.
Future research should also consider utilizing empirical methods to quantitatively assess the correlation between the extent of green infrastructure and specific walkability indicators—such as residential density and street connectivity—while evaluating similar changes in community cohesion metrics. Such studies could yield valuable insights into the mechanisms through which green infrastructure impacts both pedestrian behavior and community relationships, thus strengthening urban planning efforts towards more resilient and cohesive neighborhoods.

5.3. Relevance to ACC and Green Infrastructure Integration and Limitations

The evidence from Deir Ghbar extends beyond local planning concerns, demonstrating the critical need for adaptation to climate change (ACC) policies that are spatially targeted to marginalized areas. Herath et al. (2024)’s [40] critical area detection method for green infrastructure (GI) placement offers a replicable model for prioritizing Deir Ghbar’s low-walkability clusters (Figure 12 and Figure 15), where heat vulnerability and sparse greenery intersect. Their data-driven siting approach, combining hydrological and thermal metrics, could optimize our proposed shaded sidewalk retrofits while addressing systemic inequities in amenity distribution. These findings align with global evidence that targeted green infrastructure (e.g., street trees) can lower ambient temperatures by 2–4 °C in arid climates [28,29], directly mitigating heat stress in marginalized zones. Locally, Hegazy and Qurnfulah’s (2020) [38] work in Jeddah confirms that such interventions, when paired with pedestrian infrastructure, yield dual social and environmental benefits. Integrating green infrastructure, such as street trees and drought-resistant vegetation, directly aligns with ACC frameworks by reducing urban heat and stormwater runoff while fostering social equity and healthier environments [5].
While our results demonstrate green infrastructure’s (GI) potential for thermal comfort (Section 4.5), real-world efficacy depends on two unmeasured factors: (1) long-term maintenance capacity and (2) community stewardship. For instance, drought-resistant species [28] may perish without localized watering systems managed by residents—a challenge observed in Amman’s recent rooftop garden initiatives [41]. Future GI implementations should adopt co-design frameworks that pair technical solutions (e.g., permeable pavements) with neighborhood watch programs to ensure sustainability. Notably, Deir Ghbar emerges as a model for Jordan and comparable urbanizing regions: the observed spatial mismatches between walkability, sense of community, and green infrastructure reinforce the necessity for policy solutions that combine spatial data analysis, climate adaptation, and social inclusion in peri-urban and inner area neighborhoods.
In conducting this study, one significant limitation has been the lack of localized data on temperature conditions and the characteristics of urban greenery in Deir Ghbar. Without direct measurements and assessments of local climatic variables, our findings may not fully capture the unique microclimate dynamics in the area. This limitation restricts the applicability of the results and recommendations presented herein, indicating a need for further empirical studies to validate and expand upon these findings.

6. Conclusions

This research demonstrates that walkability and a sense of community are spatially patterned in Deir Ghbar and that low-walkability, peripheral zones exhibit recursive forms of socioeconomic and environmental vulnerability. This study confirms that residential density (β = 0.43, p = 0.02; Table 2) and street connectivity (Figure 6) are critical to fostering social cohesion in Deir Ghbar, while green infrastructure (Section 5.3) emerged as a mediator for climate resilience. These findings directly support SDG 11 (Sustainable Communities) by demonstrating how targeted walkability interventions reduce spatial inequities (Figure 4 and Figure 9) and SDG 13 (Climate Action) through GI’s role in mitigating urban heat island effects (Figure 12). The GIS-driven methodology is scalable to Global South cities facing similar urban fragmentation, though contextual adaptations are essential for arid regions. The application of GIS-based metrics has enabled the identification of priority blocks for intervention, confirming that strategies to enhance walkability and green infrastructure are critical levers for both climate adaptation and social resilience.

6.1. Limitations

While this study provides valuable insights into the relationships between walkability, green infrastructure, and social cohesion in Deir Ghbar, several limitations warrant consideration. First, while our spatial metrics capture physical disparities, Staessen et al. (2024)’s [39] work highlights the need for mixed-methods approaches to fully articulate the lived experiences of Deir Ghbar’s peripheral zones. Their artistic expressions of peri-urban landscapes demonstrate how qualitative data could enrich our understanding of the marginalization patterns identified in cold spots (Figure 12). Second, the availability of comprehensive and up-to-date data on walkability metrics and community engagement presents a persistent challenge. The data were sourced from various public datasets and surveys, which may not fully capture the dynamic nature of the community or account for all relevant variables influencing social cohesion (e.g., local cultural practices and community initiatives).
Additionally, the scale of the analysis is limited to census blocks, which may obscure micro-level variations in walkability and social interaction that could be captured through finer-grained spatial analysis. Future research might benefit from a more localized approach, potentially employing neighborhood-level data or qualitative methodologies to complement the quantitative insights offered here. Moreover, the statistical methods employed, specifically Ordinary Least Squares (OLS) regression, while robust, are not without their limitations. OLS assumes a linear relationship between independent and dependent variables and may not adequately account for nonlinear dynamics that could exist in complex urban environments. Alternative methods, such as generalized additive models or hierarchical linear modeling, could provide a deeper understanding of the varying influences on community cohesion.
Finally, the applicability of the findings to other contexts should be approached with caution. The specific socioeconomic and cultural conditions of Deir Ghbar mean that while the results are valuable, they may not be universally generalized to other urban or peri-urban settings, especially in differing geographical regions. This underscores the importance of localized research in understanding urban phenomena. In summary, acknowledging these limitations not only strengthens the integrity of this study but also highlights areas for future research aimed at enhancing urban resilience and social cohesion.

6.2. Alignment with SDG, Broader Policy Implications, and Future Studies

Three policy priorities emerge: (1) high-density, mixed-income housing near green corridors (Section 5.3) maximizes dual social–climate benefits, as evidenced by hotspot analysis (Figure 12); (2) retrofitting peripheral blocks with shaded walkways inspired by traditional sikka networks [27] could bridge current equity gaps; and (3) longitudinal monitoring is needed to assess whether GI interventions sustain community cohesion beyond initial implementation—a limitation of our cross-sectional design. Municipalities should integrate these approaches with participatory GISs (PGISs) to ensure cultural appropriateness.
The results support and operationalize Sustainable Development Goals 11 (Sustainable Cities and Communities) and 13 (Climate Action) by providing an actionable framework for integrating environmental, social, and planning objectives at the neighborhood scale. Specifically, this study demonstrates that spatial planning can, and must, address marginalization by targeting the retrofitting of deficient blocks to enhance walkability, community cohesion, and climate resilience simultaneously. As demonstrated by Al-Hajri et al. (2025) [28], selecting drought-resistant native species can maximize microclimate benefits while minimizing water use—a critical consideration for Amman’s water-scarce context. Additionally, as Hegazy and Qurnfulah (2020) [38] demonstrated in Jeddah, street orientation adjustments combined with tree planting can lower physiological equivalent temperature (PET) by up to 8 °C. Applying such evidence-based design to Deir Ghbar’s arterial roads could mitigate heat stress for pedestrians.
The findings of this study contribute significantly to Sustainable Development Goal 13 (SDG 13: Climate Action) by demonstrating the pivotal role of walkability and green infrastructure in fostering urban resilience against climate change. Through the application of GIS-based spatial analysis, we quantified the impact of pedestrian-oriented planning strategies on reducing vehicle emissions, key factors in mitigating greenhouse gas outputs. This study revealed that increased residential density and improved street connectivity facilitate a shift toward active transportation modes, thus decreasing reliance on private vehicles and corresponding emissions [13]. Additionally, the integration of green infrastructure elements, such as tree canopies and permeable surfaces, plays a crucial role in alleviating urban heat island (UHI) effects and enhancing the thermal comfort of residents—an essential aspect of climate adaptation) [5]. The spatial assessment highlighted that neighborhoods with robust green infrastructure not only exhibited lower temperatures but also reported stronger community ties, promoting social cohesion as a means of collective adaptation to climate-related challenges. Therefore, our results underscore the necessity of urban planning that aligns with SDG 13 by advancing strategies that simultaneously address environmental sustainability and community resilience, ultimately contributing to a comprehensive approach to climate action.
Future research should explore the temporal dimensions of walkability and social cohesion, such as seasonal variations in pedestrian activity or longitudinal effects of GI interventions. For instance, pre- and post-implementation surveys following sidewalk greening projects could quantify changes in both thermal comfort and neighborly interactions. Additionally, integrating mobility data (e.g., GPS tracking of walking patterns) with sentiment analysis from social media could reveal real-time relationships between spatial design and community engagement. Such mixed-methods approaches would further validate the GIS-derived correlations identified here while providing dynamic tools for adaptive urban governance.
Future research should focus on a comprehensive investigation of the microclimate in Deir Ghbar through a systematic approach. This involves the installation of sensors strategically placed throughout the area to monitor key environmental variables, such as temperature, humidity, and solar radiation, across different seasons. Such data would provide invaluable insights into the local climatic conditions and how they fluctuate over time. Additionally, community surveys should be conducted to gather residents’ perceptions regarding heat stress and overall comfort levels. Understanding local experiences and concerns is vital for informing effective interventions. Furthermore, the use of Geographic Information System (GIS) mapping could visually represent existing green spaces and illustrate their relationship to pedestrian pathways. This visualization would help identify specific areas that have the potential for enhancement, ensuring that any future developments are strategically directed toward improving both the environment and walkability.
To support these research initiatives, the application of advanced modeling tools is also recommended. Tools such as ENVI-met and Simulated Urban Climate (SUC) models can be utilized to analyze the cooling effects associated with various urban greening scenarios. These models enable researchers to simulate potential temperature changes based on proposed greenery interventions, allowing for predictive visualizations of outcomes. By employing these tools, researchers can better understand the potential impacts of different strategies on the local microclimate, providing a solid foundation for planning effective improvements in Deir Ghbar aimed at enhancing pedestrian comfort and urban livability.

6.3. ACC/GI Policy Guidelines and Recommendations

To effectively translate these findings into actionable guidelines for Amman and similar urban settings, several key recommendations are proposed.
Firstly, data-driven GI siting. As demonstrated by Herath et al. (2024) [40], GIS-based hot spot analysis, combined with hydrological modeling, should guide permeable pavement and street tree placement in Deir Ghbar’s peripheral blocks (CDBs 1–10), simultaneously addressing walkability gaps and flood risk. Further, there is a pressing need to retrofit sidewalks with drought-resistant and native vegetation, which can significantly enhance green infrastructure, mitigate urban heat, and improve stormwater management. Moreover, the integration of street trees into sidewalk and road design is crucial for fostering climate resilience, a practice that is notably absent in Amman’s current policy framework. Furthermore, employing GIS-based zoning can be instrumental in mandating the incorporation of mixed-income housing close to both new and existing green corridors, thereby addressing social inequities and reducing climate risks in marginalized neighborhoods. It is also essential to prioritize investment in walkability, green spaces, and resilient infrastructure within socially and spatially marginalized inner areas, as exemplified by the periphery of Deir Ghbar. Finally, the continuous application of spatial modeling and mapping will play a vital role in assessing and adapting ACC and green infrastructure interventions, ensuring that the most vulnerable regions, often found at the urban fringe, receive targeted support.
To enhance walkability in Deir Ghbar, it is essential to implement a series of targeted interventions focused on urban greenery and infrastructure. Firstly, introducing shade trees along heavily trafficked pedestrian pathways will significantly reduce direct sun exposure, thereby improving comfort levels for walkers. Research, such as that by Jun et al. (2015) [30], highlights the substantial positive impact of tree shading on pedestrian experiences, reinforcing the necessity of this intervention. Additionally, the creation of pocket parks or green spaces in urban settings will provide accessible communal areas for residents, offering both recreational spaces and cooling effects that contribute to overall thermal comfort. Furthermore, integrating rainwater harvesting systems in these green areas can promote vegetation growth while simultaneously addressing the issue of water scarcity in the region. Such multifaceted strategies will not only improve the microclimate in Deir Ghbar but also foster a more pedestrian-friendly environment that encourages outdoor activities and community interaction. Finally, phased grey–green implementation: building on Sun et al. (2024)’s [42] evidence, we recommend prioritizing permeable surfaces and street trees in high-runoff blocks (CDBs 1–10), where their dual benefits for flood mitigation and walkability are maximized.

6.4. Scalability and Model Potential

The Deir Ghbar case offers broader lessons for both urban and rural marginal areas, particularly those in the Global South facing challenges of depopulation and service provision gaps. This GIS-driven, ACC-oriented methodology is scalable to comparable inner areas and is directly in line with emerging EU ACC policy priorities. Addressing spatial inequality and enhancing resilience demands integrated, data-driven, and community-focused approaches. Our findings echo Sádaba et al. (2024)’s [9] call for integrated street designs that serve marginalized communities, affirming the need for Deir Ghbar’s pathways to balance shading, accessibility, and communal spaces. This study provides a replicable framework for identifying, mapping, and prioritizing interventions that support both adaptive climate measures and inclusive urban development. By embedding green infrastructure, walkability, and social cohesion into spatial planning, cities like Amman can build more equitable, sustainable, and climate-resilient neighborhoods and advance local well-being, while fulfilling global sustainability commitments.

Author Contributions

Conceptualization, S.A.-Z. and M.A.-H.; methodology, S.A.-Z. and M.A.-H.; data curation, S.A.-Z.; Formal analysis, S.A.-Z.; Investigation, S.A.-Z.; writing—original draft preparation, M.A.-H. and M.A.-H.; writing—review and editing, M.A.-H. and S.A.-Z.; literature review, S.A.-Z. and M.A.-H.; visualization, S.A.-Z. All authors have read and agreed to the published version of the manuscript.

Funding

This research received no external funding.

Institutional Review Board Statement

This study was conducted in accordance with the Declaration of Helsinki and was approved by the Institutional Review Board of German Jordanian University. Decision No. GS-F-26/2020, dated 21 October 2020.

Informed Consent Statement

The studies involving humans were approved by the German Jordanian University Research Committee. The studies were conducted in accordance with the local legislation and institutional requirements. The participants provided their written informed consent to participate in this study. Informed consent was obtained from all the participants involved in this study.

Data Availability Statement

The original contributions presented in this study are included in this article. Further inquiries can be directed to the corresponding author.

Acknowledgments

The authors would like to acknowledge the support of Prince Sultan University for paying the Article Processing Charges (APCs) of this publication. The authors would like to thank Prince Sultan University for their support.

Conflicts of Interest

No potential conflicts of interest were reported by the authors.

References

  1. UN Habitat. Urban Planning and Infrastructure in Migration Contexts: AMMAN SPATIAL PROFILE Jordan. March 2022. Available online: https://unhabitat.org/sites/default/files/2022/04/220411-final_amman_profile.pdf (accessed on 15 May 2022).
  2. Department of Statistics (DOS). Jordan Statistical Yearbook 2015; Department of Statistics (DOS): Amman, Jordan, 2015.
  3. French, S.; Wood, L.; Foster, S.A.; Giles-Corti, B.; Frank, L.; Learnihan, V. Sense of community and its association with the neighborhood built environment. Environ. Behav. 2013, 46, 677–697. [Google Scholar] [CrossRef]
  4. Wilkerson, A.; Carlson, N.E.; Yen, I.H.; Michael, Y. Neighborhood physical features and relationships with neighbors: Does positive physical environment increase neighborliness? Environ. Behav. 2012, 44, 595–615. [Google Scholar] [CrossRef]
  5. IPCC. Climate Change 2021: The Physical Science Basis; Contribution of Working Group I to the Sixth Assessment Report of the Intergovernmental Panel on Climate Change; Cambridge University Press: Cambridge, UK, 2021; Available online: https://www.ipcc.ch/report/ar6/wg1/downloads/report/IPCC_AR6_WGI_FullReport.pdf (accessed on 15 May 2022).
  6. Farahani, L. The value of the sense of community and neighbouring. Hous. Theory Soc. 2016, 33, 357–376. [Google Scholar] [CrossRef]
  7. Chavis, D.M.; Wandersman, A. Sense of Community in the Urban Environment: A Catalyst for Participation and Community Development. Am. J. Community Psychol. 1990, 18, 55–81. [Google Scholar] [CrossRef]
  8. Department of Statistics (DOS). Jordan Statistical Yearbook 2017; Department of Statistics (DOS): Amman, Jordan, 2017.
  9. Sádaba, J.; Alonso, Y.; Latasa, I.; Luzarraga, A. Towards Resilient and Inclusive Cities: A Framework for Sustainable Street-Level Urban Design. Urban Sci. 2024, 8, 264. [Google Scholar] [CrossRef]
  10. Cervero, R.; Sarmiento, O.L.; Jacoby, E.; Gomez, L.F.; Neiman, A. Influences of Built Environments on Walking and Cycling: Lessons from Bogotá. Int. J. Sustain. Transp. 2009, 3, 203–226. [Google Scholar] [CrossRef]
  11. Leslie, E.; Coffee, N.; Frank, L.; Owen, N.; Bauman, A.; Hugo, G. Walkability of local communities: Using geographic information systems to objectively assess relevant environmental attributes. Health Place 2007, 13, 111–122. [Google Scholar] [CrossRef] [PubMed]
  12. Wood, L.; Frank, L.D.; Giles-Corti, B. Sense of community and its relationship with walking and neighborhood design. Soc. Sci. Med. 2010, 70, 1381–1390. [Google Scholar] [CrossRef] [PubMed]
  13. Frank, L.D.; Devlin, A.; Johnstone, S.; Loon, J.V. Neighbourhood Design, Travel, and Health in Metro Vancouver: Using a Walkability Index; Executive Summary; UBC Active Transportation Collaboratory: Vancouver, Canada, 2010; Available online: https://act-trans.ubc.ca/files/2011/06/WalkReport_ExecSum_Oct2010_HighRes.pdf (accessed on 15 May 2022).
  14. Manaugh, K.; El-Geneidy, A. Validating walkability indices: How do different households respond to the walkability of their neighborhood? Transp. Res. Part D Transp. Environ. 2011, 16, 309–315. [Google Scholar] [CrossRef]
  15. D’Haese, S.; Van Dyck, D.; Bourdeaudhuij, I.; Deforche, B.; Greet, C. The association between objective walkability, neighborhood socioeconomic status, and physical activity in Belgian children. Int. J. Behav. Nutr. Phys. Act. 2014, 11, 104. [Google Scholar] [CrossRef] [PubMed]
  16. Gehl, J. Cities for People; Island Press: Washington, DC, USA, 2020. [Google Scholar]
  17. Chadwick, A. Green Infrastructure: A Guide to the New Urban Landscape. In The New Urban Agenda; The Habitat III Secretariat: Quito, Ecuador, 2012. [Google Scholar]
  18. Ibrahim, S.; Younes, A.; Abdel-Razek, S.A. Impact of Neighborhood Urban Morphologies on Walkability Using Spatial Multi-Criteria Analysis. Urban Sci. 2024, 8, 70. [Google Scholar] [CrossRef]
  19. Geurs, K.T.; Van Wee, B. Accessibility Evaluation of land-use and transport strategies: Review and research Directions. J. Transp. Geography 2004, 12, 127–140. [Google Scholar] [CrossRef]
  20. Krizek, K.J. Operationalizing neighborhood accessibility for land use-Travel behavior research and regional modeling. J. Plan. Educ. Res. 2003, 22, 270–287. [Google Scholar] [CrossRef]
  21. Tsai, T.-I. Neighborhood accessibility as a measure for defining sustainable urban form and assessment tools. J. Habitat Eng. Des. 2014, 6, 119–135. [Google Scholar]
  22. Handy, S.; Clifton, K. Evaluating neighborhood accessibility: Possibilities and practicalities. J. Transp. Stat. 2001, 4, 67. [Google Scholar]
  23. Agampatian, R. Using GIS to Measure Walkability: A Case Study in New York City. Master’s Thesis, School of Architecture and the Built Environment, KTH, Stockholm, Sweden, 2014. [Google Scholar]
  24. Dygryn, J.; Mitáš, J.; Stelzer, J. The influence of built environment on walkability using geographic information system. J. Hum. Kinet. 2010, 24, 93–99. [Google Scholar] [CrossRef]
  25. Lo, R.H. Walkability: What is it? J. Urban. Int. Res. Placemaking Urban Sustain. 2009, 2, 145–166. [Google Scholar] [CrossRef]
  26. Mayne, D.J.; Morgan, G.G.; Willmore, A.; Rose, N.; Jalaludin, B.; Bambrickand, H.; Bauman, A. An objective index of walkability for research and planning in the Sydney Metropolitan Region of New South Wales, Australia: An ecological study. Int. J. Health Geogr. 2013, 12, 61. [Google Scholar] [CrossRef] [PubMed]
  27. Addas, A.; Alserayhi, G. Approaches to Improve Streetscape Design in Saudi Arabia. Curr. Urban Stud. 2020, 8, 253–264. [Google Scholar] [CrossRef]
  28. Al-Hajri, S.; Al-Ramadan, B.; Shafiullah, M.; Rahman, S.M. Microclimate Performance Analysis of Urban Vegetation: Evidence from Hot Humid Middle Eastern Cities. Plants 2025, 14, 521. [Google Scholar] [CrossRef] [PubMed]
  29. Lau, K.K.-L.; Chung, S.C.; Ren, C. Urban heat vulnerability: A dynamic assessment using multi-source data in Hong Kong. Landsc. Urban Plan. 2023, 238, 104833. [Google Scholar] [CrossRef]
  30. Jun, H.; Hur, M. The relationship between walkability and neighborhood social environment: The importance of physical and perceived walkability. Appl. Geogr. 2015, 62, 115–124. [Google Scholar] [CrossRef]
  31. Aflaki, A.; Mirnezhad, M.; Ghaffarianhoseini, A.; Ghaffarianhoseini, A.; Omrany, O.; Wang, Z.H.; Kbari, H. Urban heat island mitigation strategies: A state-of-the-art review on Kuala Lumpur, Singapore and Hong Kong. Cities 2017, 62, 131–145. [Google Scholar] [CrossRef]
  32. Brownson, R.C.; Hoehner, C.M.; Day, K.; Forsyth, A.; Sallis, J.F. Measuring the built environment for physical activity: State of the science. Am. J. Prev. Med. 2009, 36, S99–S123. [Google Scholar] [CrossRef] [PubMed] [PubMed Central]
  33. Farahani, L.; Lozanovska, M. A framework for exploring the sense of community and social life in residential environments. Int. J. Archit. Res. 2014, 8, 223–237. [Google Scholar] [CrossRef]
  34. Pretty, G.; Bishop, B.; Fisher, A.; Sonn, C. Psychological Sense of Community and its Relevance to Well-Being and Everyday Life in Australia; The Australian Community Psychologist; The Australian Psychological Society Ltd. Melbourne: Melbourne, VIC, Australia, 2006. [Google Scholar]
  35. McMillan, D.W.; Chavis, D.M. Sense of community: A definition and theory. J. Community Psychol. 1986, 14, 6–23. [Google Scholar] [CrossRef]
  36. Krejcie, R.V.; Morgan, D.W. Determining Sample Size for Research Activities. Educ. Psychol. Meas. 1970, 30, 607–610. [Google Scholar] [CrossRef]
  37. Landis, B.W.; Vattikuti, V.R.; Ottenberg, R.M.; McLeod, D.S.; Guttenplan, M. Modeling the Roadside Walking Environment: Pedestrian Level of Service. Transp. Res. Rec. 2001, 1773, 82–88. [Google Scholar] [CrossRef]
  38. Hegazy, I.R.; Qurnfulah, E.M. Thermal comfort of urban spaces using simulation tools exploring street orientation influence of on the outdoor thermal comfort: A case study of Jeddah, Saudi Arabia. Int. J. Low-Carbon Technol. 2020, 15, 594–606. [Google Scholar] [CrossRef]
  39. Staessen, A.; Salvador, A.J.; Lyngstad, I. An Exploration of Artistic Expressions of Everyday Peri-Urban Landscapes as a Method of Socio-Spatial Analysis in Spatial Planning. Architecture 2024, 4, 124–147. [Google Scholar] [CrossRef]
  40. Herath, H.M.M.S.D.; Fujino, T.; Senavirathna, M.D.H.J. Urban Planning with Rational Green Infrastructure Placement Using a Critical Area Detection Method. Geomatics 2024, 4, 253–270. [Google Scholar] [CrossRef]
  41. Department of Statistics (DOS). Jordan Statistical Yearbook 2019; Department of Statistics (DOS): Amman, Jordan, 2019.
  42. Sun, C.; Rao, Q.; Wang, M.; Liu, Y.; Xiong, Z.; Zhao, J.; Fan, C.; Rana, M.A.I.; Li, J.; Zhang, M. Multi-Stage Optimization of Drainage Systems for Integrated Grey–Green Infrastructure under Backward Planning. Water 2024, 16, 1825. [Google Scholar] [CrossRef]
Figure 1. (a) Deir Ghbar residential setting in relation to Amman city. (b) Official division of Deir Ghbar census blocks (from 1–50). Source: researchers.
Sustainability 17 06637 g001
Figure 2. Deir Ghbar buildings and census blocks. Source: researchers.
Sustainability 17 06637 g002
Figure 3. Spatial distribution of housing typologies in Deir Ghbar. Source: researchers.
Sustainability 17 06637 g003
Figure 4. The spatial distribution of the sense of community. The numeric labels in the figure represent the average sense of community scores (ranging from 1 to 5) across each census data block (CDB). The higher scores indicate stronger community ties and a greater sense of belonging among the residents. Source: researchers.
Sustainability 17 06637 g004
Figure 5. The spatial distribution of the land-use mix. The numeric labels indicate the ratio of the non-residential land area to the total land area for each census data block (CDB), expressed on a scale from 0 (entirely residential) to 1 (fully mixed-use). The higher values reflect a more diverse land use that supports walkability and community interaction. Source: researchers.
Sustainability 17 06637 g005
Figure 6. The spatial distribution of connectivity. The numeric labels represent the total number of street intersections per unit area (in acres) for each census data block (CDB). The higher numbers indicate better connectivity and accessibility, fostering pedestrian movement and social interactions. Source: researchers.
Sustainability 17 06637 g006
Figure 7. The spatial distribution of retail density. The numeric labels signify the number of retail establishments per acre within each census data block (CDB). The higher values suggest greater availability of local services, potentially enhancing community cohesion and reducing reliance on automobiles. Source: researchers.
Sustainability 17 06637 g007
Figure 8. The spatial distribution of the residential density values. The numeric labels indicate the number of households per acre within each census data block (CDB). The areas with higher densities may provide increased opportunities for social interactions among residents and contribute to a stronger sense of community. Source: researchers.
Sustainability 17 06637 g008
Figure 9. The spatial distribution of the total objective walkability. The numeric labels represent the total standardized scores calculated from the walkability components (land-use mix, street connectivity, retail density, and residential density) for each census data block (CDB). The higher scores reflect more walkable neighborhoods, which are associated with better access to amenities and enhanced social cohesion. Source: researchers.
Sustainability 17 06637 g009
Figure 10. Variable distributions and relationships—the objective walkability components. (Note: the dots represent neighborhood values; the trend line shows the linear regression fit (R2 = X). Source: researchers.
Sustainability 17 06637 g010
Figure 11. Histogram of the standard residuals––the objective walkability components. The blue line represents the expected normal distribution curve for reference. Source: researchers.
Sustainability 17 06637 g011
Figure 12. Hotspot analysis—objective walkability by sense of community. Source: researchers.
Sustainability 17 06637 g012
Figure 13. Satellite image overlaid with the spatial distribution of the sense of community in Deir Ghbar. The colors represent levels of community cohesion: red (5) indicates a high sense of community, yellow (3) indicates a moderate sense, and blue (1) represents a low sense of community. This color scale aids in visualizing the varying degrees of social ties across the different areas of the neighborhood. Source: researchers.
Sustainability 17 06637 g013
Figure 14. Residential and road classifications in Deir Ghbar. Source: researchers. The circles highlight housing C that represents the highest density household.
Sustainability 17 06637 g014
Figure 15. Satellite image overlaid with the spatial distribution of objective walkability in Deir Ghbar. The colors represent the levels of walkability: yellow (3) indicates high walkability, green (2) indicates moderate walkability, and blue (1) represents low walkability. This color scale aids in visualizing the gradient of walkability across the area, providing a helpful guide for interpretation. Source: researchers.
Sustainability 17 06637 g015
Table 1. Results for overall model significance.
Model Significance
Joint F-statistic [e]: 50.09Prob(>F), (4, 45) degrees of freedom: 0.001
Table 2. OLS GIS regression results for each explanatory variable.
VariableMean Std. DeviationCoefficient (a)Probability (p-Value)t-StatisticStd. Error
Sense of community 2.341.38
Objective walkability components
Objective land-use mix0.40.940.0010.990.010.23
Objective street connectivity 0.561.130.260.251.100.23
Objective retail density0.30.810.0020.990.010.29
Objective residential density 0.11.30.430.022.130.20
Disclaimer/Publisher’s Note: The statements, opinions and data contained in all publications are solely those of the individual author(s) and contributor(s) and not of MDPI and/or the editor(s). MDPI and/or the editor(s) disclaim responsibility for any injury to people or property resulting from any ideas, methods, instructions or products referred to in the content.

