
A Consumer Perspective on the Valorization of Forest Fruit By-Products in a Dairy Product: Opportunity or Challenge?


Abstract
1. Introduction
2. Materials and Methods
- Consumer opinion on the consumption of mountain dairy products and environmental awareness.
- Consumer perception of the launching on the market of a new cream cheese variety enriched with berry by-products.
- A section dedicated to food neophobia.
Statistics
3. Results and Discussions
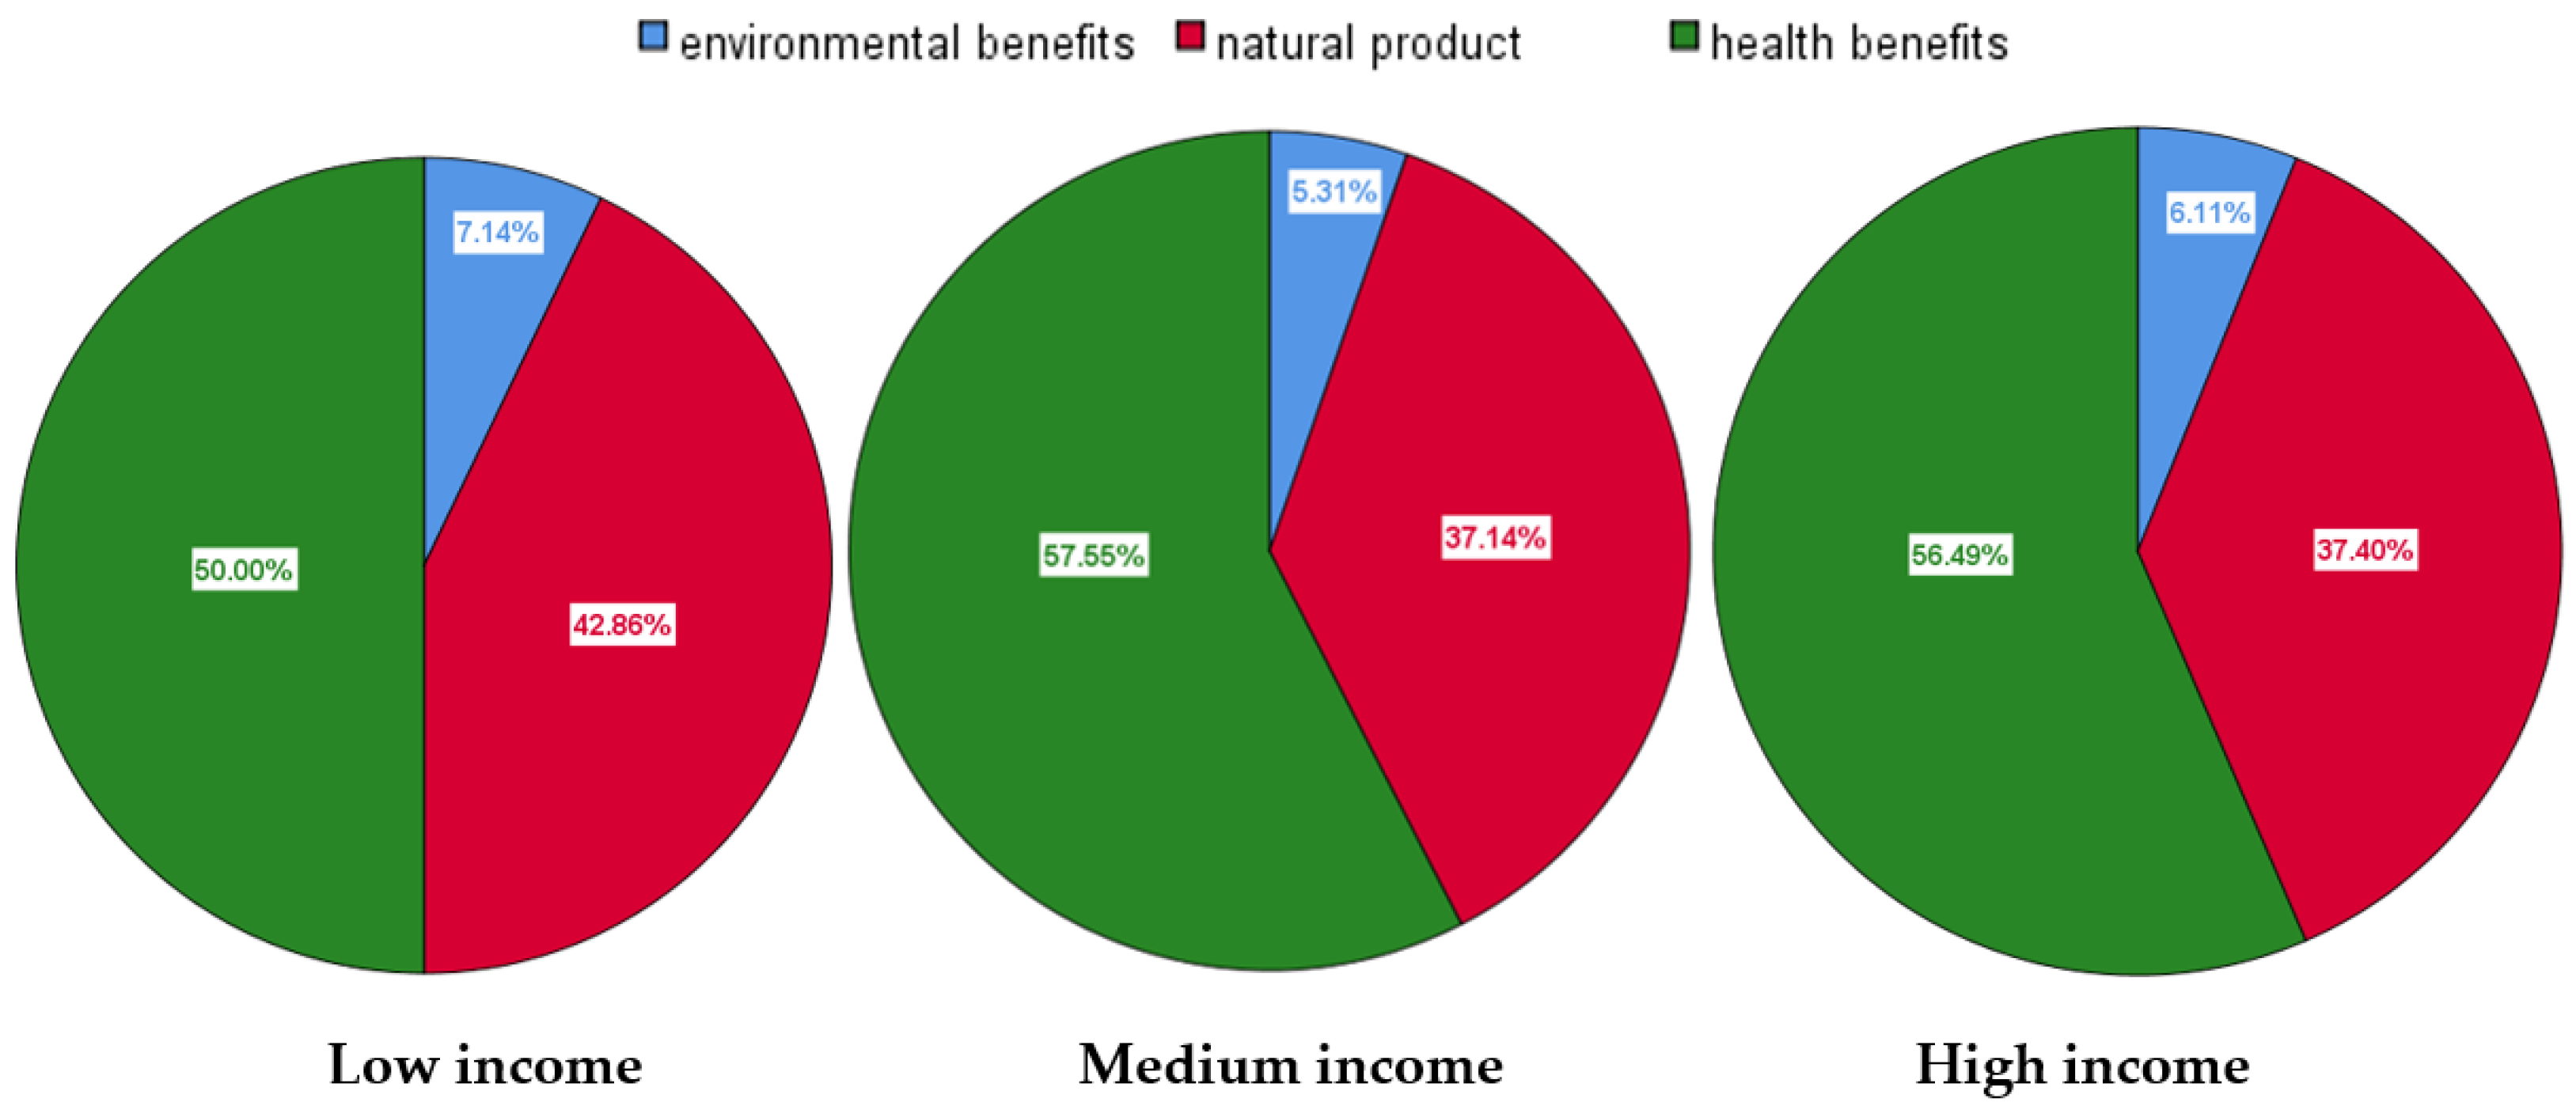
3.1. Mountain Dairy Product Consumption, Health and Environmental Awareness
3.2. Acceptability of Cream Cheese with Berry By-Products
3.3. Food Neophobia
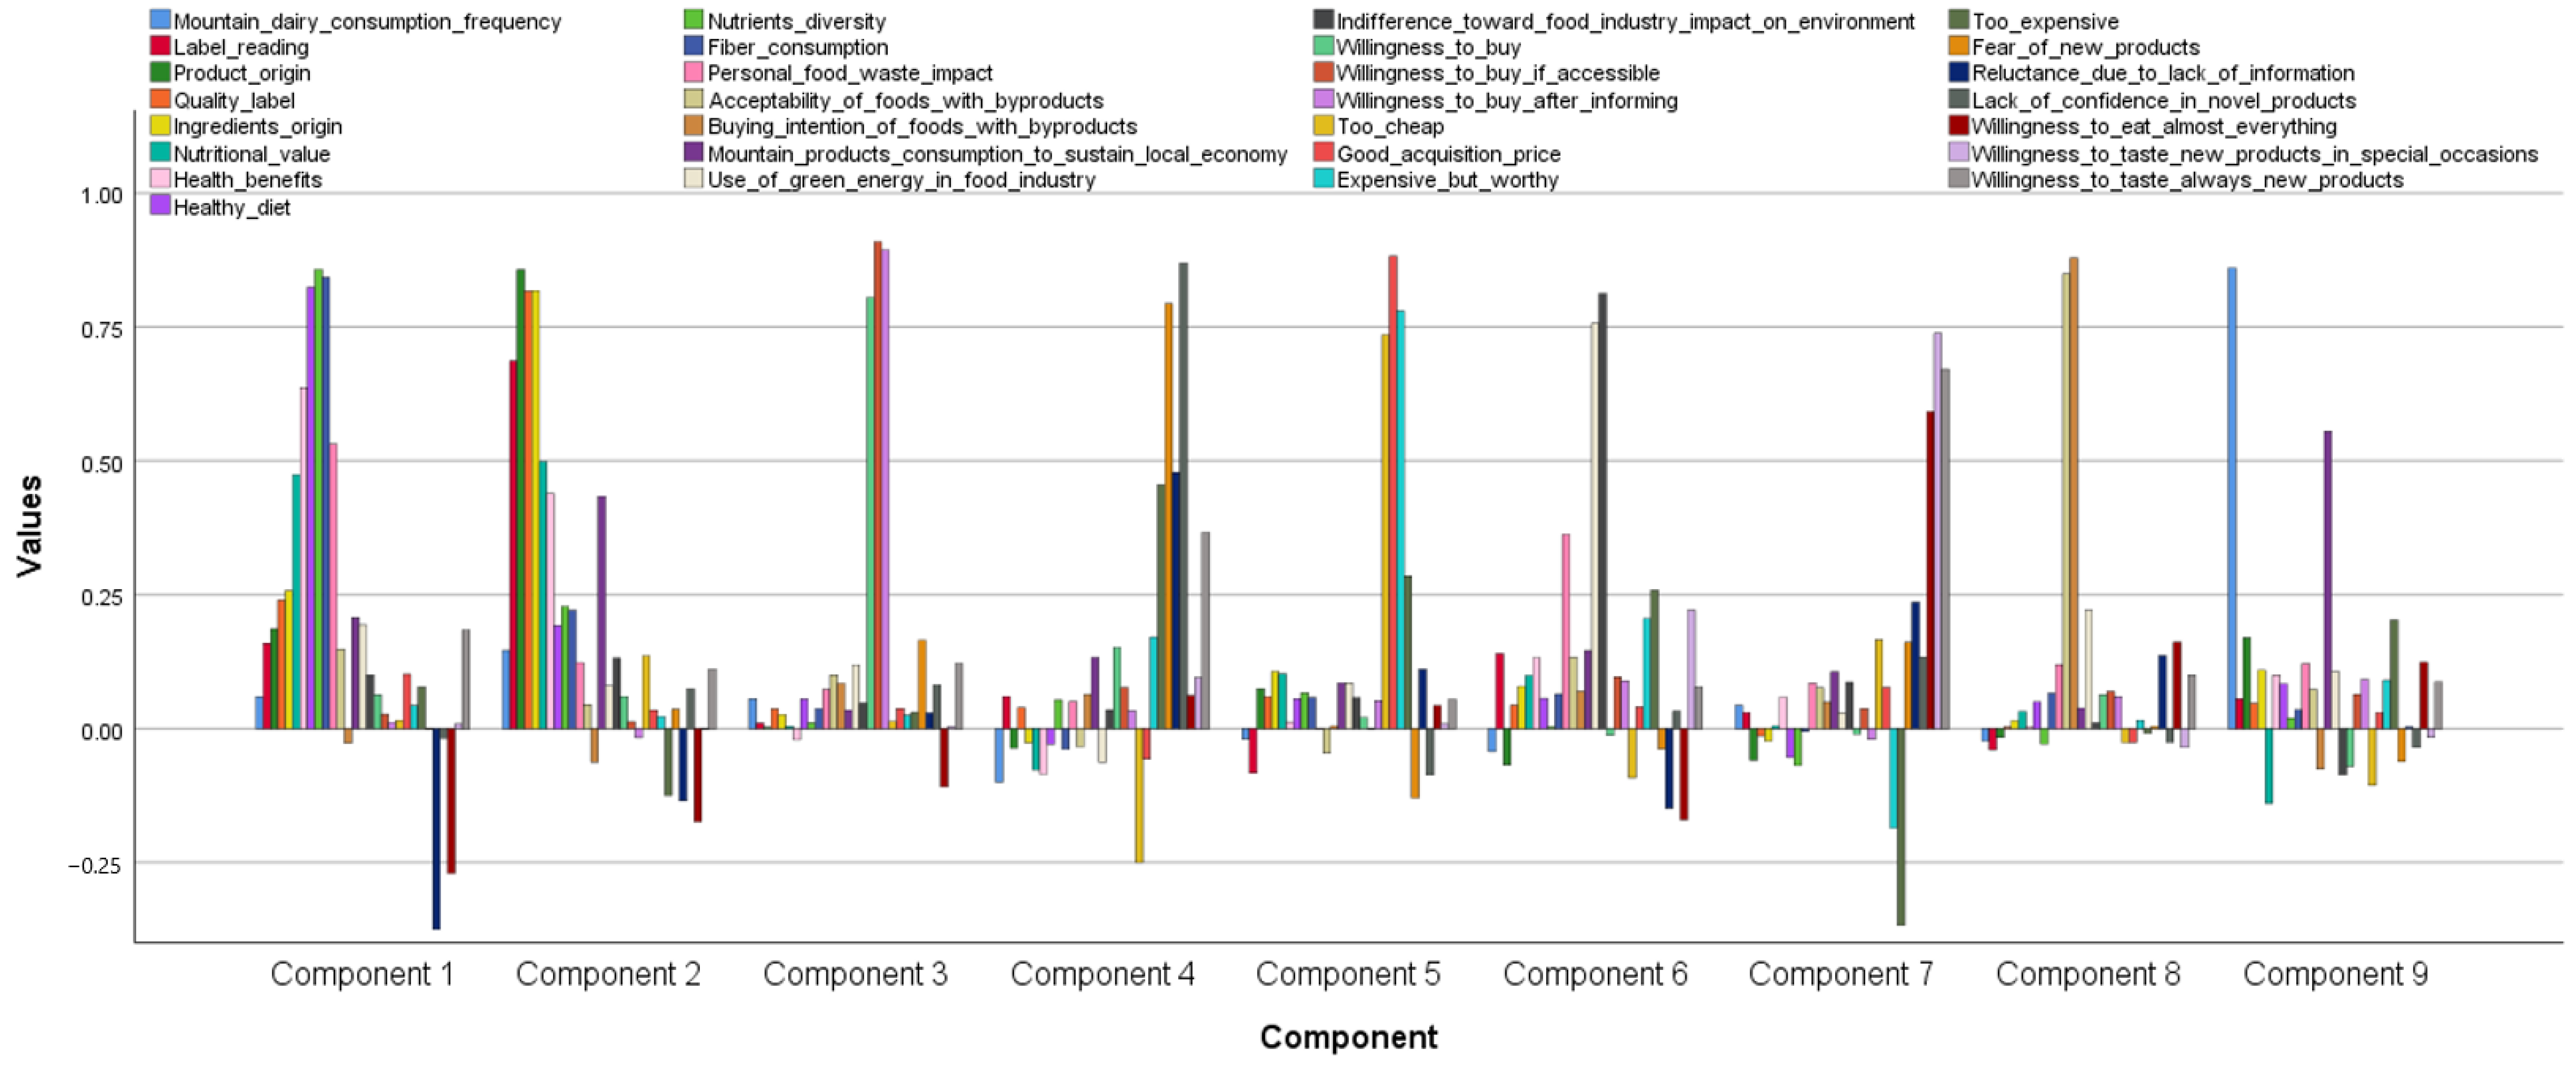
3.4. Principal Component Analysis
4. Conclusions
Supplementary Materials
Author Contributions
Funding
Institutional Review Board Statement
Informed Consent Statement
Data Availability Statement
Conflicts of Interest
References
- Florean, S.; Crețan, R.; Doiciar, C. Beyond mass food production and consumption: The emergence of alternative food networks in Romania. Cogent Soc. Sci. 2024, 10, 2437053. [Google Scholar] [CrossRef]
- Aschemann-Witzel, J.; Stangherlin, I.D.C. Upcycled by-product use in agri-food systems from a consumer perspective: A review of what we know, and what is missing. Technol. Forecast. Soc. Change 2021, 168, 120749. [Google Scholar] [CrossRef]
- Aschemann-Witzel, J.; Peschel, A.O. How circular will you eat? The sustainability challenge in food and consumer reaction to either waste-to-value or yet underused novel ingredients in food. Food Qual. Prefer. 2019, 77, 15–20. [Google Scholar] [CrossRef]
- Nitzko, S. Consumer acceptance of the use of plant and animal by-products of food manufacturing for human nutrition. Food Humanit. 2023, 1, 1238–1249. [Google Scholar] [CrossRef]
- Bhatt, S.; Lee, J.; Deutsch, J.; Ayaz, H.; Fulton, B.; Suri, R. From food waste to value-added surplus products (VASP): Consumer acceptance of a novel food product category. J. Consum. Behav. 2018, 17, 57–63. [Google Scholar] [CrossRef]
- Reißner, A.M.; Struck, S.; Alba, K.; Proserpio, C.; Foschino, R.; Turner, C.; Hernando, I.; Zahn, S.; Rohm, H. Cross-national differences in consumer responses to savoury crackers containing blackcurrant pomace. Int. J. Food Sci. Technol. 2021, 56, 5007–5016. [Google Scholar] [CrossRef]
- Huang, W.-S.; Tsai, T.-Y.; Lai, K.-L.; Chen, H.-S. Analyzing Consumer Motivations and Behaviors Towards Upcycled Food from an Environmental Sustainability Perspective. Agriculture 2024, 14, 1967. [Google Scholar] [CrossRef]
- Garcia-Valencia, M.; Svartebekk, K.M.; Altintzoglou, T.; Gaarder, M.Ø. A Perspective of Upcycled Food by Norwegian Consumers: The Meaning Without the Word. J. Int. Food Agribus. Mark. 2025, 1–24. [Google Scholar] [CrossRef]
- Scheibenzuber, S.; Pucci, E.; Presenti, O.; Serafini, G.; Nobili, C.; Zoani, C.; Duta, D.E.; Mihai, A.L.; Criveanu-Stamatie, G.D.; Belc, N.; et al. Consumers acceptance of new food ingredients from the food industry’s by-products—A focus group study. Front. Nutr. 2025, 12, 1509833. [Google Scholar] [CrossRef]
- Coderoni, S.; Perito, M.A. Sustainable consumption in the circular economy. An analysis of consumers’ purchase intentions for waste-to-value food. J. Clean. Prod. 2020, 252, 119870. [Google Scholar] [CrossRef]
- Shan, Y.; Wang, H.; Wang, W. Food Neophobia: Psychological Dimensions of Consumer Perception and Emotional Sentiment in Social Media Discourse. Front. Nutr. 2025, 12, 1584409. [Google Scholar] [CrossRef]
- Białek-Dratwa, A.; Staśkiewicz-Bartecka, W.; Kiciak, A.; Wardyniec, A.; Grajek, M.; Aktaç, Ş.; Çelik, Z.M.; Sabuncular, G.; İslamoğlu, A.H.; Kowalski, O. Food Neophobia and avoidant/restrictive food intake among adults and related factors. Nutrients 2024, 16, 2952. [Google Scholar] [CrossRef]
- Amoneit, M.; Gellrich, L.; Weckowska, D.M. Consumer Acceptance of Alternative Proteins: Exploring Determinants of the Consumer Willingness to Buy in Germany. Foods 2025, 14, 2427. [Google Scholar] [CrossRef]
- Perito, M.A.; Coderoni, S.; Russo, C. Consumer attitudes towards local and organic food with upcycled ingredients: An Italian case study for olive leaves. Foods 2020, 9, 1325. [Google Scholar] [CrossRef] [PubMed]
- Stelick, A.; Sogari, G.; Rodolfi, M.; Dando, R.; Paciulli, M. Impact of sustainability and nutritional messaging on Italian consumers’ purchase intent of cereal bars made with brewery spent grains. J. Food Sci. 2021, 86, 531–539. [Google Scholar] [CrossRef] [PubMed]
- Mihai, A.L.; Mulțescu, M.; Negoiță, M.; Horneț, G.A.; Surdu, I.; Nicula, A.-S. Nutritional Characterization of Some Romanian Mountain Products. Ann. Univ. Dunarea De Jos Galati Fascicle VI Food Technol. 2022, 46, 104–124. [Google Scholar] [CrossRef]
- Cifuni, G.F.; Claps, S.; Signorelli, F.; Di Francia, A.; Di Napoli, M.A. Fatty acid and terpenoid profile: A signature of mountain milk. Int. Dairy J. 2022, 127, 105301. [Google Scholar] [CrossRef]
- Bryla, P. Who Reads Food Labels? Selected Predictors of Consumer Interest in Front-of-Package and Back-of-Package Labels during and after the Purchase. Nutrients 2020, 12, 2605. [Google Scholar] [CrossRef]
- Jackey, B.A.; Cotugna, N.; Orsega-Smith, E. Food Label Knowledge, Usage and Attitudes of Older Adults. J. Nutr. Gerontol. Geriatr. 2017, 36, 31–47. [Google Scholar] [CrossRef]
- Seyfang, G. Growing sustainable consumption communities: The case of local organic food networks. Int. J. Sociol. Soc. Policy 2007, 27, 120–134. [Google Scholar] [CrossRef]
- Matzembacher, D.E.; Meira, F.B. Sustainability as business strategy in community supported agriculture: Social, environmental and economic benefits for producers and consumers. Br. Food J. 2019, 121, 616–632. [Google Scholar] [CrossRef]
- Topcu, Y.; Dağdemir, V. Turkish Consumer Purchasing Decisions Regarding PGI-labelled Erzurum Civil Cheese. Alınteri Zirai Bilim. Derg. 2017, 32, 69–80. [Google Scholar] [CrossRef]
- Huang, K.S.; Gale, F. Food demand in China: Income, quality, and nutrient effects. China Agric. Econ. Rev. 2009, 1, 395–409. [Google Scholar] [CrossRef]
- Verbeke, W.; Ward, R.W. Consumer interest in information cues denoting quality, traceability and origin: An application of ordered probit models to beef labels. Food Qual. Prefer. 2006, 17, 453–467. [Google Scholar] [CrossRef]
- Schnettler, B.; Ruiz, D.; Sepúlveda, O.; Sepúlveda, N. Importance of the country of origin in food consumption in a developing country. Food Qual. Prefer. 2008, 19, 372–382. [Google Scholar] [CrossRef]
- Firoozzare, A.; Boccia, F.; Yousefian, N.; Ghazanfari, S.; Pakook, S. Understanding the role of awareness and trust in consumer purchase decisions for healthy food and products. Food Qual. Prefer. 2024, 121, 105275. [Google Scholar] [CrossRef]
- Ali, T.; Ali, J. Factors affecting the consumers’ willingness to pay for health and wellness food products. J. Agric. Food Res. 2020, 2, 100076. [Google Scholar] [CrossRef]
- Curvelo, I.C.G.; Watanabe, E.A.D.M.; Alfinito, S. Purchase intention of organic food under the influence of attributes, consumer trust and perceived value. Rev. Gest. 2019, 26, 198–211. [Google Scholar] [CrossRef]
- Apaolaza, V.; Hartmann, P.; D’Souza, C.; López, C.M. Eat organic—Feel good? The relationship between organic food consumption, health concern and subjective wellbeing. Food Qual. Prefer. 2018, 63, 51–62. [Google Scholar] [CrossRef]
- Ditlevsen, K.; Sandøe, P.; Lassen, J. Healthy food is nutritious, but organic food is healthy because it is pure: The negotiation of healthy food choices by Danish consumers of organic food. Food Qual. Prefer. 2019, 71, 46–53. [Google Scholar] [CrossRef]
- Rezai, G. Consumers’ awareness and consumption intention towards green foods. Afr. J. Bus. Manag. 2012, 6, 4496–4503. [Google Scholar] [CrossRef]
- Annett, L.E.; Muralidharan, V.; Boxall, P.C.; Cash, S.B.; Wismer, W.V. Influence of health and environmental information on hedonic evaluation of organic and conventional bread. J. Food Sci. 2008, 73, H50–H57. [Google Scholar] [CrossRef] [PubMed]
- Lusk, J.L.; Briggeman, B.C. Food values. Am. J. Agric. Econ. 2009, 91, 184–196. [Google Scholar] [CrossRef]
- Asioli, D.; Grasso, S. Do consumers value food products containing upcycled ingredients? The effect of nutritional and environmental information. Food Qual. Prefer. 2021, 91, 104194. [Google Scholar] [CrossRef]
- Lu, P.; Parrella, J.A.; Xu, Z.; Kogut, A. A scoping review of the literature examining consumer acceptance of upcycled foods. Food Qual. Prefer. 2024, 114, 105098. [Google Scholar] [CrossRef]
- Zhang, J.; Ye, H.; Bhatt, S.; Jeong, H.; Deutsch, J.; Ayaz, H.; Suri, R. Addressing food waste: How to position upcycled foods to different generations. J. Consum. Behav. 2021, 20, 242–250. [Google Scholar] [CrossRef]
- Ali, A.; Rahut, D.B. Healthy foods as proxy for functional foods: Consumers’ awareness, perception, and demand for natural functional foods in Pakistan. Int. J. Food Sci. 2019, 2019, 6390650. [Google Scholar] [CrossRef]
- Briz, T.; Ward, R.W. Consumer awareness of organic products in Spain: An application of multinominal logit models. Food Policy 2009, 34, 295–304. [Google Scholar] [CrossRef]
- Wier, M.; O’Doherty Jensen, K.; Andersen, L.M.; Millock, K. The character of demand in mature organic food markets: Great Britain and Denmark compared. Food Policy 2008, 33, 406–421. [Google Scholar] [CrossRef]
- Janssen, M. Determinants of organic food purchases: Evidence from household panel data. Food Qual. Prefer. 2018, 68, 19–28. [Google Scholar] [CrossRef]
- Augustin, M.A.; Sanguansri, L.; Fox, E.M.; Cobiac, L.; Cole, M.B. Recovery of wasted fruit and vegetables for improving sustainable diets. Trends in Food Sci. Technol. 2020, 95, 75–85. [Google Scholar] [CrossRef]
- Grasso, S.; Pintado, T.; Pérez-Jiménez, J.; Ruiz-Capillas, C.; Herrero, A.M. Characterisation of muffins with upcycled sunflower flour. Foods 2021, 10, 426. [Google Scholar] [CrossRef]
- Thorsen, M.; Mirosa, M.; Skeaff, S.; Goodman-Smith, F.; Bremer, P. Upcycled food: How does it support the three pillars of sustainability? Trends Food Sci. Technol. 2024, 143, 104269. [Google Scholar] [CrossRef]
- Yang, X.; Huang, Y.; Cai, X.; Song, Y.; Jiang, H.; Chen, Q.; Chen, Q. Using imagination to overcome fear: How mental simulation nudges consumers’ purchase intentions for upcycled food. Sustainability 2021, 13, 1130. [Google Scholar] [CrossRef]
- Hartmann, C.; Shi, J.; Giusto, A.; Siegrist, M. The psychology of eating insects: A cross-cultural comparison between Germany and China. Food Qual. Prefer. 2015, 44, 148–156. [Google Scholar] [CrossRef]
- Tuorila, H.; Hartmann, C. Consumer responses to novel and unfamiliar foods. Curr. Opin. Food Sci. 2020, 33, 1–8. [Google Scholar] [CrossRef]
- Damsbo-Svendsen, M.; Frøst, M.B.; Olsen, A. A review of instruments developed to measure food neophobia. Appetite 2017, 113, 358–367. [Google Scholar] [CrossRef] [PubMed]
- Jaeger, S.R.; Hedderley, D.; Prescott, J. High arousal as the source of food rejection in food neophobia. Food Research International 2023, 168, 112795. [Google Scholar] [CrossRef]
- Lafraire, J.; Rioux, C.; Giboreau, A.; Picard, D. Food rejections in children: Cognitive and social/environmental factors involved in food neophobia and picky/fussy eating behavior. Appetite 2016, 96, 347–357. [Google Scholar] [CrossRef]
- Siegrist, M.; Hartmann, C.; Keller, C. Antecedents of food neophobia and its association with eating behavior and food choices. Food Qual. Prefer. 2013, 30, 293–298. [Google Scholar] [CrossRef]
- Fox, S.; El Gourari, L.; Dermiki, M. Circular eating: A pilot study in France and Ireland exploring the factors affecting the willingness to consume upcycled food products containing peels and trimming from fruit and vegetables. Ir. J. Agric. Food Res. 2025, 64, 22–43. [Google Scholar] [CrossRef]
- Bornkessel, S.; Bröring, S.; Omta, S.W.F.; van Trijp, H. What determines ingredient awareness of consumers? A study on ten functional food ingredients. Food Qual. Prefer. 2014, 32, 330–339. [Google Scholar] [CrossRef]
- Siegrist, M. Factors influencing public acceptance of innovative food technologies and products. Trends Food Sci. Technol. 2008, 19, 603–608. [Google Scholar] [CrossRef]
- Usmani, Z.; Sharma, M.; Gaffey, J.; Sharma, M.; Dewhurst, R.J.; Moreau, B.; Newbold, J.; Clark, W.; Thakur, V.K.; Gupta, V.K. Valorization of dairy waste and by-products through microbial bioprocesses. Bioresour Technol. 2022, 346, 126444. [Google Scholar] [CrossRef] [PubMed]
- Swaraj, A.N.; Moses, J.A.; Manickam, L. Sustainable food upcycling: Perspectives on manufacturing challenges and certification requirements for large-scale commercialization. Sustain. Food Technol. 2025, 3, 648–664. [Google Scholar] [CrossRef]
- Sandri, E.; Broccolo, A.; Piredda, M. Analysis of the Importance of Food Sustainability and the Consumption of Organic and Local Products in the Spanish Population. Sustainability 2025, 17, 991. [Google Scholar] [CrossRef]
- Hameed, A.; Anwar, M.J.; Perveen, S.; Amir, M.; Naeem, I.; Imran, M.; Hussain, M.; Ahmad, I.; Afzal, M.I.; Inayat, S.; et al. Functional, industrial and therapeutic applications of dairy waste materials. Int. J. Food Prop. 2023, 26, 1470–1496. [Google Scholar] [CrossRef]
- Aschemann-Witzel, J.; Asioli, D.; Banovic, M.; Perito, M.A.; Peschel, A.O. Consumer understanding of upcycled foods–Exploring consumer-created associations and concept explanations across five countries. Food Qual. Prefer. 2023, 112, 105033. [Google Scholar] [CrossRef]

| Variable | Categories | Frequency | Rel. Frequency (%) |
|---|---|---|---|
| Gender | Men | 135 | 39.13 |
| Women | 210 | 60.87 | |
| Age (years) | 18–40 | 204 | 59.13 |
| 41–60 | 118 | 34.20 | |
| <18 | 5 | 1.45 | |
| >61 | 18 | 5.22 | |
| Monthly income level | High | 131 | 37.97 |
| Low | 98 | 28.41 | |
| Medium | 11 | 33.62 | |
| Education | High school 1 | 49 | 14.20 |
| Primary studies 2 | 8 | 2.32 | |
| University 3 | 288 | 83.48 | |
| Family size | 1 member | 40 | 11.59 |
| 2 members | 94 | 27.25 | |
| 3–5 members | 196 | 56.81 | |
| >5 members | 15 | 4.35 | |
| Occupation | Employee | 246 | 71.30 |
| Freelancer/Entrepreneur | 21 | 6.09 | |
| Student | 45 | 13.04 | |
| Retired | 10 | 2.90 | |
| Unemployed/Homemaker | 17 | 4.93 | |
| Not disclosed | 6 | 1.74 |
| Item | Group | N | Mean | Median | SD | SE | 95% Confidence Interval for Mean | Min | Max | Cronbach’s Alpha | |
|---|---|---|---|---|---|---|---|---|---|---|---|
| Lower Bound | Upper Bound | ||||||||||
| Mountain dairy product consumption | |||||||||||
| Mountain dairy product consumption frequency | low | 98 | 3.21 | 3.00 | 1.22 | 0.12 | 2.97 | 3.46 | 1.00 | 5.00 | |
| medium | 116 | 3.38 | 4.00 | 1.09 | 0.10 | 3.18 | 3.58 | 1.00 | 5.00 | 0.6 | |
| high | 131 | 3.53 | 4.00 | 1.03 | 0.09 | 3.36 | 3.71 | 1.00 | 5.00 | ||
| Label reading | low | 98 | 2.27 | 2.00 | 0.63 | 0.06 | 2.14 | 2.39 | 1.00 | 3.00 | |
| medium | 116 | 2.44 | 2.00 | 0.55 | 0.05 | 2.34 | 2.54 | 1.00 | 3.00 | ||
| high | 131 | 2.55 | 3.00 | 0.54 | 0.05 | 2.46 | 2.64 | 1.00 | 3.00 | ||
| Mountain products consumption to sustain the local economy | low | 98 | 4.00 | 4.00 | 1.03 | 0.10 | 3.79 | 4.21 | 1.00 | 5.00 | |
| medium | 116 | 4.22 | 4.00 | 0.75 | 0.07 | 4.09 | 4.36 | 1.00 | 5.00 | ||
| high | 131 | 4.34 | 4.00 | 0.75 | 0.07 | 4.21 | 4.47 | 1.00 | 5.00 | ||
| Factors affecting consumption | |||||||||||
| Product origin | low | 98 | 3.87 | 4.00 | 1.14 | 0.11 | 3.64 | 4.10 | 1.00 | 5.00 | |
| medium | 116 | 3.98 | 4.00 | 0.97 | 0.09 | 3.80 | 4.16 | 1.00 | 5.00 | ||
| high | 131 | 4.25 | 4.00 | 0.91 | 0.08 | 4.10 | 4.41 | 1.00 | 5.00 | 0.9 | |
| Quality label (mountain product, product with protected designation of origin, etc.) | low | 98 | 3.86 | 4.00 | 1.12 | 0.11 | 3.63 | 4.08 | 1.00 | 5.00 | |
| medium | 116 | 3.99 | 4.00 | 0.96 | 0.09 | 3.82 | 4.17 | 2.00 | 5.00 | ||
| high | 131 | 4.07 | 4.00 | 1.02 | 0.09 | 3.89 | 4.24 | 1.00 | 5.00 | ||
| Ingredients origin | low | 98 | 4.06 | 4.00 | 1.00 | 0.10 | 3.86 | 4.26 | 1.00 | 5.00 | |
| medium | 116 | 4.21 | 4.00 | 0.91 | 0.08 | 4.04 | 4.37 | 2.00 | 5.00 | ||
| high | 131 | 4.36 | 4.00 | 0.70 | 0.06 | 4.24 | 4.48 | 1.00 | 5.00 | ||
| Nutritional value | low | 98 | 3.96 | 4.00 | 1.08 | 0.11 | 3.74 | 4.18 | 1.00 | 5.00 | |
| medium | 116 | 3.94 | 4.00 | 0.94 | 0.09 | 3.77 | 4.11 | 1.00 | 5.00 | ||
| high | 131 | 4.00 | 4.00 | 0.97 | 0.08 | 3.83 | 4.17 | 1.00 | 5.00 | ||
| Health awareness | |||||||||||
| Health benefits | low | 98 | 4.16 | 4.00 | 0.76 | 0.08 | 4.01 | 4.31 | 2.00 | 5.00 | |
| medium | 116 | 4.36 | 4.00 | 0.68 | 0.06 | 4.24 | 4.49 | 3.00 | 5.00 | 0.9 | |
| high | 131 | 4.44 | 5.00 | 0.68 | 0.06 | 4.33 | 4.56 | 2.00 | 5.00 | ||
| Healthy diet | low | 98 | 3.47 | 4.00 | 0.97 | 0.10 | 3.28 | 3.66 | 1.00 | 5.00 | |
| medium | 116 | 3.66 | 4.00 | 0.92 | 0.09 | 3.49 | 3.83 | 1.00 | 5.00 | ||
| high | 131 | 3.80 | 4.00 | 0.92 | 0.08 | 3.64 | 3.96 | 1.00 | 5.00 | ||
| Nutrients diversity | low | 98 | 3.73 | 4.00 | 0.97 | 0.10 | 3.54 | 3.93 | 1.00 | 5.00 | |
| medium | 116 | 4.03 | 4.00 | 0.82 | 0.08 | 3.88 | 4.18 | 1.00 | 5.00 | ||
| high | 131 | 4.08 | 4.00 | 0.78 | 0.07 | 3.94 | 4.21 | 2.00 | 5.00 | ||
| Fiber consumption | low | 98 | 3.67 | 4.00 | 0.98 | 0.10 | 3.48 | 3.87 | 1.00 | 5.00 | |
| medium | 116 | 3.90 | 4.00 | 0.82 | 0.08 | 3.75 | 4.05 | 1.00 | 5.00 | ||
| high | 131 | 3.96 | 4.00 | 0.76 | 0.07 | 3.83 | 4.09 | 2.00 | 5.00 | ||
| Environmental awareness | |||||||||||
| Personal food waste impact | low | 98 | 4.02 | 4.00 | 1.02 | 0.10 | 3.82 | 4.22 | 1.00 | 5.00 | |
| medium | 116 | 4.16 | 4.00 | 0.84 | 0.08 | 4.01 | 4.32 | 1.00 | 5.00 | 0.7 | |
| high | 131 | 4.11 | 4.00 | 0.84 | 0.07 | 3.96 | 4.25 | 1.00 | 5.00 | ||
| Acceptability of foods with by-products | low | 98 | 3.54 | 4.00 | 1.20 | 0.12 | 3.30 | 3.78 | 1.00 | 5.00 | |
| medium | 116 | 3.59 | 4.00 | 1.14 | 0.11 | 3.38 | 3.80 | 1.00 | 5.00 | ||
| high | 131 | 3.66 | 4.00 | 1.19 | 0.10 | 3.45 | 3.86 | 1.00 | 5.00 | ||
| Buying intention of foods with by-products | low | 98 | 3.28 | 4.00 | 1.22 | 0.12 | 3.03 | 3.52 | 1.00 | 5.00 | |
| medium | 116 | 3.33 | 4.00 | 1.06 | 0.10 | 3.13 | 3.52 | 1.00 | 5.00 | ||
| high | 131 | 3.33 | 4.00 | 1.17 | 0.10 | 3.13 | 3.53 | 1.00 | 5.00 | ||
| Use of green energy in the food industry | low | 98 | 4.12 | 4.00 | 0.84 | 0.08 | 3.95 | 4.29 | 2.00 | 5.00 | |
| medium | 116 | 4.17 | 4.00 | 0.90 | 0.08 | 4.01 | 4.34 | 1.00 | 5.00 | ||
| high | 131 | 4.06 | 4.00 | 0.95 | 0.08 | 3.90 | 4.23 | 1.00 | 5.00 | ||
| Indifference toward food industry’s impact on the environment | low | 98 | 4.37 | 4.00 | 0.68 | 0.07 | 4.23 | 4.50 | 3.00 | 5.00 | |
| medium | 116 | 4.37 | 4.00 | 0.68 | 0.06 | 4.25 | 4.50 | 3.00 | 5.00 | ||
| high | 131 | 4.40 | 5.00 | 0.72 | 0.06 | 4.27 | 4.52 | 3.00 | 5.00 | ||
| Item | Group | N | Mean | Median | SD | SE | 95% Confidence Interval for Mean | Min | Max | Cronbach’s Alpha | |
|---|---|---|---|---|---|---|---|---|---|---|---|
| Lower Bound | Upper Bound | ||||||||||
| Acceptability of cream cheese with berry by-products | |||||||||||
| Willingness to buy | low | 98 | 0.80 | 1.00 | 0.41 | 0.04 | 0.71 | 0.88 | 0.00 | 1.00 | |
| medium | 116 | 0.86 | 1.00 | 0.35 | 0.03 | 0.80 | 0.93 | 0.00 | 1.00 | 0.8 | |
| high | 131 | 0.90 | 1.00 | 0.30 | 0.03 | 0.85 | 0.95 | 0.00 | 1.00 | ||
| Willingness to buy if accessible | low | 98 | 0.89 | 1.00 | 0.32 | 0.03 | 0.82 | 0.95 | 0.00 | 1.00 | |
| medium | 116 | 0.97 | 1.00 | 0.18 | 0.02 | 0.93 | 1.00 | 0.00 | 1.00 | ||
| high | 131 | 0.92 | 1.00 | 0.27 | 0.02 | 0.88 | 0.97 | 0.00 | 1.00 | ||
| Willingness to buy after informing | low | 98 | 0.92 | 1.00 | 0.28 | 0.03 | 0.86 | 0.97 | 0.00 | 1.00 | |
| medium | 116 | 0.95 | 1.00 | 0.22 | 0.02 | 0.91 | 0.99 | 0.00 | 1.00 | ||
| high | 131 | 0.92 | 1.00 | 0.27 | 0.02 | 0.88 | 0.97 | 0.00 | 1.00 | ||
| Price | |||||||||||
| Too cheap | low | 98 | 5.65 | 4.00 | 5.27 | 0.53 | 4.60 | 6.71 | 2.00 | 32.00 | |
| medium | 116 | 6.48 | 4.00 | 5.07 | 0.47 | 5.55 | 7.42 | 2.00 | 32.00 | 0.7 | |
| high | 131 | 6.47 | 4.00 | 6.15 | 0.54 | 5.41 | 7.54 | 2.00 | 32.00 | ||
| Good acquisition price | low | 98 | 10.31 | 8.00 | 5.59 | 0.56 | 9.19 | 11.43 | 2.00 | 32.00 | |
| medium | 116 | 11.02 | 8.00 | 5.67 | 0.53 | 9.97 | 12.06 | 2.00 | 32.00 | ||
| high | 131 | 11.31 | 8.00 | 6.14 | 0.54 | 10.25 | 12.37 | 2.00 | 32.00 | ||
| Expensive but worthy | low | 98 | 19.71 | 16.00 | 9.60 | 0.97 | 17.79 | 21.64 | 4.00 | 32.00 | |
| medium | 116 | 20.34 | 16.00 | 8.77 | 0.81 | 18.73 | 21.96 | 4.00 | 32.00 | ||
| high | 131 | 21.28 | 16.00 | 8.84 | 0.77 | 19.75 | 22.81 | 4.00 | 32.00 | ||
| Too expensive | low | 98 | 27.00 | 32.00 | 9.44 | 0.95 | 25.11 | 28.89 | 2.00 | 32.00 | |
| medium | 116 | 29.76 | 32.00 | 5.97 | 0.55 | 28.66 | 30.86 | 4.00 | 32.00 | ||
| high | 131 | 29.83 | 32.00 | 5.98 | 0.52 | 28.80 | 30.87 | 4.00 | 32.00 | ||
| Item | Group | N | Mean | Median | SD | SE | 95% Confidence Interval for Mean | Min | Max | Cronbach’s Alpha | |
|---|---|---|---|---|---|---|---|---|---|---|---|
| Lower Bound | Upper Bound | ||||||||||
| Fear of new products | low | 98 | 3.50 | 3.00 | 1.11 | 0.11 | 3.28 | 3.72 | 1.00 | 5.00 | |
| medium | 116 | 3.83 | 4.00 | 1.02 | 0.10 | 3.64 | 4.02 | 1.00 | 5.00 | 0.7 | |
| high | 131 | 4.00 | 4.00 | 1.14 | 0.10 | 3.80 | 4.20 | 1.00 | 5.00 | ||
| Reluctance due to lack of information | low | 98 | 3.02 | 3.00 | 1.23 | 0.12 | 2.77 | 3.27 | 1.00 | 5.00 | |
| medium | 116 | 2.98 | 3.00 | 1.25 | 0.12 | 2.75 | 3.21 | 1.00 | 5.00 | ||
| high | 131 | 2.90 | 3.00 | 1.37 | 0.12 | 2.66 | 3.14 | 1.00 | 5.00 | ||
| Lack of confidence in novel products | low | 98 | 3.77 | 4.00 | 0.92 | 0.09 | 3.58 | 3.95 | 1.00 | 5.00 | |
| medium | 116 | 3.95 | 4.00 | 0.91 | 0.08 | 3.78 | 4.12 | 1.00 | 5.00 | ||
| high | 131 | 4.18 | 4.00 | 0.92 | 0.08 | 4.02 | 4.33 | 1.00 | 5.00 | ||
| Willingness to eat almost everything | low | 98 | 3.33 | 4.00 | 1.20 | 0.12 | 3.09 | 3.57 | 1.00 | 5.00 | |
| medium | 116 | 3.10 | 3.00 | 1.23 | 0.11 | 2.88 | 3.33 | 1.00 | 5.00 | ||
| high | 131 | 2.85 | 3.00 | 1.28 | 0.11 | 2.63 | 3.08 | 1.00 | 5.00 | ||
| Willingness to taste new products in special occasions | low | 98 | 3.89 | 4.00 | 0.97 | 0.10 | 3.69 | 4.08 | 1.00 | 5.00 | |
| medium | 116 | 3.85 | 4.00 | 0.90 | 0.08 | 3.69 | 4.02 | 1.00 | 5.00 | ||
| high | 131 | 3.83 | 4.00 | 0.94 | 0.08 | 3.67 | 3.99 | 1.00 | 5.00 | ||
| Willingness to taste always new products | low | 98 | 3.61 | 4.00 | 0.93 | 0.09 | 3.43 | 3.80 | 1.00 | 5.00 | |
| medium | 116 | 3.71 | 4.00 | 0.80 | 0.07 | 3.56 | 3.85 | 2.00 | 5.00 | ||
| high | 131 | 3.62 | 4.00 | 0.93 | 0.08 | 3.46 | 3.78 | 2.00 | 5.00 | ||
| Test Results | Mountain Dairy Product Consumption Frequency | Label Reading | Mountain Products Consumption to Sustain the Local economy | Product Origin | Quality Label | Ingredients Origin | Nutritional Value | Health Benefits | Healthy Diet | Nutrient Diversity | Fiber Consumption | Personal Food Waste Impact | Acceptability of Foods with By-Products | Buying Intention of Foods with By-Products | Use of Green Energy in the Food Industry | Indifference Toward the Food Industry’s Impact on Environment | |||||||||||||
|---|---|---|---|---|---|---|---|---|---|---|---|---|---|---|---|---|---|---|---|---|---|---|---|---|---|---|---|---|---|
| Kruskal–Wallis test | |||||||||||||||||||||||||||||
| H | 3.90 | 12.02 | 6.00 | 8.73 | 2.04 | 3.85 | 0.58 | 8.85 | 6.58 | 8.57 | 5.00 | 0.68 | 0.61 | 0.10 | 0.94 | 0.34 | |||||||||||||
| p | 0.14 | 0.00 | 0.05 | 0.01 | 0.36 | 0.15 | 0.75 | 0.01 | 0.04 | 0.01 | 0.08 | 0.71 | 0.74 | 0.95 | 0.63 | 0.84 | |||||||||||||
| Mann−Whitney Test | |||||||||||||||||||||||||||||
| low vs. medium income | |||||||||||||||||||||||||||||
| U | 5267.50 | 4909.00 | 5162.50 | 5497.00 | 5426.50 | 5239.50 | 5428.00 | 4894.00 | 5060.50 | 4675.50 | 4975.00 | 5359.50 | 5566.00 | 5617.50 | 5410.00 | 5667.50 | |||||||||||||
| W | 10,118.50 | 9760.00 | 10,013.50 | 10,348.00 | 10,277.50 | 10,090.50 | 12,214.00 | 9745.00 | 9911.50 | 9526.50 | 9826.00 | 10,210.50 | 10,417.00 | 10,468.50 | 10,261.00 | 10,518.50 | |||||||||||||
| z | −0.96 | −1.94 | −1.24 | −0.44 | −0.60 | −1.06 | −0.60 | −1.91 | −1.45 | −2.40 | −1.66 | −0.77 | −0.27 | −0.15 | −0.66 | −0.04 | |||||||||||||
| r | 0.22 | 0.45 | 0.29 | 0.10 | 0.14 | 0.25 | 0.14 | 0.44 | 0.34 | 0.56 | 0.39 | 0.18 | 0.06 | 0.03 | 0.15 | 0.01 | |||||||||||||
| p | 0.34 | 0.05 | 0.21 | 0.66 | 0.55 | 0.29 | 0.55 | 0.05 | 0.15 | 0.02 | 0.10 | 0.44 | 0.79 | 0.88 | 0.51 | 0.97 | |||||||||||||
| low vs. high income | |||||||||||||||||||||||||||||
| U | 5493.00 | 4915.00 | 5332.00 | 5218.50 | 5773.00 | 5509.00 | 6415.50 | 5091.50 | 5216.50 | 5172.00 | 5413.00 | 6296.50 | 6061.50 | 6273.00 | 6302.50 | 6191.00 | |||||||||||||
| W | 10,344.00 | 9766.00 | 10,183.00 | 10,069.50 | 10,624.00 | 10,360.00 | 15,061.50 | 9942.50 | 10,067.50 | 10,023.00 | 10,264.00 | 11,147.50 | 10,912.50 | 11,124.00 | 14,948.50 | 11,042.00 | |||||||||||||
| z | −1.95 | −3.41 | −2.37 | −2.59 | −1.37 | −2.00 | −0.01 | −2.94 | −2.54 | −2.68 | −2.15 | −0.27 | −0.75 | −0.31 | −0.25 | −0.51 | |||||||||||||
| r | 0.45 | 0.79 | 0.55 | 0.60 | 0.32 | 0.46 | 0.00 | 0.68 | 0.59 | 0.62 | 0.50 | 0.06 | 0.17 | 0.07 | 0.06 | 0.12 | |||||||||||||
| p | 0.05 | 0.00 | 0.02 | 0.01 | 0.17 | 0.05 | 0.99 | 0.00 | 0.01 | 0.01 | 0.03 | 0.79 | 0.45 | 0.76 | 0.80 | 0.61 | |||||||||||||
| medium vs. high income | |||||||||||||||||||||||||||||
| U | 7036.50 | 6794.00 | 6906.50 | 6324.00 | 7128.50 | 7162.00 | 7224.50 | 7062.00 | 6982.00 | 7423.50 | 7349.50 | 7284.50 | 7318.00 | 7495.50 | 7109.00 | 7349.50 | |||||||||||||
| W | 13,822.50 | 13,580.00 | 13,692.50 | 13,110.00 | 13,914.50 | 13,948.00 | 14,010.50 | 13,848.00 | 13,768.00 | 14,209.50 | 14,135.50 | 15,930.50 | 14,104.00 | 14,281.50 | 15,755.00 | 14,135.50 | |||||||||||||
| z | −1.06 | −1.64 | −1.36 | −2.44 | −0.89 | −0.85 | −0.71 | −1.07 | −1.16 | −0.34 | −0.48 | −0.61 | −0.52 | −0.19 | −0.94 | −0.49 | |||||||||||||
| r | 0.25 | 0.38 | 0.32 | 0.57 | 0.21 | 0.20 | 0.16 | 0.25 | 0.27 | 0.08 | 0.11 | 0.14 | 0.12 | 0.04 | 0.22 | 0.11 | |||||||||||||
| p | 0.29 | 0.10 | 0.18 | 0.01 | 0.37 | 0.40 | 0.48 | 0.29 | 0.25 | 0.73 | 0.63 | 0.54 | 0.60 | 0.85 | 0.35 | 0.62 | |||||||||||||
| Kruskal−Walli’s test | |||||||||||||||||||||||||||||
| H | 5.07 | 4.81 | 0.88 | 4.54 | 1.63 | 2.37 | 7.62 | 14.11 | 0.65 | 13.29 | 8.12 | 0.39 | 0.90 | ||||||||||||||||
| p | 0.08 | 0.09 | 0.64 | 0.10 | 0.44 | 0.31 | 0.02 | 0.00 | 0.72 | 0.00 | 0.02 | 0.82 | 0.64 | ||||||||||||||||
| Mann−Whitney Test | |||||||||||||||||||||||||||||
| low vs. medium income | |||||||||||||||||||||||||||||
| U | 5308.00 | 5242.00 | 5514.00 | 4783.00 | 5264.00 | 5384.50 | 5017.50 | 4742.50 | 5507.00 | 5004.00 | 5131.50 | 5481.00 | 5315.50 | ||||||||||||||||
| W | 10,159.00 | 10,093.00 | 10,365.00 | 9634.00 | 10,115.00 | 10,235.50 | 9868.50 | 9593.50 | 12,293.00 | 9855.00 | 11,917.50 | 12,267.00 | 10,166.50 | ||||||||||||||||
| z | −1.29 | −2.21 | −0.88 | −2.09 | −1.01 | −0.73 | −2.22 | −2.17 | −0.40 | −1.59 | −1.26 | −0.49 | −0.87 | ||||||||||||||||
| r | 0.30 | 0.51 | 0.20 | 0.48 | 0.23 | 0.17 | 0.52 | 0.50 | 0.09 | 0.37 | 0.29 | 0.11 | 0.20 | ||||||||||||||||
| p | 0.20 | 0.03 | 0.38 | 0.04 | 0.31 | 0.47 | 0.03 | 0.03 | 0.69 | 0.11 | 0.21 | 0.63 | 0.39 | ||||||||||||||||
| low vs. high income | |||||||||||||||||||||||||||||
| U | 5746.00 | 6188.50 | 6385.00 | 5742.50 | 5864.50 | 5743.00 | 5631.50 | 4668.00 | 6057.50 | 4752.00 | 5060.50 | 6144.50 | 6380.50 | ||||||||||||||||
| W | 10,597.00 | 11,039.50 | 11,236.00 | 10,593.50 | 10,715.50 | 10,594.00 | 10,482.50 | 9519.00 | 14,703.50 | 9603.00 | 13,706.50 | 14,790.50 | 11,231.50 | ||||||||||||||||
| z | −2.23 | −0.93 | −0.15 | −1.43 | −1.21 | −1.49 | −2.43 | −3.68 | −0.75 | −3.55 | −2.81 | −0.59 | −0.08 | ||||||||||||||||
| r | 0.52 | 0.22 | 0.03 | 0.33 | 0.28 | 0.35 | 0.56 | 0.85 | 0.17 | 0.82 | 0.65 | 0.14 | 0.02 | ||||||||||||||||
| p | 0.03 | 0.35 | 0.88 | 0.15 | 0.23 | 0.14 | 0.02 | 0.00 | 0.46 | 0.00 | 0.01 | 0.55 | 0.94 | ||||||||||||||||
| medium vs. high income | |||||||||||||||||||||||||||||
| U | 7304.00 | 7280.00 | 7411.00 | 7161.50 | 7492.50 | 7156.50 | 7549.50 | 6659.50 | 7320.00 | 6451.50 | 6712.50 | 7527.50 | 7185.00 | ||||||||||||||||
| W | 14,090.00 | 15,926.00 | 16,057.00 | 15,807.50 | 14,278.50 | 13,942.50 | 14,335.50 | 13,445.50 | 15,966.00 | 13,237.50 | 15,358.50 | 16,173.50 | 15,831.00 | ||||||||||||||||
| z | −0.94 | −1.42 | −0.78 | −0.82 | −0.20 | −0.88 | −0.15 | −1.76 | −0.51 | −2.17 | −1.62 | −0.14 | −0.78 | ||||||||||||||||
| r | 0.22 | 0.33 | 0.18 | 0.19 | 0.05 | 0.20 | 0.03 | 0.41 | 0.12 | 0.50 | 0.38 | 0.03 | 0.18 | ||||||||||||||||
| p | 0.35 | 0.16 | 0.43 | 0.41 | 0.84 | 0.38 | 0.88 | 0.08 | 0.61 | 0.03 | 0.11 | 0.89 | 0.43 | ||||||||||||||||
| Component | Eigenvalue | Total Explained Variance | |
|---|---|---|---|
| % of Variance | Cumulative % | ||
| 1.00 | 6.17 | 21.28 | 21.28 |
| 2.00 | 3.11 | 10.74 | 32.02 |
| 3.00 | 2.15 | 7.41 | 39.43 |
| 4.00 | 1.97 | 6.80 | 46.22 |
| 5.00 | 1.80 | 6.21 | 52.44 |
| 6.00 | 1.51 | 5.21 | 57.65 |
| 7.00 | 1.21 | 4.16 | 61.80 |
| 8.00 | 1.12 | 3.85 | 65.66 |
| 9.00 | 1.07 | 4.34 | 70.00 |
| KMO | 0.81 | ||
| Bartlett’s Test of Sphericity | Approx. Chi-Square | 4209.95 | |
| Df | 406 | ||
| p | 0.00 | ||
Disclaimer/Publisher’s Note: The statements, opinions and data contained in all publications are solely those of the individual author(s) and contributor(s) and not of MDPI and/or the editor(s). MDPI and/or the editor(s) disclaim responsibility for any injury to people or property resulting from any ideas, methods, instructions or products referred to in the content. |
© 2025 by the authors. Licensee MDPI, Basel, Switzerland. This article is an open access article distributed under the terms and conditions of the Creative Commons Attribution (CC BY) license (https://creativecommons.org/licenses/by/4.0/).
Share and Cite
Ungureanu-Iuga, M.; Nicula, E.-A. A Consumer Perspective on the Valorization of Forest Fruit By-Products in a Dairy Product: Opportunity or Challenge? Sustainability 2025, 17, 6611. https://doi.org/10.3390/su17146611
Ungureanu-Iuga M, Nicula E-A. A Consumer Perspective on the Valorization of Forest Fruit By-Products in a Dairy Product: Opportunity or Challenge? Sustainability. 2025; 17(14):6611. https://doi.org/10.3390/su17146611
Chicago/Turabian StyleUngureanu-Iuga, Mădălina, and Emanuela-Adina Nicula. 2025. "A Consumer Perspective on the Valorization of Forest Fruit By-Products in a Dairy Product: Opportunity or Challenge?" Sustainability 17, no. 14: 6611. https://doi.org/10.3390/su17146611
APA StyleUngureanu-Iuga, M., & Nicula, E.-A. (2025). A Consumer Perspective on the Valorization of Forest Fruit By-Products in a Dairy Product: Opportunity or Challenge? Sustainability, 17(14), 6611. https://doi.org/10.3390/su17146611