Article

Characteristics and Mechanisms of the Impact of Heterogeneity in the Vadose Zone of Arid Regions on Natural Vegetation Ecology: A Case Study of the Shiyang River Basin

1
Key Laboratory of Groundwater Engineering and Geothermal Resources in Gansu Province, Lanzhou; Gansu Institute of Geological Environment Monitoring, Lanzhou 730050, China
2
Institute of Hydrogeology and Environmental Geology, Chinese Academy of Geological Sciences, Shijiazhuang 050061, China
3
Key Laboratory of Groundwater Sciences and Engineering, Ministry of Natural Resources, Shijiazhuang 050061, China
4
School of Water Resources and Environment, Hebei GEO University, Shijiazhuang 050031, China
5
Hebei Province Key Laboratory of Sustained Utilization and Development of Water Resources, Shijiazhuang 050031, China
6
Hebei Province Collaborative Innovation Center for Sustainable Utilization of Water Resources and Optimization of Industrial Structure, Shijiazhuang 050031, China
*
Author to whom correspondence should be addressed.
Sustainability 2025, 17(14), 6605; https://doi.org/10.3390/su17146605 (registering DOI)
Submission received: 21 May 2025 / Revised: 25 June 2025 / Accepted: 15 July 2025 / Published: 19 July 2025
(This article belongs to the Section Sustainable Water Management)

Abstract

As a critical link connecting groundwater and vegetation, the vadose zone’s lithological structural heterogeneity directly influences soil water distribution and vegetation growth. A comprehensive understanding of the ecological effects of the vadose zone can provide scientific evidence for groundwater ecological protection and natural vegetation conservation in arid regions. This study, taking the Minqin Basin in the lower reaches of China’s Shiyang River as a case, reveals the constraining effects of vadose zone lithological structures on vegetation water supply, root development, and water use strategies through integrated analysis, field investigations, and numerical simulations. The findings highlight the critical ecological role of the vadose zone. This role primarily manifests through two mechanisms: regulating capillary water rise and controlling water-holding capacity. They directly impact soil water supply efficiency, alter the spatiotemporal distribution of water deficit in the root zone, and drive vegetation to develop adaptive root growth patterns and stratified water use strategies, ultimately leading to different growth statuses of natural vegetation. During groundwater level fluctuations, fine-grained lithologies in the vadose zone exhibit stronger capillary water response rates, while multi-layered lithological structures (e.g., “fine-over-coarse” configurations) demonstrate pronounced delayed water release effects. Their effective water-holding capacities continue to exert ecological effects, significantly enhancing vegetation drought resilience.

1. Introduction

Groundwater serves not only as a vital resource but also plays a pivotal role in sustaining natural vegetation ecosystems in arid regions [1]. This is particularly evident in China’s northwest inland areas characterized by arid climates and intense evaporation, where natural vegetation exhibits a strong dependence on groundwater table depth [2,3,4,5,6]. It has been established that normal vegetation growth can only be maintained within a suitable ecological groundwater level range [7,8]. In arid inland basins, the upper threshold of the rational ecological water level for natural vegetation corresponds to the critical depth of intense phreatic evaporation determined by capillary rise height, while the lower limit is defined by both the capillary rise height and vegetation root zone thickness, representing the phreatic evaporation extinction depth [9,10]. The ecological suitability of groundwater levels is fundamentally influenced by the lithologic structure of the vadose zone and vegetation characteristics [11]. This relationship manifests through two primary mechanisms: First, varying lithologic compositions in the vadose zone demonstrate distinct groundwater-supported capillary rise capacities [12], resulting in differing ecological water level thresholds for vegetation. Second, the water retention capacity and delayed water-release moisture preservation characteristics differ substantially among vadose zone lithologies [13], leading to varied ecological responses to drought stress through differential delayed water-release effects. Consequently, vadose zone heterogeneity exerts significant constraints and influences on natural vegetation ecosystems.
Under certain conditions, the finer the lithological particles and the smaller the pore size in the vadose zone, the greater the supported capillary rise height becomes. For vadose zones with similar lithologies, higher dry density corresponds to increased capillary rise height [14,15]. The lithological structure of the vadose zone, along with the texture, thickness, stratigraphic position, and inter-relationships of interlayer soils, significantly influences capillary water rise height [16]. Stratified structures within soils may either impede or accelerate vertical water movement [17,18]. Vadose zones composed of homogeneous sand–gravel formations exhibit strong permeability but limited capillary rise height, resulting in insufficient moisture supply for vegetation growth. In contrast, vadose zones with alternating silt–clay layered structures demonstrate superior water retention capacity and greater capillary rise height. The water-retarding release characteristics of clayey soils facilitate moisture storage in root zone layers, thereby enhancing water supply capacity for vegetation sustenance [19]. Tao Zhengping et al. [20] revealed that the aeolian sand-dominated vadose zone in the northern Ordos Basin serves as a critical factor supporting the survival of drought-resistant psammophytes (e.g., Artemisia ordosica and Salix psammophila) due to its exceptional water-holding properties.
Conversely, during groundwater level decline, the asynchronous water release from soil pores of varying diameters results in delayed gravity drainage, leading to differential impacts on natural vegetation growth. Both homogeneous and stratified soils exhibit drainage hysteresis [21], with this phenomenon being more pronounced in stratified formations. When water table decline accelerates, pore size disparity increases, fine-grained layers thin, and stratified soil layering intensifies, the drainage hysteresis effect becomes progressively more pronounced. Consequently, the drainage hysteresis processes in vadose zones vary significantly depending on lithological structure, layer thickness, water table decline rate, and evaporative conditions. In arid regions, differential capillary rise capacities and drainage hysteresis effects within vadose zones create substantial variations in terrestrial natural vegetation coverage and growth vitality [22]. Areas demonstrating either greater capillary rise heights or enhanced drainage hysteresis capacity typically sustain superior vegetation growth and higher coverage density as these mechanisms collectively enhance soil moisture retention in root zones during water-stressed periods.
In the middle-lower reaches of inland river basins across northwestern China, where arid climates and intense evaporation prevail, natural vegetation exhibits strong dependence on groundwater table depth [23,24], with groundwater demonstrating significant capacity to sustain these ecosystems [25]. The critical ecohydrological water table threshold serves as a key indicator for assessing vegetation ecological security [26,27], which is intrinsically linked to both vadose zone lithological structure and vegetation root development depth. When the phreatic water table depth persistently exceeds this critical threshold, natural vegetation ecosystems lose sustained moisture supply through capillary water support [28], inevitably leading to vegetation degradation or even extinction due to water deprivation, ultimately triggering land desertification [29,30]. Therefore, the ecological security of natural vegetation is intricately correlated with three fundamental factors: phreatic water table depth, vadose zone lithological architecture, and developmental depth of vegetation community root zones (Figure 1).
The vadose zone serves as both the primary water source for natural vegetation growth and a critical hydraulic interface within the groundwater–soil–vegetation–atmosphere continuum [31]. Its moisture transport characteristics not only govern soil water distribution and redistribution processes but also directly regulate vegetation growth patterns [32]. Under arid climatic conditions, water stored in the vadose zone fulfills vital ecological functions by sustaining vegetation survival and mitigating drought stress [33]. The inherent heterogeneity of vadose zones—manifested through lithological variations, stratigraphic configurations, layer positioning, and thickness disparities—introduces substantial complexity to moisture dynamics and water retention capacities, thereby exerting critical influences on vegetation ecological security. Current research [7,8,9,10] on the ecological constraint mechanisms of natural vegetation predominantly focuses on identifying ecohydrological thresholds, while insufficient attention has been given to the impacts of vadose zone lithological heterogeneity. Particularly, the ecological implications of drainage hysteresis effects across different vadose zone lithostructures remain underexplored, creating knowledge gaps that hinder comprehensive understanding of vegetation constraint mechanisms in arid regions [11,12,13]. Therefore, effective management of groundwater overexploitation and ecological restoration of natural vegetation in these areas urgently requires
(1)
Enhanced recognition of the vadose zone’s ecological regulatory functions;
(2)
Systematic investigations into how lithostructure-dependent drainage hysteresis mechanisms constrain vegetation ecology.
This fundamental understanding will provide essential scientific support for implementing groundwater ecological protection and natural vegetation conservation strategies in northwestern China’s arid zones.

2. Materials and Methods

This study focuses on the lower reaches of the Shiyang River Basin (Figure 2), an inland river basin located in northwestern China. Situated in the eastern Hexi Corridor of Gansu Province, the Shiyang River Basin spans an area of 41,600 km2. The studied catchment experiences an arid continental climate with an annual average temperature of 8.8 °C and 3142.2 h of sunshine. Mean annual evaporation in the watershed is 2675.6 mm, far exceeding the mean annual precipitation (113.2 mm) [6]. The basin exhibits distinct zonation characteristics (Figure 3):
Upper reaches: Mountainous water source formation area;
Middle reaches: Primary zone for water resource exploitation and groundwater utilization;
Lower reaches: Region of severe water scarcity and pronounced ecological vulnerability/degradation.
Figure 2. Remote-sensing image of the Shiyang River Basin.
Sustainability 17 06605 g002
Figure 3. Water cycle patterns and ecological functions in the natural state of the Shiyang River Basin: 1. bedrock; 2. quaternary; 3. fault; 4. water cycle transformation and GEF zoning number; 5. groundwater depth; 6. groundwater movement; 7. spring; 8. precipitation; 9. surface runoff [34].
Sustainability 17 06605 g003
The lower Shiyang River Basin constitutes the core distribution area of natural oases within the basin and ranks among the northwestern inland regions most severely impacted by desertification and aeolian desert encroachment [35]. Consequently, the Minqin Basin in the lower reaches has been selected as the key study area, representing a critical transition zone between oasis ecosystems and desert environments.
The data and materials utilized in this study were primarily derived from the National Key Research and Development Program of China (“Groundwater Development, Utilization, and Ecological Function Conservation in Special Geomorphic Regions of Western China”) implemented in the Shiyang River Basin. These include data compilation, field investigations, in situ detection and monitoring, and physical experimental simulations. Complementary field surveys and synthesis of preliminary findings were conducted through support from the Open Fund Project of Gansu Provincial Key Laboratory of Groundwater Engineering and Geothermal Resources, ensuring methodological robustness and data triangulation.

2.1. Data Compilation and Comprehensive Analysis

Systematic review and synthesis of the research literature and findings on ecological water tables, ecological water requirements, and vegetation water uptake strategies in northwestern inland regions were conducted. Data compilation included the following: meteorological, hydrological, and hydrogeological datasets for the Shiyang River Basin; water resources bulletins and integrated water management reports for the basin; and long-term groundwater monitoring records. These datasets provided foundational support for subsequent analyses.

2.2. Field Investigations

Building upon preliminary fieldwork data, targeted supplementary surveys were implemented. The Qingtu Lake terminal lake system in the lower Shiyang River Basin served as the focal area, with investigations encompassing ecological quadrat surveys in representative vegetation zones and isotopic sampling of vegetation–soil–water systems.

2.2.1. Preliminary Fieldwork

Two phases of integrated groundwater–ecology–soil surveys were conducted (Figure 4): (1) in transition zones between Minqin Oasis and desert margins and (2) in Qingtu Lake wetland areas.
Detailed measurements included phreatic water table depths, natural vegetation community composition, soil salinity profiles (0–1 m depth), and vadose zone lithostructure characterization using Luoyang spade profiling (20 cm intervals). Building upon this comprehensive investigation, representative lithostratigraphic profiles featuring multi-layered lithologies were selected for detailed characterization. Full-profile in situ testing was conducted through test pit excavation to quantify vertical distribution of soil moisture content, bulk density variations, and capillary rise height distribution characteristics.
Subsequently, soil samples (100 kg per lithology) were collected from each identified stratum to establish controlled soil column physical simulation experiments under laboratory conditions.
Twenty-one groundwater monitoring wells (Figure 4B) were strategically installed within the Qingtu Lake terminal wetland system of the lower Shiyang River Basin. These wells, with depths ranging from 1.5 to 7.0 m, were constructed using Luoyang spade drilling to pre-phreatic levels, followed by PVC casing installation. Each well was equipped with a Solinst Levelogger LTC sensor (Toronto, Canada) positioned below the phreatic surface, programmed to record water table elevation, electrical conductivity, and temperature at 30-min intervals, ensuring high-resolution hydrological characterization of the wetland-aquifer interface.

2.2.2. Supplementary Ecological Quadrat Surveys

Based on the previous groundwater dynamic monitoring points, supplementary ecological quadrat surveys were conducted in the natural vegetation oasis areas of the middle and lower reaches of the Shiyang River Basin (Figure 5). V01 is dominated by Nitraria species, with a groundwater depth of 190 cm; V02 features mixed vegetation of Phragmites (reed) and Nitraria, with a groundwater depth of 155 cm; V03 and V04 both primarily support Phragmites communities, with groundwater depths of 90 cm and 177 cm, respectively; and V05 and V06 are characterized by Phragmites and Nitraria vegetation (V05) and exclusive Nitraria cover (V06), both with groundwater depths exceeding 300 cm. During the period of intense water demand (June to August in summer) for vegetation growth, observations and sample collections were carried out to assess the response of natural vegetation communities to groundwater in the deep groundwater burial areas of the Shiyang River Basin. Isotope testing was conducted on the collected samples, including soil, plant materials, and water samples. Using direct comparison to qualitatively determine the source of plant water, it assumes that plants only absorb water from a specific soil depth. By comparing the isotopic values of plant xylem water with those of soil water at different depths, the primary depth from which plants absorb water is identified.

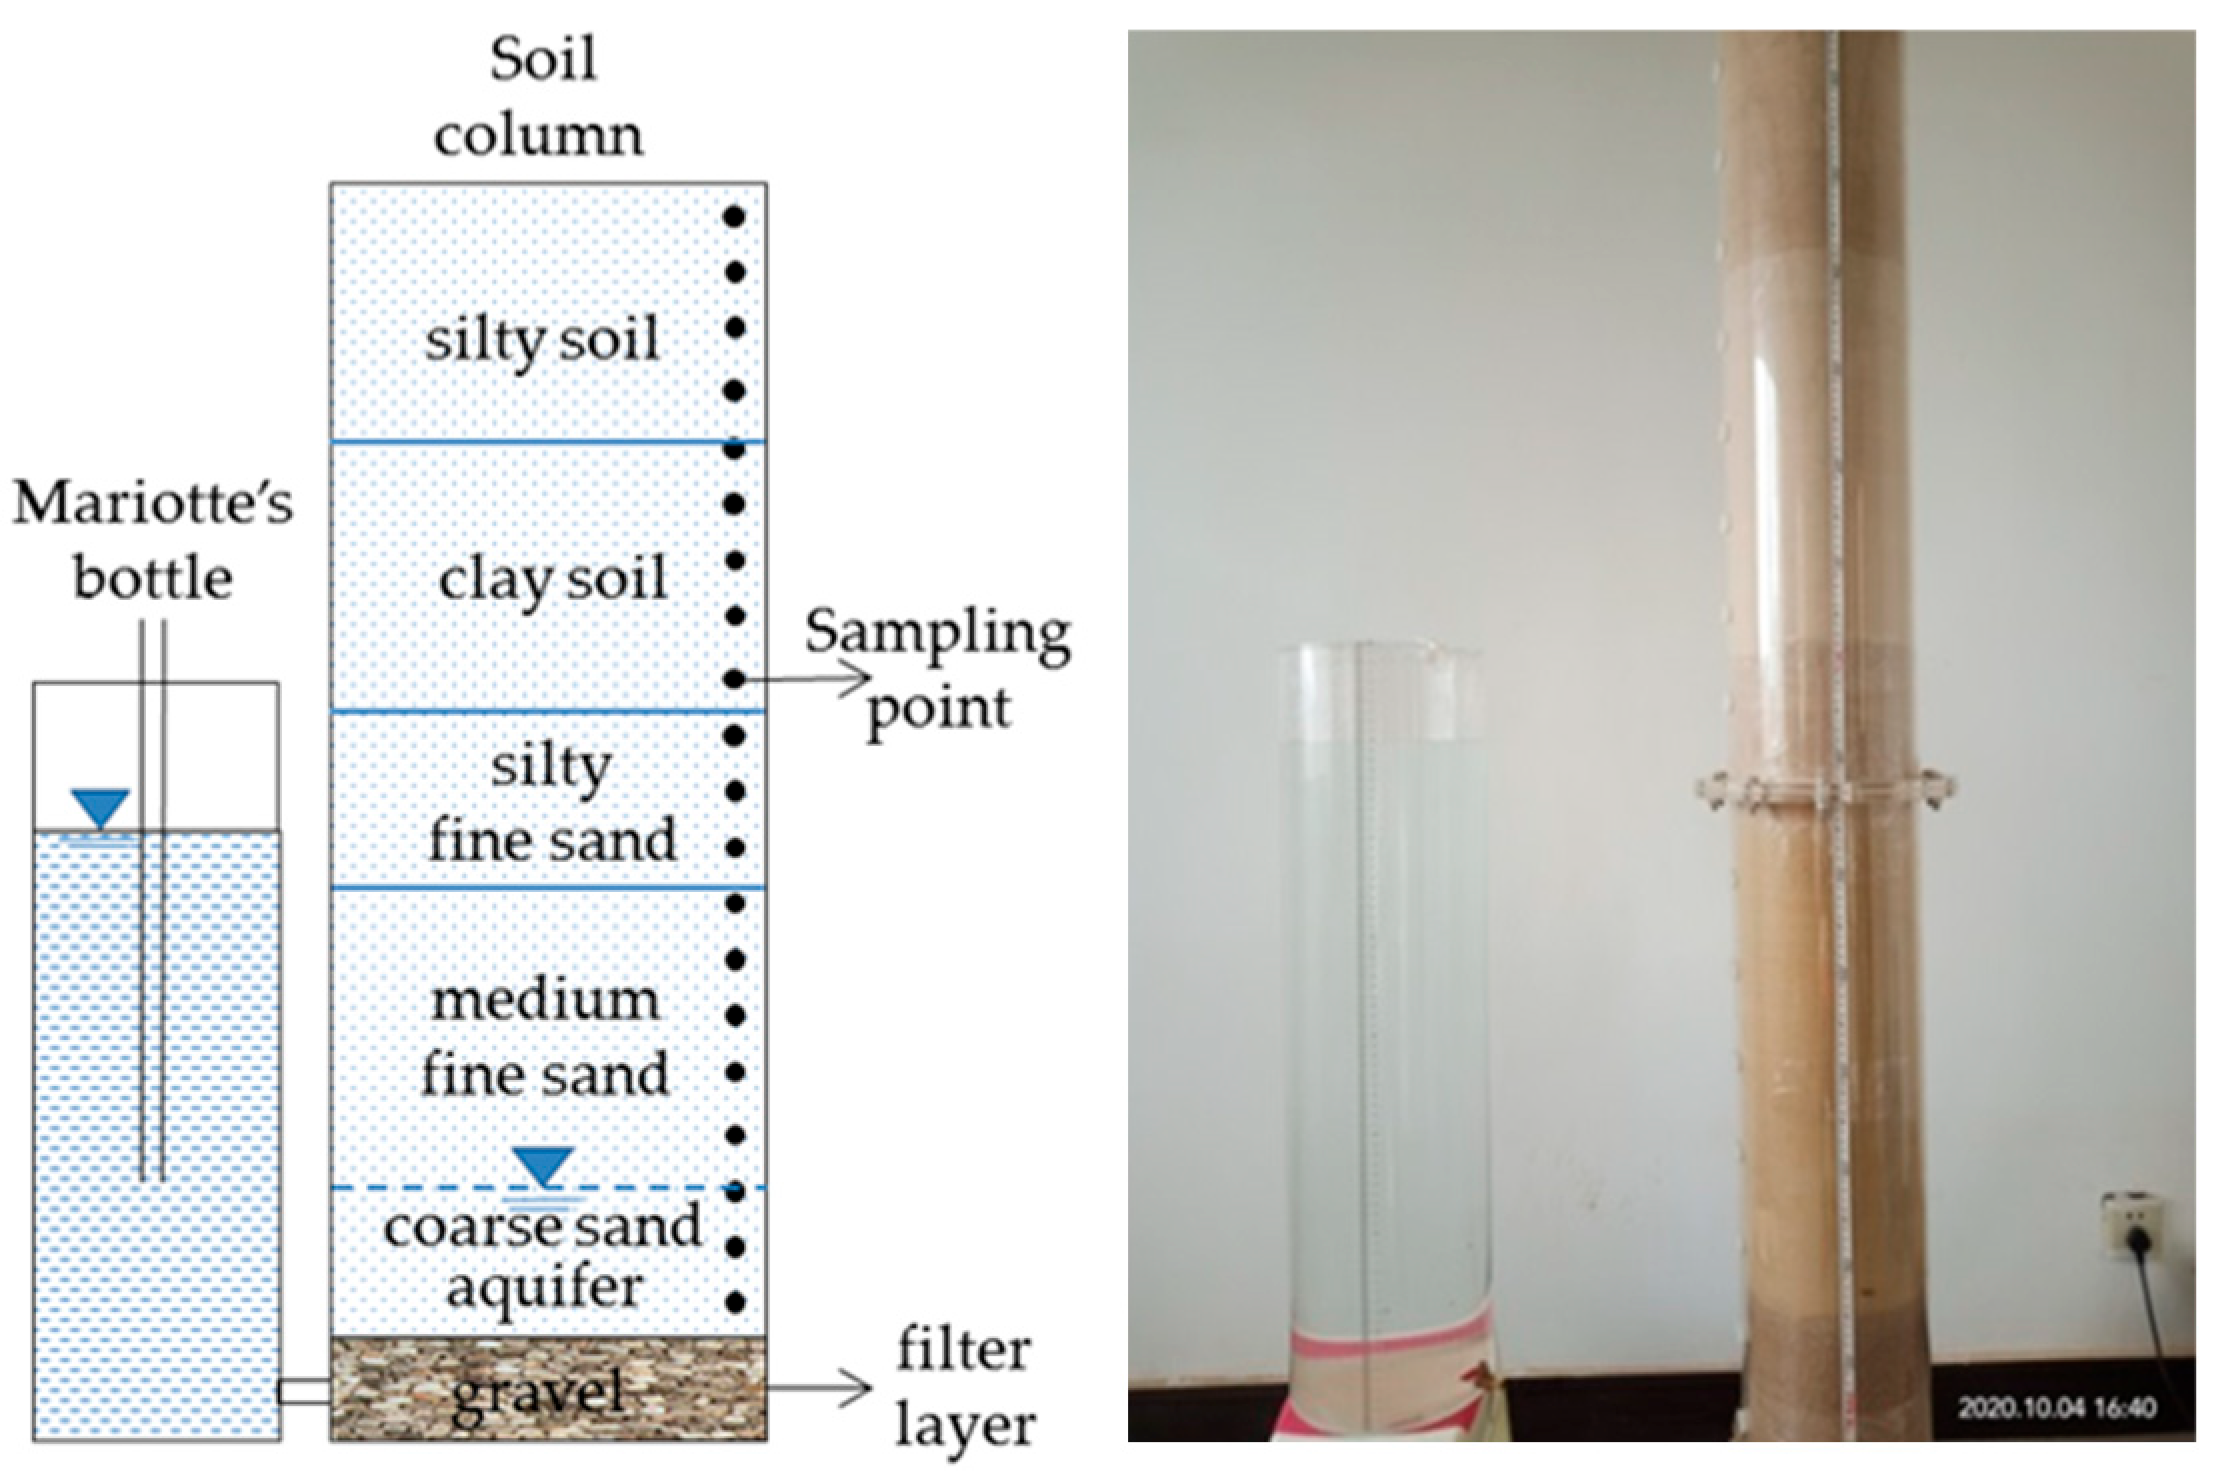
2.2.3. Soil Column Experiments and Numerical Modeling

Based on the index parameters of the lithological structure of the vadose zone in the study area obtained through detailed field surveys and in situ monitoring, an indoor soil column physical experiment simulation model was established. Additionally, numerical simulation models for different lithological structures of the vadose zone were developed using Hydrus-1D (version 4.16.0090) software. These models were used to obtain ecological effect data under various conditions, considering the coupling between groundwater and the vadose zone. The lithological structure of the soil column profile was arranged according to the results of the detailed field survey (Table 1), with the lithology from top to bottom being silty soil (40 cm), clay soil (40 cm), silty fine sand (20 cm), and medium fine sand (50 cm), with a 25 cm thick layer of coarse sand at the bottom serving as the phreatic aquifer (Figure 6). During the establishment of the physical simulation experiment model, the soil was backfilled layer by layer according to the dry bulk density of the original soil layers, with measurements taken every 5 cm. The surfaces between layers were roughened to ensure tight contact. The physical simulation experiment soil column had a height of 175 cm and an inner diameter of 20 cm. A soil moisture content Trime measuring tube was installed at the center of the experimental soil column to monitor changes in soil moisture content at different depths in real time, with measuring points spaced 10 cm apart. After backfilling the soil column, we used the Trime test to measure the moisture content of the soil column profile as the initial condition. We set the upper boundary as a fixed flow boundary with a flow rate of 0, and the lower boundary as a fixed head boundary, using a Mariotte bottle to control the water head stable at the top of the coarse sand layer.
Based on the soil column physical model, Hydrus-1D was utilized to establish a numerical simulation model for the heterogeneity of the vadose zone, followed by parameter identification, adjustment, and validation. The identified and calibrated numerical model will be used to simulate and analyze the ecological impact of different lithological structures of the vadose zone coupled with groundwater level changes on natural vegetation, further understanding the mechanism of the influence of vadose zone lithological structures on groundwater ecological functions. Based on the test data from the physical simulation experiments, the hydraulic characteristic parameters of different lithologies were identified and calibrated. The soil hydraulic parameters were fitted using the built-in modules of the Hydrus-1D model, where the residual water content was measured using the oven-drying method, the parameters for fine sand were adopted from the “sand” database within Hydrus-1D, and the parameters for other lithological soil layers were determined by fitting using the Rosetta module based on soil particle composition. Through comparative analysis between simulated and measured values, the hydraulic characteristic parameters of each lithological soil layer were gradually optimized and adjusted, ultimately leading to the optimized results shown in Table 2 and Figure 7.
Based on the parameters identified, fitted, and validated, Hydrus-1D models were established for different lithological structures of the vadose zone. In the simulation scenarios for single lithological structures of the vadose zone, four models were developed for silty fine sand, silty soil, clay soil, and fine sand, respectively, with a vadose zone thickness set to 5 m for each. In the simulation scenarios for multi-layered lithological structures of the vadose zone, four models were established for “coarse-over-fine,” “fine-over-coarse,” “fine-grained interlayer,” and “coarse-grained interlayer” conditions. Specifically, in the “coarse-over-fine” structure, the thicknesses of the upper fine sand and lower sub-clay layers were each set to 2.5 m. In the “fine-over-coarse” structure, the thicknesses of the upper clay soil and lower fine sand layers were also each set to 2.5 m. For the interlayer structures, the “interlayer” (clay soil or fine sand) thickness was set to 1.0 m, with an upper (fine sand or clay soil) soil layer thickness of 3 m and a lower (fine sand or clay soil) soil layer thickness of 1.0 m.
In the simulation study of capillary water rise height supported by groundwater in the vadose zone with different lithological structures, the initial pressure head was set to −1.5 MPa, with the upper boundary as a fixed flow boundary with a flow rate of 0, and the lower boundary as a fixed head boundary. The groundwater table depth was set to 5.0 m, and the simulation duration was 100 days. In the simulation of water release from the vadose zone with different lithological structures, the initial soil moisture content of the soil profile was set to 30%, and the initial groundwater table depth was 5 m. The upper boundary was a fixed flow boundary with a flow rate of 0, and the lower boundary was a free drainage boundary. The simulation duration for water release from the vadose zone under conditions of declining groundwater levels was set to 250 days, primarily considering the natural property of slower unsaturated water release processes in clayey soil layers.

3. Results

3.1. Characterization of Vadose Zone Heterogeneity Impacts on Natural Vegetation Ecology

The vadose zone with different lithological structures constrains the capillary rise height supported by local groundwater, directly influencing the magnitude of the extreme ecological water level in the area and the capacity to transport water to the severely water-deficient surface of the vadose zone per unit time. As shown in Figure 5, six monitoring points (V01, V02, V03, V04, V05, and V06) were established in the Qingtu Lake wetland distribution area. The lithological structures of the vadose zone at each monitoring point are significantly different, resulting in varying abilities of groundwater to supply water to the vadose zone. Consequently, there are notable differences in the types and growth states of natural vegetation at each monitoring point.
In areas with the same groundwater depth, the height of the capillary water rise determines the capacity of groundwater to supply moisture to vegetation, and the primary influencing factor is the lithological structure of the vadose zone. In regions where the vadose zone consists of coarse-grained materials, the height of capillary water rise supported by groundwater is relatively low, and the ability of natural vegetation to access groundwater is correspondingly weaker, which is detrimental to vegetation growth. Conversely, in regions where the vadose zone is composed of fine-grained materials, the height of capillary water rise is higher, and natural vegetation has a stronger ability to obtain groundwater, which facilitates vegetation growth.
Taking the V01 and V04 monitoring points in Figure 5 as examples, both have similar vadose zone thicknesses and groundwater depths. However, the vadose zone at V01 is dominated by coarse-grained materials such as gravel and sandy soil, while the vadose zone at V04 is primarily composed of fine-grained materials like loam and silt. This results in a higher capillary water rise and overall water content in the vadose zone at V04 compared to V01 (Figure 8). Consequently, the vegetation species and growth states at the two sites are vastly different. As shown in the photographs in Figure 5, the dominant species at V01 is mainly Nitraria tangutorum, with poor growth status and an overall coverage rate of 10%. In contrast, the dominant species at V04 is Reeds, which are thriving, with an overall coverage rate of about 40%.
The lithological configuration of the vadose zone exerts a notable influence on the depth of vegetation root system development, ultimately shaping disparities in water utilization among root systems. At the V02 and V03 monitoring stations, despite both being inhabited by reeds, the range and density of root development vary markedly due to variations in vadose zone thickness and lithology. These differences directly contribute to significant variations in the growth states of the reeds (as illustrated in Figure 5).
Examination of Figure 9 reveals that the vadose zone at the V02 monitoring station is relatively thick, spanning 155 cm, with reeds’ roots predominantly distributed within depth ranges of 0–60 cm and 90–120 cm. Conversely, the vadose zone at the V03 monitoring station is thinner, measuring only 92 cm, with reeds’ roots concentrated primarily within the 0–60 cm depth range. Notably, although the roots of reeds are present within the 0–60 cm depth range at both stations, the average root density at V03, characterized by a vadose zone dominated by loam soil, reaches an impressive 10 cm/cm3. In contrast, at V02, where the vadose zone is predominantly composed of sandy soil, the average root density within the same depth range is merely 0.41 cm/cm3, yielding a striking difference in root density between the two stations of approximately 25-fold.
This observation underscores that even for identical vegetation types, variations in the lithological configuration of the vadose zone can induce notable differences in root system distribution and growth characteristics, which subsequently impact the vegetation’s water utilization strategies.
Furthermore, seasonal fluctuations in groundwater levels result in variations in the soil moisture deficit conditions within the vadose zone, which, in turn, alter the water demands of vegetation under drought stress conditions. Consequently, notable differences emerge in the water sources utilized by natural vegetation. To investigate this, hydrogen and oxygen isotope analysis was conducted on xylem samples collected from typical vegetation communities located in areas with water table depths exceeding 3.0 m within the study region. The isotopic composition characteristics of these samples were then analyzed (Figure 10). The findings indicate that both plant species and habitat play pivotal roles in determining the sources of water utilized by plants. Specifically, different vegetation types exhibit distinct preferences for water sources, and even within the same vegetation type, variations in water source utilization are observed across different seasons.
Figure 11 presents an analysis of the contribution proportions of potential water sources for a particular vegetation type during spring and summer. The results reveal that in spring, the proportions of water absorbed by roots from the soil layers ranging from 0 to 30 cm, 30 to 80 cm, and 80 cm to the water table beneath the surface are 22.16%, 42.84%, and 33.64%, respectively, with groundwater contributing only 1.35%. In contrast, during summer, these proportions shift to 12.15%, 28.09%, 56.92%, and 2.85% for the same soil depth intervals.
This phenomenon can be attributed to the shallow groundwater depth in spring, where root water absorption is predominantly governed by root distribution, with a concentration of water absorption in soil layers with higher root density. However, as the groundwater depth increases in summer, the water absorption layer of the roots shifts downwards, and the dominant influence of root distribution on plant water absorption gradually diminishes. Consequently, the contribution of each soil layer to root water absorption evolves over time. In summary, as the groundwater depth increases, the contribution of lower soil layers to root water absorption progressively increases. Plants utilize water from diverse sources across different seasons, with the water absorption layer extending downwards in summer, when groundwater levels are lower, compared to spring, when groundwater levels are higher.

3.2. Mechanisms of Vadose Zone Heterogeneity Impacts on Natural Vegetation Ecology

3.2.1. Ecological Response Mechanisms of Natural Vegetation to Homogeneous Lithological Structures

During groundwater rise simulation experiments, systematic comparisons of capillary water migration characteristics in homogeneous vadose zones composed of four typical lithologies—silty fine sand, silty soil, clay soil, and fine sand—were conducted. The results revealed that fine-grained vadose zones exhibit significantly higher maximum capillary rise heights and groundwater recharge volumes via capillary action, thereby providing more efficient water supply to surface vegetation.
As shown in Figure 12, the maximum capillary rise height in fine-grained media is notably greater than that in coarse-grained media. For instance, the clay soil vadose zone achieves a maximum capillary rise height of approximately 480 cm, representing a 320% increase compared to the fine sand layer (≈150 cm). Furthermore, the cumulative capillary water supply in clay soil (≈92 cm) is 418% higher than that in fine sand (≈22 cm). From the perspective of phreatic-supported capillary rise, the ability of homogeneous vadose zones to sustain surface vegetation decreases in the following order: clay soil > silty soil > silty- fine sand > fine sand.
Figure 13 illustrates vertical soil moisture distributions. The clay soil vadose zone maintains relatively high soil moisture contents (≈23–32%) from the groundwater table to the surface. In contrast, the fine sand vadose zone only sustains ≈20% moisture within 40 cm above the water table, with a rapid decline in moisture content as elevation increases. At a height of 150 cm above the groundwater table, the soil moisture content in fine sand decreases to below 10%.
These findings demonstrate that fine-grained vadose zones can maintain higher capillary rise heights and soil moisture contents during drought periods, providing more stable water supply to vegetation root zones. Such differences in hydrogeological properties directly regulate the water transmission capacity of the vadose zone-vegetation system, offering critical hydrogeological constraints for ecological restoration in arid regions.
During the groundwater drainage experiments, all single-lithology vadose zones exhibited identical initial total water-holding capacities. As groundwater levels declined, the water-holding capacities of all vadose zones demonstrated a two-stage pattern of “rapid release followed by slow equilibrium” (Figure 14). Specifically, total water-holding capacities decreased sharply within the first 20 days across all lithologies, followed by a gradual release phase that stabilized after 50 days. Post-release total water-holding capacity was significantly higher in the fine-grained loam (1130.0 mm) compared to the coarse-grained fine sand (666.7 mm).
By integrating wilting moisture contents for each lithology, we calculated wilting water content, post-release water-holding capacity after 50 days, and effective water-holding capacity for different vadose zones (Table 3). Despite substantial reductions in water-holding capacities under significant groundwater drawdown, effective water-holding capacities remained relatively high across all lithologies (544.7–696.8 mm), sufficient to meet basic water demands of natural vegetation in arid regions (e.g., water consumption of Haloxylon ammodendron communities under optimal ecological water levels is 279 mm). Notably, the disparity in effective water-holding capacities between coarse- and fine-grained lithologies narrowed post-release (fine sand: 544.7 mm vs. loam: 664 mm), indicating that coarse-grained media optimized water use efficiency through gravitational drainage (fine sand effective water-holding capacity proportion: 81.7% vs. loam: 58.76%).
These findings demonstrate that even under substantial groundwater drawdown, pre-established capillary fringe water can still meet the basic ecological needs of natural vegetation in arid regions, exerting positive ecological effects of groundwater. While fine-grained lithologies retain more effective water, coarse-grained lithologies exhibit higher water use efficiency. Under different groundwater level dynamics, single-lithology vadose zones exhibited varying impacts on groundwater ecological functions. During groundwater level recovery, fine-grained lithologies demonstrated superior capillary water ascent rates and heights compared to coarse-grained lithologies, showcasing stronger ecological functionality. Conversely, during significant groundwater drawdown, while the fine-grained clay soil retained the highest total water-holding capacity, the medium-grained silty soil exhibited the highest effective water-holding capacity, indicating enhanced ecological functionality.

3.2.2. Ecological Response Mechanisms of Natural Vegetation to Stratified Lithological Structures

During groundwater rise simulation experiments, a comparative study of capillary water migration characteristics in layered lithological strata with typical vadose zone lithologies in the study area revealed that the maximum capillary water ascent height and groundwater recharge volume via capillary action were significantly greater in the “coarse-over-fine” structure than in the “fine-over-coarse” structure.
As shown in Figure 15, the maximum capillary water ascent height in the “coarse-over-fine” vadose zone was approximately 320 cm, with a groundwater recharge volume via capillary action of about 55 cm. In contrast, the “fine-over-coarse” vadose zone exhibited a maximum capillary water ascent height of approximately 170 cm and a groundwater recharge volume of about 22 cm. Under conditions of maintaining soil profile moisture content, the “coarse-over-fine” vadose zone maintained a moisture content greater than 25% up to a height of 250 cm above the groundwater level. However, in the “fine-over-coarse” vadose zone, moisture content rapidly declined above the groundwater level, dropping below 15% at a distance of 50 cm from the water table (Figure 16).
With identical lithologies but swapped upper and lower layers, water migration characteristics differed significantly. The maximum capillary water ascent height and groundwater recharge volume via capillary action in the “coarse-over-fine” structure were 1.88 times and 2.5 times those of the “fine-over-coarse” structure, respectively. It is noteworthy that in the “fine-over-coarse” structure, the maximum capillary water ascent height (200 cm) was 15 cm higher than that of the single-lithology fine sand (185 cm), indicating that the overlying fine-grained clay soil exerted a certain influence on the underlying fine sand, thereby improving groundwater ecological functions to a certain extent.
A comparison of water migration characteristics between the two different interlayer structures revealed that the maximum capillary water ascent heights were similar for the fine-grained interlayer (250 cm) and the coarse-grained interlayer (260 cm). However, the cumulative groundwater supply to the profiles differed, with the fine-grained interlayer (38.31 cm) demonstrating significantly greater cumulative water supply than the coarse-grained interlayer (29.75 cm). Therefore, the fine-grained interlayer structure exhibited stronger water supply capacity and enhanced groundwater ecological functions.
A comparison between homogeneous lithologies and interlayer structures revealed that the supported capillary water ascent height (250 cm) in the “fine-grained interlayer” vadose zone was significantly greater than that in the homogeneous fine sand vadose zone (150 cm), indicating that the “fine-grained interlayer” structure enhances groundwater ecological functionality mechanisms. Conversely, the “coarse-grained interlayer” vadose zone exhibited the opposite effect, with a supported capillary water ascent height (260 cm) significantly lower than that of the homogeneous loam vadose zone (480 cm). As shown in Figure 16, the presence of interlayers resulted in discontinuous moisture content distribution in the vadose zone profile. In the “fine-grained interlayer” vadose zone, during water migration from the underlying coarse-grained fine sand to the intermediate fine-grained clay soil interlayer, moisture content abruptly increased from 12% to 30%. In contrast, in the “coarse-grained interlayer” vadose zone, during water migration from the underlying fine-grained clay soil to the intermediate coarse-grained interlayer, moisture content sharply decreased from 30% to 10%.
During groundwater drainage experiments, the initial total water-holding capacity was identical across all layered vadose zone structures. As the water level dropped, similar to homogeneous lithologies, the water-holding capacity of each lithology exhibited a two-phase characteristic of “rapid drainage followed by slow equilibrium” (Figure 17). Combining wilting moisture content data for each lithology, we calculated wilting moisture content, water-holding capacity after 50 days of drainage, and effective water-holding capacity for different lithologies, as shown in Table 4.
Table 4 reveals that the initial water-holding capacity and wilting moisture content were the same for both “coarse over fine” and “fine over coarse” structured vadose zones. After 50 days of groundwater level decline and drainage, the effective water-holding capacity of the “fine over coarse” structured vadose zone was 735.7 mm, greater than the 567.4 mm of the “coarse over fine” structure. Comparing “coarse-grained interlayer” and “fine-grained interlayer” structures, after 50 days of drainage, the effective water-holding capacity of the “coarse-grained interlayer” vadose zone was 749.6 mm, greater than the 621.6 mm of the “fine-grained interlayer”.
In terms of the ratio of effective water-holding capacity to total water-holding capacity, the “fine-grained interlayer” structured vadose zone had the highest ratio, reaching 76.51%, followed by the “fine over coarse” structured vadose zone at 71.45%, and the “coarse over fine” structured vadose zone at 65.87%, which was significantly lower than that of the “fine over coarse” structure. The “coarse-grained interlayer” structured vadose zone had the lowest ratio at 65.36%.
Comparing homogeneous lithology structures with multi-layered lithology structures, after 50 days of drainage, the effective water-holding capacity of multi-layered lithology structured vadose zones was generally greater than that of homogeneous lithology structures. For example, the effective water-holding capacity of the fine-grained interlayer was 621.6 mm, greater than that of the fine sand lithology (544.7 mm). The effective water-holding capacity of the coarse-grained interlayer was 749.6 mm, greater than that of the loam lithology (664.0 mm). Therefore, regardless of interlayer lithology, compared with the corresponding homogeneous lithology, the presence of interlayers increased the effective water-holding capacity of the vadose zone profile.
Under dynamic changes in groundwater levels, although homogeneous clay soil had the highest capillary water ascent height, multi-layered lithology structures were overall superior to homogeneous lithology structures in terms of water migration and water volume maintenance. Especially under conditions of significant groundwater level decline, the “coarse-grained interlayer” and “fine over coarse” structured vadose zones had advantages in effective water-holding capacity, benefiting the maintenance of natural vegetation ecology in arid regions.

4. Discussion

The lithological structure of the vadose zone has a significant impact on groundwater ecological functions. In homogeneous lithological structures of the vadose zone, particle size determines the capillary rise height supported by groundwater and the effective water-holding capacity of the soil, thereby influencing groundwater ecological functions. Finer particles support greater capillary rise heights and have larger water-holding capacities. However, due to their higher wilting moisture content, the effective water-holding capacity of fine-grained lithologies is not the highest. Conversely, medium-grained lithologies, despite not having the largest water-holding capacity, have the highest effective water-holding capacity due to their lower wilting moisture content. As can be seen from the soil moisture characteristic curve (Figure 18), for the same moisture content, finer lithological particles require greater suction. Therefore, fine-grained clay soils have a higher suction for water, making it less accessible to vegetation. In contrast, medium-grained silty soil, with higher sand and silt content and coarser particles, while having relatively less total water-holding capacity, has lower suction, allowing more water to be available for vegetation absorption. Coarse-grained lithologies dominated by silty fine sand and fine sand particles have the lowest water-holding capacity due to their large particle size and inability to retain water.
In different structures of the vadose zone, whether it is a coarse over fine structure, a fine over coarse structure, or interlayer structures of different textures, the reason for their different groundwater ecological functions lies in the changes in suction that occur when water passes through the interface of coarse and fine lithologies. When groundwater moves from bottom to top, due to the greater suction of fine particles, the movement of water from fine to coarse particles slows down, while the movement of water from coarse to fine particles accelerates. When groundwater moves from top to bottom, due to the greater suction of fine particles and their poorer permeability, the movement of water from fine to coarse particles or from coarse to fine particles slows down, thereby enhancing the retardation effect of water release in the vadose zone. This allows the effective water held in the vadose zone to supply surface vegetation for survival over a period of time, continuing to exert the ecological functions of groundwater [25].
It should be noted that the simulation results of the above different combination structures of the vadose zone are only for the set structural scenarios. Due to differences in the thickness of rock layers, lithology, thickness, position, and number of interlayers in different vadose zone structures, their capillary rise heights and water-holding capacities also differ, which will have different impacts on groundwater ecological functions.

5. Conclusions

This paper investigates the influence of vadose zone heterogeneity on the growth status, root development characteristics, and water utilization patterns of natural vegetation. By analyzing the impact mechanisms of different vadose zone lithological structures on the ecological effects of natural vegetation, the following conclusions are drawn:
(1)
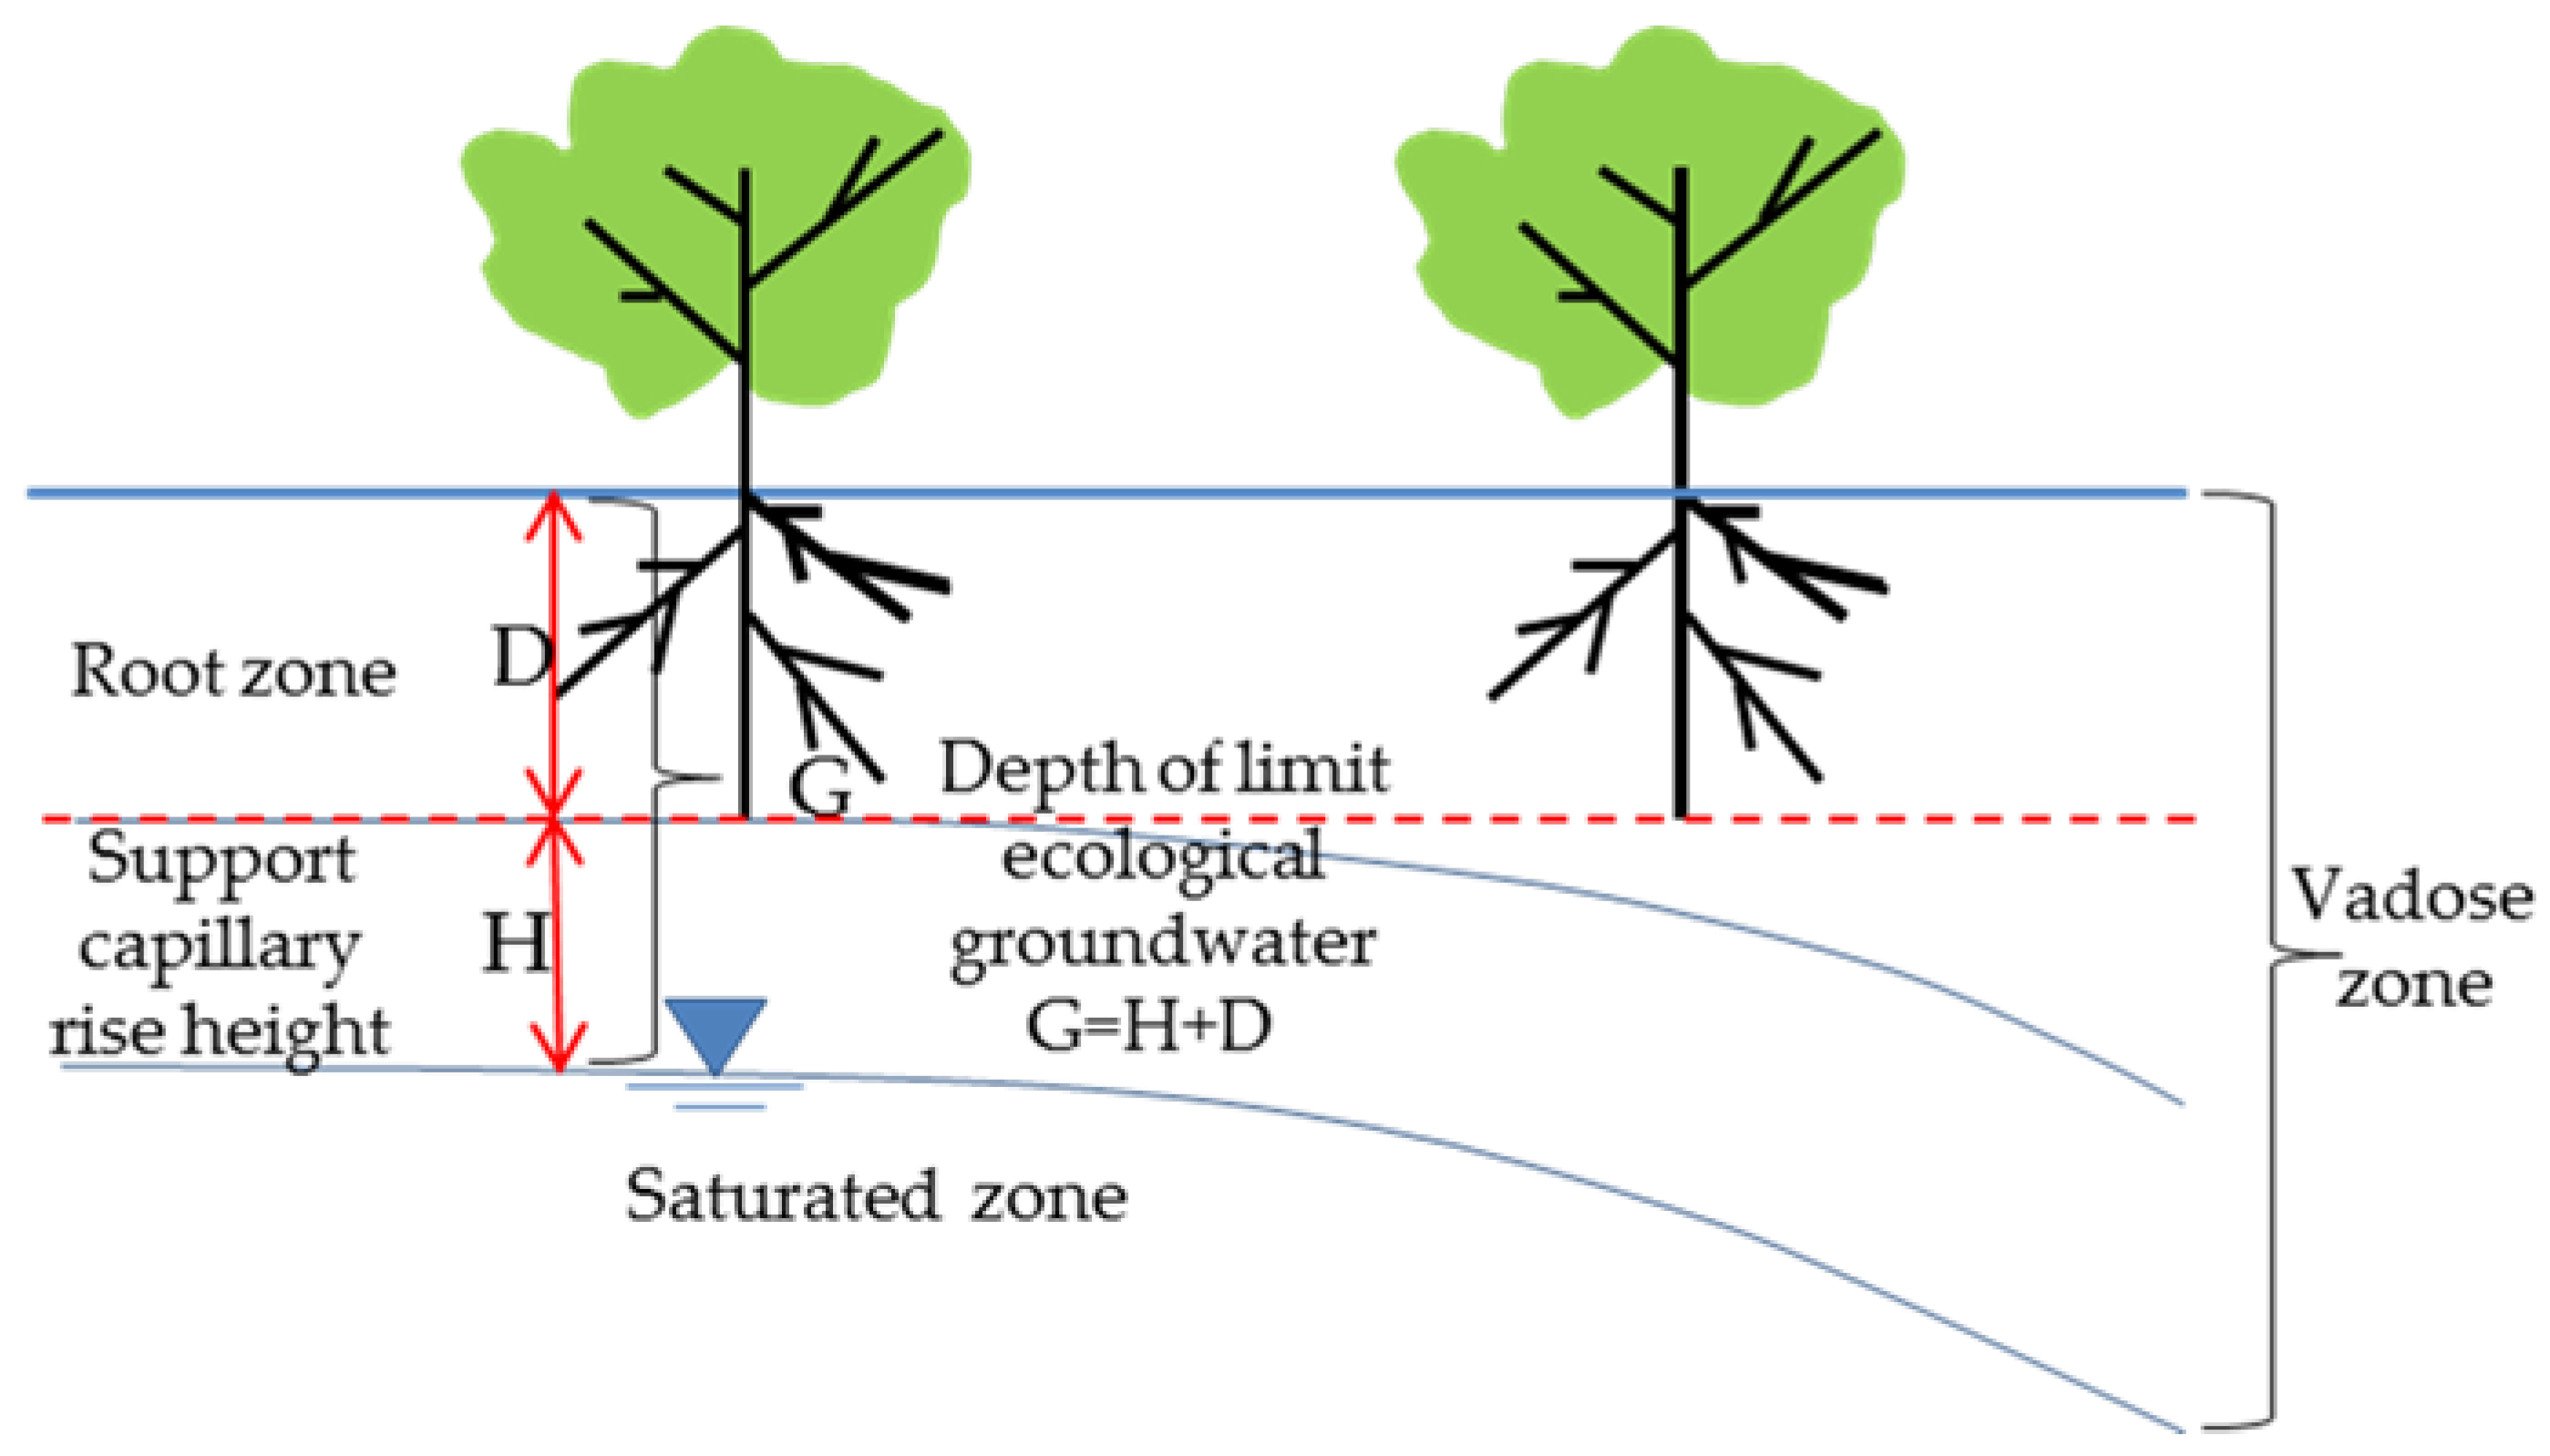
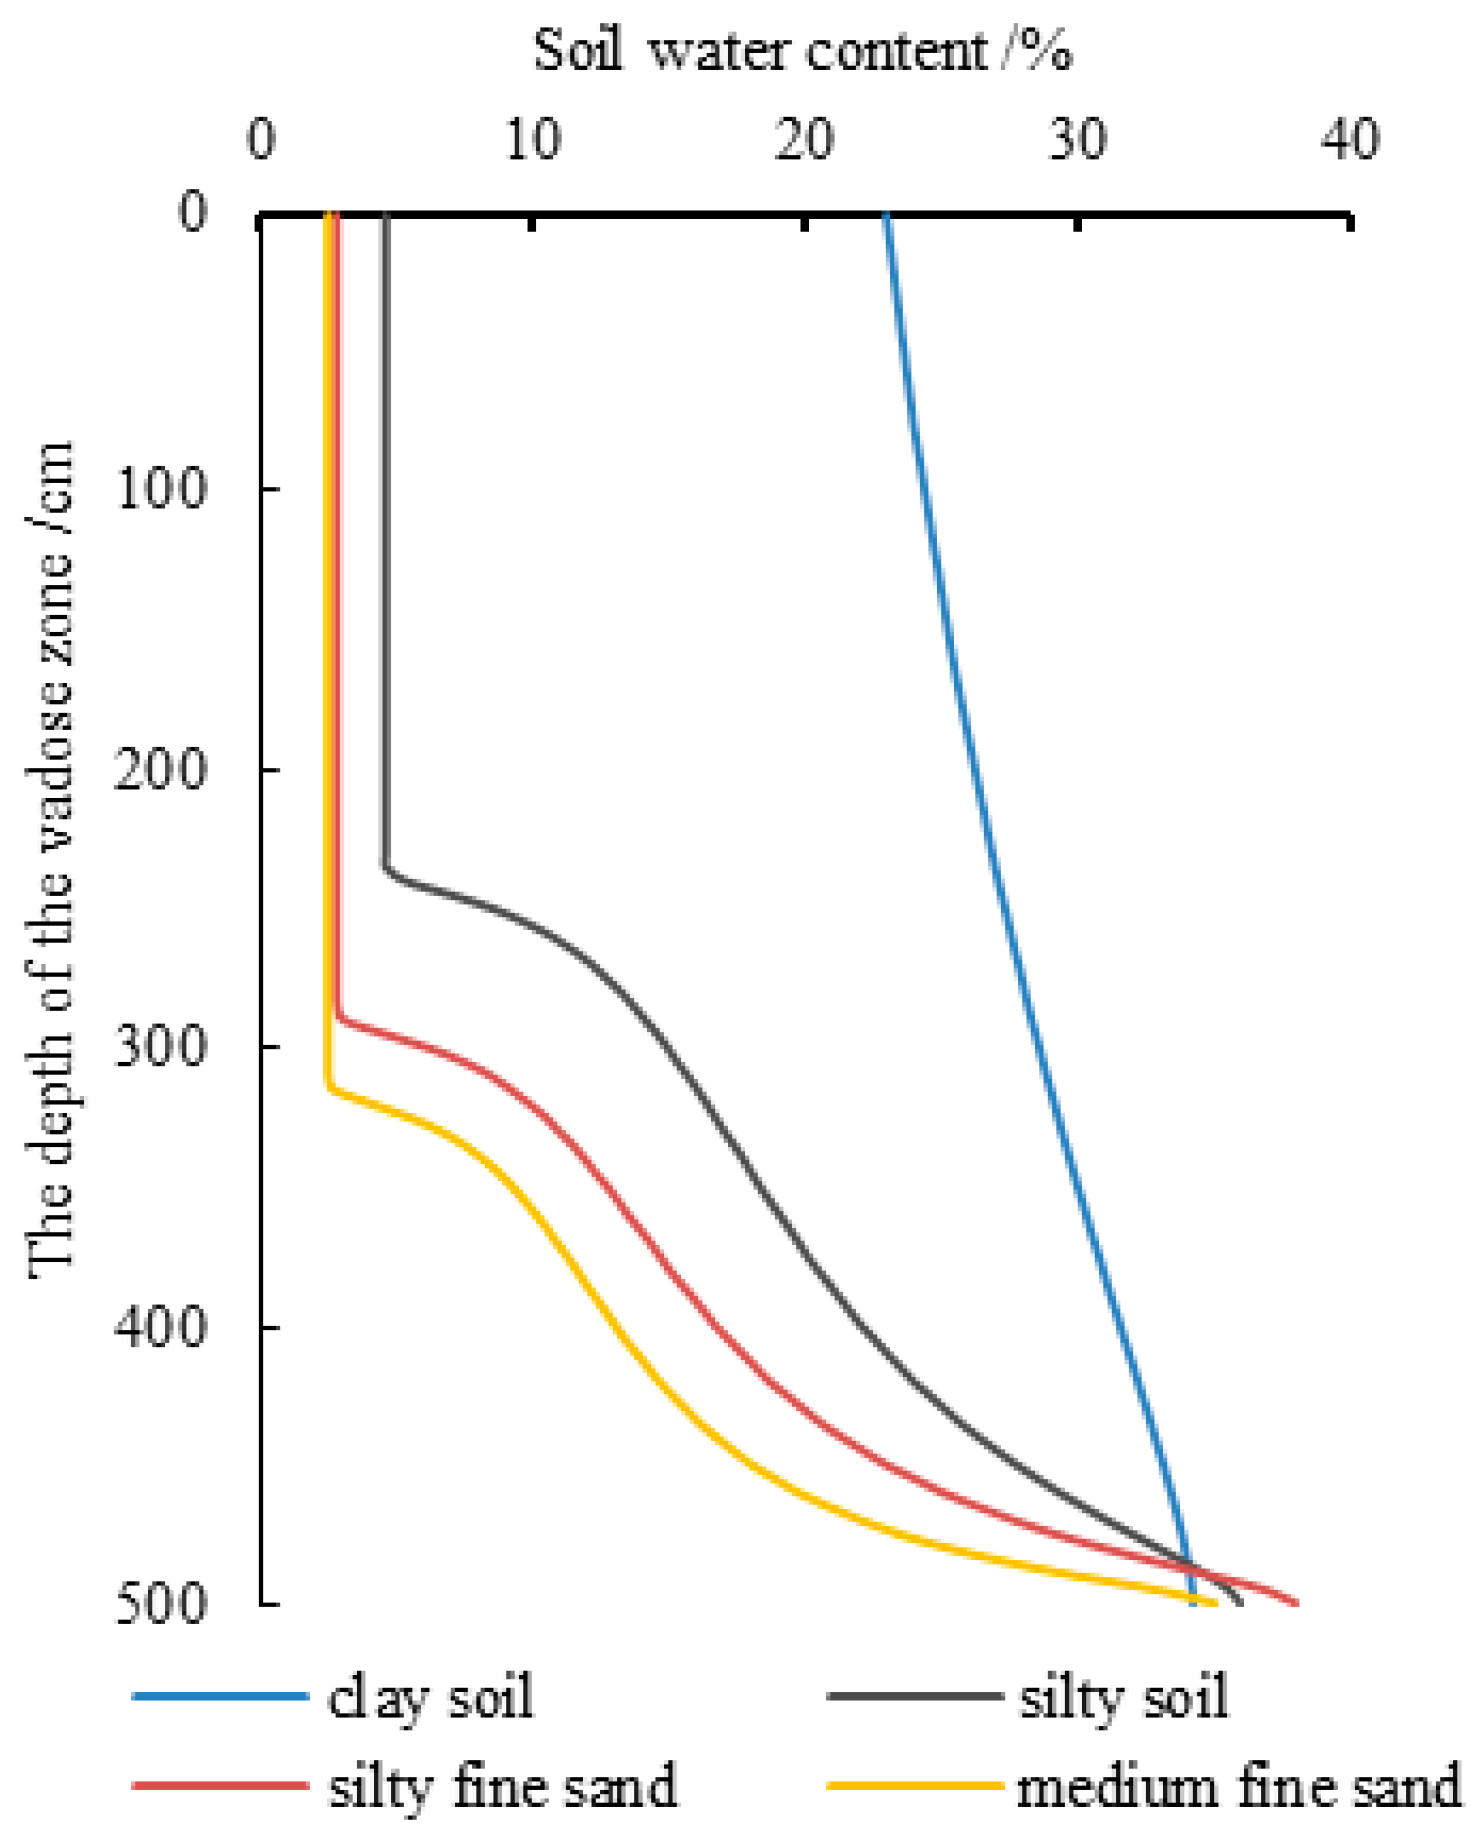
The vadose zone has a significant impact on the ability to supply water to the root zone of natural vegetation and the depth of root development, resulting in different growth statuses of natural vegetation under different lithological structures of the vadose zone. When the groundwater depth is similar, if the vadose zone has a fine texture, it has a strong water-holding capacity, a greater capillary rise height, and higher soil moisture content, making it easier for surface vegetation to obtain water and grow relatively well.
(2)
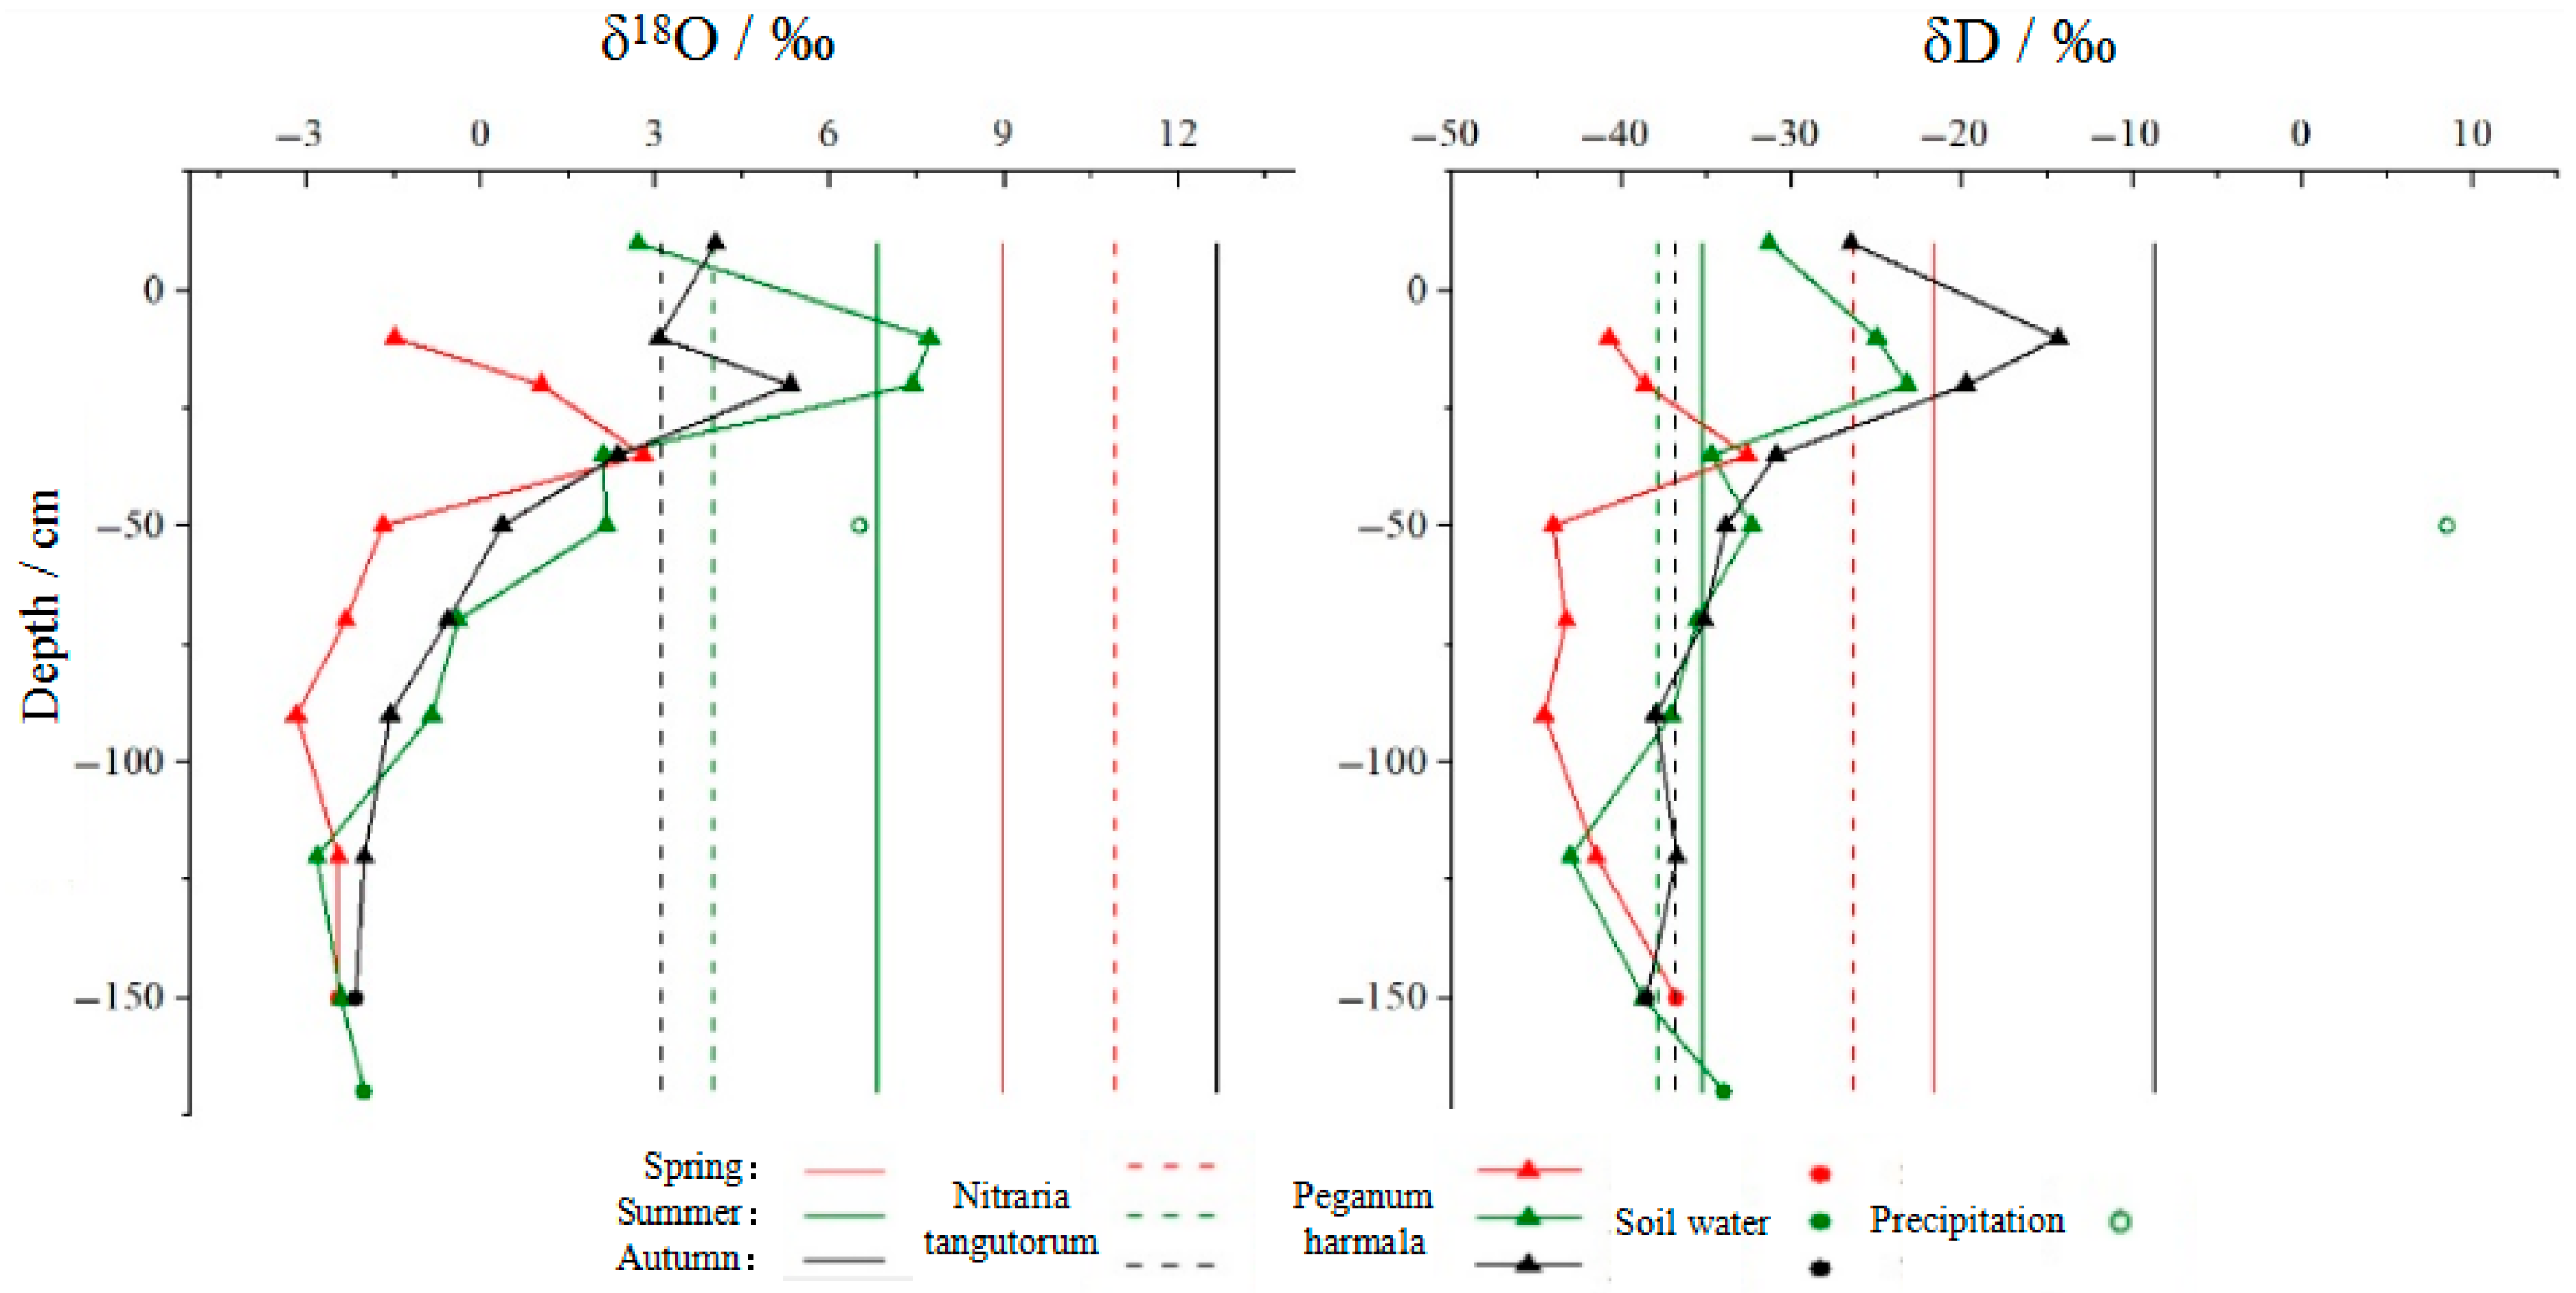
The root development depth of vegetation in the same community may vary under different lithological structures of the vadose zone. Moreover, within the same root development depth range, vegetation communities may experience different soil moisture deficit conditions at different times due to differences in the lithological structure of the vadose zone, resulting in different water requirements for vegetation under drought stress and different sources of water utilization for natural vegetation.
(3)
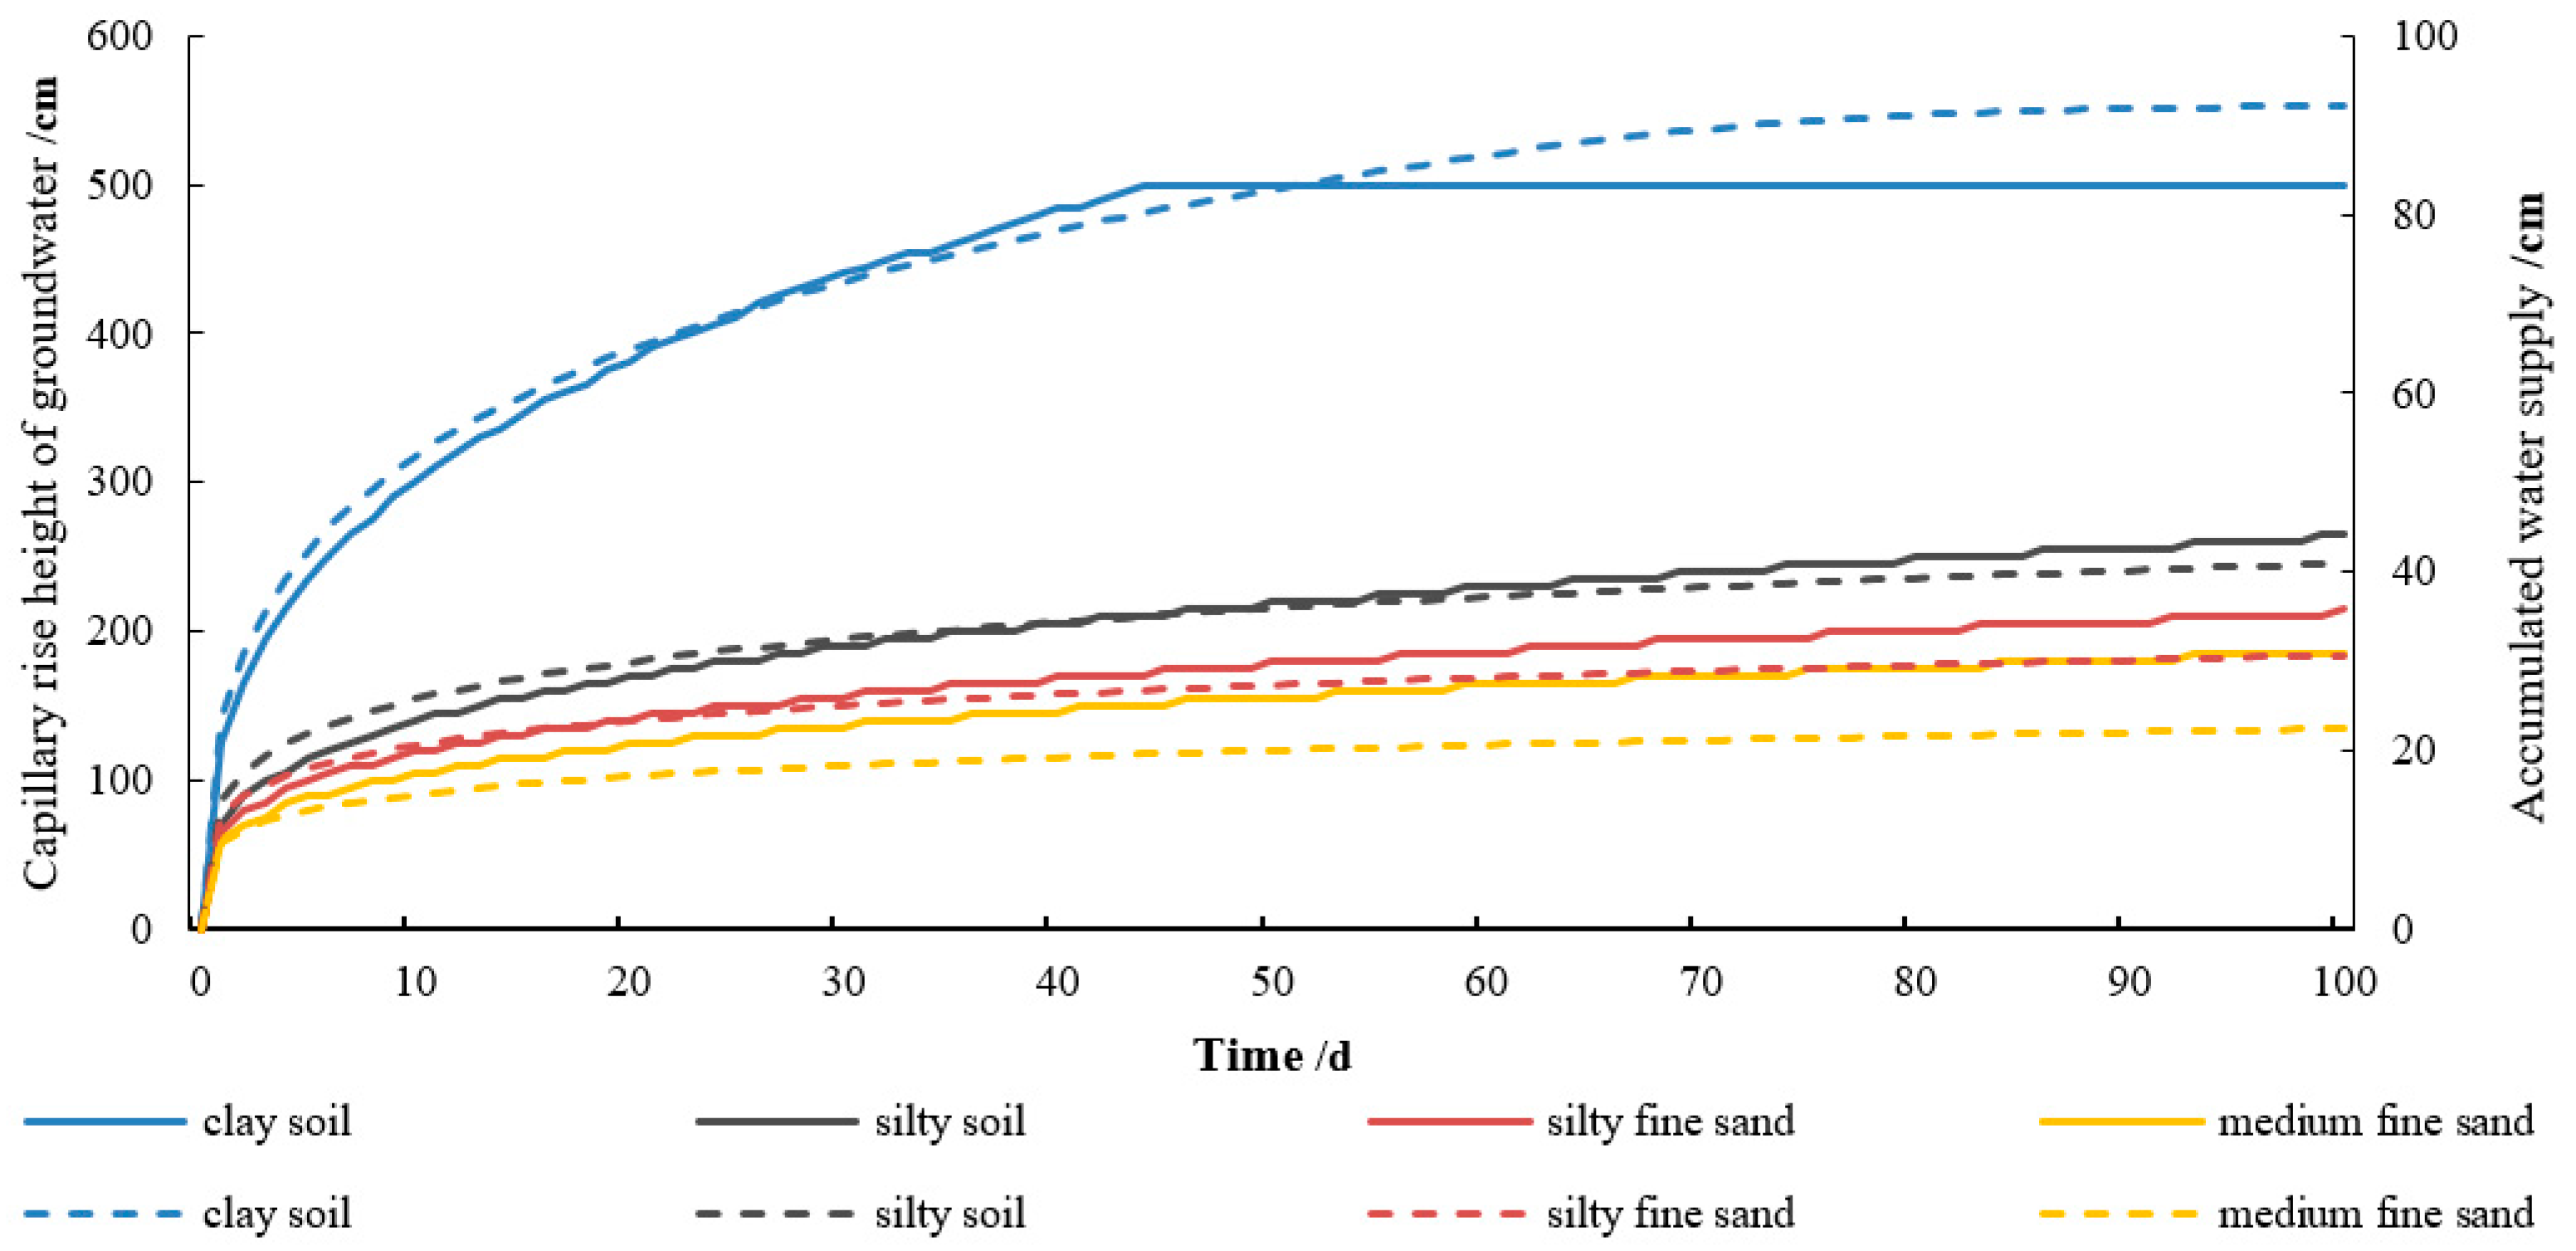
When groundwater levels gradually recover and rise, under the same vegetation conditions, different lithological structures of the vadose zone support different capillary water rise heights and speeds, thereby having different impacts on groundwater ecological functions. The finer the lithological particles, the greater the capillary water rise height and speed, and the faster and more abundant the soil obtains groundwater recharge, which is more beneficial to the growth of surface vegetation. The supported capillary rise height of different lithological structure combinations is more complex and varies with lithological thickness, position, and number of layers.
(4)
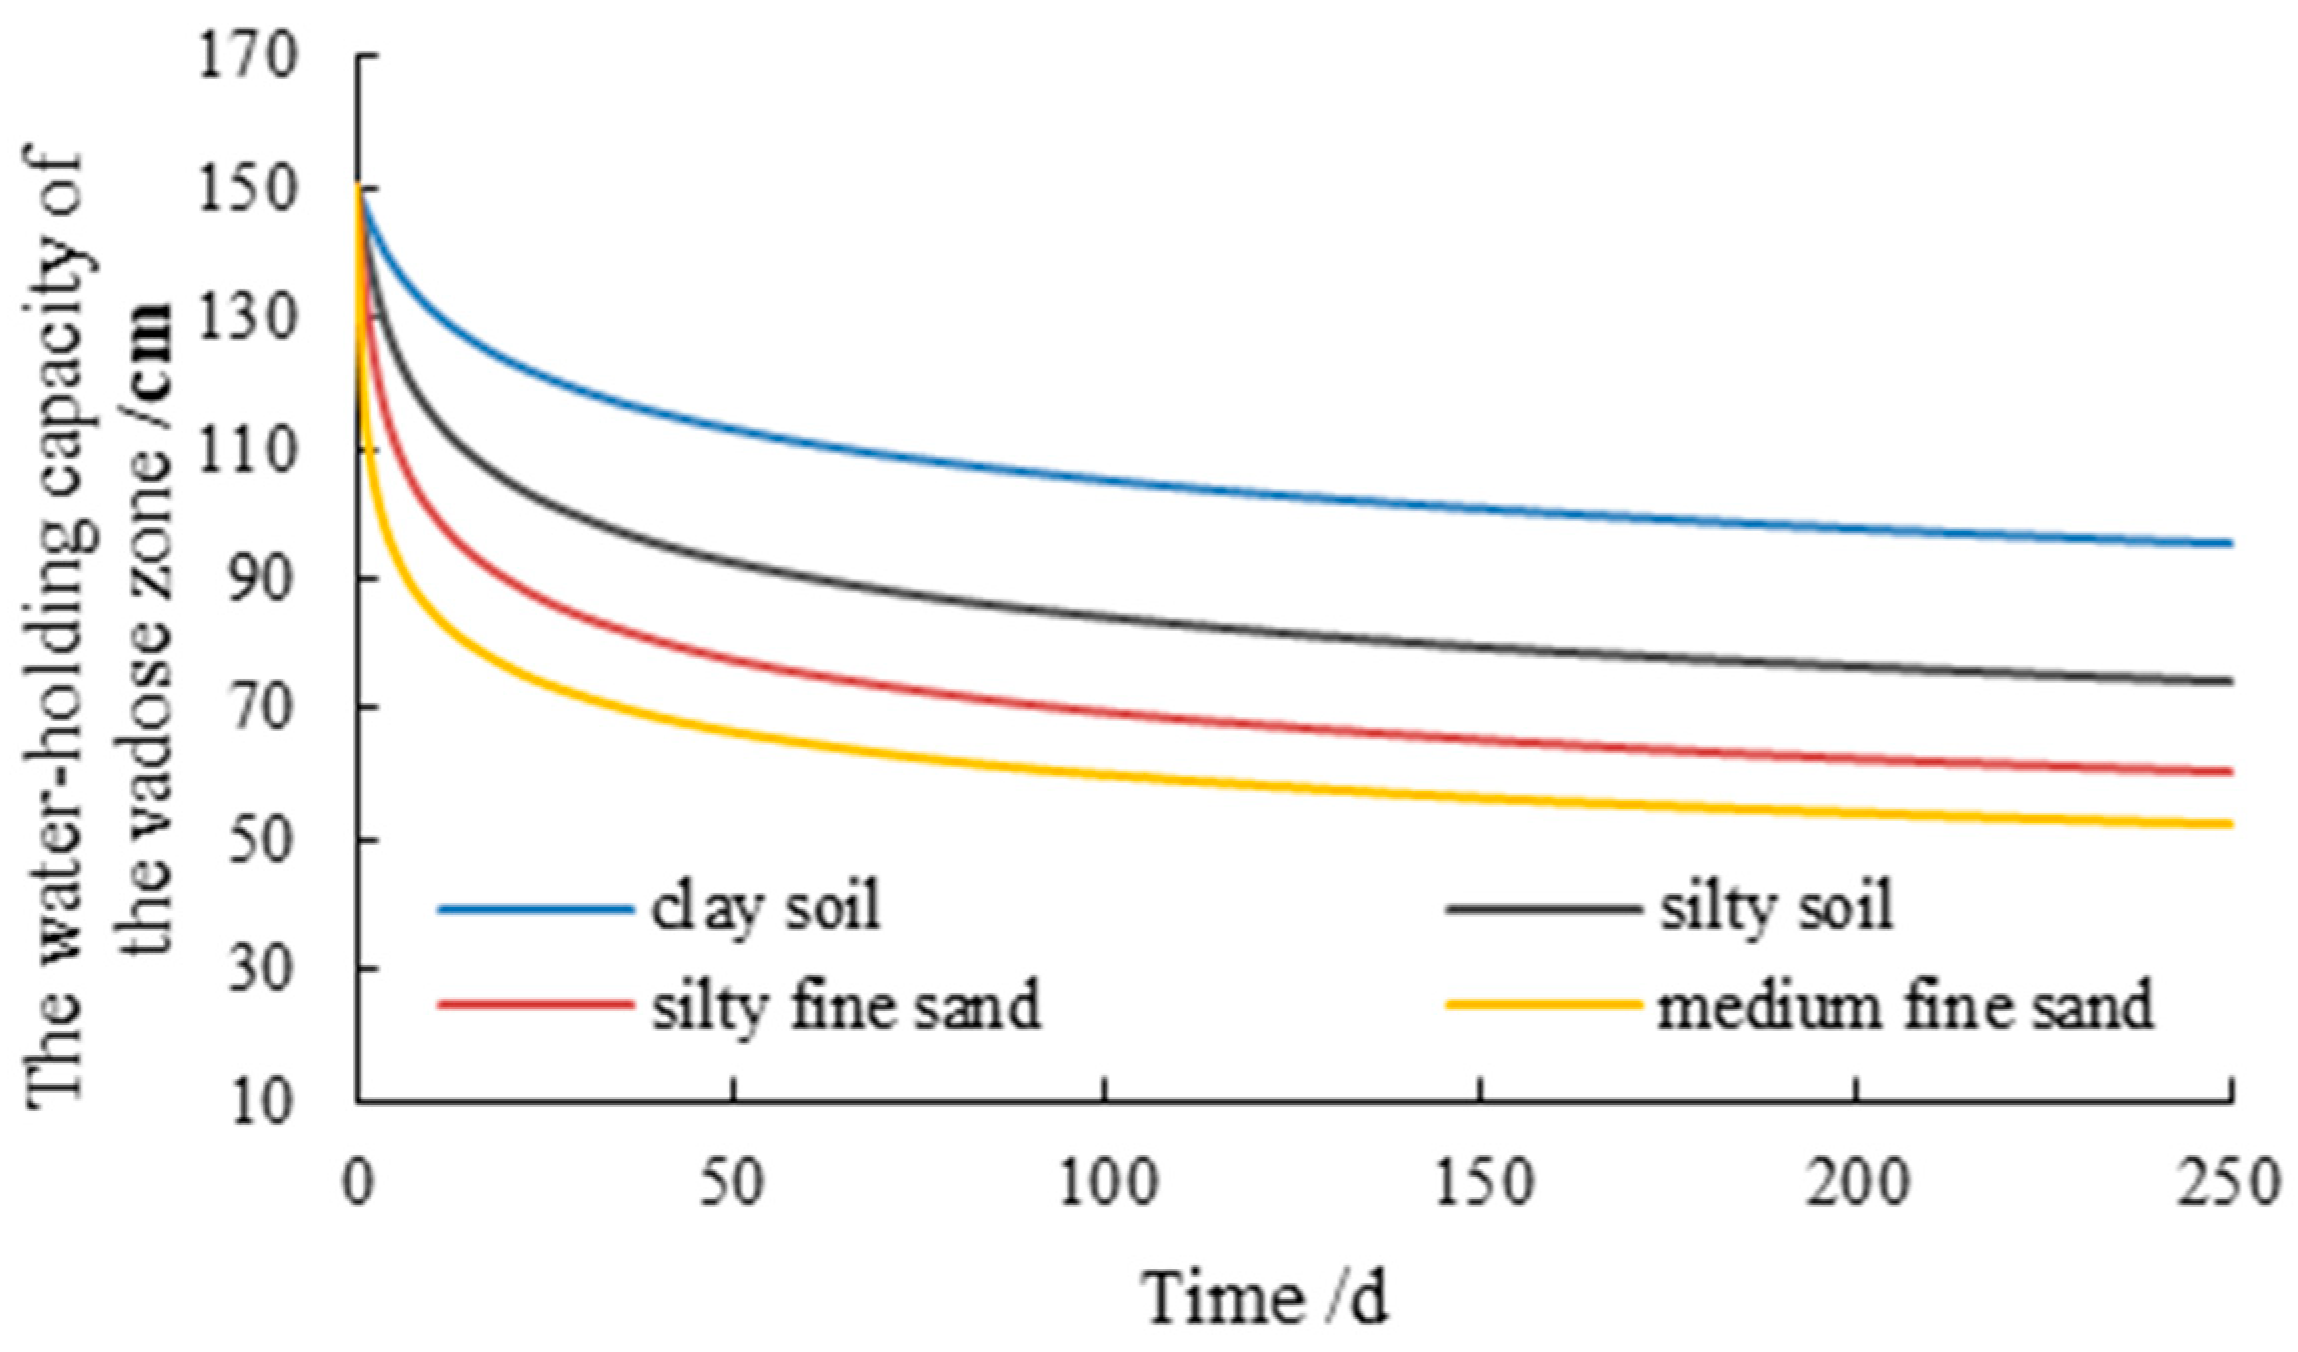
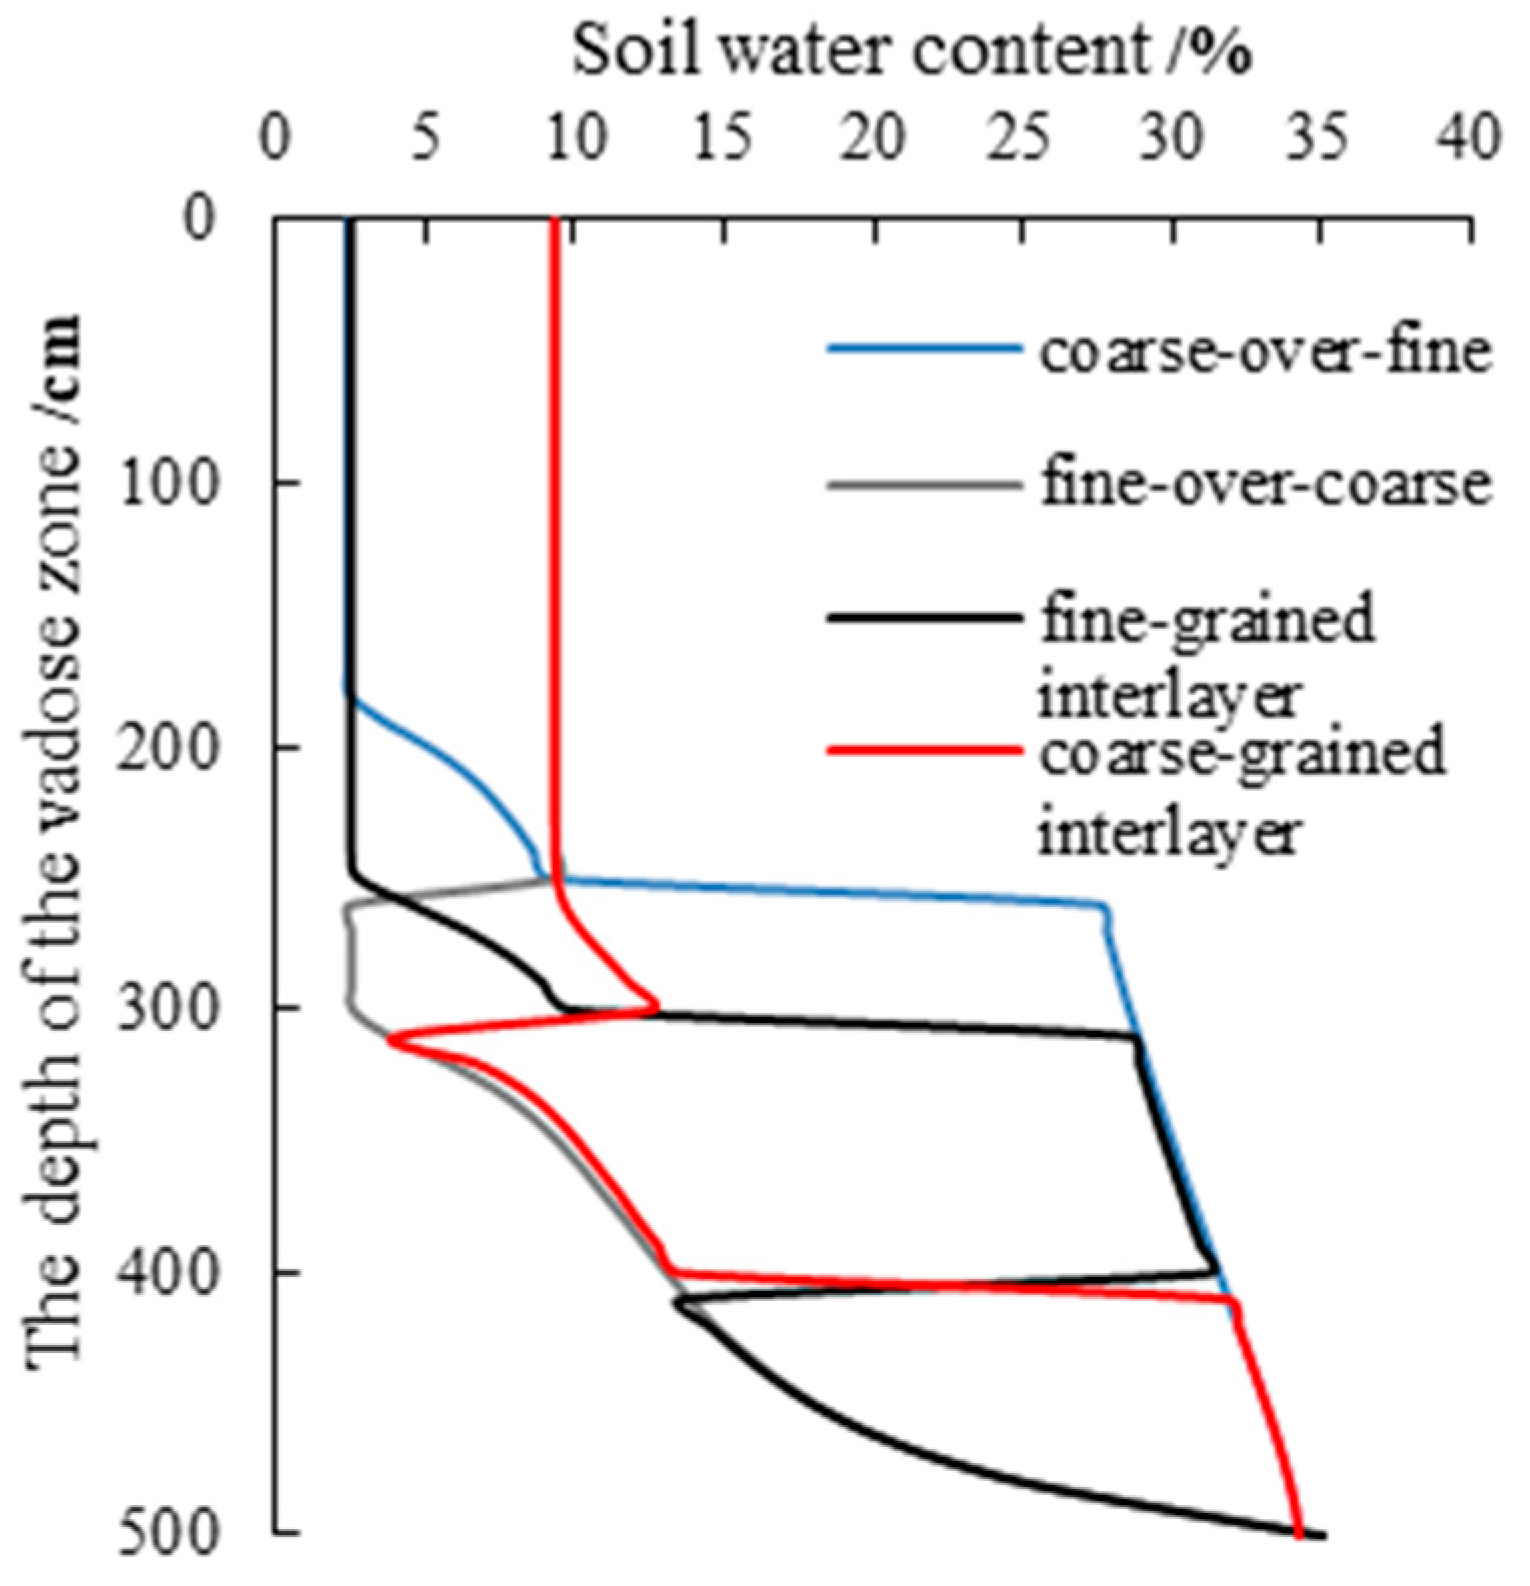
When groundwater levels continue to decline, the vadose zone in arid regions has the ecological effect of maintaining the survival of surface vegetation. Its effective water-holding capacity can sustain the survival of typical vegetation in arid regions (such as Haloxylon ammodendron) for a growing season, thereby expanding the meaning of the “ecological water level”. Lithologic particle refinement in the vadose zone increases soil water-holding capacity but raises the wilting point, limiting overall water retention, while medium-grained lithologies optimize water regulation by balancing retention and wilting thresholds. This balance sustains vegetation function under drought, offering significant ecological advantages. Compared with homogeneous lithologies, combined structures of multiple lithologies are more conducive to holding greater effective water-holding capacities and have stronger ecological effects. The effective water-holding capacity is greater in a fine-over-coarse structure than in a coarse-over-fine structure, and greater in a coarse-grained interlayer than in a fine-grained interlayer, resulting in stronger ecological effects.
This article primarily focuses on the one-dimensional vertical structure of the vadose zone, with the model being quite idealized. In future research, it is necessary to further consider the ecological constraints on vegetation imposed by the heterogeneity of lithological structures under three-dimensional scenarios of the vadose zone. Only when quantitative characterization of the horizontal and 3D heterogeneity structures or patterns in the vadose zone has been conducted will the influence of vadose zone heterogeneity on the growth status, root development characteristics, and water utilization patterns of natural vegetation be fully understood.

Author Contributions

Conceptualization, G.Z.; methodology, H.C.; software, H.C.; validation, J.S., Q.W. and X.L.; formal analysis, H.C.; investigation, M.Y., Q.W. and H.C.; data curation, G.Z.; writing—original draft preparation, H.C.; writing—review and editing, X.L.; visualization, H.C.; supervision, X.L.; project administration, G.Z.; funding acquisition, H.C. All authors have read and agreed to the published version of the manuscript.

Funding

This research was funded by the Open Fund Project of Key Laboratory of Groundwater Engineering and Geothermal Resources (grant number: KLGEGR-2024-02), the Geological survey project of China Geological Survey (grant number: DD20230700905), the Fundamental Scientific Research Funds from the Chinese Academy of Geological Sciences of China (SK202313), the Shule River Basin Groundwater Ecological Survey (grant number: 2023zfcg00874), and the Study on the Mechanism of Soil Particle Heterogeneity Affecting Water-Salt Transport and Its Ecological Effects in the Lower Reaches of Arid Regions ( grant number SK202316).

Institutional Review Board Statement

Not applicable.

Informed Consent Statement

Not applicable.

Data Availability Statement

The data presented in this study are available on request from the corresponding author.

Conflicts of Interest

The authors declare no conflicts of interest.

References

  1. Sun, Z.; Wang, J.; Ge, M.; Qiao, S. Identification of groundwater-dependent terrestrial vegetation based on water stable isotopes: Research progress, challenges, and future research prospects. Bull. Geol. Sci. Technol. 2020, 39, 11–20. [Google Scholar]
  2. Maihemuti, B.; Simayi, Z.; Alifujiang, Y.; Aishan, T.; Abliz, A.; Aierken, G. Development and evaluation of the soil water balance model in an inland arid delta oasis: Implications for sustainable groundwater resource management. Glob. Ecol. Conserv. 2021, 25, e01408. [Google Scholar] [CrossRef]
  3. Li, L.; Wang, Z.; He, H.; Ma, Z.; Xie, X.; Wei, C. Research on multi-dimensional equilibrium allocation of water resources in inland arid regions based on eco-hydrological threshold regulation. J. Hydraul. Eng. 2019, 50, 377–387. [Google Scholar]
  4. Huang, F.; Chunyu, X.; Zhang, D.; Chen, X.; Ochoa, C.G. A framework to assess the impact of ecological water conveyance on groundwater-dependent terrestrial ecosystems in arid inland river basins. Sci. Total Environ. 2020, 709, 136155. [Google Scholar] [CrossRef] [PubMed]
  5. Chunyu, X.; Huang, F.; Xia, Z.; Zhang, D.; Chen, X.; Xie, Y. Assessing the ecological effects of water transport to a lake in arid regions: A case study of Qingtu Lake in Shiyang River Basin, Northwest China. Int. J. Environ. Res. Public Health 2019, 16, 145. [Google Scholar] [CrossRef] [PubMed]
  6. Cui, H.; Zhang, G.; Wang, J.; Wang, Q.; Lang, X. Influence of multi-layered structure of vadose zone on ecological effect of groundwater in arid area: A case study of Shiyang River Basin, Northwest China. Water 2022, 14, 59. [Google Scholar] [CrossRef]
  7. Huang, F.; Zhang, D.; Chen, X. Vegetation Response to Groundwater Variation in Arid Environments: Visualization of Research Evolution, Synthesis of Response Types, and Estimation of Groundwater Threshold. Int. J. Environ. Res. Public Health 2019, 16, 1849. [Google Scholar] [CrossRef]
  8. Huang, F.; Zhang, Y.; Zhang, D.; Chen, X. Environmental groundwater depth for groundwater-dependent terrestrial ecosystems in arid/semiarid regions: A review. Int. J. Environ. Res. Public Health 2019, 16, 763. [Google Scholar] [CrossRef]
  9. Chen, M.; Zhang, Q.; Wang, Y.; Yan, L.; Deng, W. Critical depth of groundwater recharge to vegetation in the West Liaohe River Plain. Adv. Water Sci. 2019, 30, 24–33. [Google Scholar]
  10. Wang, Y. Research on Ecological Security of Oasis and Groundwater Level Regulation in Arid Regions. Ph.D. Thesis, Institute of Water Resources and Hydropower Research, Beijing, China, 2020. [Google Scholar]
  11. Zhou, H. Review of energy relationships and driving forces of soil water movement in the vadose zone in arid regions. Acta Ecol. Sin. 2019, 39, 6586–6597. [Google Scholar]
  12. Zhou, H.; Zhao, W.Z. Simulation of soil physical characteristics and their impact on capillary rise of groundwater in desert vadose zone. Chin. J. Appl. Ecol. 2019, 30, 2999–3009. [Google Scholar]
  13. Ge, J.; Huang, D.; Gao, X.; Tang, J.; Shen, H. Study on water-holding capacity of layered soil. Southwest China J. Agric. Sci. 2019, 32, 2126–2132. [Google Scholar]
  14. Pandey, P.K.; Pandey, V. Estimation of infiltration rate from readily available soil properties (RASPs) in fallow cultivated land. Sustain. Water Resour. Manag. 2019, 5, 921–934. [Google Scholar] [CrossRef]
  15. Zornberg, J.G.; Bouazza, A.; Mccartney, J.S. Geosynthetic capillary barriers: Current state of knowledge. Geosynth. Int. 2010, 17, 273–300. [Google Scholar] [CrossRef]
  16. Shi, W.; Shen, B.; Wang, Z.; Wang, W. Analysis of maximum capillary rise height in layered soil. Agric. Res. Arid. Areas 2007, 1, 94–97. [Google Scholar]
  17. Huang, M.; Barbour, S.L.; Elshorbagy, A.; Zettl, J.D.; Si, B.C. Infiltration and drainage processes in multi-layered coarse soils. Can. J. Soil Sci. 2011, 91, 169–183. [Google Scholar] [CrossRef]
  18. Scarfone, R.; Wheeler, S.J.; Lloret-Cabot, M. A hysteretic hydraulic constitutive model for unsaturated soils and application to capillary barrier systems. Geomech. Energy Environ. 2022, 30, 100224. [Google Scholar] [CrossRef]
  19. Qiao, X.; Wang, W.; Jiang, G.; Zhao, S.; Qiao, Y. Discussion on the ecological function of groundwater in the arid inland basin of northwest China. Water Resour. Prot. 2005, 5, 6–10. [Google Scholar]
  20. Tao, Z.; Huang, J.; Cui, X. Ecological significance of the structure of the vadose zone of aeolian sand overlying bedrock in the northern Ordos Basin. Groundwater 2007, 6, 54–56. [Google Scholar]
  21. Zhang, R.; Gao, Y.; Wang, P. Preliminary study on the mechanism of gravity drainage of layered soil. Earth Sci. 1985, 1, 21–27. [Google Scholar]
  22. Zhao, C.; Jia, X.; Shao, M.; Zhu, Y. Regional variations in plant-available soil water storage and related driving factors in the middle reaches of the Yellow River Basin, China. Agric. Water Manag. 2021, 257, 107131. [Google Scholar] [CrossRef]
  23. Dang, X.; Lu, N.; Gu, X.; Jin, X. The relationship between groundwater and natural vegetation in Qaidam Basin. J. Groundw. Sci. Eng. 2021, 9, 341–349. [Google Scholar]
  24. Yang, Y.; Wu, Y.; Tian, K.; Wang, J.; Li, Z.; Wang, J.; Deng, H. Impact of soil-groundwater environment on natural vegetation ecosystem in Zhangye Wetland. Water Resour. Plan. Des. 2023, 2, 51–55. [Google Scholar]
  25. Cui, H.; Zhang, G.; Liu, P.; Wang, J.; Tian, Y.; Wang, Q. Characteristics of the impact of lithological structure of the vadose zone on the ecological function of groundwater. Hydrogeol. Eng. Geol. 2022, 49, 52–62. [Google Scholar]
  26. Hu, S.; Ma, R.; Sun, Z.; Ge, M.; Zeng, L.; Huang, F.; Bu, J.; Wang, Z. Determination of the optimal ecological water conveyance volume for vegetation restoration in an arid inland river basin, northwestern China. Sci. Total Environ. 2021, 788, 147775. [Google Scholar] [CrossRef]
  27. Wang, J.; Zhang, G.; Wang, Q.; Cui, H.; Liu, P. Construction and application of an evaluation index system for the ecological function of groundwater in the arid regions of northwest China. Acta Geol. Sin. 2021, 95, 1573–1581. [Google Scholar]
  28. Qi, Z.; Xiao, C.; Wang, G.; Liang, X. Study on Ecological Threshold of Groundwater in Typical Salinization Area of Qian’an County. Water 2021, 13, 856. [Google Scholar] [CrossRef]
  29. Wang, W.; Gong, C.; Zhang, Z.; Chen, L. Research status and prospects of groundwater hydrology and ecological effects in arid regions. Adv. Earth Sci. 2018, 33, 702–718. [Google Scholar]
  30. Huang, F.; Ochoa, C.G.; Chen, X.; Zhang, D. Modeling oasis dynamics driven by ecological water diversion and implications for oasis restoration in arid endorheic basins. J. Hydrol. 2021, 593, 125774. [Google Scholar] [CrossRef]
  31. Wu, W.; Song, B.; Liu, D.; Song, Y. Study on the characteristics of water movement in the vadose zone of the loess tableland. Hydrogeol. Eng. Geol. 2023, 50, 12–22. [Google Scholar]
  32. Kroes, J.; Supit, I.; van Dam, J.; van Walsum, P.; Mulder, M. Impact of capillary rise and recirculation on simulated crop yields. Hydrol. Earth Syst. Sci. 2018, 22, 2937–2952. [Google Scholar] [CrossRef]
  33. Weber, P.L.; Blaesbjerg, N.H.; Moldrup, P.; Pesch, C.; Hermansen, C.; Greve, M.H.; Arthur, E.; de Jonge, L.W. Organic carbon controls water retention and plant available water in cultivated soils from South Greenland. Soil Sci. Soc. Am. J. 2023, 87, 203–215. [Google Scholar] [CrossRef]
  34. Liu, M.; Nie, Z.; Cao, L.; Wang, L.; Lu, H.; Wang, Z.; Zhu, P. Comprehensive evaluation on the ecological function of groundwater in the Shiyang River watershed. J. Groundwater Sci. Eng. 2021, 9, 326–340. [Google Scholar] [CrossRef]
  35. Song, S.; Nie, Z.; Geng, X.; Shen, X.; Wang, Z.; Zhu, P. Response of runoff to climate change in the area of runoff yield in upstream Shiyang River Basin, Northwest China: A case study of the Xiying River. J. Groundwater Sci. Eng. 2023, 11, 89–96. [Google Scholar] [CrossRef]
  36. Ma, R.; Hu, S.; Qi, J.; Sun, Z.; Xu, Y.; Bu, J.; Luo, M.; Wang, Y.; Ge, M.; Lei, Y.; et al. Key Technologies and Demonstration of Groundwater Regulation and Aquatic Ecological Function Protection in Key Wetlands: A Science and Technology Report; China University of Geosciences: Wuhan, China, 2021. [Google Scholar]
Figure 1. Mechanism of maintaining natural vegetation by supportive capillary water [6].
Sustainability 17 06605 g001
Figure 4. Survey deployment map for preliminary groundwater–ecology–soil studies: (A) regional scale survey on groundwater–ecology–soil in Minqin Basin; (B) deployment of monitoring sites at Qingtu lake wetland; (C) field experiment at transition zones between Minqin Oasis and desert margins.
Sustainability 17 06605 g004
Figure 5. The ecological landscape of natural vegetation and lithological structure of the vadose zone at monitoring points V01 to V06 in Qingtu lake area: 1. gravelly soil; 2. moderately gravelly soil; 3. slightly gravelly soil; 4. sandy soil; 5. loamy sand; 6. sandy loam; 7. loam; 8. silty loam [36].
Sustainability 17 06605 g005
Figure 6. The structure and photograph of the test equipment.
Sustainability 17 06605 g006
Figure 7. Optimized fitting results between simulated and measured values of soil moisture content.
Sustainability 17 06605 g007
Figure 8. Soil water content distribution of monitoring point soil profiles.
Sustainability 17 06605 g008
Figure 9. Root density distribution of monitoring point soil profiles. (Root density means the total length of roots per unit volume of soil.)
Sustainability 17 06605 g009
Figure 10. Seasonal variations in the δ18O and δD of water from typical plants vs. potential sources.
Sustainability 17 06605 g010
Figure 11. Contribution proportions of potential water sources for typical vegetation in spring and summer.
Sustainability 17 06605 g011
Figure 12. Characteristics of groundwater supply acquisition capacity in the vadose zone with different single lithologies. (The solid lines represent the capillary rise heights of groundwater in different single lithologies, while the dashed lines represent the accumulated water supply of groundwater in different single lithologies.)
Sustainability 17 06605 g012
Figure 13. Distribution characteristics of water content in the vadose zone with different single lithologies.
Sustainability 17 06605 g013
Figure 14. Change characteristics of water holding capacity in vadose zones with different single lithologies.
Sustainability 17 06605 g014
Figure 15. Characteristics of groundwater supply acquisition capacity in the vadose zone with different multilayer lithologic structures. (The solid lines represent the capillary rise heights of groundwater in different single lithologies, while the dashed lines represent the accumulated water supply of groundwater in different single lithologies.)
Sustainability 17 06605 g015
Figure 16. Distribution characteristics of water content in the vadose zone with different multilayer lithologic structures.
Sustainability 17 06605 g016
Figure 17. Change characteristics of water holding capacity in vadose zones with different multilayer lithologic structures.
Sustainability 17 06605 g017
Figure 18. Soil moisture characteristic curves of different single lithologies.
Sustainability 17 06605 g018
Table 1. Particle composition and dry bulk density of soil samples.
LithologyPercentage of Different Soil Particles/%Dry Bulk Density g/cm3
>1 mm1–0.5 mm0.5–0.25 mm0.25–0.1 mm0.1–0.075 mm<0.075 mm
silty soil000.0447.7820.8231.361.35
clay soil0.234.653.1429.1728.9833.841.44
silty
fine sand
00.2417.8853.9015.3212.661.51
medium fine sand0.0116.8526.9333.4014.857.961.60
Table 2. Hydraulic characteristic parameters of different lithological soils after correction and identification.
LithologyResidual Water Content/%Saturated Water Content/%Reciprocal of Air-Entry ValueShape FactorSaturated Hydraulic Conductivity/(cm·d−1)Wilting Point Moisture Content/%
silty soil3.0735.990.0241.52117.334.62
clay soil5.3534.270.0051.4647.859.32
silty
fine sand
1.7937.910.0451.55305.672.79
medium fine sand1.4435.000.0751.5642.982.44
Table 3. Characteristics of available water capacity in vadose zones with different single lithologies after 50 days of water release.
Lithology of the Vadose ZoneClay SoilSilty SoilSilty Fine SandMedium Fine Sand
Residual water content/mm466.0231.0139.5122.0
Total water holding capacity/mm1130.0927.8778.7666.7
Available water capacity/mm664.0696.8639.2544.7
Ratio of available water capacity to total water holding capacity/%58.7675.1082.0981.70
Table 4. Characteristics of available water capacity in vadose zones with different multilayer lithologic structures after 50 days of water release.
Lithology of the Vadose ZoneCoarse-Over-FineFine-Over-CoarseFine-Grained InterlayerCoarse-Grained Interlayer
Residual water content/mm294.0294.0190.8397.2
Total water holding capacity/mm861.41029.7812.41146.8
Available water capacity/mm567.4735.7621.6749.6
Ratio of available water capacity to total water holding capacity/%65.8771.4576.5165.36
Disclaimer/Publisher’s Note: The statements, opinions and data contained in all publications are solely those of the individual author(s) and contributor(s) and not of MDPI and/or the editor(s). MDPI and/or the editor(s) disclaim responsibility for any injury to people or property resulting from any ideas, methods, instructions or products referred to in the content.

