
Bridging the Gap: Spatial Disparities in Coordinating New Infrastructure Construction and Inclusive Green Growth in China


Abstract
1. Introduction
2. Literature Reviews and Contributions
2.1. Literature Reviews
2.2. Contributions
3. Research Method and Empirical Data
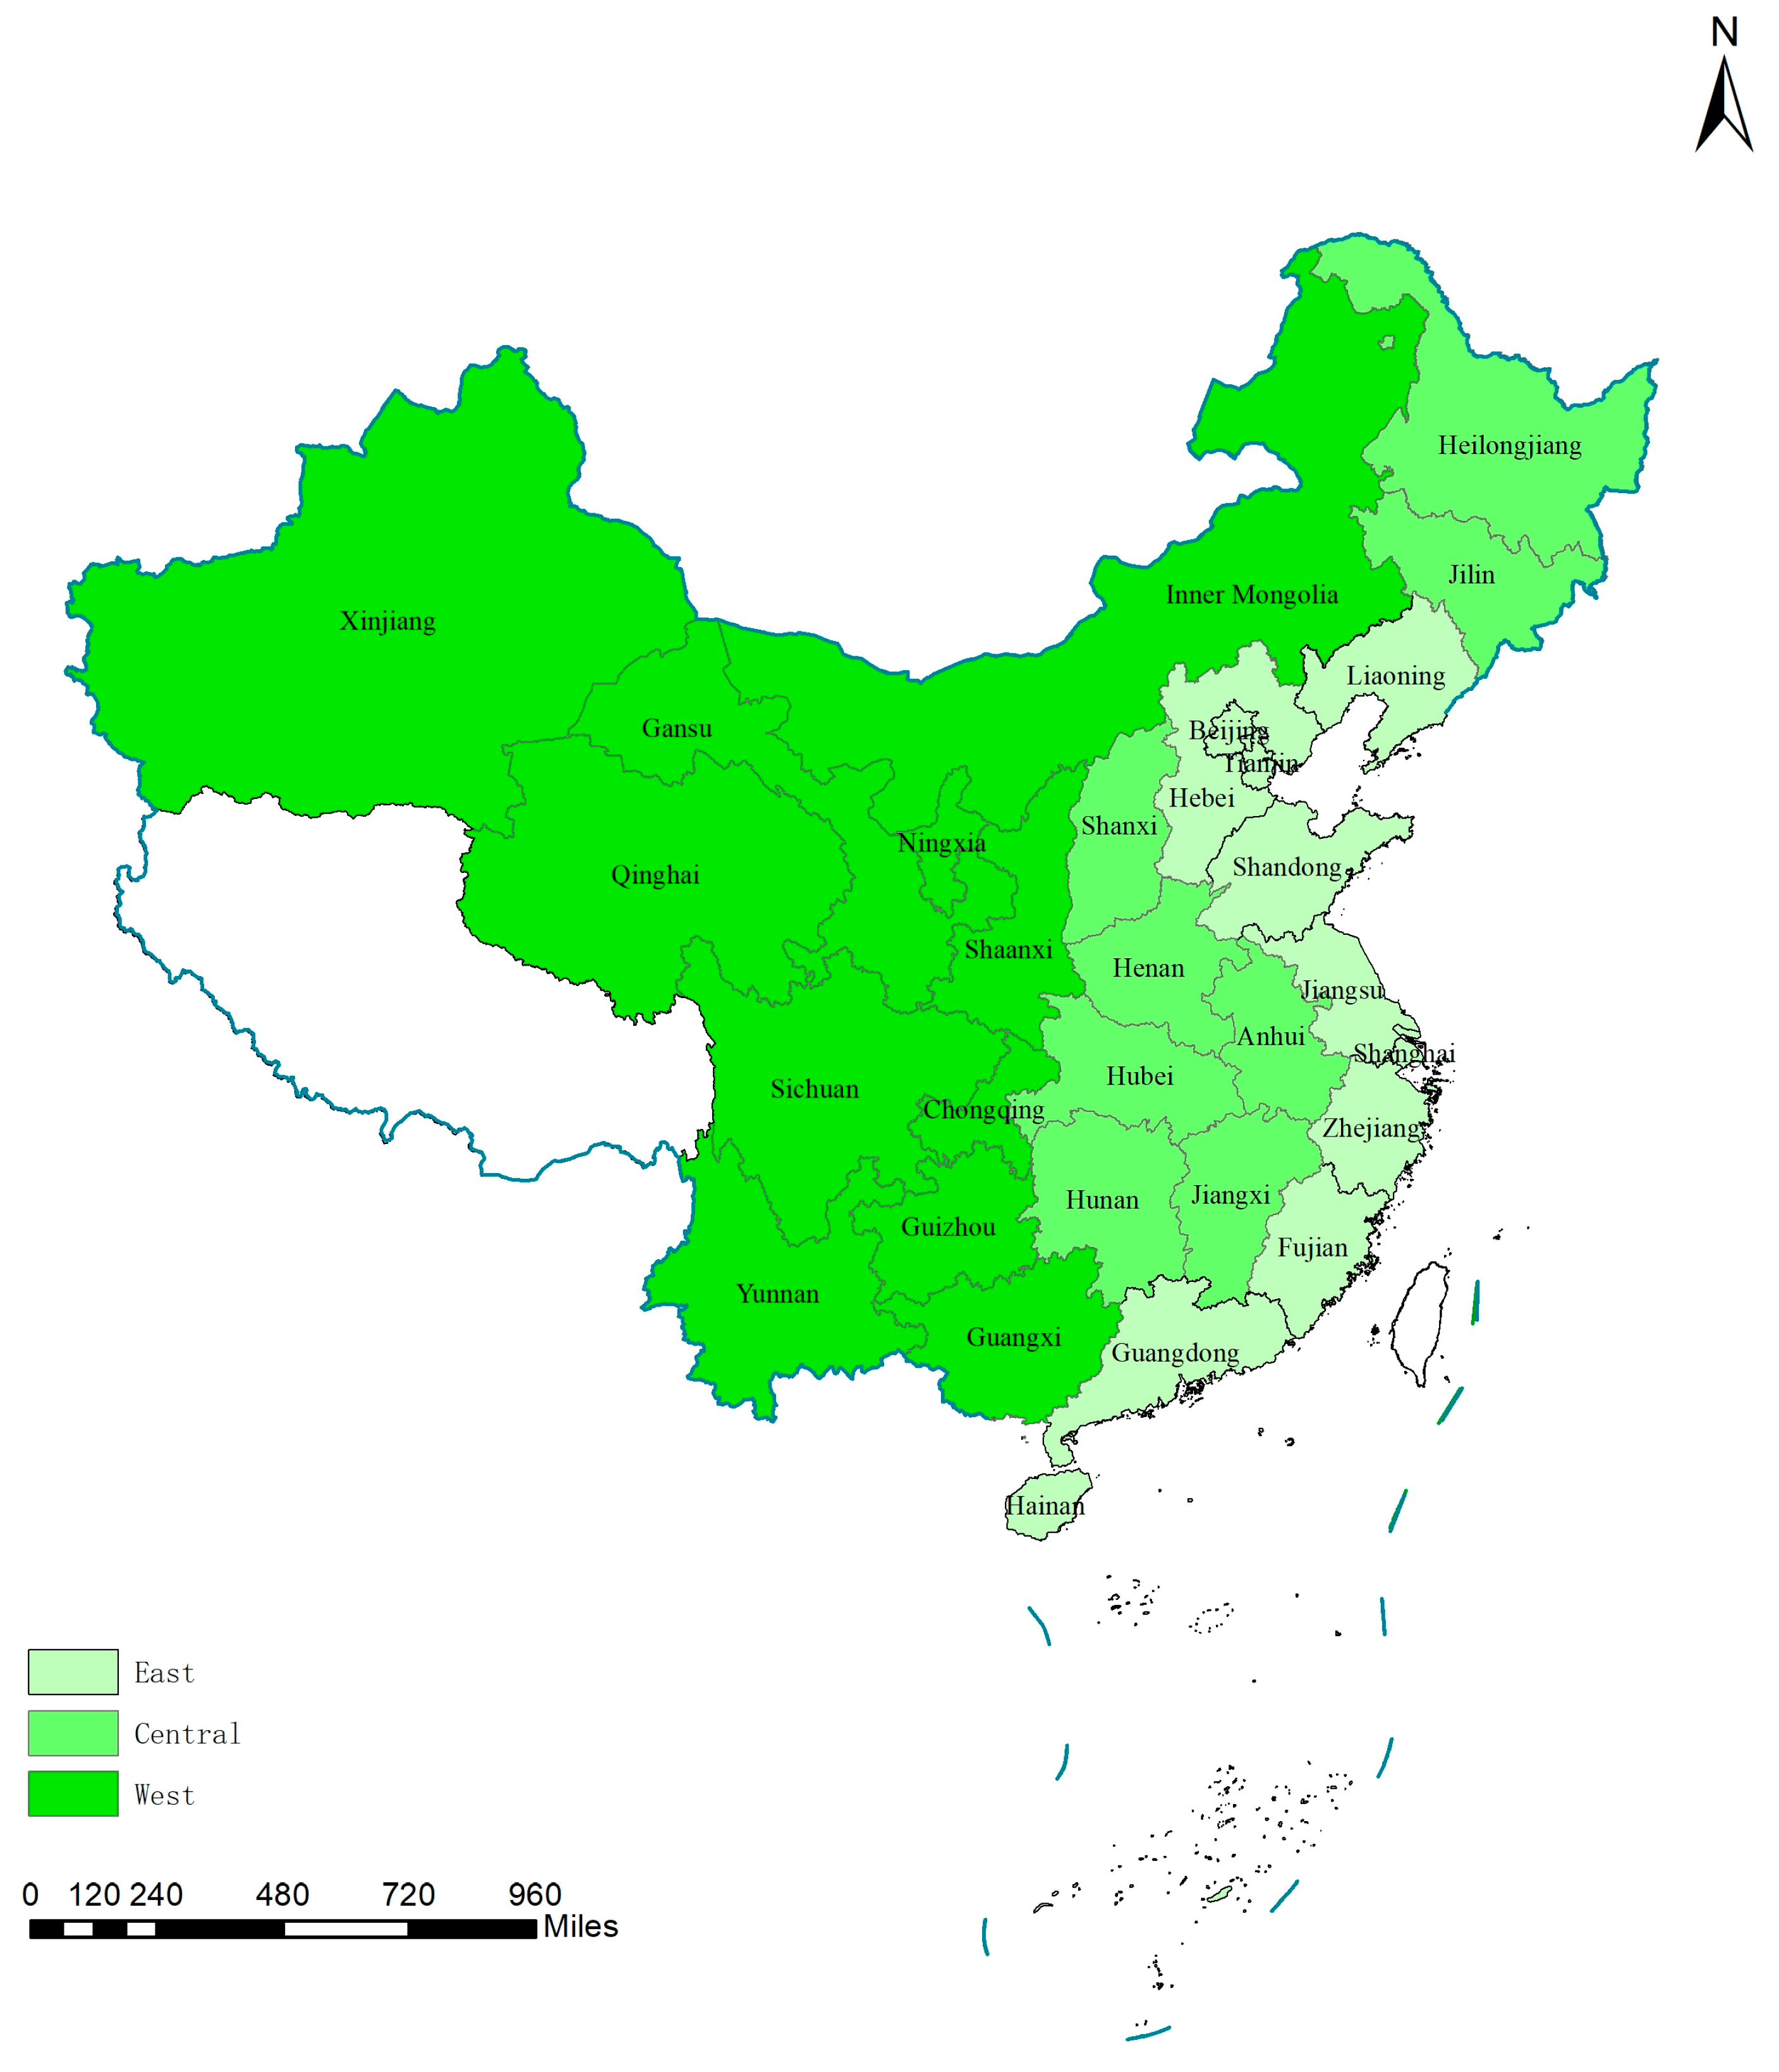
3.1. Study Area and Data Resources
3.2. Indicator Systems
3.3. Entropy Value and Coupling Coordination Degree (CCD) Model
3.4. Dagum Gini Coefficient Decomposition Method
3.5. Quadratic Assignment Procedure (QAP)
4. Measurement Results of the CCD of NIC and IGG
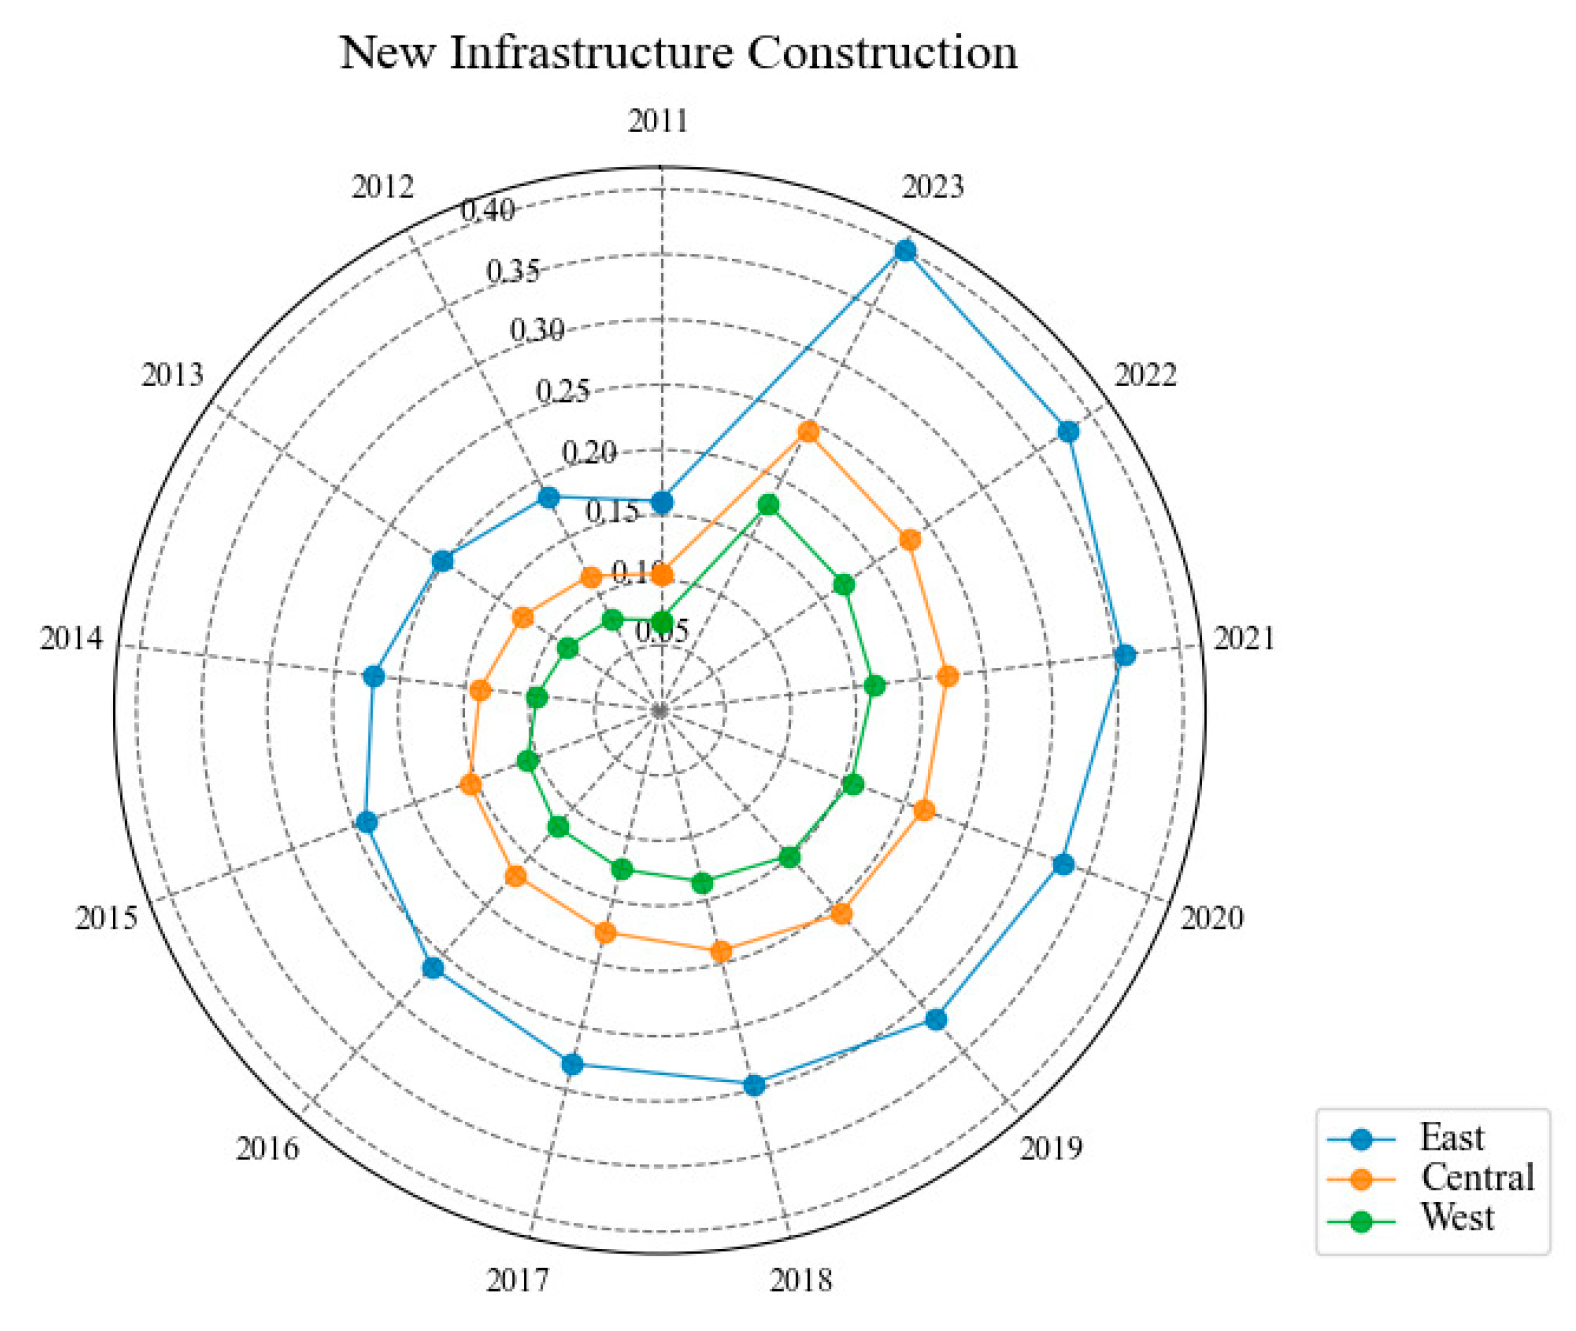
4.1. Analysis of NIC Levels
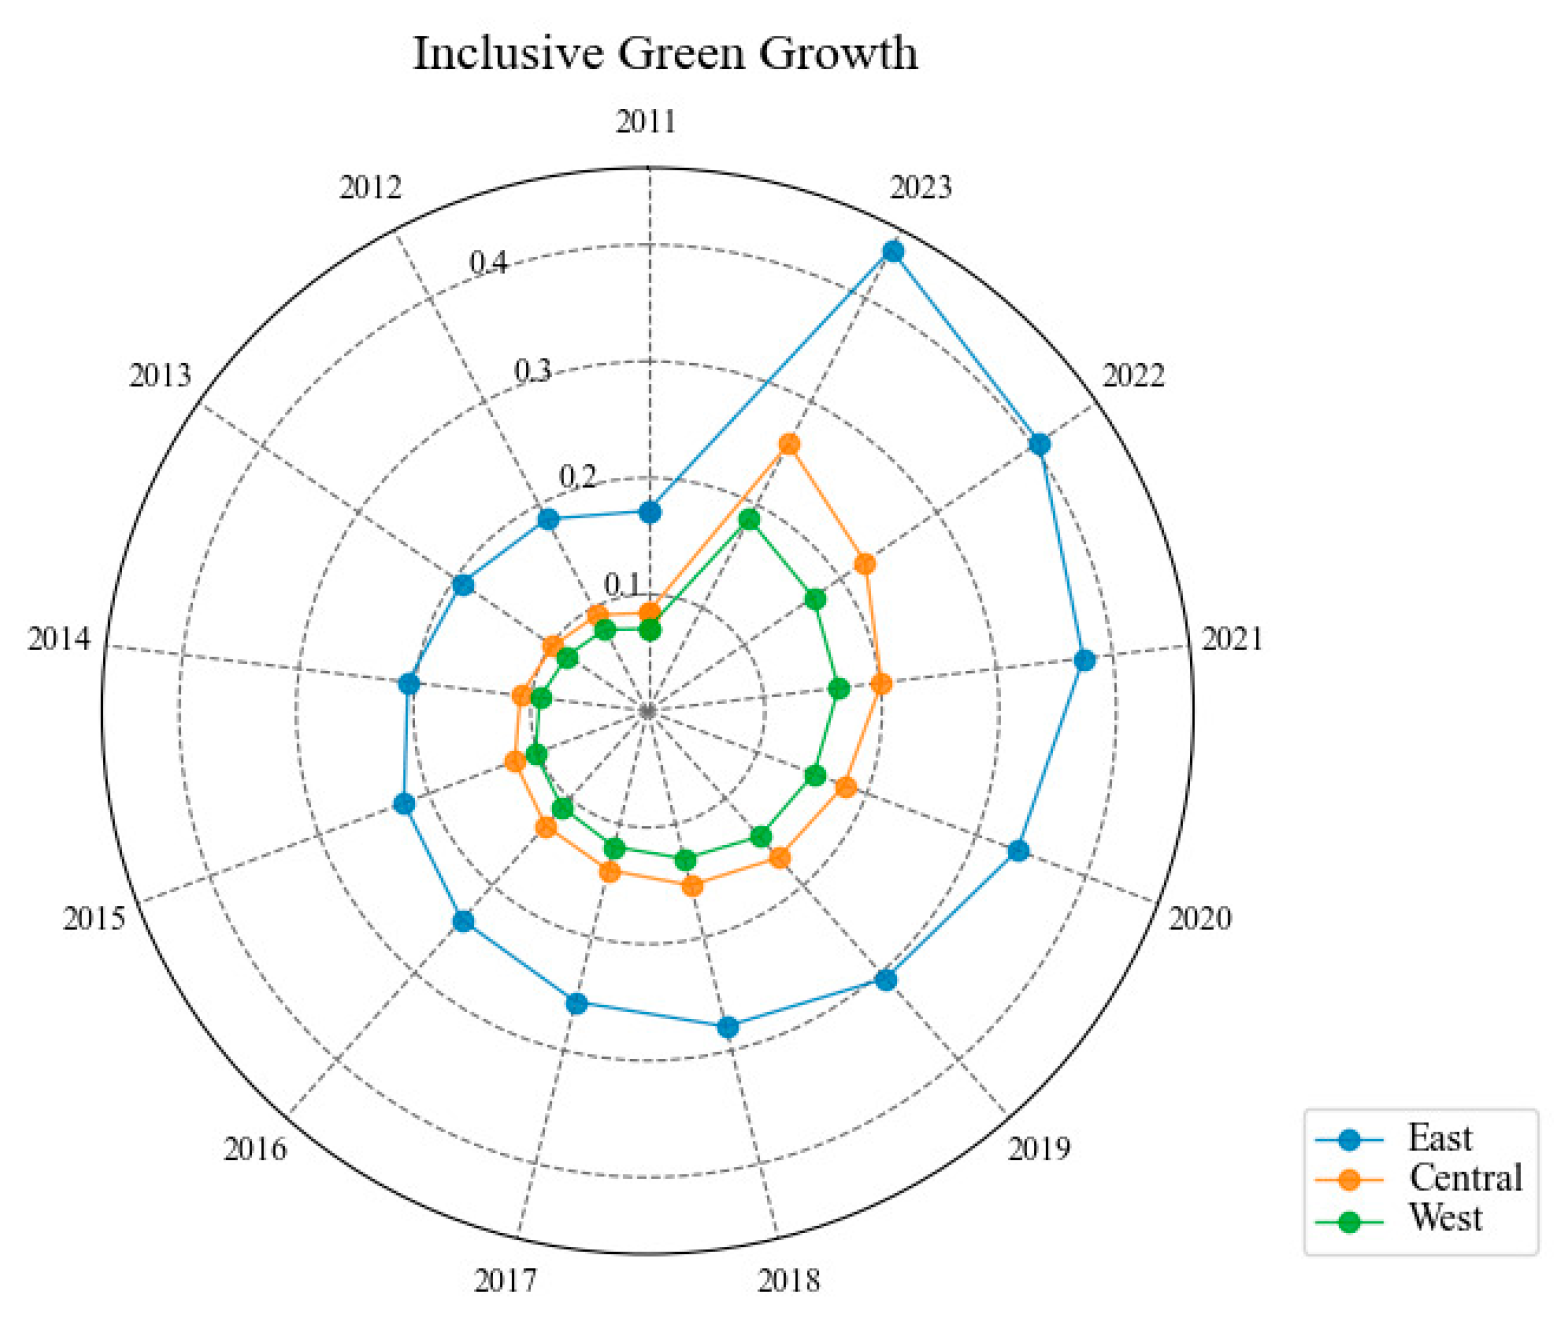
4.2. Analysis of IGG Levels
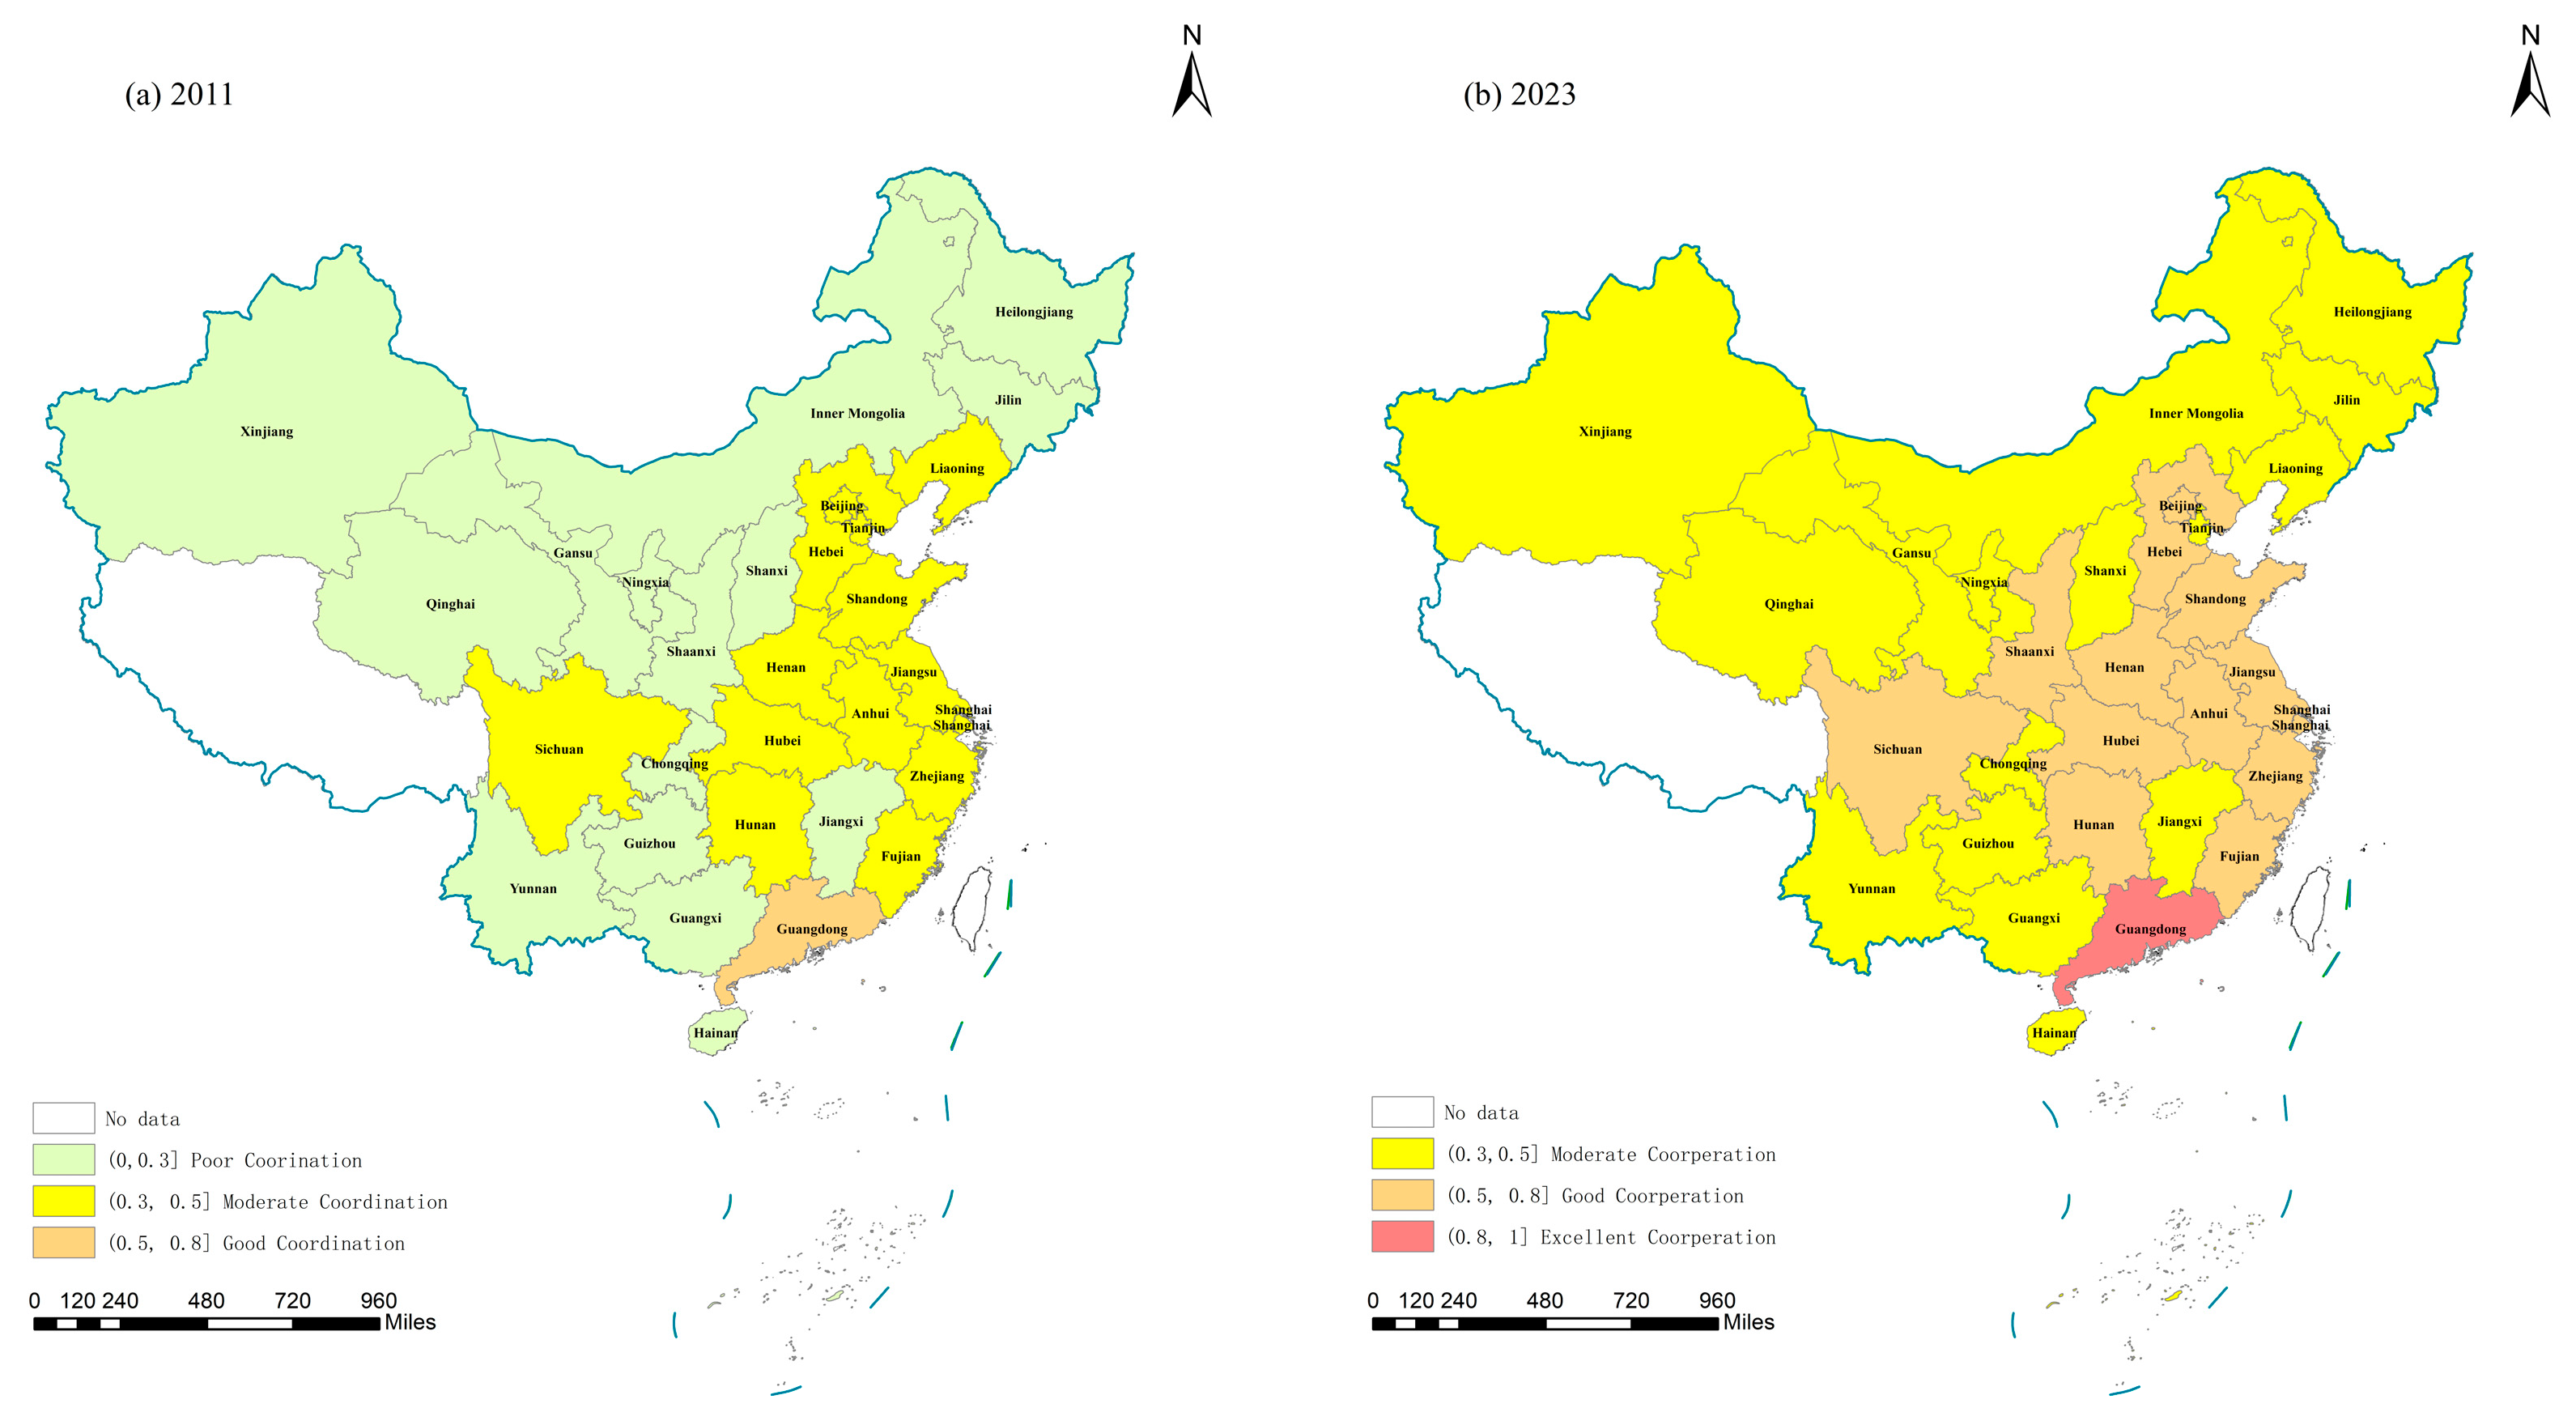
4.3. Analysis of the CCD Between NIC and IGG
5. Analysis of Regional Disparities
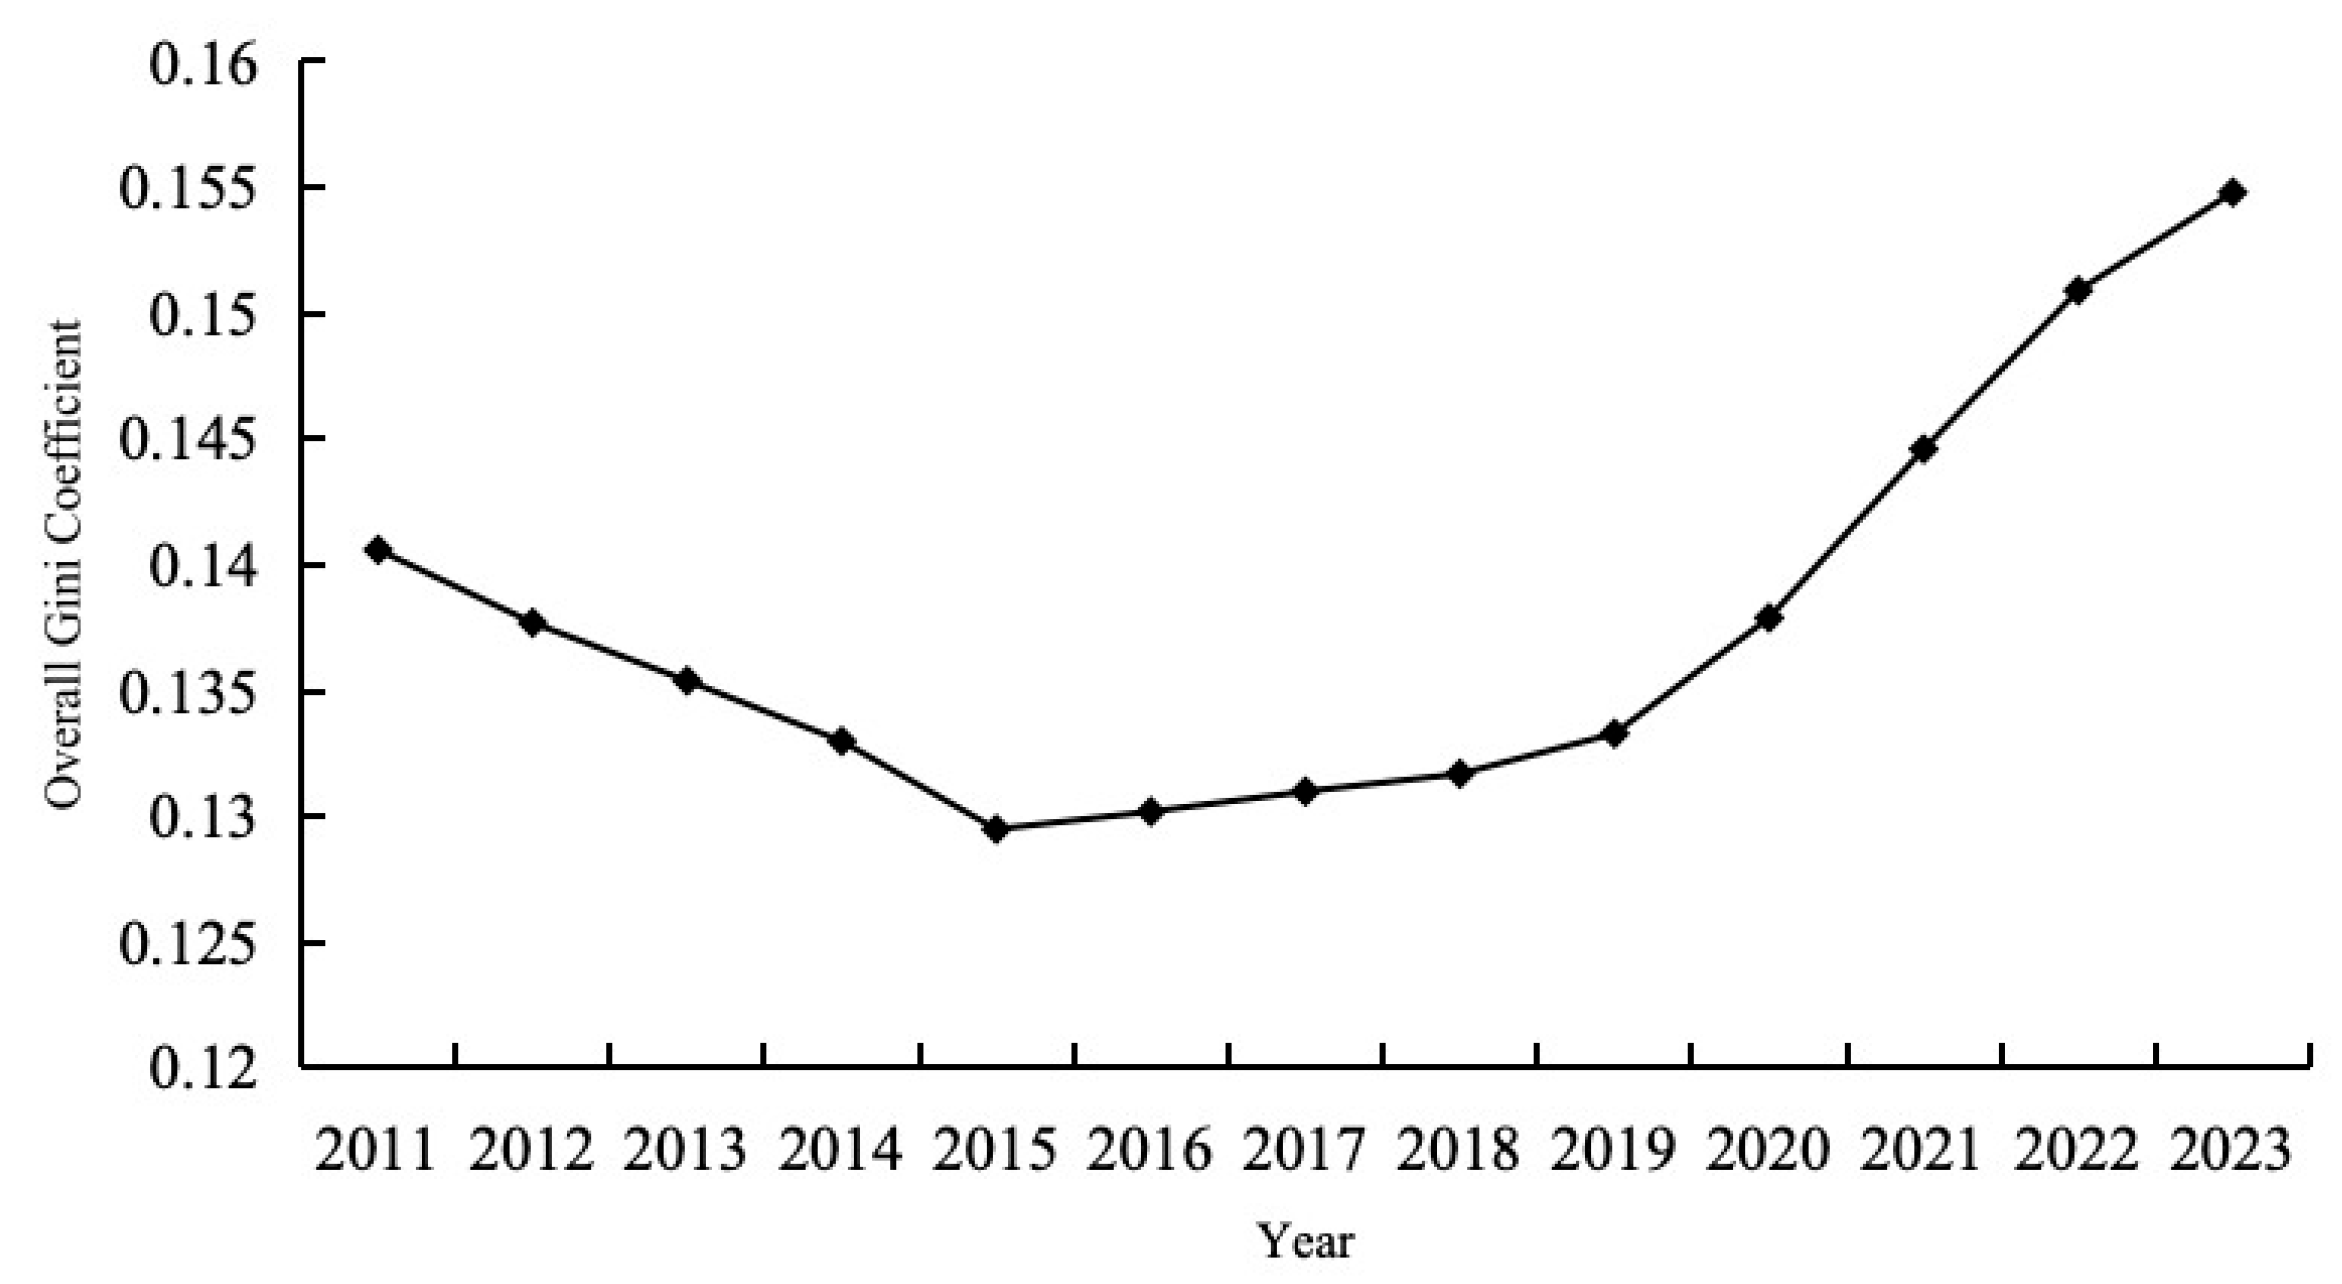
5.1. Overall Regional Disparities and Their Decomposition
5.2. Intra-Regional Disparities
5.3. Inter-Regional Disparities
6. Formation Mechanism of Disparities in the CCD Between NIC and IGG
6.1. Regional Analysis
6.2. Temporal Evolution Analysis
7. Conclusions, Policy Implications, and Limitations
7.1. Conclusions
7.2. Policy Implications
7.3. Limitations
Author Contributions
Funding
Institutional Review Board Statement
Informed Consent Statement
Data Availability Statement
Conflicts of Interest
Abbreviations
| NIC | New Infrastructure Construction |
| IGG | Inclusive Green Growth |
| CCD | Coupling Coordination Degree |
References
- Zhao, N.; Jin, M.; Qiu, Z.; Zhou, J.; Liu, B. How Public Environmental Appeals Affect the Collaborative Governance in Pollution and Carbon Reduction: Evidence from Spatial Effects across Chinese Cities. Environ. Res. 2024, 256, 119249. [Google Scholar] [CrossRef] [PubMed]
- Zhang, B.; Yin, J.; Ding, R.; Chen, S.; Luo, X.; Wei, D. Urban Synergistic Carbon Emissions Reduction Research: A Perspective on Spatial Complexity and Link Prediction. J. Environ. Manag. 2024, 370, 122505. [Google Scholar] [CrossRef] [PubMed]
- Zou, S.; Fan, X.; Zhou, Y.; Cui, Y. Achieving Collaborative Pollutant and Carbon Emissions Reduction through Digital Governance: Evidence from Chinese Enterprises. Environ. Res. 2024, 263, 120197. [Google Scholar] [CrossRef] [PubMed]
- Cucchiella, F.; D’Adamo, I.; Gastaldi, M.; Miliacca, M. Efficiency and Allocation of Emission Allowances and Energy Consumption over More Sustainable European Economies. J. Clean. Prod. 2018, 182, 805–817. [Google Scholar] [CrossRef]
- Di, K.; Chen, W.; Zhang, X.; Shi, Q.; Cai, Q.; Li, D.; Liu, C.; Di, Z. Regional Unevenness and Synergy of Carbon Emission Reduction in China’s Green Low-Carbon Circular Economy. J. Clean. Prod. 2023, 420, 138436. [Google Scholar] [CrossRef]
- Aslam, A.; Ghouse, G. Targeting the New Sustainable Inclusive Green Growth: A Review. Clean. Responsible Consum. 2023, 11, 100140. [Google Scholar] [CrossRef]
- Olczyk, M.; Kuc-Czarnecka, M. European Green Deal Index: A New Composite Tool for Monitoring European Union’s Green Deal Strategy. J. Clean. Prod. 2025, 495, 145077. [Google Scholar] [CrossRef]
- Ville, F.D. The European Union’s Management of the Environment-Trade Nexus at the World Trade Organization before and after the European Green Deal. J. Environ. Policy Plan. 2025, 1–13. [Google Scholar] [CrossRef]
- Ren, Y.; He, X.; Jiang, Q.; Zhang, F.; Zhang, B. Advancing High-Quality Development in China: Unraveling the Dynamics, Disparities, and Determinants of Inclusive Green Growth at the Prefecture Level. Ecol. Indic. 2024, 169, 112898. [Google Scholar] [CrossRef]
- Verma, A.; Dandgawhal, P.S. Arun Kumar Giri Impact of ICT Diffusion and Financial Development on Economic Growth in Developing Countries. J. Econ. Financ. Adm. Sci. 2023, 28, 27–43. [Google Scholar]
- Chatzistamoulou, N. Is Digital Transformation the Deus Ex Machina towards Sustainability Transition of the European SMEs? Ecol. Econ. 2023, 206, 107739. [Google Scholar] [CrossRef]
- Zhang, P.; Chen, P.; Xiao, F.; Sun, Y.; Ma, S.; Zhao, Z. The Impact of Information Infrastructure on Air Pollution: Empirical Evidence from China. Int. J. Environ. Res. Public Health 2022, 19, 14351. [Google Scholar] [CrossRef] [PubMed]
- Chen, P.Y. Is the Digital Economy Driving Clean Energy Development?—New Evidence from 276 Cities in China. J. Clean. Prod. 2022, 372, 133783. [Google Scholar] [CrossRef]
- Dong, B.; Xu, Y. The Impact of Chinese Government’s Attention on Inclusive Green Development: Evidence from 253 Cities in China. Env. Dev Sustain. 2024, 27, 11335–11367. [Google Scholar] [CrossRef]
- Xetor, L.E.; Mensah, J. Inclusive Growth and Sustainable Development Nexus: Where Is the Synergy? Sustain. Dev. 2025. [Google Scholar] [CrossRef]
- Kamguia, B.; Tadadjeu, S.; Ndoya, H.; Djeunankan, R. Assessing the Nexus between Industrialization and Inclusive Green Growth in Africa. The Critical Role of Energy Efficiency. Ecol. Econ. 2025, 233, 108601. [Google Scholar] [CrossRef]
- Liu, Z. Inclusive Green Growth and Regional Disparities: Evidence from China. Sustainability 2021, 13, 11651. [Google Scholar] [CrossRef]
- Doumbia, D. The Quest for Pro-Poor and Inclusive Growth: The Role of Governance. Appl. Econ. 2019, 51, 1762–1783. [Google Scholar] [CrossRef]
- He, G.; Wang, X.; Zhao, S. Research on the Dynamic Evolution and Improvement Path of Inclusive Green Development Efficiency in China: A Perspective of Urban. Pol. J. Environ. Stud. 2022, 31, 5711–5726. [Google Scholar] [CrossRef] [PubMed]
- Olatunji, A.; Shobande, L.O. Carbon Neutrality: Synergy for Energy Transition, Circular Economy and Inclusive Green Growth. J. Environ. Manag. 2025, 374, 124114. [Google Scholar] [CrossRef] [PubMed]
- Cheng, S.; Fan, W.; Meng, F.; Chen, J.; Cai, B.; Liu, G.; Liang, S.; Song, M.; Zhou, Y.; Yang, Z. Toward Low-Carbon Development: Assessing Emissions-Reduction Pressure among Chinese Cities. J. Environ. Manag. 2020, 271, 111036. [Google Scholar] [CrossRef] [PubMed]
- Wang, X.; Zhong, M. Can Digital Economy Reduce Carbon Emission Intensity? Empirical Evidence from China’s Smart City Pilot Policies. Env. Sci. Pollut. Res. 2023, 30, 51749–51769. [Google Scholar] [CrossRef] [PubMed]
- Tang, K.; Yang, G. Does Digital Infrastructure Cut Carbon Emissions in Chinese Cities? Sustain. Prod. Consum. 2023, 35, 431–443. [Google Scholar] [CrossRef]
- Tang, J.; Zhao, X. Does the New Digital Infrastructure Improve Total Factor Productivity? Bull. Econ Res 2023, 75, 895–916. [Google Scholar] [CrossRef]
- Yi, M.; Liu, Y.; Sheng, M.S.; Wen, L.; Yi, M.; Liu, Y.; Sheng, M.S.; Wen, L. Effects of Digital Economy on Carbon Emission Reduction: New Evidence from China. Energy Policy 2022, 171, 113271. [Google Scholar] [CrossRef]
- Gao, Z.; Zhao, Y.; Li, L.; Hao, Y. Economic Effects of Sustainable Energy Technology Progress under Carbon Reduction Targets: An Analysis Based on a Dynamic Multi-Regional CGE Model. Appl. Energy 2024, 363, 123071. [Google Scholar] [CrossRef]
- Pradhan, R.P. Sustainable Economic Development in India: The Dynamics between Financial Inclusion, ICT Development, and Economic Growth. Technol. Forecast. Soc. Change 2021, 169, 120758. [Google Scholar] [CrossRef]
- Galperin, H.; Katz, R.; Valencia, R. The Impact of Broadband on Poverty Reduction in Rural Ecuador. Telemat. Inform. 2022, 75, 101905. [Google Scholar] [CrossRef]
- Xiang, X.H.; Yang, G.; Sun, H. The Impact of the Digital Economy on Low-Carbon, Inclusive Growth: Promoting or Restraining. Sustainability 2022, 14, 7187. [Google Scholar] [CrossRef]
- Wang, L.; Shao, J. The Energy Saving Effects of Digital Infrastructure Construction: Empirical Evidence from Chinese Industry. Energy 2024, 294, 130778. [Google Scholar] [CrossRef]
- Chen, L.; Lu, Y.; Meng, Y.; Zhao, W. Research on the Nexus between the Digital Economy and Carbon Emissions -Evidence at China’s Province Level. J. Clean. Prod. 2023, 413, 137484. [Google Scholar] [CrossRef]
- Zhu, P.; Li, Z.; Meng, X.; Chen, Z. Information Infrastructure and Environmental, Social, and Governance Performance of the Enterprise: A Quasi-Experimental Analysis. Emerg. Mark. Financ. Trade 2024, 60, 2768–2782. [Google Scholar] [CrossRef]
- Yin, S.; Zhang, N.; Ullah, K.; Gao, S. Enhancing Digital Innovation for the Sustainable Transformation of Manufacturing Industry: A Pressure-State-Response System Framework to Perceptions of Digital Green Innovation and Its Performance for Green and Intelligent Manufacturing. Systems 2022, 10, 72. [Google Scholar] [CrossRef]
- Du, Y.-L.; Yi, T.-H.; Li, X.-J.; Rong, X.-L.; Dong, L.-J.; Wang, D.-W.; Gao, Y.; Leng, Z. Advances in Intellectualization of Transportation Infrastructures. Engineering 2023, 24, 239–252. [Google Scholar] [CrossRef]
- Sun, D.; Zeng, S.; Lin, H.; Meng, X.; Yu, B.; Sun, D.; Zeng, S.; Lin, H.; Meng, X.; Yu, B.; et al. Can Transportation Infrastructure Pave a Green Way? A City-Level Examination in China. J. Clean. Prod. 2019, 226, 669–678. [Google Scholar] [CrossRef]
- Ren, S.; Li, L.; Han, Y.; Hao, Y.; Wu, H. The Emerging Driving Force of Inclusive Green Growth: Does Digital Economy Agglomeration Work? Bus. Strategy Environ. 2022, 31, 1656–1678. [Google Scholar] [CrossRef]
- Sun, Y.; Ding, W.; Yang, Z.; Yang, G.; Du, J. Measuring China’s Regional Inclusive Green Growth. Sci. Total Environ. 2020, 713, 136367. [Google Scholar] [CrossRef] [PubMed]
- Zhou, X.; Hu, Q.; Luo, H.; Hu, Z.; Wen, C. The Impact of Digital Infrastructure on Industrial Ecology: Evidence from Broadband China Strategy. J. Clean. Prod. 2024, 447, 141589. [Google Scholar] [CrossRef]
- Lin, B.; Zhou, Y. Does the Internet Development Affect Energy and Carbon Emission Performance? Sustain. Prod. Consum. 2021, 28, 1–10. [Google Scholar] [CrossRef]
- Han, D.; Zhu, Y.; Diao, Y.; Liu, M.; Shi, Z. The Impact of New Digital Infrastructure Construction on Substantive Green Innovation. Manag. Decis. Econ. 2024, 45, 4072–4083. [Google Scholar] [CrossRef]
- Fu, L.; Zhang, L.; Zhang, Z. The Impact of Information Infrastructure Construction on Carbon Emissions. Sustainability 2023, 15, 7693. [Google Scholar] [CrossRef]
- Xu, Q.; Zhong, M. Shared Prosperity, Energy-Saving, and Emission-Reduction: Can ICT Capital Achieve a “Win-Win-Win” Situation? J. Environ. Manag. 2022, 319, 115710. [Google Scholar] [CrossRef] [PubMed]
- Lyu, Y.; Ji, Z.; Liang, H.; Wang, T.; Zheng, Y.Q. Has Information Infrastructure Reduced Carbon Emissions?—Evidence from Panel Data Analysis of Chinese Cities. Buildings 2022, 12, 619. [Google Scholar] [CrossRef]
- Laitner, J.A. “Skip” Information Technology and U.S. Energy Consumption: Energy Hog, Productivity Tool, or Both? J. Ind. Ecol. 2002, 6, 13–24. [Google Scholar] [CrossRef]
- Bast, D.; Carr, C.; Madron, K.; Syrus, A.M. Four Reasons Why Data Centers Matter, Five Implications of Their Social Spatial Distribution, One Graphic to Visualize Them. Environ. Plan. A 2022, 54, 441–445. [Google Scholar] [CrossRef]
- Yin, Z.; Gong, X.; Guo, P.; Wu, T. What Drives Entrepreneurship in Digital Economy? Evidence from China. Econ. Model. 2019, 82, 66–73. [Google Scholar] [CrossRef]
- Dehghan Shabani, Z.; Shahnazi, R. Energy Consumption, Carbon Dioxide Emissions, Information and Communications Technology, and Gross Domestic Product in Iranian Economic Sectors: A Panel Causality Analysis. Energy 2019, 169, 1064–1078. [Google Scholar] [CrossRef]
- Shahnazi, R. Do Information and Communications Technology Spillovers Affect Labor Productivity? Struct. Change Econ. Dyn. 2021, 59, 342–359. [Google Scholar] [CrossRef]
- Fan, Y.; Fang, C.; Zhang, Q. Coupling Coordinated Development between Social Economy and Ecological Environment in Chinese Provincial Capital Cities-Assessment and Policy Implications. J. Clean. Prod. 2019, 229, 289–298. [Google Scholar] [CrossRef]
- Liu, N.; Liu, C.; Xia, Y.; Da, B. Examining the Coordination between Urbanization and Eco-Environment Using Coupling and Spatial Analyses: A Case Study in China. Ecol. Indic. 2018, 93, 1163–1175. [Google Scholar] [CrossRef]


| System | Primary Indicators | Secondary Indicators | Attribute | Weights | |
|---|---|---|---|---|---|
| New Infrastructure Construction (NIC) | Information Infrastructure Construction | Telecom Major Communication Capacity | Mobile Phone Base Stations (10,000 units) | + | 0.048 |
| Mobile Phone Switch Capacity (10,000 units) | + | 0.034 | |||
| Fiber Optic Cable Line Length (km) | + | 0.047 | |||
| Main Internet Indicators Development | Number of Domain Names (10,000 units) | + | 0.104 | ||
| Number of Websites (10,000 units) | + | 0.169 | |||
| Internet Broadband Access Ports (10,000 units) | + | 0.045 | |||
| Internet Broadband Access Users (10,000 units) | + | 0.049 | |||
| Enterprise Informationization Level | Number of Enterprises (units) | + | 0.074 | ||
| Number of Websites per 100 Enterprises (units) | + | 0.009 | |||
| Enterprise E-Commerce Situation | Proportion of Enterprises Engaged in E-Commerce Transactions (%) | + | 0.026 | ||
| E-Commerce Sales Revenue (10,000 yuan) | + | 0.111 | |||
| Software and Information Services Industry Development Level | Software Business Revenue (10,000 yuan) | + | 0.146 | ||
| Software Product Revenue (10,000 yuan) | + | 0.136 | |||
| Integrated Infrastructure Construction | Traditional Infrastructure | Railway Operating Mileage (km) | + | 0.123 | |
| Highway Mileage (km) | + | 0.119 | |||
| Mileage of High-Speed Grade Highways (km) | + | 0.115 | |||
| Total Length of Public Bus and Electric Bus Operating Routes (km) | + | 0.262 | |||
| Urban Bridge Density (units) | + | 0.382 | |||
| Degree of Informationization | Number of Domain Names (10,000 units) | + | 0.284 | ||
| Number of Websites (10,000 units) | + | 0.460 | |||
| Internet Broadband Access Ports (10,000 units) | + | 0.122 | |||
| Internet Broadband Access Users (10,000 units) | + | 0.134 | |||
| Innovative Infrastructure Construction | Innovation Funding | R&D Expenditure (10,000 yuan) | + | 0.147 | |
| Internal Expenditure of R&D (10,000 yuan) | + | 0.130 | |||
| Innovative Talent | Number of Large-Scale Industrial Enterprises with R&D Activities (units) | + | 0.206 | ||
| R&D Personnel in Large-Scale Industrial Enterprises (people) | + | 0.146 | |||
| Innovative Achievements | Number of New Product Development Projects (units) | + | 0.186 | ||
| Number of Patent Applications (units) | + | 0.185 | |||
| System | Primary Indicators | Secondary Indicators | Attribute | Weights |
|---|---|---|---|---|
| Inclusive Green Growth (IGG) | Industry and Energy Consumption Structure Level | Proportion of Tertiary Industry Added Value in GDP (%) | + | 0.039 |
| Proportion of Industrial Added Value in GDP (%) | − | 0.040 | ||
| Proportion of Coal Consumption in Energy Consumption (%) | - | 0.046 | ||
| Technology and Carbon Sink Level | Transaction Volume of Technology Market in Each Region (10,000 yuan) | + | 0.308 | |
| Internal Expenditure of Science and Technology Activities in Each Region (10,000 yuan) | + | 0.254 | ||
| Greening Coverage Rate (%) | + | 0.014 | ||
| Energy Consumption and Carbon Emission Level | Energy Intensity (tec per 10,000 yuan) | − | 0.009 | |
| Carbon Emission Intensity (tons per 10,000 yuan) | − | 0.001 | ||
| Energy Footprint (tec per person) | − | 0.007 | ||
| Carbon Footprint (tons per person) | − | 0.001 | ||
| Economic Development Level | Per Capita GDP (Yuan per person) | + | 0.062 | |
| Average Disposable Income of Urban Residents (Yuan per person) | + | 0.060 | ||
| Proportion of Regional GDP in National GDP (%) | + | 0.062 | ||
| Per Capita Net Income of Rural Households (Yuan per person) | + | 0.095 |
| Value Range | Coupling Coordination Type | Value Range | Coupling Coordination Type |
|---|---|---|---|
| Poor Coordinaton | Good Coordinaton | ||
| Moderate Coordination | Excellent Coordinaton |
| Regions | 2011 | 2013 | 2015 | 2017 | 2019 | 2021 | 2023 | Average |
|---|---|---|---|---|---|---|---|---|
| Beijing | 0.471 | 0.516 | 0.580 | 0.623 | 0.673 | 0.721 | 0.768 | 0.622 |
| Tianjin | 0.321 | 0.356 | 0.379 | 0.403 | 0.421 | 0.452 | 0.479 | 0.402 |
| Hebei | 0.343 | 0.363 | 0.387 | 0.418 | 0.453 | 0.484 | 0.526 | 0.424 |
| Shanxi | 0.264 | 0.287 | 0.320 | 0.337 | 0.357 | 0.370 | 0.388 | 0.334 |
| Inner Mongolia | 0.275 | 0.299 | 0.323 | 0.346 | 0.361 | 0.373 | 0.391 | 0.339 |
| Liaoning | 0.352 | 0.380 | 0.406 | 0.414 | 0.435 | 0.453 | 0.481 | 0.417 |
| Jilin | 0.273 | 0.293 | 0.315 | 0.343 | 0.371 | 0.372 | 0.382 | 0.337 |
| Heilongjiang | 0.296 | 0.335 | 0.356 | 0.368 | 0.375 | 0.386 | 0.392 | 0.360 |
| Shanghai | 0.417 | 0.445 | 0.486 | 0.520 | 0.555 | 0.601 | 0.654 | 0.525 |
| Jiangsu | 0.490 | 0.536 | 0.574 | 0.613 | 0.670 | 0.735 | 0.789 | 0.629 |
| Zhejiang | 0.450 | 0.491 | 0.533 | 0.570 | 0.621 | 0.684 | 0.759 | 0.585 |
| Anhui | 0.305 | 0.335 | 0.378 | 0.409 | 0.459 | 0.516 | 0.569 | 0.423 |
| Fujian | 0.348 | 0.371 | 0.416 | 0.473 | 0.494 | 0.516 | 0.535 | 0.451 |
| Jiangxi | 0.295 | 0.319 | 0.355 | 0.384 | 0.430 | 0.456 | 0.500 | 0.390 |
| Shandong | 0.427 | 0.480 | 0.500 | 0.532 | 0.561 | 0.630 | 0.702 | 0.546 |
| Henan | 0.337 | 0.360 | 0.404 | 0.431 | 0.473 | 0.502 | 0.539 | 0.435 |
| Hubei | 0.336 | 0.372 | 0.423 | 0.446 | 0.493 | 0.525 | 0.591 | 0.453 |
| Hunan | 0.333 | 0.361 | 0.397 | 0.427 | 0.473 | 0.506 | 0.571 | 0.437 |
| Guangdong | 0.502 | 0.549 | 0.587 | 0.646 | 0.726 | 0.809 | 0.860 | 0.667 |
| Guangxi | 0.288 | 0.309 | 0.337 | 0.366 | 0.399 | 0.435 | 0.433 | 0.366 |
| Hainan | 0.250 | 0.283 | 0.307 | 0.321 | 0.348 | 0.355 | 0.365 | 0.318 |
| Chongqing | 0.282 | 0.313 | 0.351 | 0.379 | 0.411 | 0.439 | 0.467 | 0.379 |
| Sichuan | 0.338 | 0.367 | 0.421 | 0.459 | 0.509 | 0.537 | 0.572 | 0.458 |
| Guizhou | 0.254 | 0.273 | 0.302 | 0.327 | 0.372 | 0.406 | 0.432 | 0.337 |
| Yunnan | 0.279 | 0.306 | 0.328 | 0.356 | 0.398 | 0.414 | 0.436 | 0.359 |
| Shaanxi | 0.297 | 0.325 | 0.360 | 0.384 | 0.426 | 0.461 | 0.505 | 0.393 |
| Gansu | 0.240 | 0.268 | 0.303 | 0.327 | 0.349 | 0.362 | 0.378 | 0.319 |
| Qinghai | 0.152 | 0.193 | 0.245 | 0.267 | 0.289 | 0.300 | 0.308 | 0.253 |
| Ningxia | 0.183 | 0.212 | 0.238 | 0.258 | 0.279 | 0.293 | 0.305 | 0.253 |
| Xinjiang | 0.257 | 0.282 | 0.313 | 0.327 | 0.351 | 0.365 | 0.381 | 0.325 |
| Eastern Average | 0.397 | 0.433 | 0.469 | 0.503 | 0.542 | 0.585 | 0.629 | 0.508 |
| Central Average | 0.305 | 0.333 | 0.369 | 0.393 | 0.429 | 0.454 | 0.491 | 0.396 |
| Western Average | 0.259 | 0.286 | 0.320 | 0.345 | 0.377 | 0.399 | 0.419 | 0.344 |
| National Average | 0.322 | 0.353 | 0.388 | 0.416 | 0.451 | 0.482 | 0.515 | 0.371 |
| Year | Overall | Decomposition | Contribution Rate (%) | ||||
|---|---|---|---|---|---|---|---|
| Intra-Regional Disparity Gw | Inter-Regional Gnb | Transvariation Intensity Gt | Intra-Regional Disparity Gw | Inter-Regional Gnb | Transvariation Intensity Gt | ||
| 2011 | 0.141 | 0.032 | 0.104 | 0.004 | 22.97 | 74.11 | 3.93 |
| 2012 | 0.138 | 0.032 | 0.102 | 0.005 | 23.02 | 73.78 | 4.43 |
| 2013 | 0.135 | 0.031 | 0.101 | 0.004 | 22.97 | 74.37 | 3.67 |
| 2014 | 0.133 | 0.031 | 0.098 | 0.004 | 23.31 | 73.46 | 4.30 |
| 2015 | 0.130 | 0.031 | 0.094 | 0.005 | 23.78 | 72.51 | 5.11 |
| 2016 | 0.130 | 0.031 | 0.094 | 0.005 | 23.96 | 71.97 | 5.66 |
| 2017 | 0.131 | 0.032 | 0.094 | 0.006 | 24.05 | 71.60 | 6.08 |
| 2018 | 0.132 | 0.033 | 0.093 | 0.007 | 24.68 | 70.39 | 7.01 |
| 2019 | 0.133 | 0.034 | 0.092 | 0.007 | 25.51 | 69.09 | 7.82 |
| 2020 | 0.138 | 0.036 | 0.095 | 0.008 | 25.74 | 68.53 | 8.36 |
| 2021 | 0.145 | 0.037 | 0.099 | 0.009 | 25.86 | 68.19 | 8.82 |
| 2022 | 0.151 | 0.039 | 0.103 | 0.010 | 25.78 | 67.99 | 9.26 |
| 2023 | 0.155 | 0.040 | 0.105 | 0.010 | 25.71 | 67.70 | 9.73 |
| Average | 0.138 | 0.034 | 0.098 | 0.006 | 24.41 | 71.05 | 6.48 |
| Variables | National | East | Central | West |
|---|---|---|---|---|
| Economic Development | 0.270 ** | 0.205 ** | 0.291 ** | 0.314 ** |
| (econ) | (0.014) | (0.046) | (0.035) | (0.039) |
| Industrial Structure | 0.188 *** | 0.254 ** | 0.151 | 0.117 |
| (ind) | (0.002) | (0.027) | (0.256) | (0.141) |
| Technological Level | 0.233 *** | 0.260 ** | 0.252 | 0.306 ** |
| (tec) | (0.000) | (0.015) | (0.205) | (0.028) |
| Market Environment | 0.594 *** | 0.692 *** | 0.778 ** | 0.787 *** |
| (mar) | (0.000) | (0.001) | (0.010) | (0.003) |
| Adj R2 | 0.967 *** (0.000) | 0.957 *** (0.000) | 0.925 *** (0.001) | 0.932 *** (0.000) |
| Obs | 870 | 110 | 56 | 110 |
| Permutations | 2000 | 2000 | 2000 | 2000 |
| Variables | 12th Five-Year Plan Period (2011–2015) | 13th Five-Year Plan Period (2016–2020) | Since 14th Five-Year Plan (2021–2023) |
|---|---|---|---|
| Economic Development | 0.261 *** | 0.320 *** | 0.269 *** |
| (econ) | (0.000) | (0.000) | (0.001) |
| Industrial Structure | 0.228 *** | 0.183 *** | 0.207 *** |
| (ind) | (0.000) | (0.004) | (0.000) |
| Technological Level | 0.251 *** | 0.215 *** | 0.181 *** |
| (tec) | (0.000) | (0.001) | (0.001) |
| Market Environment | 0.597 *** | 0.584 *** | 0.627 *** |
| (mar) | (0.000) | (0.000) | (0.000) |
| Adj R2 | 0.961 *** (0.000) | 0.958 *** (0.000) | 0.964 *** (0.000) |
| Obs | 870 | 870 | 870 |
| Permutations | 2000 | 2000 | 2000 |
Disclaimer/Publisher’s Note: The statements, opinions and data contained in all publications are solely those of the individual author(s) and contributor(s) and not of MDPI and/or the editor(s). MDPI and/or the editor(s) disclaim responsibility for any injury to people or property resulting from any ideas, methods, instructions or products referred to in the content. |
© 2025 by the authors. Licensee MDPI, Basel, Switzerland. This article is an open access article distributed under the terms and conditions of the Creative Commons Attribution (CC BY) license (https://creativecommons.org/licenses/by/4.0/).
Share and Cite
Gao, Y.; Chen, N.; Chen, X. Bridging the Gap: Spatial Disparities in Coordinating New Infrastructure Construction and Inclusive Green Growth in China. Sustainability 2025, 17, 6575. https://doi.org/10.3390/su17146575
Gao Y, Chen N, Chen X. Bridging the Gap: Spatial Disparities in Coordinating New Infrastructure Construction and Inclusive Green Growth in China. Sustainability. 2025; 17(14):6575. https://doi.org/10.3390/su17146575
Chicago/Turabian StyleGao, Yujun, Nan Chen, and Xueying Chen. 2025. "Bridging the Gap: Spatial Disparities in Coordinating New Infrastructure Construction and Inclusive Green Growth in China" Sustainability 17, no. 14: 6575. https://doi.org/10.3390/su17146575
APA StyleGao, Y., Chen, N., & Chen, X. (2025). Bridging the Gap: Spatial Disparities in Coordinating New Infrastructure Construction and Inclusive Green Growth in China. Sustainability, 17(14), 6575. https://doi.org/10.3390/su17146575