Article

Dynamic Life Cycle Assessment of Low-Carbon Transition in Asphalt Pavement Maintenance: A Multi-Scale Case Study Under China’s Dual-Carbon Target

by
Luyao Zhang
1,
Wei Tian
2,
Bobin Wang
3 and
Xiaomin Dai
4,5,*
1
School of International Business, Xinjiang University, 499 Xibei Road, Urumqi 830091, China
2
Xinjiang Jiaotou Engineering Technology Development Co., Ltd., 664 Yashan South Road, Shaybak District, Urumqi 830001, China
3
Department of Mechanical Engineering and Industrial Engineering, Université Laval 2325, rue de l’Université, Québec, QC G1V0A6, Canada
4
School of Traffic and Transportation Engineering, Xinjiang University, 777 Huarui Street, Urumqi 830017, China
5
Xinjiang Key Laboratory of Green Construction and Maintenance of Transportation Infrastructure and Intelligent Traffic Control, 777 Huarui Street, Urumqi 830017, China
*
Author to whom correspondence should be addressed.
Sustainability 2025, 17(14), 6540; https://doi.org/10.3390/su17146540
Submission received: 23 June 2025 / Revised: 14 July 2025 / Accepted: 15 July 2025 / Published: 17 July 2025

Abstract

Against the backdrop of China’s “dual-carbon” initiative, this study innovatively applies a process-based life cycle assessment (PLCA) methodology, meticulously tracking energy and carbon flows across material production, transportation, and maintenance processes. By comparing six asphalt pavement maintenance technologies in Xinjiang, the research reveals that milling and resurfacing (MR) exhibits the highest energy consumption 250,809 MJ/103 m2) and carbon emissions (15,095.67 kg CO2/103 m2), while preventive techniques like hot asphalt grouting reduce emissions by up to 87%. The PLCA approach uncovers a critical insight: 40–60% of total emissions originate from the raw material production phase, with cement and asphalt identified as primary contributors. This granular analysis, unique in regional road maintenance research, challenges traditional assumptions and emphasizes the necessity of upstream intervention. By contrasting reactive and preventive strategies, the study validates that early-stage maintenance aligns seamlessly with circular economy principles. Tailored to a local arid climate and vast transportation network, the study concludes that prioritizing preventive maintenance, adopting low-carbon materials, and optimizing logistics can significantly decarbonize road infrastructure. These region-specific strategies, underpinned by the novel application of PLCA, not only provide actionable guidance for local policymakers but also offer a replicable framework for sustainable road development worldwide, bridging the gap between scientific research and practical decarbonization efforts.

1. Introduction

In the face of the threats posed by global warming and environmental pollution, “low carbon” has become an issue of increasing concern. According to statistics from the World Resources Institute for 186 countries and regions worldwide, carbon dioxide is the largest contributor to climate change among greenhouse gases (GHGs), accounting for 77% of total GHG emissions. Most countries have reached a consensus on reducing CO2 emissions and begun to explore methods for reducing CO2 emissions, introducing various policies and regulations to promote the sustainable development of human society through institutional innovations and technological progress. On 22 September 2020, China announced its target of capping its carbon emissions by 2030 and achieving carbon neutrality by 2060, or the “dual-carbon target” [1]. In 2023, China’s emissions increased by 565 million metric tons, the largest global increment. However, the country also leads in clean energy adoption. Notably, a historic hydropower shortfall contributed to one-third of the 2023 emission growth. China’s per capita emissions are currently 15% higher than those of developed economies [2]. In response to the challenges of global climate change, the Chinese government has committed to achieving peak CO2 emissions by 2030 and carbon neutrality by 2060 [3].
The transport industry has always been the pillar of China’s national economy, and it is also a key area for energy conservation and emission reduction. According to a report from the International Energy Agency (IEA), carbon emissions from the transport sector will account for 21.6% of carbon emissions from the end-use sector in 2022 [4,5]. Carbon emissions from China’s transport sector will continue to grow between now and 2030, and it will be more than four times as high in 2030 as it was in 2000 [6]. According to data released by the Ministry of Transport (MOT) of the People’s Republic of China, the national road maintenance mileage was 5,350,300 km by the end of 2022, accounting for 99.9% of road mileage [7]. Consequently, China issued the 14th Five-Year Plan for the Development of Highway Maintenance and Management Business in April 2022, proposing the full implementation of the concept that “highway construction is development, and highway maintenance and management are also development, and are sustainable development,” with the goal of strengthening energy conservation and emission reduction efforts to help promote sustainable development [8].
The life cycle assessment (LCA) methodology has been used in the past two decades for environmental impact assessment in other industries, such as pavement infrastructure, energy, and agriculture [9,10,11]. The LCA serves as a standard methodology for quantitatively analyzing the environmental effects of roads throughout their life cycle by constructing a framework [12]. At present, many studies have introduced LCA methodologies to comprehensively assess carbon emissions during the road construction, maintenance, and operation phases [13]. The LCA provides accurate, consistent, and repeatable measurements of the resource consumption and environmental effects of an activity or product [14,15], from the production, use, disposal, and recycling (i.e., cradle to grave) of raw materials [16]. Systems for calculating life cycle emissions can be divided into two broad categories: top-down, i.e., based on input–output LCA analysis, and bottom-up, i.e., based on the process LCA (PLCA) [17]. The PLCA is well suited for evaluating asphalt pavement maintenance due to its process-level accuracy, despite challenges in comparability [18,19]. This study applies the PLCA to quantify unit carbon emissions and identify emission hotspots for Xinjiang’s highway maintenance.
The delineation of model boundaries is crucial for the LCA process. In general, the maintenance and rehabilitation phases of the road LCA typically estimate emissions from construction materials and equipment. The emissions from traffic delays caused by maintenance and rehabilitation work are included [20], but carbon emissions from transportation vehicles are not fully considered. Emission sources during the operation and use phases of a road typically include fuel consumption over the lifetime of a vehicle, the number of vehicles on a road, and the effects of changes in pavement performance. Road traffic is considered part of road operations, and thus, emissions from the fuel consumption of road vehicles should be considered [21]. Meanwhile, they considered the life cycle of vehicles, and it was one of the first studies to consider the use phase. However, this approach has faced criticism. Loijos et al. (2013) [20] attributed traffic emissions solely to the vehicle life cycle, considering only direct road-related factors like surface roughness, albedo, and carbonization. This perspective was corroborated by Fernández-Sánchez et al. (2015) [22] and Yu and Lu (2012) [23]. In addition, lighting is rarely considered a source of operational emissions.
Therefore, this study breaks new ground by selecting Xinjiang, China, as a case study and integrating the process-based life cycle assessment (PLCA) method with six cutting-edge technologies specifically tailored for the region’s unique highway maintenance needs. Unlike previous research that often focuses on generic scenarios, this study conducts a granular, region-specific comparison of energy consumption and carbon emissions across different maintenance techniques, deriving precise unit carbon emissions. By meticulously tracing the entire life cycle from material extraction to on-site application, the research uncovers previously overlooked emission hotspots, particularly in the raw material production phase, where cement and asphalt account for 40–60% of the total emissions.
This study’s innovation lies in its three-pronged methodological contribution: First, it establishes a regionalized PLCA framework specifically adapted to Xinjiang’s arid climate, vast transportation distances, and unique economic conditions, enabling precise carbon accounting for road maintenance in extreme environments. Second, it challenges conventional wisdom by demonstrating that preventive maintenance strategies, such as hot asphalt grouting, can reduce carbon emissions by up to 87% compared to reactive methods like milling and resurfacing. Third, by decoupling emission sources across life cycle phases, it pinpoints raw material production (40–60% of emissions, cement/asphalt-dominated) as the critical leverage point, with transport distance and construction efficiency as key modifiable factors. These advances provide, for the first time, emission benchmarks for road maintenance in Xinjiang, replicable models for arid regions, and actionable strategies, i.e., prioritizing preventive measures, optimizing material logistics, and upgrading mixing processes to accelerate the decarbonization process of highway infrastructure. The study has significantly contributed to the greening of the asphalt pavement maintenance sector and set a new benchmark for sustainable infrastructure research.

2. Materials and Methods

2.1. Object of Research

According to Ma et al. (2021) [24], the preventive maintenance of asphalt pavements can reduce carbon emissions by 30–45% over the lifetime of the pavement compared with restorative maintenance. The current asphalt pavement maintenance type is divided into two categories: preventive and restorative maintenance. Different types of maintenance involve a variety of maintenance construction techniques. Preventive maintenance primarily refers to caulking, the fog sealing layer, gravel sealing layer, fiber sealing layer, thin slurry sealing layer [25], composite sealing layer, thin layer of cover, and micro-surfacing [26]. The repair category is largely direct paving cover or milling and resurfacing [27].
Based on the 2021–2023 survey and incorporating project construction data, this study focuses on preventive maintenance techniques such as grouting, MS (10 mm in a single layer) and SGS (up to 10 mm), and MR, a restorative maintenance technique. Combined with the environmental analysis of the design structure of Xinjiang highways, a typical section that can represent the structural characteristics of Xinjiang highway asphalt pavement was selected as the research object highway. It is worth noting that the design service life of Xinjiang’s highways is generally 20–25 years, with a full life cycle of about 20 years in practice.
Figure 1A–H shows the typical road sections selected in this study, including the northern Xinjiang Hami, Altay, Yili, Bole, and Changji areas, and the southern Xinjiang Kexu and Korla areas, covering most of the prefectures in Xinjiang. The pavement structural surface layer is an asphalt concrete structure, which serves as a typical representative of highways in Xinjiang.
Table 1 demonstrates the design service life and frequency of maintenance for the above maintenance techniques. The design service life of maintenance refers to the number of years that the maintenance measures expected at the design stage can effectively maintain the technical condition of the pavement, and it is one of the key indicators for assessing whether the effect of preventive maintenance is up to standard. This indicator is a predetermined service life of preventive maintenance technology, which is used to measure the length of time that maintenance measures can slow down the deterioration of pavement performance and maintain its use function under normal use conditions (such as traffic loads, climate environment, etc.). Maintenance frequency refers to the range of times different maintenance techniques are used throughout the life cycle of a highway. This indicator depends on the design service life of the different maintenance techniques and the length of the life cycle of the highway.

2.2. Life Cycle Assessment

2.2.1. Applicability of Life Cycle Assessment

Adhering to ISO 14040 principles [28], the life cycle assessment (LCA) evaluates environmental impacts throughout a product’s life cycle, excluding socio-economic factors, rendering it suitable for pavement maintenance carbon accounting. This study’s LCA, compliant with ISO 14040 and industry carbon assessment standards, comprised four core phases: system boundary definition, inventory analysis, impact assessment, and interpretation. To ensure transparency and comprehensiveness in quantifying maintenance-phase carbon emissions, the analysis encompassed material and construction equipment-related energy consumption and emissions. These were categorized into the following: (1) raw material processing and production, (2) transportation, and (3) mix production and construction. Given that some techniques omit mix production, its associated energy and emissions were incorporated into the construction phase.

2.2.2. Functional Unit and System Boundary

The assessment objective of this study is the energy consumption and GHG emissions per unit during the maintenance of asphalt pavements on Xinjiang highways (units: per 1 km road section or per 103 m2 solid pavement). The representative typical roadway pavement lane distribution selected in this study is shown in Figure 2 for both units.
Different GHGs contribute to Earth’s greenhouse effect in varying degrees. The Fourth Assessment Report of IPCC states that CO2 contributes about 63% of the total warming effect of GHGs, CH4 contributes about 18%, N2O contributes about 6%, and other GHGs account for about 13%. To standardize the results of the overall greenhouse effect, a unit of measure that can compare the emissions of different GHGs is necessary. GHG emissions were converted to CO2 equivalents using IPCC-defined Global Warming Potentials (GWPs) and Carbon Emission Factors (CEFs), and the GWPs of CO2, CH₄, and N2O are shown in Table 2.
Asphalt pavement maintenance involves complex construction processes, diverse material and equipment requirements, and uncertain pavement distress occurrence. Consequently, this study establishes a detailed system boundary based on Xinjiang maintenance project data. The raw material production phase accounts for total energy consumption and carbon emissions of final products, without sub-process disaggregation.
The transportation phase quantifies vehicle fuel-related energy and emissions, excluding traffic delay or vehicle maintenance emissions. The construction phase bases calculations on equipment operational energy and emissions, omitting equipment maintenance. Preventive and corrective maintenance are analyzed separately.
Figure 3 illustrates the system boundaries of this study for the six maintenance methods. The sources of carbon emissions are mostly the energy consumption of the production and processing of raw materials, the fuel consumption of vehicles during the transportation of materials, and the energy consumption of maintenance and construction machineries and mixing stations.

2.2.3. LCI Analysis

This study’s inventory analysis phase comprehensively collects input–output data for Xinjiang highway asphalt pavement maintenance. Its primary objective is to quantify material and energy flows within defined system boundaries. Data obtained from the Xinjiang Uygur Autonomous Region Department of Transportation form the basis for establishing environmental input–output inventories through scientific analysis. The data collected and organized in the raw material production phase are provided in Table 3. It presents material use per unit of targeted preventive maintenance, and the amount of raw material used for MR refers to the construction manual and varies slightly from different sections. Energy consumption and carbon emissions during the raw material production phase largely contain the energy consumption and carbon emissions generated during the whole process ranging from raw material extraction to the production and processing of road construction materials used in highway maintenance.
The source of carbon emissions during the material transportation phase is mostly the energy consumption of transportation vehicles. Given the complex road conditions in Xinjiang, transportation is mostly restricted by speed limits, security checks, and other conditions, and quantifying energy consumption by using transportation vehicle shifts is difficult. Therefore, the current study refers to the “Fuel Consumption Limits and Measurement Methods for Operating Goods Vehicles” (JT/T 719-2016) [29] and estimates the fuel consumption of transportation vehicles through the average distance of transportation. Table 4 provides statistics on the fuel consumption of transportation vehicles.
The types and amount of materials used vary depending on the construction process, requiring the selection of appropriate transportation vehicles for the transportation of materials. The transportation scenarios for each of the maintenance materials used in this study are based on a survey of various maintenance projects, and the average transportation distances for the different materials are shown in Table 5. Notably, various maintenance methods have different transportation phases, and therefore, require different transportation schemes. In grouting type techniques, the raw material can be transported directly from the material plant to the construction section and work can begin immediately. The same condition applies to MS. In MR, the aggregate and binder are transported from the plant to the mixing plant on the road section, where they are mixed and then transported to the construction site. In SGS, mixing and heating are also required, but the process is performed directly in SGS trucks, with an industrial boiler as an auxiliary heating device. Thus, raw materials are transported directly to the construction site.
During the maintenance and construction phases, this study determined all the construction apparatus to be used in the maintenance and construction of Xinjiang highways, their fuel types, and energy consumption per shift through the construction drawings of Xinjiang highway maintenance in the last 3 years and the “Carbon Emission Accounting Regulations for Highway Infrastructure Construction” (DB15/T 2882-2023) [30]. The list of maintenance machineries and equipment is provided in Table 6 and Table 7.

2.3. Calculation Model

2.3.1. Energy Accounting Model for Highway Asphalt Pavement Maintenance

When calculating energy consumption, obtaining the average low-level heat generation of energy is necessary. On the basis of statistical data from IPCC and by referring to the determination method in GB 384 [31] of the “Method for Determining the Calorific Value of Petroleum Products” and the average low-level heat generation of energy in the “General Principles for the Calculation of Comprehensive Energy Consumption” (GB/T 2589-2020) [32], the NCV of the energy selected in the current study is provided in Table 8.
Equation (1) is used to convert the quantity of fuel consumed during each maintenance phase into energy through the net calorific value (NCV) of various energy fuels required to be used in the maintenance of the asphalt pavement of Xinjiang highways.
E = Σ i = 1 n ( E i n × K i )
E —Total energy consumption, MJ;
E i n —Consumption of energy i in phase n, kg or kWh;
K i —Net calorific value of energy source I, MJ·kg−1 or MJ·kWh−1;

2.3.2. Carbon Emissions Accounting Model for Asphalt Pavement Maintenance on Highways

The CEF method, also known as the carbon emission coefficient method, calculates carbon emissions in the production process on the basis of the combustion emission coefficients of different fossil energy sources. This method is applicable to industries that are largely based on energy consumption and requires few basic data for studying carbon emissions. The CEF method is the first carbon emission estimation method proposed by IPCC. It takes the product of activity data (AD) and CEF as the estimated value of carbon emissions. Equation (2) presents the basic formula for carbon emission accounting.
C E = A D × C E F i
AD refers to the specific uses and input of individual carbon sources that are directly related to carbon emissions, such as fuel consumption for transportation and construction equipment. CEFi is the carbon emissions per unit of energy produced during the combustion or use of each energy source (kgCO2e/kg, kgCO2e/kWh).
The CEF was introduced to standardize the calculation process. It represents the mass of greenhouse gases (including CO2, CH4, and N2O) produced per unit of energy consumed. The energy carbon emission factors (Table 9) were determined based on a combination of default values from the IPCC National Inventory Guidelines and regional data from the China Energy Statistics Yearbook. The material carbon emission factor (Table 10) adopts the baseline value of the CLCD database, and is corrected based on the research data of local enterprises in Xinjiang, combined with the relevant literature and industry standards.
The direct sources of carbon emissions during highway maintenance are construction machineries and transportation vehicles, while the indirect sources are road construction materials. In this study, the PLCA method was used to quantify the total carbon emissions of construction materials and machinery per unit project phase using the bill of quantities and the critical carbon emission factor (CEF). A life cycle assessment-based model was established for highway construction emissions, encompassing material production, transportation, and construction phases. The total process emissions (Equation (3)) constitute the sum of material and machinery emissions across these phases.
C T o t a l = Σ n i = 1 Q i F i + Σ n i = 1 Σ q t = 1 Σ l k = 1 D i C i t E k t f k + Σ m j = 1 Σ l k = 1 T j P k j f k
C T o t a l —Carbon emissions from the entire road construction process, kgCO2e/kg;
i —Type of road construction material, I = 1, 2, 3, …, n;
t —Type of transport vehicle, t = 1, 2, 3, …, q;
j —Type of construction machinery, j = 1, 2, 3, …, m;
k —Type of energy, k = 1, 2, 3, …, l;
Q i —Total consumption of road-building material type i, kg;
F i —Carbon emission factor for the production process of the ith road construction material, kgCO2e/kg;
D i —Average transportation distance of road-building material type i, km;
C i t —Number of vehicles t required for transportation of material type i;
E k t —Consumption of energy k per 100km for vehicle type t;
T j —Consumption of the jth type of construction equipment unit used;
P k j —Consumption of the kth energy source by the jth type of construction machine per unit shift, t;
f k —Carbon emission factor from the kth energy source, kgCO2e/kg.
Parameters such as transportation distance (Table 5) and material consumption (Table 3) in the model are derived from the field research data of the Xinjiang maintenance project in 2021–2023, reflecting the regional specificity, while the consumption of machinery units is calibrated by construction logs.

3. Results

3.1. Energy Consumption Analysis

3.1.1. Energy Consumption in the Raw Material Production Phase

In 2011, the European Association of Bitumen Producers published the energy consumption and emission inventories of bitumen, which have been used in some articles for evaluating GHG emissions from highway projects [15,33,34]. However, differing production patterns, supply chains, and energy mixes result in variations in the energy consumption and greenhouse gas (GHG) emissions of asphalt production both internationally and among Chinese manufacturers. Currently, standardized energy consumption and GHG emission data for China’s asphalt production are lacking. Consequently, Chinese researchers have analyzed data from 26 domestic manufacturers to quantify the carbon emissions of road maintenance [24]. Several scholars also calculated energy consumption data by referring to basic data from the China Energy Statistical Yearbook [35] and combining them with standards, such as General Silicate Cement (GB 175-2007) [36], Limit of Energy Consumption per Unit Product of Cement (GB 16780-2007) [37], and Cleaner Production Standard-Petroleum Refining Industry (Asphalt) (HJ 443-2008) [38]. The current study combines existing research results and the Chinese Life Cycle Database (CLCD) to obtain energy consumption per unit of energy and raw material production for road maintenance, as indicated in Table 11. Among them, the definition of the energy consumption of raw material production is the energy consumption of the production process of the energy consumed to produce the raw material and the energy required for raw work.
Based on the preceding data, the energy consumption of each maintenance method during the raw material production phase is quantitatively calculated in the current study. Among them, the source of unit energy consumption for grouting type technology, MS, and SGS is relatively clear. MR technology results in differences in energy consumption in various road sections due to the differences in pavement structure and milling depth. Therefore, in this study, the average energy consumption of raw material production for different pavement structural layers was calculated using the above selected typical road sections as representatives.
Figure 4 compares raw material production energy consumption across maintenance methods. TS exhibits the lowest energy intensity (5.1% of HAG) due to operational simplicity and minimal material usage. HAG has a much higher asphalt requirement than TS but uses 45% of the energy of SG. This is due to the fact that SG is used for larger crack widths and requires the use of mineral powder, which leads to higher energy consumption. The relatively high material use makes SG the most energy intensive of the crack repair techniques, but only 21.7% and 7.5% of MS and SGS, respectively. The MS uses 1.8 times more coarse aggregate than SGS, with the addition of the use of cement. Nevertheless, MS exhibits lower energy consumption than SGS, only 34.7% of SGS. This stems from the higher energy consumption required for producing SBS-modified asphalt compared to emulsified asphalt, which is approximately 3.74 times greater.
In engineering practice, MR is typically confined to asphalt pavement upper/middle layers. Given MR’s substantially higher material consumption than preventive techniques, its energy demand vastly exceeds them. The most energy-intensive preventive method (SGS) consumed merely 38.75% of MR’s average energy across eight sections. Additionally, milling a 30 cm cement-stabilized gravel layer (137,367 MJ) contributes significantly to MR’s energy burden under severe pavement damage scenarios.

3.1.2. Energy Consumption in the Material Transportation Phase

Figure 5 compares a variety of preventive maintenance techniques, with MS technique exhibits the highest energy consumption during transportation, followed by SGS at approximately 46.9% of MS level. This disparity is primarily attributable to MS requiring twice the quantity of aggregates compared to SGS, resulting in proportionally elevated transportation energy consumption. Among the Crack repair techniques, HAG exhibits the highest energy consumption, i.e., SG is the second highest, i.e., 60% of that of HAG. TS consumes the least energy, i.e., only 36.1% of HAG. Obviously, a crack repair type of technology uses much less energy for transportation than MS and SGS.
Figure 6 compares material transportation energy consumption in MR, where aggregate (64.1%) and asphalt (22.6%) constitute the dominant shares. When addressing cement-stabilized gravel layers, their material transport energy requires separate consideration. Although cement and water transport account for only 4.9% of total energy, gravel and mix transport exceeds the structural layer’s total energy by 10%. This disparity is attributable to the layer’s 1.8–3 times greater thickness than surface courses, necessitating significantly increased haulage demand.

3.1.3. Energy Consumption in the Construction Phase

Figure 7a compares preventive maintenance method energy consumption, revealing that MS exhibits the highest intensity as it is 1.61-, 4.03-, and 4.36-fold greater than SGS, HAG, and SG, respectively. This disparity primarily stems from MS’s elevated construction-phase machinery energy intensity. The MS-specific sealing truck (SX5315XJFC, Shacman, Xi’an, China) and thin-slurry sealer (2.5–3.5 m) exhibit a unit energy consumption that is 2.77 and 3.76 times higher than SGS’s synchronized gravel sealing truck. Concurrently, other MS equipment demonstrates a significantly higher energy demand than SGS. Despite SGS requiring mix heating (coal combustion constituting 66.6% of its total energy), its aggregate consumption remains below MS. Among crack repair techniques, TS relies predominantly on manual labor with negligible equipment energy (portable blower only). HAG consumes marginally more energy than SG (1.08 times), attributable to the lower efficiency of its asphalt grouting machine versus SG’s 100 DH grouting equipment, which offsets SG’s trenching energy penalty.
Figure 7b illustrates the energy consumption of MR for eight road sections. MR has the highest level of energy consumption, with an average unit energy consumption of about 43.8 times that of HAG, 10.8 times that of MS, and 17.5 times that of SGS compared with preventive maintenance, MR involves the mixing, paving, and compaction of the mixture, and thus, it is considerably more complex than preventive maintenance in terms of the maintenance process and the use of mechanical equipment. The figure shows that about 80% of the energy consumption comes from heavy fuel oil and 4.4% from electricity. Heavy fuel oil and electricity are mainly used in the mixing phase, so it can be seen that mixing is the most important source of energy consumption in the construction phase.

3.2. Carbon Emissions Analysis

3.2.1. Carbon Emissions in the Raw Material Production Phase

Figure 8a compares the carbon emissions of various maintenance techniques at the raw material production phase. The carbon emissions of the different maintenance techniques vary significantly, from highest to lowest for MS, SGS, SG, HAG, and TS. The data indicate that the unit carbon emission of sealing with patch tape is the least, and the carbon emission per 103 m of sealing is only 45.32 kgCO2e, while the carbon emissions of HAG and SG are 3.6 times and 3.7 times that of TS, respectively.
Notably, carbon emissions from asphalt are significantly higher than those from aggregate production during the material production phase. In SGS, carbon emissions from modified asphalt production account for 58.4% of total carbon emissions, with the other larger portion of emissions originating from coal combustion in the production of asphalt, and only a small portion of carbon emissions originates from the aggregate production process. In addition, the amount of cement used in MS treatment is considerably smaller than other materials, only 20% of the amount of emulsified asphalt, but the proportion of carbon emissions is as high as 25.7%. After further comparison, the carbon emissions of MS technology during the aggregate production phase were 23.46 times higher than that of SGS and 6 times higher than that of SG. This outcome stems principally from the incorporation of cement as a filler component in MS, given that cement production generates 8.7-fold higher carbon emissions per ton than mineral powder and 337-fold higher emissions than crushed stone production.
Figure 8b illustrates the carbon emissions of MR during the raw material production phase. In the resurfacing process, the carbon emissions from the permeable and tacky layers are relatively low. Meanwhile, carbon emissions from the structural layer are mostly from aggregates and asphalt, and they increase in approximately equal steps with an increase in the thickness of the structural layer. However, the average thickness of the 5% cement stabilized gravel layer in the actual project is 30 cm, so the carbon emissions of this structural layer are much higher than the other structural layers, which is about five times that of the asphalt concrete surface layer.

3.2.2. Carbon Emissions in the Material Transportation Phase

Figure 9 compares the difference in carbon emissions between the various maintenance techniques during the material transportation phase. The crack repair category is significantly lower than the other preventive maintenance techniques, with TS, HAG, and SG emitting only 3.5%, 9.7%, and 5.8% of the carbon emissions of MS, respectively. This result is due to the fact that the crack repair technologies require relatively fewer types and quantities of raw materials and therefore produce less carbon emissions. Surprisingly, the carbon emissions from transportation for SGS are only 50% of those for MS, since MS transports about twice as much aggregate as SGS.
Typically, compared with preventive maintenance techniques, the transportation carbon emissions of MR are 6.24 and 12.5 times that of MS and SGS, respectively. When some of the work required milling and resurfacing with cement-stabilized gravel, the carbon emissions were 13.8 and 27.6 times higher than those of MS and SGS, respectively. By comparison, we found that the transportation carbon emissions of aggregates and asphalt accounted for 55.5% and 22.5% of the total emissions, respectively, and were the main factors in the transportation carbon emissions of MR. In the transportation of cement-stabilized gravel layer materials, the transportation carbon emissions of aggregates accounted for 53.8% of the total carbon emissions. Surprisingly, transportation carbon emissions from the mixing plant to the construction site accounted for 37.7%, which can be reduced by adjusting the location of the mixing plant.

3.2.3. Carbon Emissions in the Maintenance Phase

During the preventive maintenance construction phase, the source of carbon emissions is largely maintenance machineries, such as tire loaders, asphalt pavement grooving machines, rollers, and MS sealing trucks. The major types of energy consumed are gasoline, diesel fuel, and heavy fuel oil, with electricity consumption accounting for a relatively small proportion.
As shown in Figure 10a, the carbon emissions of the five preventive maintenance techniques are listed below in descending order: MS, SGS, HAG, SG, and TS. Among the crack repair techniques, TS is largely manual and has negligible carbon emissions. Meanwhile, the carbon emissions of HAG and SG are not extremely different, but unexpectedly, SG, which has one more grooving process than HAG, has 6.9% less carbon emissions than HAG. Compared with the grouting type of technology, the carbon emissions of MS are about 4 times that of HAG and 4.3 times that of SG. The carbon emissions of SGS are about 3.6 and 3.8 times that of the two grouting technologies, respectively. SGS has a greater variety of construction equipment than MS, but pavement construction consumes fewer benches. The carbon emissions are therefore about 88.4% of those of MS, with about 77.5% of the emissions coming from coal combustion for heating.
Figure 10b shows the average carbon emissions of eight typical road sections with different structural layers of MR, and the sources of carbon emissions are also mainly the energy consumption of construction machinery and mixing stations. The difference in the carbon emissions of typical road sections is mainly affected by the thickness of the structural layer, and the carbon emissions are roughly proportional to the thickness. Due to the large amount of work at this phase, the carbon emissions per unit area is much higher than that of preventive maintenance. MR construction includes the milling and resurfacing of the old pavement, mixing of asphalt concrete, and in some special cases, the mixing and milling and resurfacing of cement-stabilized sand and gravel layers are also considered. Among them, the mixing phase accounts for approximately 87% of total carbon emissions, constituting the primary emission source in pavement construction. This predominance stems from the substantial heavy oil and electricity consumption by mixing plants.

3.3. Characterization of Energy Consumption and Carbon Emissions

3.3.1. Life Cycle Energy Consumption and Carbon Emissions Statistics

Life cycle maintenance of Xinjiang highway asphalt pavements necessitates the integrated determination of technology application timing and frequency based on climatic characteristics, traffic loads, and pavement distress progression patterns. Preventive techniques follow a sequential implementation protocol: TS or HAG for incipient cracking, MS or SGS for moderate deterioration, and MR for structural damage in advanced stages. Notably, crack repair techniques (TS/HAG) are ubiquitously applied throughout the service life, typically during intervals between MS, SGS, or MR applications. Similarly, MS and SGS interventions occur between MR cycles, although targeting distinct roadway sections. By synthesizing region-specific technology service lives, maintenance frequencies, and the previously quantified energy/emission intensities, this study derives comprehensive life cycle maintenance energy consumption and carbon emission inventories for Xinjiang highways.

3.3.2. Characterization of Energy Consumption

Table 12 lists the unit energy consumption (MJ/km or 103 m2) and life cycle energy consumption (MJ) of the six conservation techniques. Combined with the comparative analysis in Section 3.1, the differences in energy consumption between the conservation techniques are significant. Considering the energy intensity, MR is undoubtedly the technique with the highest energy consumption. Whereas SGS was the most energy intensive preventive conservation technique, MS ranked third with 84.3% of the energy consumption of SGS. It is followed by SG, HAG, and TS with an energy consumption of 20.1%, 16%, and 1.2% of SGS, respectively. Considering the whole life cycle, the difference in energy consumption between the maintenance techniques varies significantly. The MR technique still consumes the highest amount of energy and some of the projects involve the milling and resurfacing of the cement-stabilized gravel layer, which makes the total energy consumption much higher. Among the preventive maintenance techniques, MS became the most energy-intensive technique, followed by SGS, due to the fact that MS has a wider range of application scenarios than SGS in the region and accounts for a larger portion of the life cycle. The ranking of energy consumption in the crack repair category also changed, with HAG surpassing SG. The life cycle energy consumption rankings of preventive maintenance technologies are as follows: MS > SGS > HAG > SG > TS, MS consumes 4.4, 21.3, 32, and 415.9 times more energy than them, respectively. Surprisingly, even so the life cycle energy consumption of MS is only about 10% that of MR.
In the raw material production phase, for the six conservation technologies TS (20%), HAG (30%), SG (52.9%), MS (27.1%), SGS (66%), and MR (27%), the percentage of energy consumption varies considerably, but it is still evident that this phase is one of the main sources of energy consumption. The energy consumption of all types of asphalt is much higher than that of aggregates, and the unit energy consumption is 75–238 times higher than that of aggregates. Reducing the energy consumption of asphalt at this phase is a key strategy, especially for high-energy products such as SBS-modified asphalt. Finding low energy consumption asphalt or reducing the proportion of high energy consumption asphalt used is an important optimization strategy. In addition, using low-energy fillers instead of cement is an effective way to reduce energy consumption in this phase.
The transportation phase consumes the least amount of energy overall, with the following percentages of energy consumption in the full life cycle perspective: TS (77.8%), HAG (16.4%), SG (7.82%), MS (32.06%), SGS (12.7%), and MR (24.6%). The energy consumption in this phase comes from a single source, which is mainly affected by the weight of raw materials, transportation distance, and fuel consumption of transportation vehicles. Separately, the relatively large share of TS transportation energy consumption is due to the minimal use of materials and very low construction energy consumption. MS is due to the effect of high inputs of emulsified asphalt and aggregate and long transportation distances.
The energy consumption in the construction phase is slightly lower than in the raw material production phase, with the following percentages of energy consumption in the full life cycle perspective: TS (1.9%), HAG (53.5%), SG (39.2%), MS (40.8%), SGS (21.3%), and MR (48.4%). The higher energy consumption in this phase is related to the fact that the mixing phase is considered within the construction in this paper. It is clear that the energy consumption of maintenance techniques involving mixing or heating is much higher in this phase.

3.3.3. Characterization of Carbon Emissions

Table 13 shows the carbon emission intensity (kgCO2e/km or 103 m2) and life cycle carbon emissions (kgCO2e) of the six maintenance technologies. Combined with the comparative analysis in 3.12, the carbon emissions of the various maintenance technologies are very different from each other, and there is also a large difference in the percentage of energy consumption compared to the percentage of each phase. In terms of carbon emission intensity, MR is still the technology with the highest carbon emissions. MS is in second place and has about 30% higher carbon emissions than those calculated by Ma et al. (2021) [24], mainly due to the longer distances over which materials are transported in Xinjiang. SGS is in third place, with a carbon emission intensity that is 81.7% that of MS. It is worth noting that the carbon emissions from SGS are comparable to the study by Zhu et al. (2023) [39], which further supports the accuracy of this study. It is followed by HAG, SG, and TS with carbon emissions of 15.5%, 14.4%, and 2.6% of MS, respectively. From the perspective of the whole life cycle, the carbon emissions of different conservation technologies vary greatly, but surprisingly, the ranking of the total carbon emissions of different conservation technologies is consistent with the ranking of carbon emission intensity, which is still MR > MS > SGS > HAG > SG > TS, and the carbon emissions of MR technology are much higher than other technologies.
At the raw material production phase, the share of carbon emissions from the six conservation technologies is as follows: TS (71.3%), HAG (43.3%), SG (47.6%), MS (52%), SGS (57.6%), and MR (47.5%). The sources of carbon emissions in this phase are mainly the production and processing of asphalt and aggregates. For preventive maintenance works, the carbon emissions from all types of asphalt production and processing are significantly higher than those from aggregate production. It is also worth noting that although only about 20% of the works require milling and resurfacing to the cement-stabilized gravel layer, the life cycle carbon emissions from this layer reach 54% of the surface layer. This is largely due to the high carbon emissions of cement, although it is used in just 8% of the aggregate.
At the transportation phase, the overall carbon emissions are relatively low: TS (27.4%), HAG (12.7%), SG (8.2%), MS (20.3%), SGS (12.4%), and MR (16.6%). The source of carbon emissions in this phase is mainly the fuel consumption of transportation vehicles, and the carbon emissions are greatly affected by the transportation distance. When the demand for raw materials changes, the choice of transportation vehicles and the amount put into use will also significantly change the total carbon emissions in the transportation phase.
The construction phase is the second largest contributor to overall carbon emissions: TS (1.3%), HAG (44%), SG (44.2%), MS (27.7%), SGS (30%), and MR (35.9%). The sources of carbon emissions in this phase are mainly the fuel consumption, electricity consumption, and part of the coal consumption of construction equipment, and asphalt mixture mixing and heating generate a large amount of carbon emissions in this phase. Efficient construction organization can effectively reduce the carbon emissions in the construction phase.
With the continuous progress of the material production process, the rapid development of photovoltaic power generation, and the use of new energy equipment, the carbon emission factor of various raw materials and energy sources fluctuates, and there are some differences in the statistical measurement of the carbon emission factor in different countries and regions. Therefore, assumptions are made on the changes in the carbon emission factors of major materials and energy sources, and a sensitivity analysis is conducted on the life cycle carbon emissions of highway maintenance in Xinjiang, as shown in Figure 11. The analysis results show that cement and emulsified asphalt have the most significant impact on maintenance life cycle carbon emissions, which is significantly higher than the impact of other materials. In addition to this, gasoline and diesel have a higher sensitivity to preventing maintenance carbon emissions, and heavy oil has a higher sensitivity to restoration and maintenance works, followed closely by diesel and gasoline impacts. Aggregates have a very low sensitivity to carbon emission factors, which are themselves much lower than all types of asphalt and energy, despite their high input use.

4. Discussion

In recent years, various industries in China have made sustained efforts to realize the dual-carbon goal. Highway maintenance, as one of the important tasks in the transportation industry, must also accelerate its pace in energy saving and emission reduction and in realizing the goal of green transportation. Therefore, the accounting of carbon emission baseline value for road maintenance is particularly important. At present, the LCA is a commonly used tool for assessing carbon emissions from road maintenance, and its combination with the CEF method of accounting for carbon emissions has been recognized in the industry.
In this study, the unit energy consumption and carbon emissions of six commonly used conservation technologies in Xinjiang were critically assessed from the perspective of the LCA. An assessment framework and calculation model through the PLCA were also designed to measure the energy consumption and carbon emissions of each maintenance material and different maintenance phases. In this manner, the baseline value of the carbon emissions of the six maintenance technologies were accounted for in a more refined manner, laying a solid foundation for finding the typical links of carbon emission reduction and exploring the potential of carbon emission reduction. Moreover, the first step is taken toward realizing the energy-saving, emission-reduction, and dual-carbon goals of Xinjiang’s highway maintenance industry.
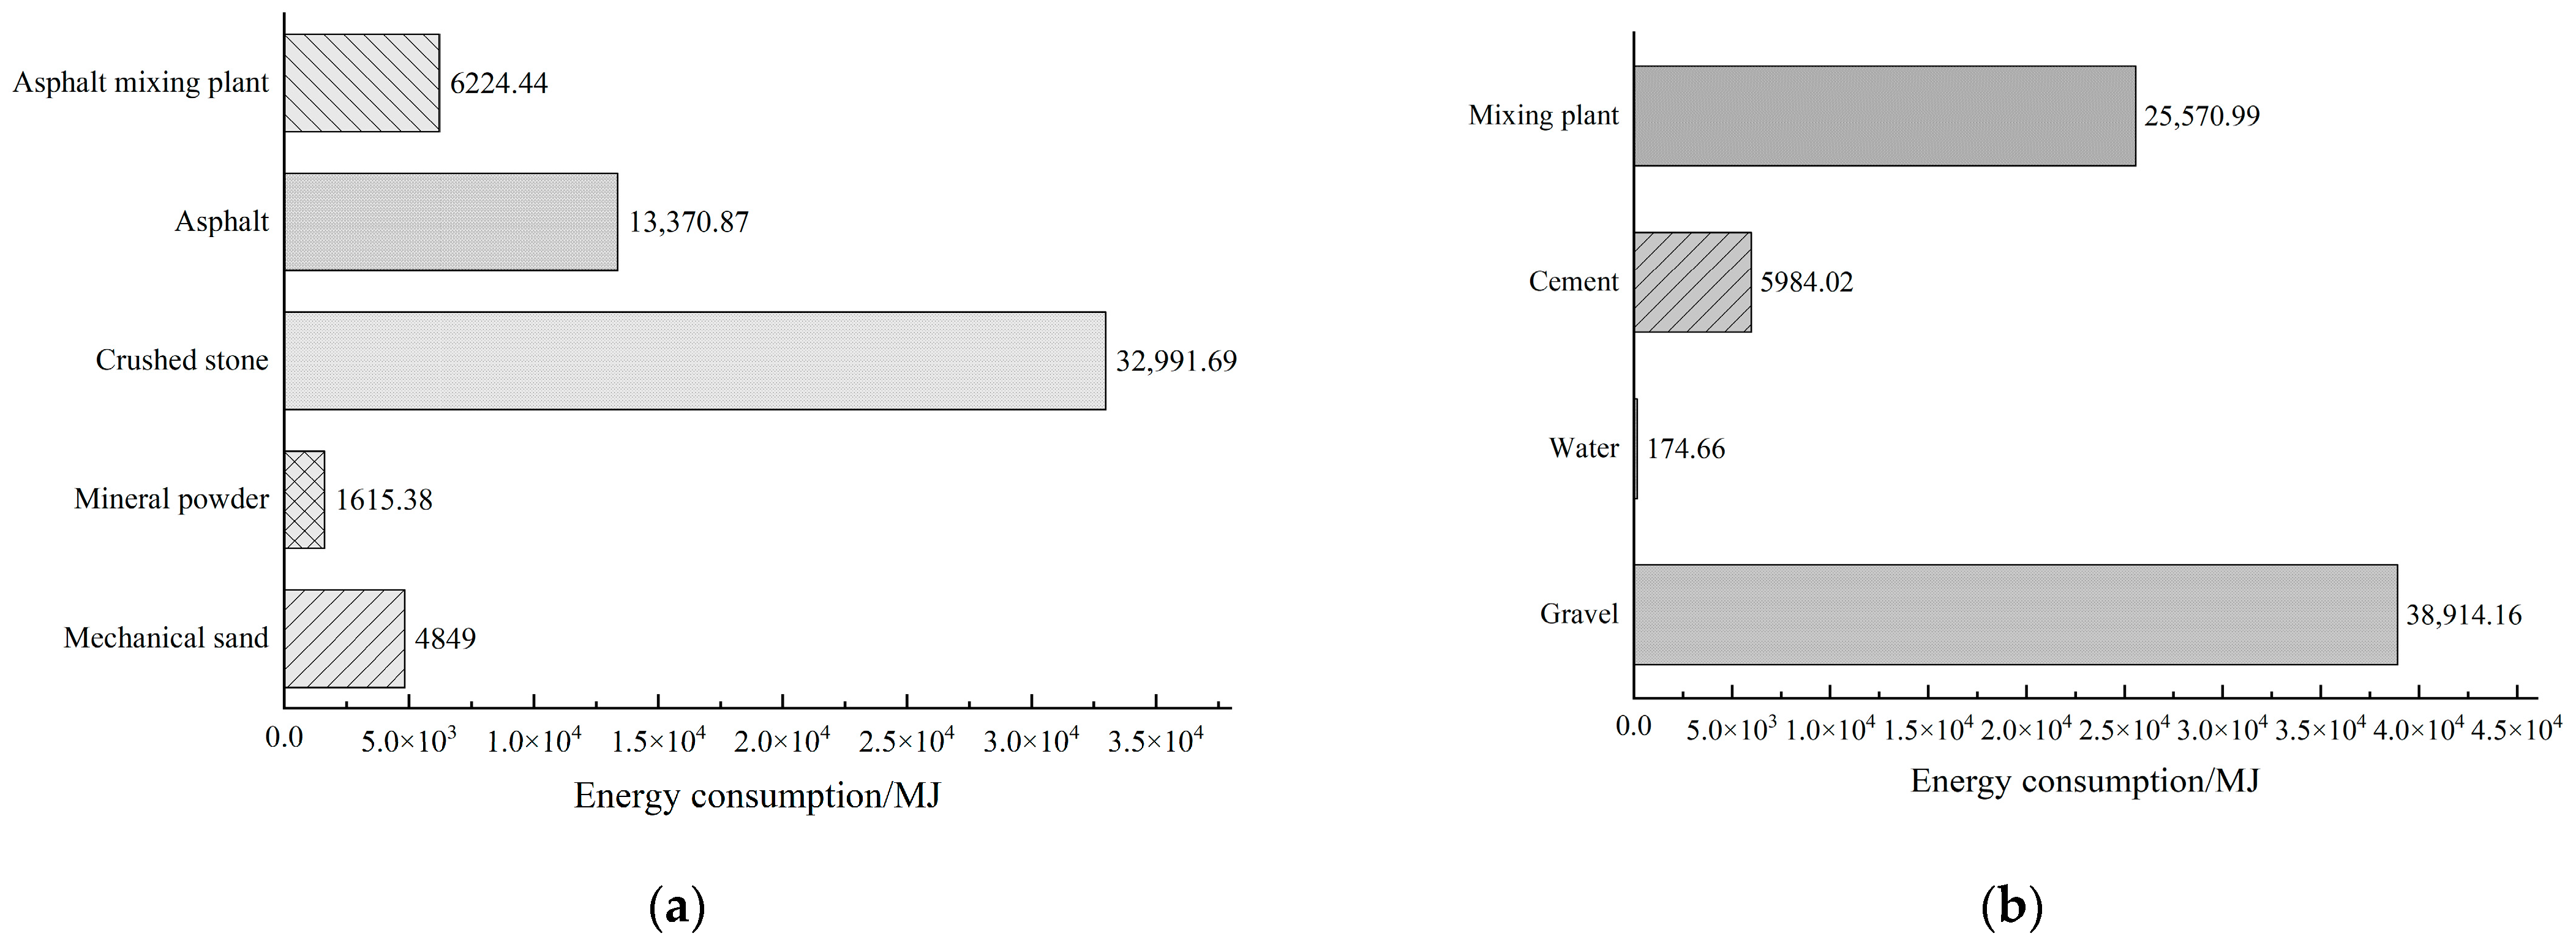
At the raw material production phase, the six types of conservation technologies have the highest levels of combined energy consumption and carbon emissions; this result is basically consistent with the research viewpoints of Liu et al. (2022) [40] and coincides with the ideas of Ma et al. (2021) [24]. Although the grouting type of technology during the raw material production phase of carbon emissions is not high, the use of polymer grouting repair technology in highway maintenance projects can significantly reduce CO2 emissions per km by 76.1% and 87.3%, respectively [41]. In addition, an interesting phenomenon is that some materials that are used in small quantities, such as cement, produce high emissions. The study is also precisely in line with Liu et al. (2019) [42]. Furthermore, the researchers found that incorporating phosphogypsum into cement-stabilized asphalt pavement base layers resulted in significant material production benefits: a 48.0% reduction in energy consumption and a 67.5% reduction in carbon emissions. The optimized formulation achieved a synergistic reuse of recycled asphalt pavement (RAP) and phosphogypsum, reducing the need for mineral aggregates by 44.3% and petroleum asphalt by 6.9%, while reducing the landfill footprint by 16.859 m2 [43]. This finding highlights the considerable advantages and potential of optimized material selection in terms of carbon reduction.
Transportation contributed the lowest emissions, primarily influenced by material volume and distance, with a strong positive correlation between these factors and carbon emissions. Currently, the promotion of alternative power systems, such as hybrid, electric, and fuel cell vehicles, provides a broad opportunity to reduce fuel consumption and greenhouse gas emissions [44]. Although new energy vehicles have been rapidly developed in recent years, transportation vehicles still use fossil energy as their most important power source. Therefore, improving the transportation efficiency and shortening the transportation distance are the keys to reduce carbon emissions. For the Xinjiang region, promoting the construction of local asphalt modification plants (e.g., Karamay, Dushanzi) and aggregate processing bases in Xinjiang can shorten the transportation distance to 100–300 km and reduce the transportation carbon emissions by 12–37%.
The construction phase ranked second among the three phases in terms of overall energy consumption and carbon emissions. Compared with the material production and transportation phases, the construction phase has a higher feasibility of emission reduction techniques and a greater potential to reduce carbon emissions. Carbon emission reduction in the conservation and construction phase can start from optimizing the construction process, improving the efficiency of construction machinery, and making reasonable construction planning. At the same time, the recycling process has been proven as a technology for achieving sustainable development in infrastructure construction. Recycled hot mix asphalt (HMA) mixtures that contain RAP are considered environment-friendly materials for the base and binder layers of highways; they are capable of reducing CO2 emissions by 28–39% during the production cycle [45]. Furthermore, waste plastics serve as a low-carbon asphalt mix additive, and the addition of polyethylene terephthalate (PET) to pavements can reduce life cycle costs and carbon emissions by 26.2% [46]. Finally, carbon reductions can also be achieved by increasing the use of clean energy in the heating and mixing phases of asphalt mixtures, optimizing pavement design and machinery maintenance.
Finally, although the LCA methodology itself is not the first of its kind in this study, the core innovation of this work lies in the fact that the empirical calibration for Xinjiang (e.g., modification of long-distance transportation parameters, introduction of localized material production data) and the proposal of a synergistic multi-technology emission reduction pathway provide actionable decision support for the low-carbon transition of pavement maintenance in arid and cold regions.

5. Conclusions

In this study, the life cycle analysis (PLCA) method was introduced into the carbon emission measurement and accounting of asphalt pavement maintenance, and the energy consumption and carbon emissions of six commonly used asphalt pavement maintenance technologies (TS, HAG, SG, MS, SGS, and MR) in Xinjiang were comprehensively accounted for and analyzed. The study not only establishes a carbon emissions accounting model based on the PLCA method, calculates and derives the baseline value of carbon emission per unit for the six maintenance technologies, but also clearly elucidates the sources of energy consumption and carbon emission characteristics of each maintenance technology in the phases of raw material production, transportation, and construction. Finally, based on the results of the study, some suggestions are made on how to reduce the carbon emissions at each phase. The main conclusions are as follows:
(1)
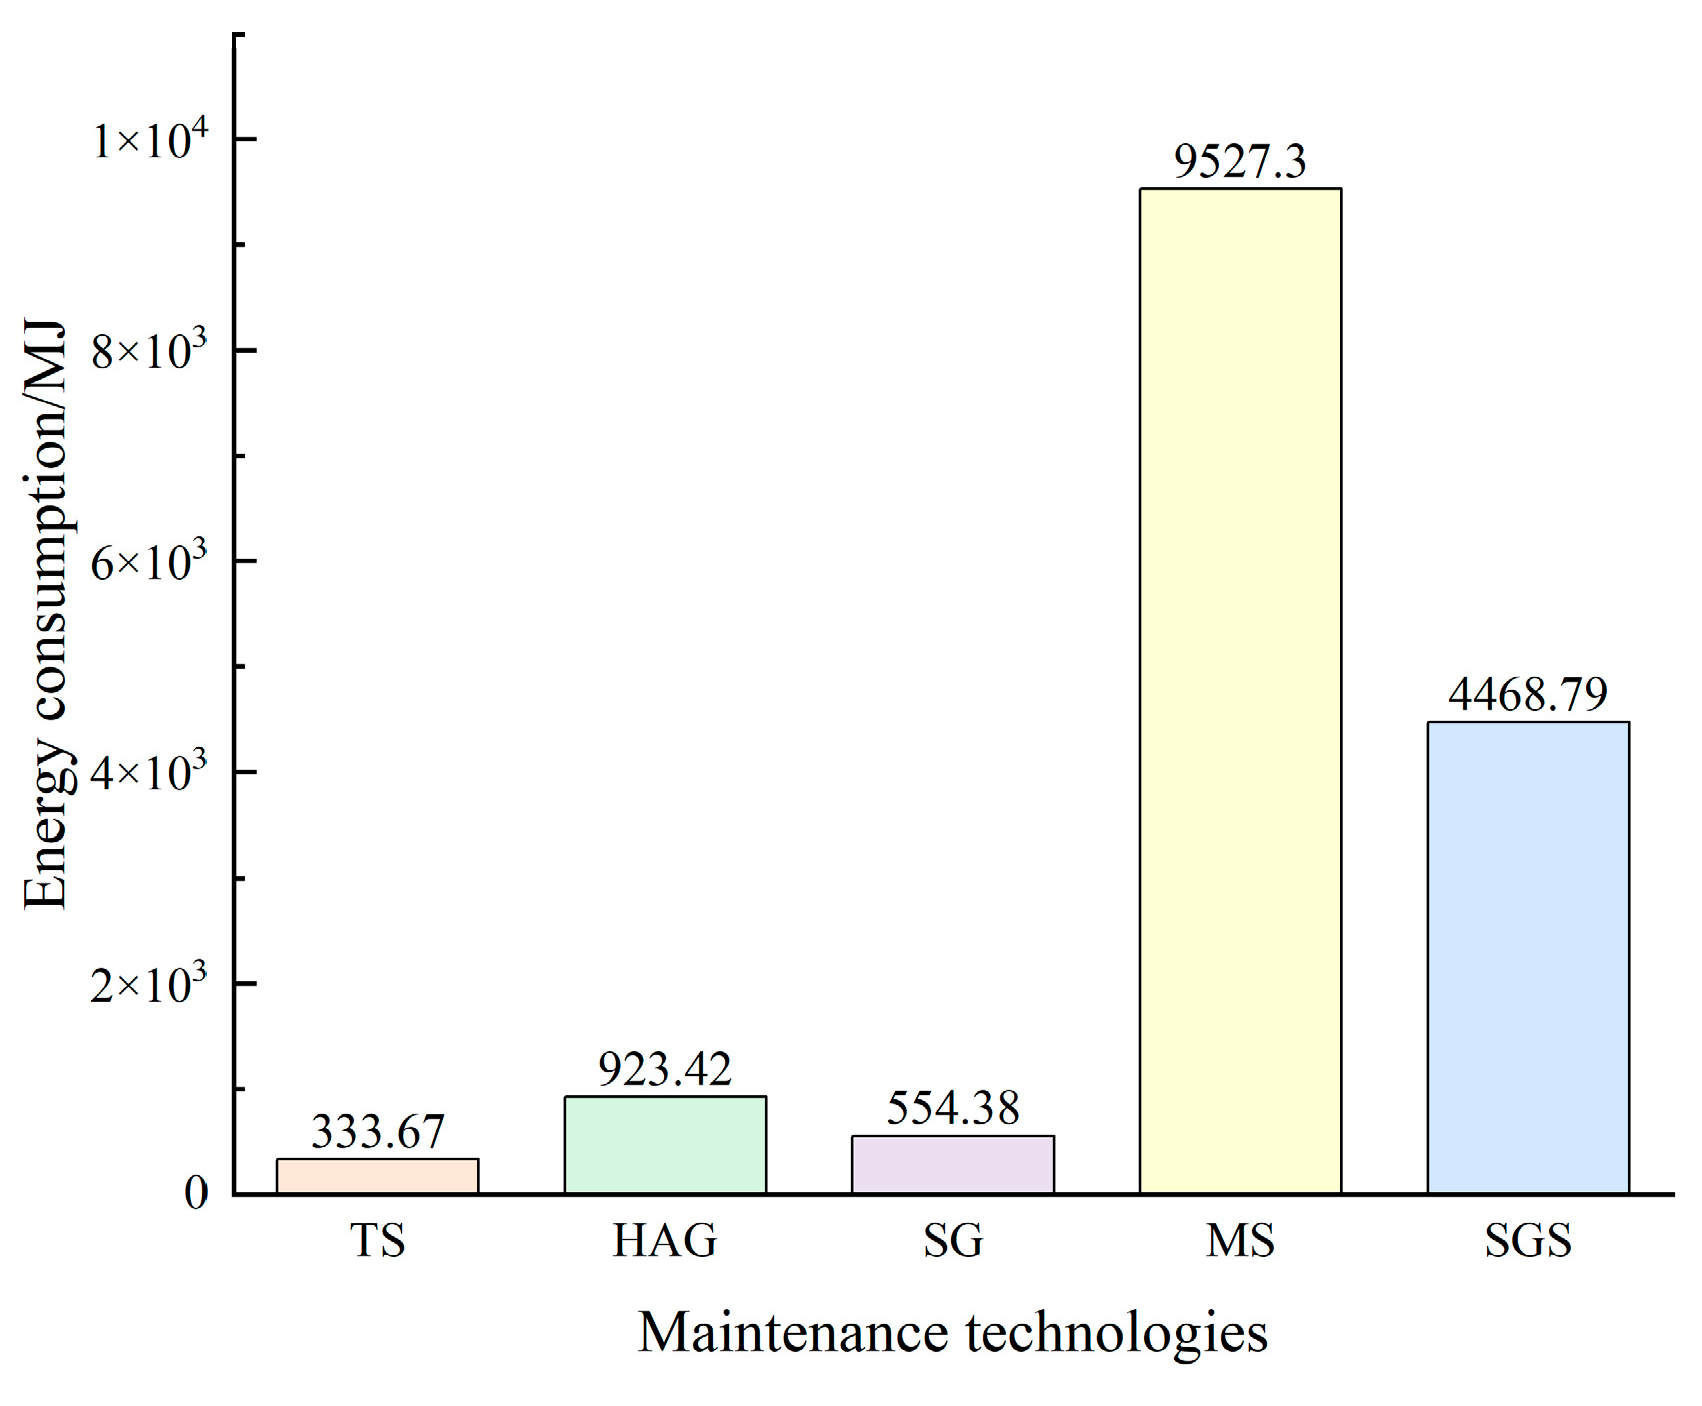
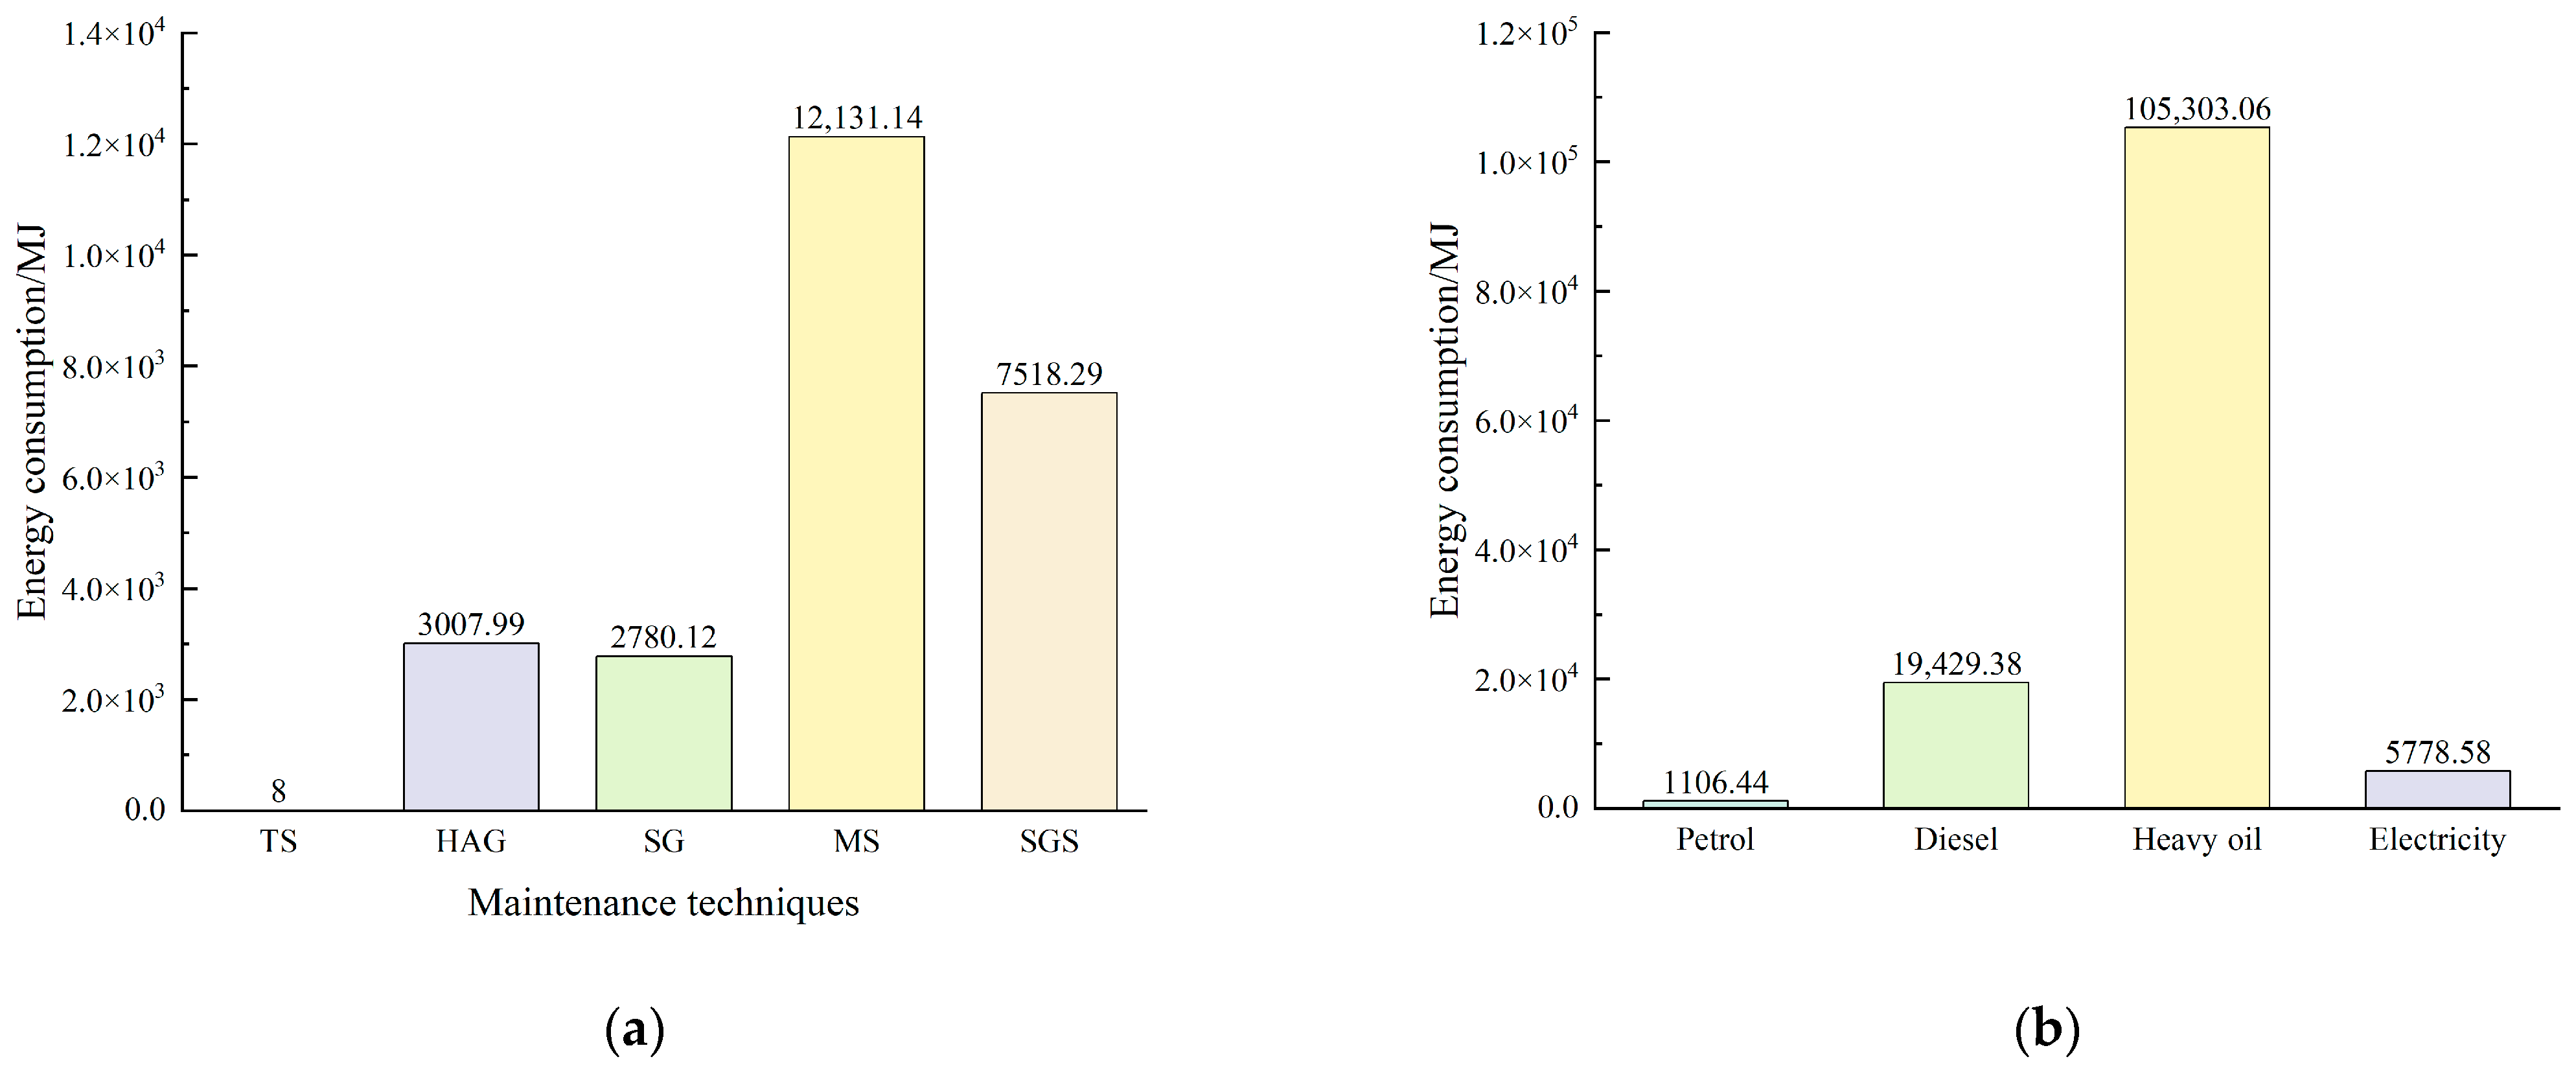
Substantial variations exist in energy and carbon emission intensity across the six techniques: The rankings of energy consumption and carbon emissions per unit of the six asphalt pavement maintenance techniques, as measured by the PLCA method, were as follows: TS (428.17 MJ/km, 63.53 kgCO2e/km) < HAG (5624.85 MJ/km, 378.98 kgCO2e/km) < SG (7086.19 MJ/km, 352.39 kgCO2e/km) < MS (29,719.24 MJ/103 m2, 2444.42 kgCO2e/103m2) < SGS (35,244.16 MJ/103m2, 1997.2 kgCO2e/103m2) ≪ MR (250,809 MJ/103m2, 15,095.67 kgCO2e/103 m2). Taking the whole life cycle of a 20 km highway as an example, the total energy consumption reaches 135,212,302.6 MJ, and the total carbon emissions are 10,558.4 tCO2e, which provides data support for the low-carbon maintenance strategy of highways in Xinjiang.
(2)
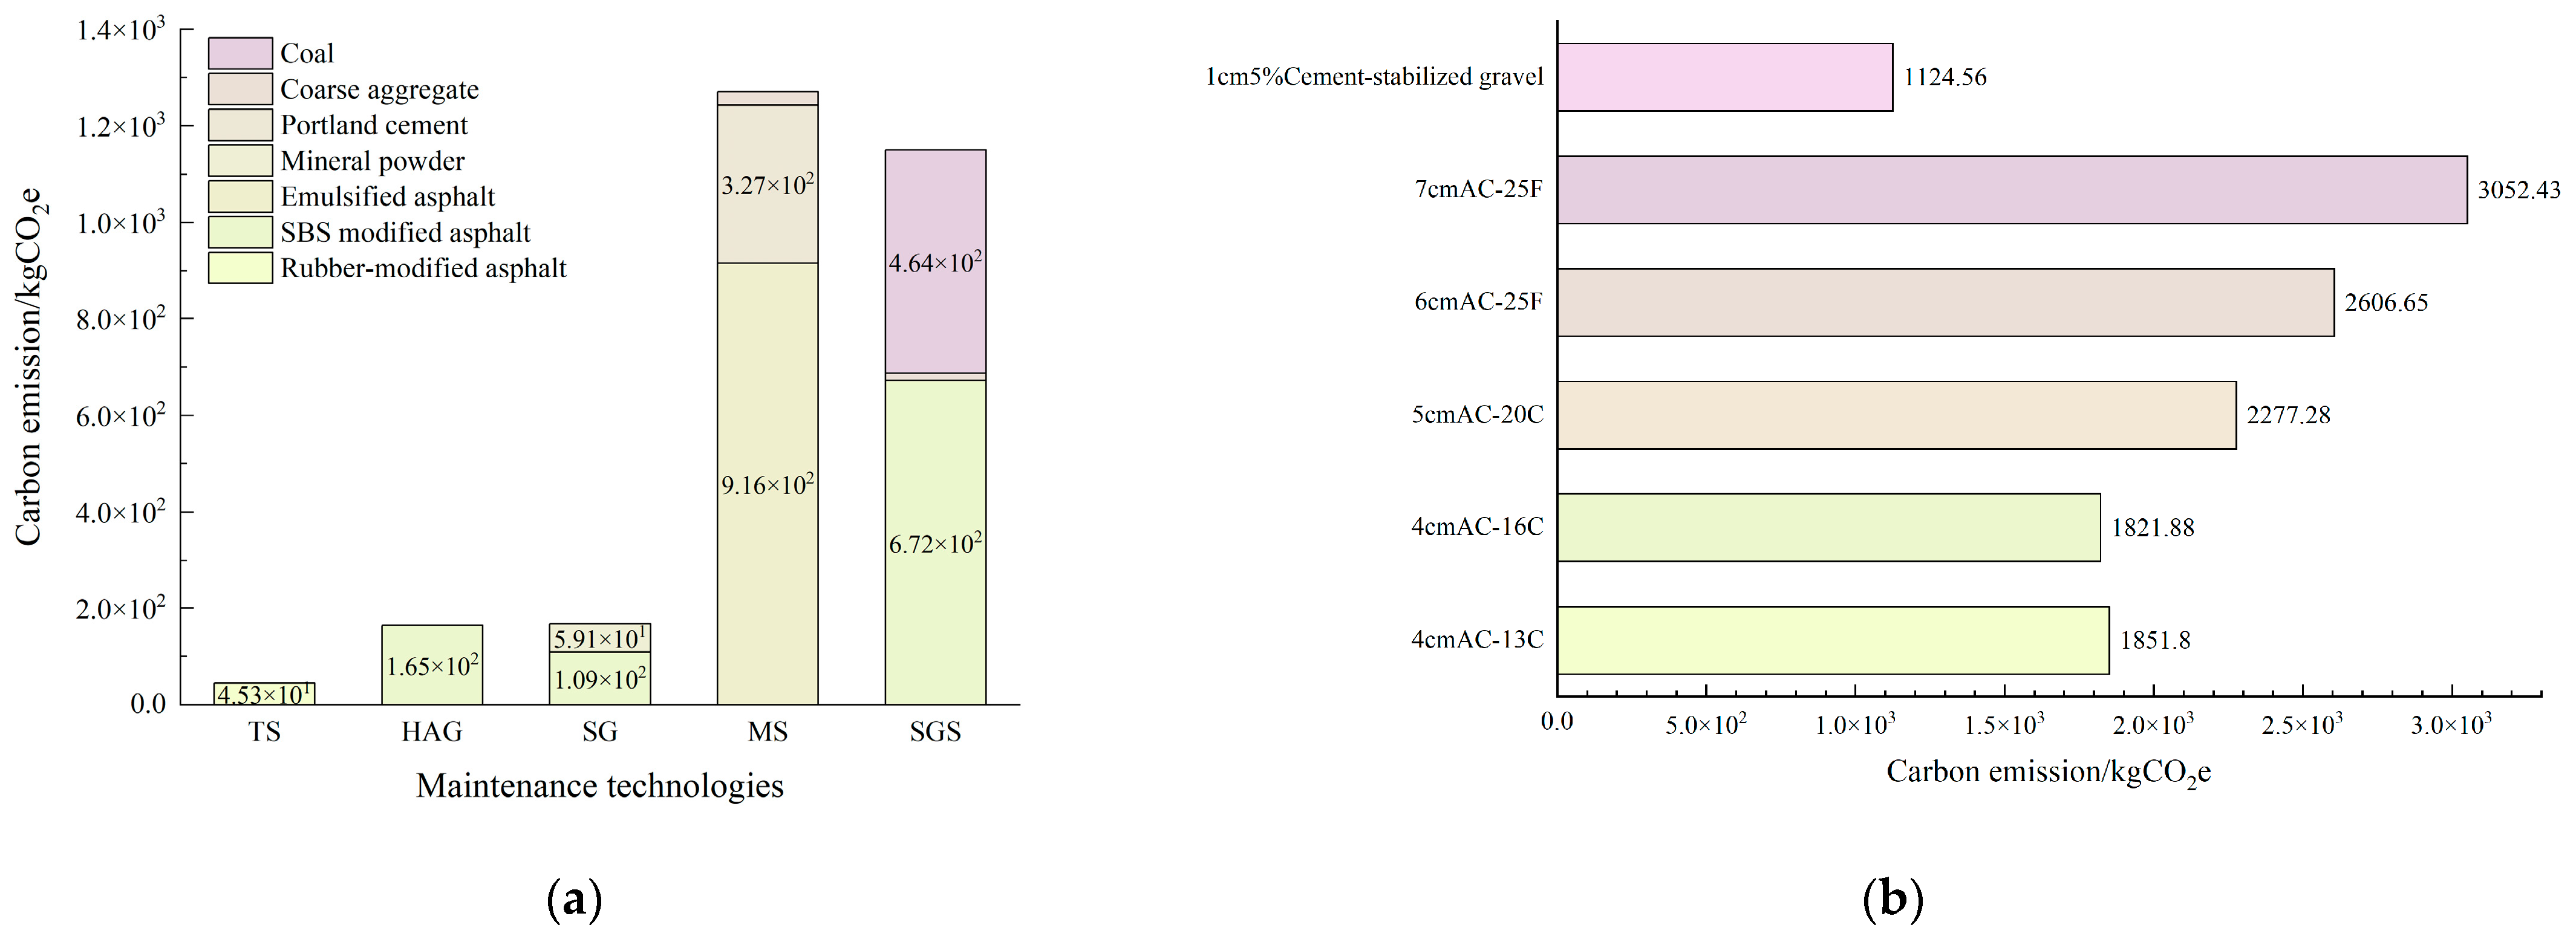
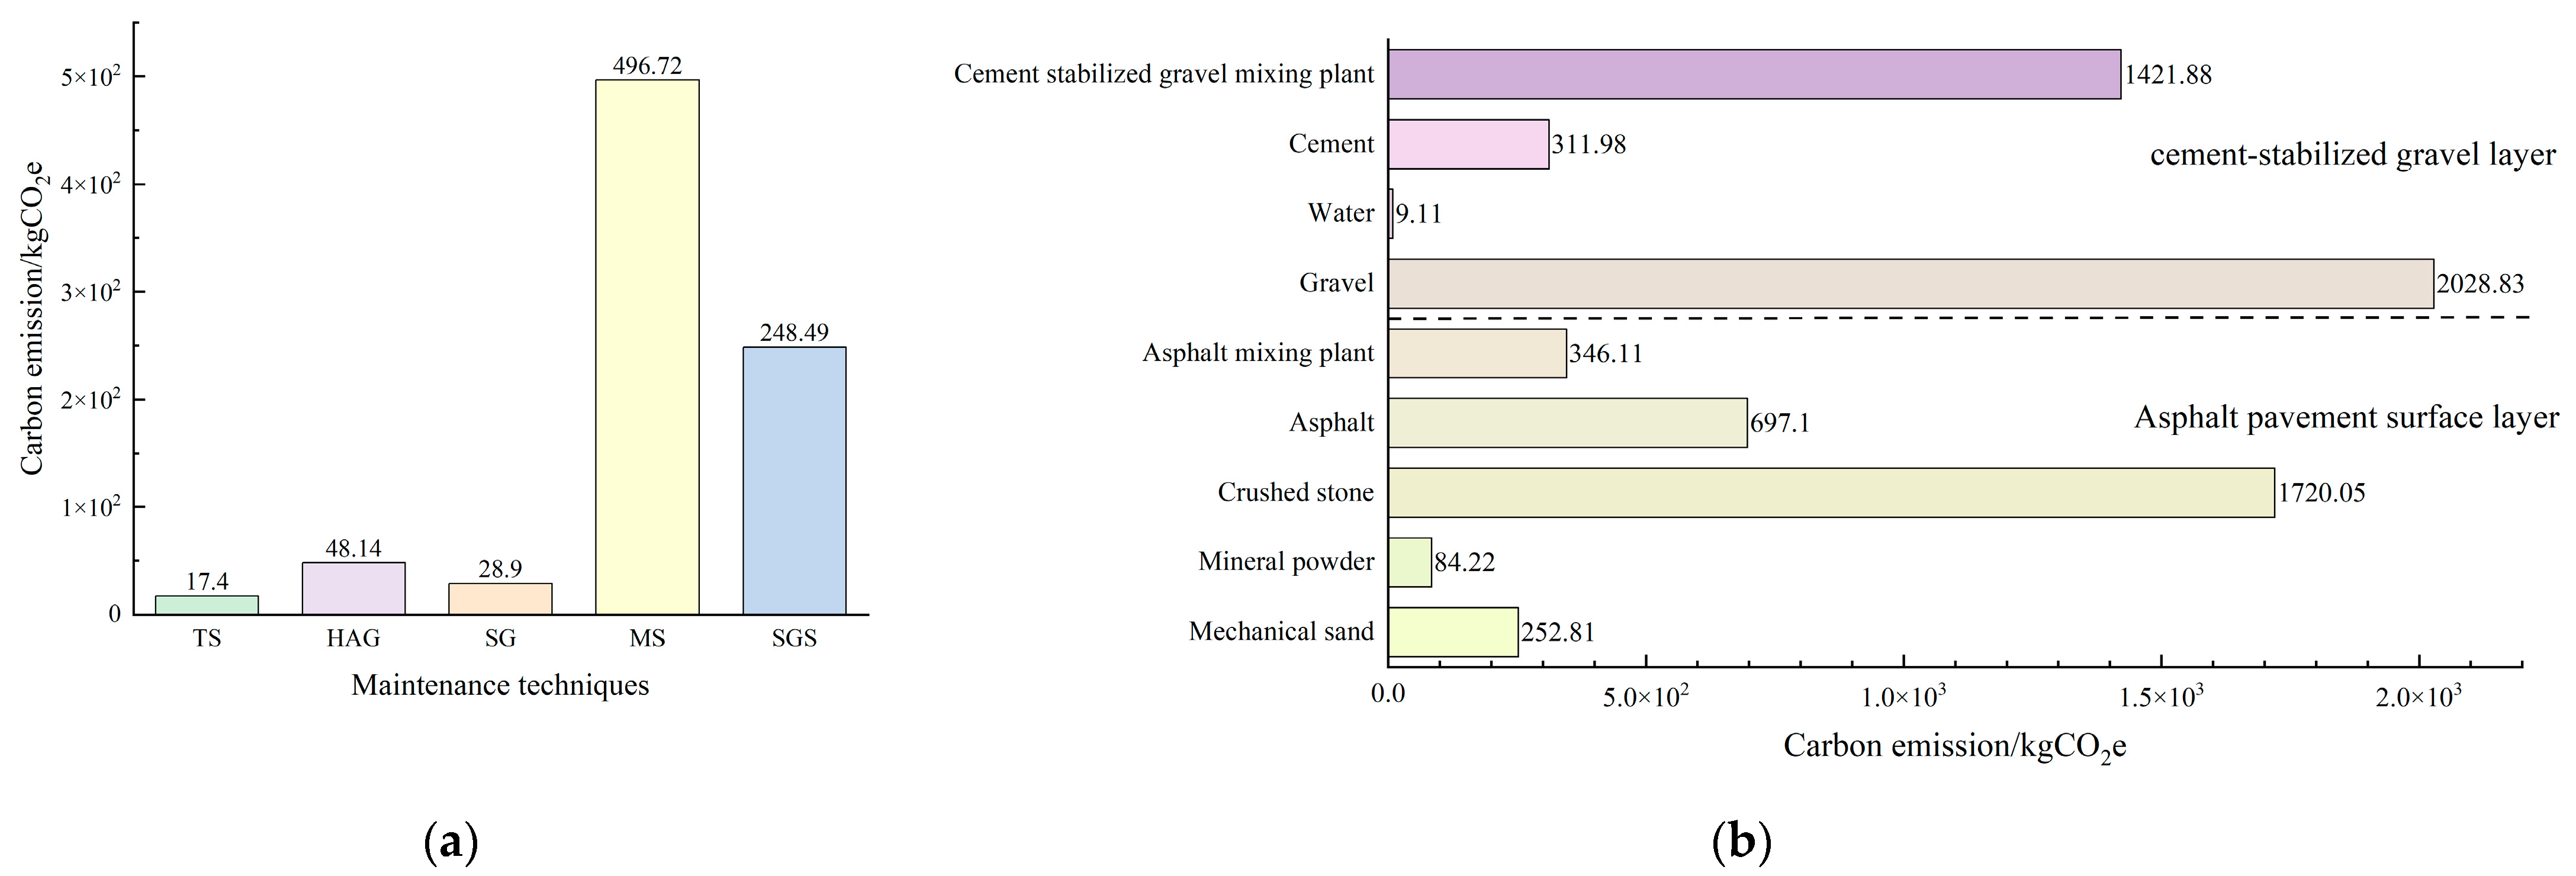
The raw material production phase is the main source of carbon emissions: it contributes 40–60% to the carbon emissions of the six technologies, with the production of cement (735 kgCO2e/t) and asphalt (270–412 kgCO2e/t) being the key links. For example, although the amount of cement used in MS technology is only 20% of emulsified asphalt, its carbon emissions account for 25.7%, and the carbon emissions from the production of modified bitumen in SGS technology account for 58.4%. In addition, the MR technology, which involves the milling of a cement-stabilized gravel layer, can have five times the carbon emissions of an asphalt surface layer.
(3)
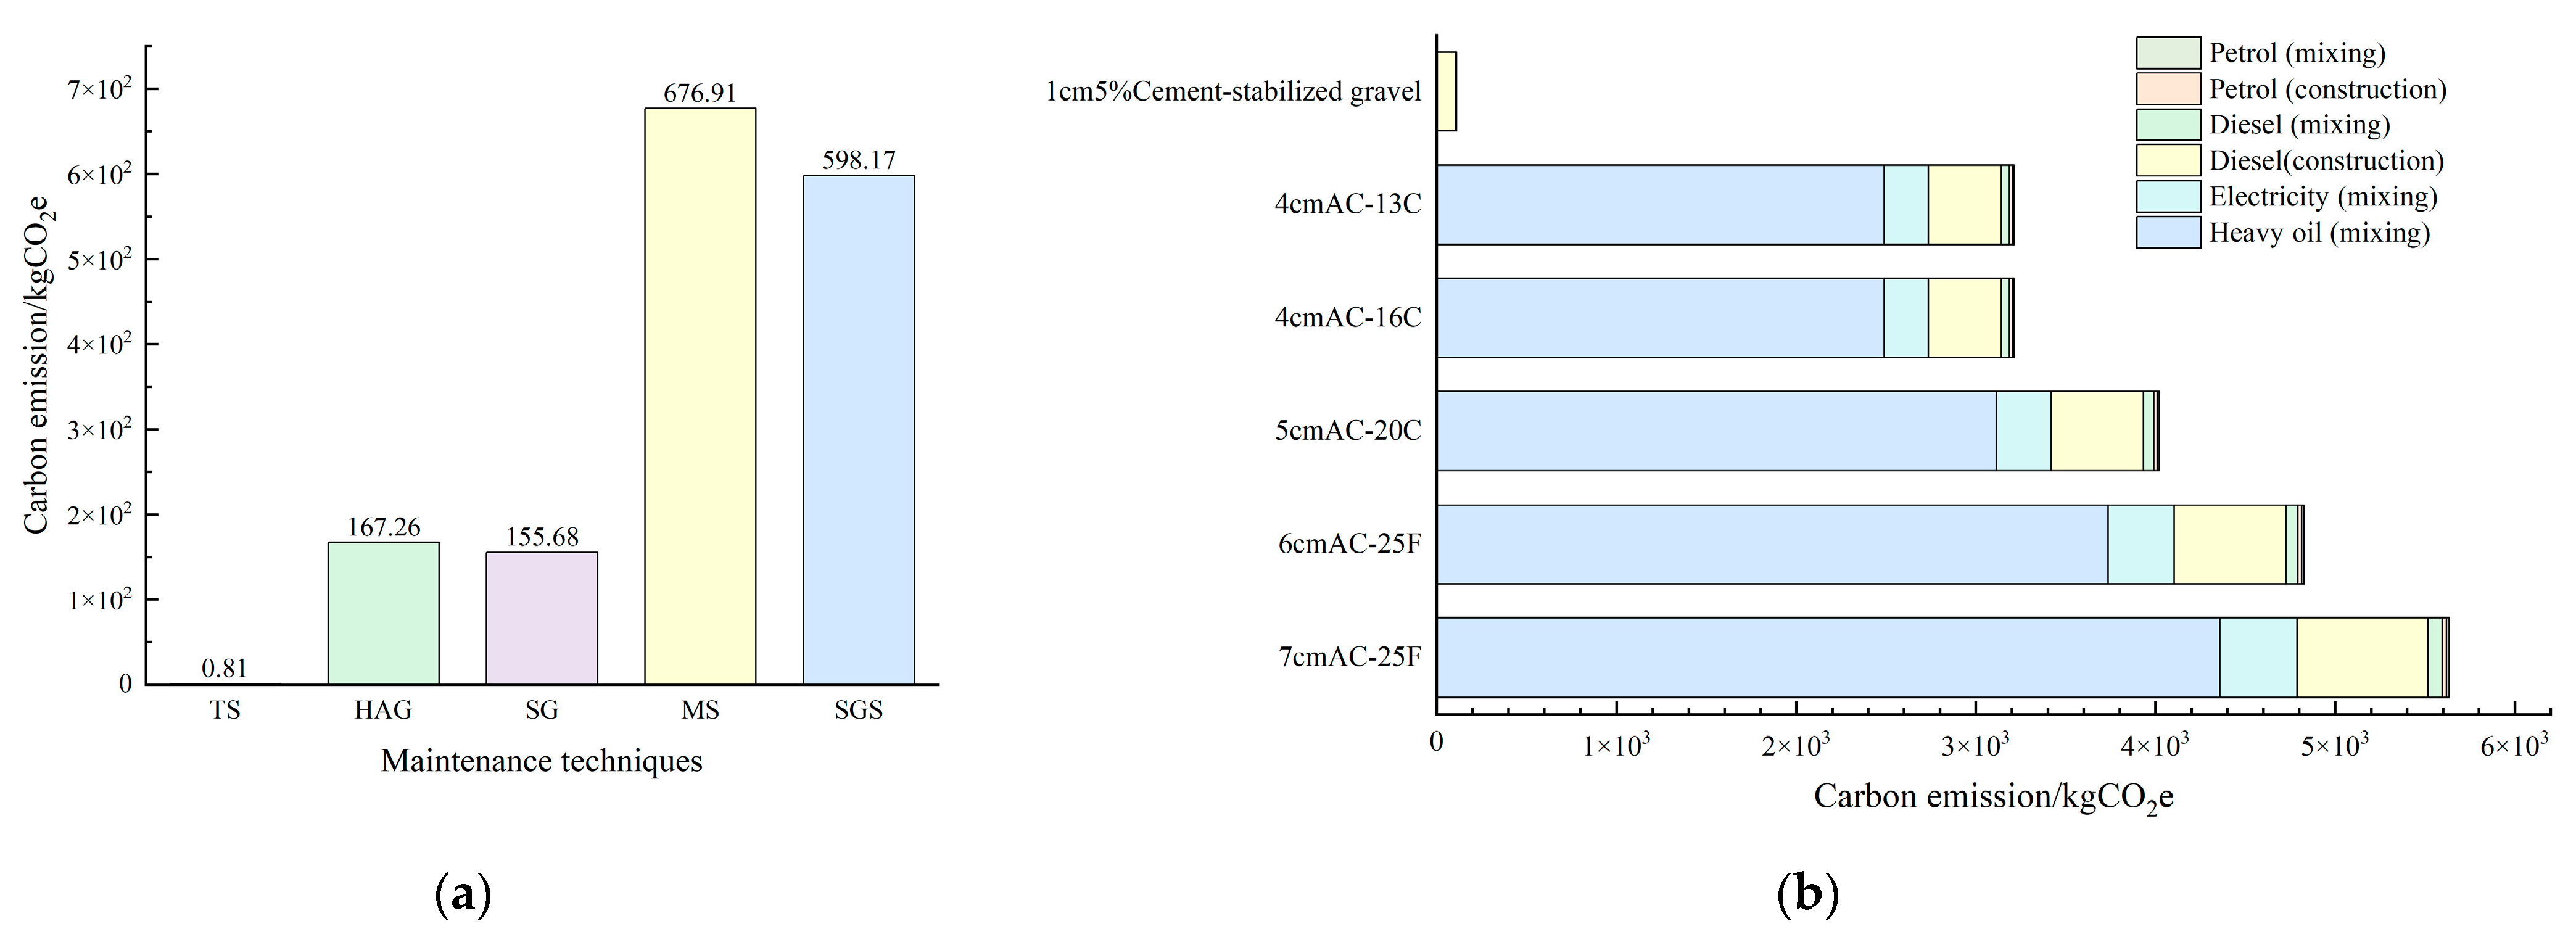
The influence factors of carbon emissions in the transportation and construction phases are clear: the carbon emissions in the transportation phase are positively correlated with the amount of materials used and the transportation distance, e.g., the transportation carbon emissions of MR technology are 6.24 times that of MS, and if the transportation distance is optimized to 100–300 km, the carbon emissions can be reduced by 12–37%. The construction phase has the highest energy consumption per unit and potential for emission reduction, and optimizing the efficiency of construction processes and equipment can significantly reduce emissions. The mixing process (e.g., MR accounts for 87% of construction emissions) is a key target for optimization.
(4)
Preventive maintenance technologies have significant low-carbon advantages: compared with MR, TS, HAG, and other preventive maintenance technologies can reduce carbon emissions by 76–87%. In terms of the whole life cycle, MS and SGS, due to their wide range of application scenarios, have a total energy consumption ranking of MS > SGS > HAG > SG > TS, but even so, the life cycle energy consumption of MS is only 10% that of MR. This suggests that promoting preventive maintenance is a core strategy to realize low-carbon maintenance of highways. It is suggested to match maintenance techniques with the phase of pavement distress (TS and HAG for early phase, MS and GS for middle phase, and MR for late phase) to maximize the benefits of emission reduction.
(5)
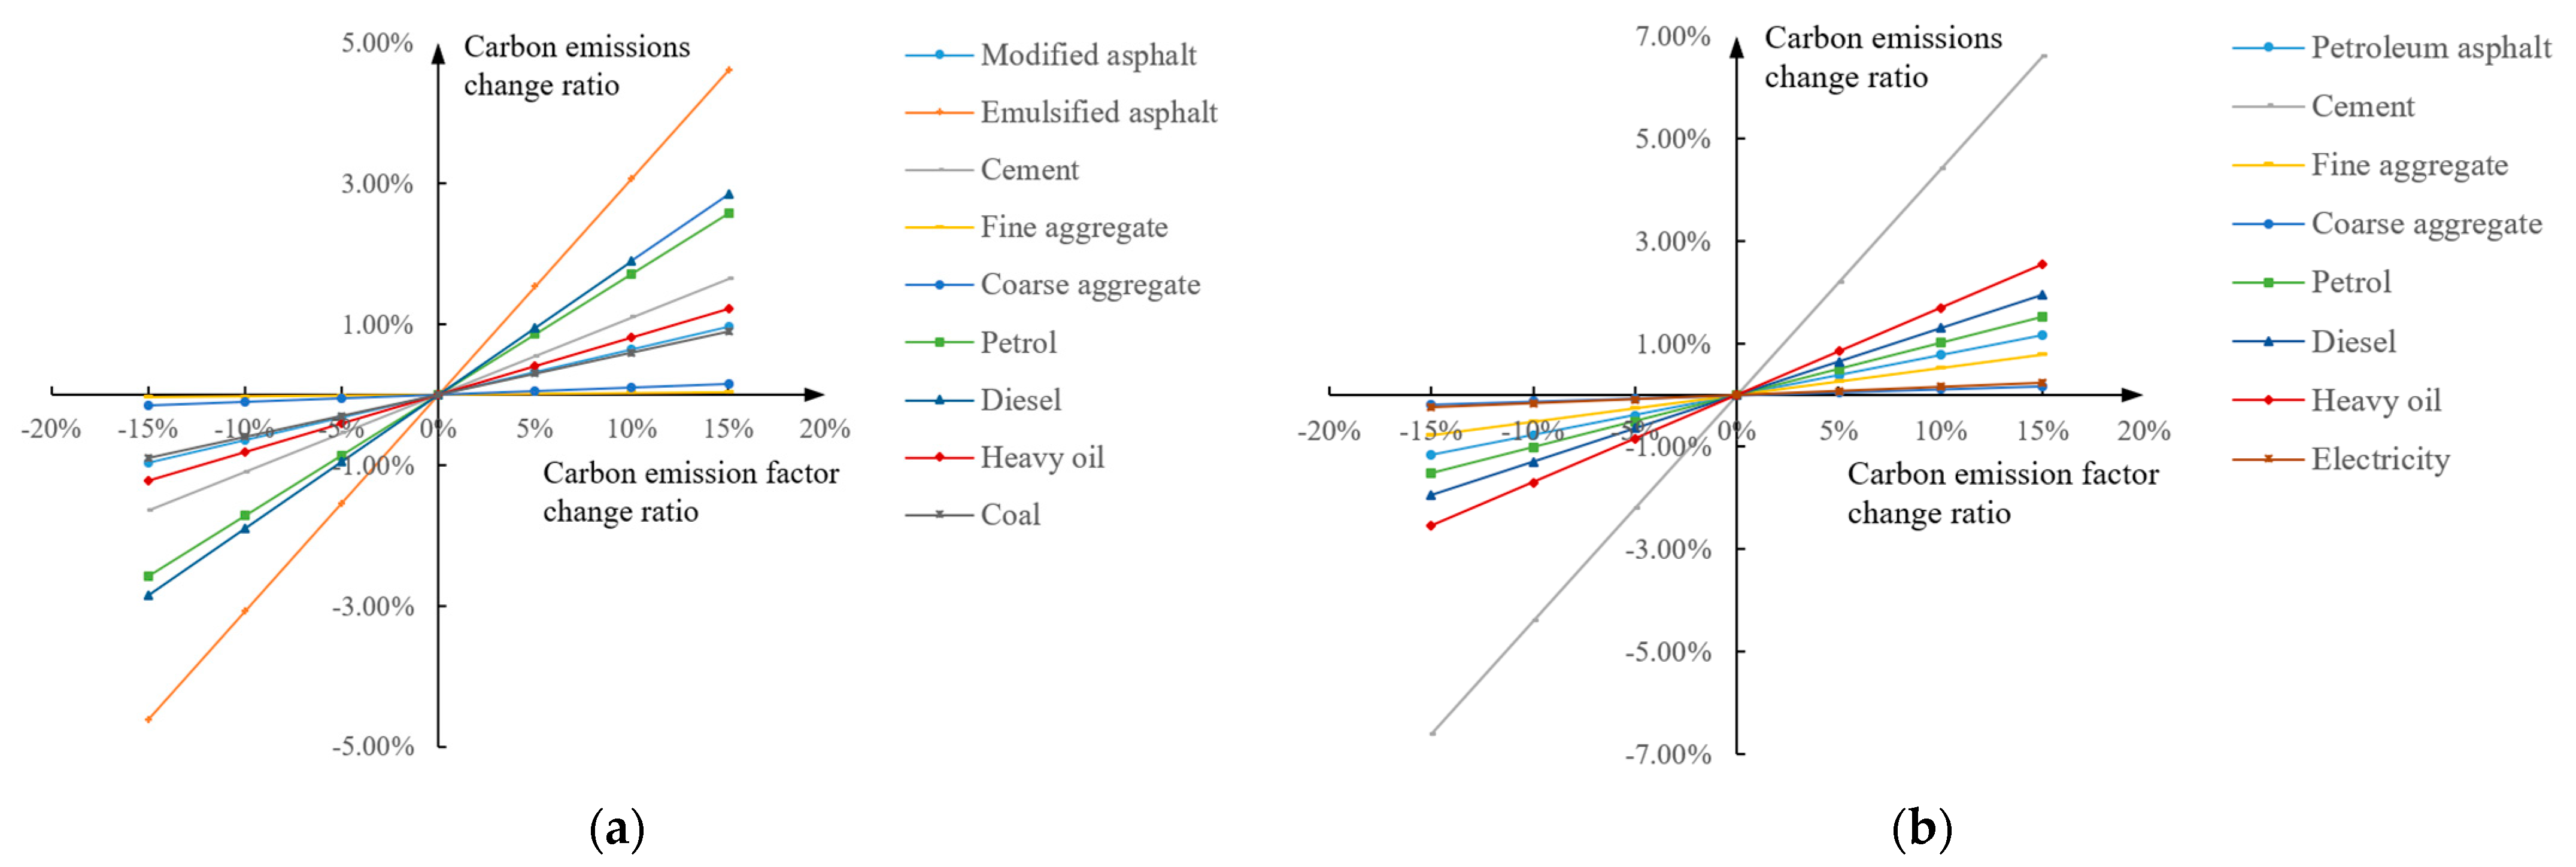
Material optimization and process improvement are the key paths to emission reduction; sensitivity analysis reveals that the carbon emission factors of cement and emulsified asphalt have the greatest overall impact. It is suggested that the use of phosphogypsum to replace cement (which reduces carbon emissions by 67.5%), the use of recycled asphalt materials (which reduces emissions by 28–39%), as well as the promotion of electric construction equipment and optimization of mixing plant sites can reduce transportation emissions by 37.7%. In addition, the use of skeleton void structures to reduce the amount of asphalt used is also effective in reducing whole-life carbon emissions.
In conclusion, this study accounts for and analyzes the energy consumption and carbon emissions of the most representative maintenance techniques in Xinjiang, and finally proposes strategies to reduce carbon emissions, including optimizing material composition, using low-emission asphalt binder, avoiding the use of high-emission fillers, and adopting a skeleton void structure to reduce the demand for binder and aggregate. In this study, a PLCA accounting framework adapted to the geographical characteristics of Xinjiang was constructed for the first time, solving the problem of missing conservation data in cold and arid areas. And for the first time, it quantitatively compares the differences in whole life cycle carbon emissions of six typical maintenance technologies under Xinjiang conditions, and improves the applicability of the model in the western region through localized parameter validation The research result not only provides a scientific basis and practical guidance for the Xinjiang highway asphalt pavement maintenance industry in the selection of materials, optimization of construction technology, and formulation of the low-carbon maintenance strategy, but also has important theoretical and practical significance for promoting the realization of energy saving, emission reduction, and green transportation in the region, and even in the country. However, this study’s findings are region-specific to Xinjiang, China, and their generalizability may be limited by omitted life cycle phases (e.g., machinery production) and reliance on aggregated data. Future research should expand to diverse regions, integrate real-time monitoring for dynamic assessments, and explore emerging technologies (e.g., bio-binders, electric equipment), while addressing uncertainties through stochastic modeling and policy-aligned frameworks to advance sustainable pavement maintenance globally.

Author Contributions

Conceptualization, X.D. and L.Z.; methodology, X.D.; software, L.Z.; validation, B.W., W.T. and X.D.; formal analysis, W.T. and B.W.; investigation, L.Z. and W.T.; resources, W.T.; data curation, B.W.; writing—original draft preparation, X.D. and L.Z.; writing—review and editing, X.D. and B.W.; visualization, L.Z.; supervision, B.W.; project administration, W.T. and X.D.; funding acquisition, X.D. All authors have read and agreed to the published version of the manuscript.

Funding

This research was funded by the Xinjiang Transportation Investment Group Supported Project, grant number EKXFWCG2024040202, and Xinjiang Natural Science Foundation, grant number: 2024D01A53, and the Xinjiang Uygur Autonomous Region “Dr. Tian chi” Project.

Institutional Review Board Statement

Not applicable.

Informed Consent Statement

Not applicable.

Data Availability Statement

No new data were created or analyzed in this study. Data sharing is not applicable to this article.

Conflicts of Interest

Author Wei Tian was employed by the company Xinjiang Jiaotou Engineering Technology Development Co., Ltd. The remaining authors declare that the research was conducted in the absence of any commercial or financial relationships that could be construed as potential conflicts of interest.

Abbreviations

LCALife cycle assessment
PLCAProcess-based life cycle assessment
IPCCIntergovernmental Panel on Climate Change
CLCDChinese Life Cycle Database
IEAInternational Energy Agency
CEFCarbon emission factor
GWPGlobal warming potential
SBSStyrene–butadiene–styrene-modified asphalt
TSTape sealing
HAGHot asphalt grouting
SGSlotting and grouting
MSMicro-surfacing
SGSSynchronized gravel sealing
MRMilling and resurfacing

References

  1. UNEP. Emissions Gap Report 2020; UNEP Copenhagen Climate Centre (UNEP-CCC): Copenhagen, Denmark, 2020; Available online: https://unepccc.org/publications/emissions-gap-report-2020/ (accessed on 22 June 2025).
  2. IEA. CO2 Emissions in 2023; International Energy Agency: Paris, France, 2024. [Google Scholar]
  3. Yang, J.; Deng, Z.; Guo, S.; Chen, Y. Development of bottom-up model to estimate dynamic carbon emission for city-scale buildings. ApEn 2023, 331, 120410. [Google Scholar] [CrossRef]
  4. IEA. CO2 Emissions in 2022; International Energy Agency: Paris, France, 2023. [Google Scholar]
  5. IEA. Tracking Clean Energy Progress 2023; International Energy Agency: Paris, France, 2023. [Google Scholar]
  6. Li, X.; Yu, B. Peaking CO2 emissions for China’s urban passenger transport sector. Energy Policy 2019, 133, 110913. [Google Scholar] [CrossRef]
  7. MOT. Statistical Bulletin of Transportation Industry in 2022. 2022. Available online: https://xxgk.mot.gov.cn/2020/jigou/zhghs/202306/t20230615_3847023.html (accessed on 12 October 2024).
  8. MOT. The “Fourteenth Five-Year Plan” Road Maintenance Management Development Outline. 2022. Available online: https://xxgk.mot.gov.cn/2020/jigou/zhghs/202204/t20220407_3649836.html (accessed on 12 October 2024).
  9. Kaab, A.; Sharifi, M.; Mobli, H.; Nabavi-Pelesaraei, A.; Chau, K.-W. Use of optimization techniques for energy use efficiency and environmental life cycle assessment modification in sugarcane production. Energy 2019, 181, 1298–1320. [Google Scholar] [CrossRef]
  10. Mostashari-Rad, F.; Nabavi-Pelesaraei, A.; Soheilifard, F.; Hosseini-Fashami, F.; Chau, K.-W. Energy optimization and greenhouse gas emissions mitigation for agricultural and horticultural systems in Northern Iran. Energy 2019, 186, 115845. [Google Scholar] [CrossRef]
  11. Nabavi-Pelesaraei, A.; Rafiee, S.; Mohtasebi, S.S.; Hosseinzadeh-Bandbafha, H.; Chau, K.-W. Comprehensive model of energy, environmental impacts and economic in rice milling factories by coupling adaptive neuro-fuzzy inference system and life cycle assessment. J. Clean. Prod. 2019, 217, 742–756. [Google Scholar] [CrossRef]
  12. Håkan, S. Life Cycle Assessment of Road. A Pilot Study for Inventory Analysis, 2nd ed.; VL Svenska Miljöinstitutet: Stockholm, Sweden, 2001. [Google Scholar]
  13. Liu, Y.; Wang, Y.; Lyu, P.; Hu, S.; Yang, L.; Gao, G. Rethinking the carbon dioxide emissions of road sector: Integrating advanced vehicle technologies and construction supply chains mitigation options under decarbonization plans. J. Clean. Prod. 2021, 321, 128769. [Google Scholar] [CrossRef]
  14. Liu, J.; Li, H.; Wang, Y.; Zhang, H. Integrated life cycle assessment of permeable pavement: Model development and case study. Transp. Res. Part D Transp. Environ. 2020, 85, 102381. [Google Scholar] [CrossRef]
  15. Santos, J.; Ferreira, A.; Flintsch, G. A life cycle assessment model for pavement management: Methodology and computational framework. Int. J. Pavement Eng. 2014, 16, 268–286. [Google Scholar] [CrossRef]
  16. Zheng, M.; Chen, W.; Ding, X.; Zhang, W.; Yu, S. Comprehensive Life Cycle Environmental Assessment of Preventive Maintenance Techniques for Asphalt Pavement. Sustainability 2021, 13, 4887. [Google Scholar] [CrossRef]
  17. Anne, R.; Mie, V.; Guro, N. Refurbishment or Replacement of Buildings—What is Best for the Climate? Joint Actions on Climate Change: Bonn, Germany, 2009. [Google Scholar]
  18. Jiang, R.; Wu, P. Estimation of environmental impacts of roads through life cycle assessment: A critical review and future directions. Transp. Res. Part D Transp. Environ. 2019, 77, 148–163. [Google Scholar] [CrossRef]
  19. Li, J.; Xiao, F.; Zhang, L.; Amirkhanian, S.N. Life cycle assessment and life cycle cost analysis of recycled solid waste materials in highway pavement: A review. J. Clean. Prod. 2019, 233, 1182–1206. [Google Scholar] [CrossRef]
  20. Loijos, A.; Santero, N.; Ochsendorf, J. Life cycle climate impacts of the US concrete pavement network. Resour. Conserv. Recycl. 2013, 72, 76–83. [Google Scholar] [CrossRef]
  21. Treloar, G.J.; Love, P.E.D.; Faniran, O.O.; Iyer-Raniga, U. A hybrid life cycle assessment method for construction. Constr. Manag. Econ. 2000, 18, 5–9. [Google Scholar] [CrossRef]
  22. Fernández-Sánchez, G.; Berzosa, Á.; Barandica, J.M.; Cornejo, E.; Serrano, J.M. Opportunities for GHG emissions reduction in road projects: A comparative evaluation of emissions scenarios using CO2 NSTRUCT. J. Clean. Prod. 2015, 104, 156–167. [Google Scholar] [CrossRef]
  23. Yu, B.; Lu, Q. Life cycle assessment of pavement: Methodology and case study. Transp. Res. Part D Transp. Environ. 2012, 17, 380–388. [Google Scholar] [CrossRef]
  24. Ma, F.; Dong, W.; Fu, Z.; Wang, R.; Huang, Y.; Liu, J. Life cycle assessment of greenhouse gas emissions from asphalt pavement maintenance: A case study in China. J. Clean. Prod. 2021, 288, 125595. [Google Scholar] [CrossRef]
  25. Saghafi, M.; Tabatabaee, N.; Nazarian, S. Performance Evaluation of Slurry Seals Containing Reclaimed Asphalt Pavement. Transp. Res. Rec. J. Transp. Res. Board 2019, 2673, 358–368. [Google Scholar] [CrossRef]
  26. Liu, Y.; Wang, Y.; Li, D.; Yu, Q. Life cycle assessment for carbon dioxide emissions from freeway construction in mountainous area: Primary source, cut-off determination of system boundary. Resour. Conserv. Recycl. 2019, 140, 36–44. [Google Scholar] [CrossRef]
  27. Tarefder, R.A.; Ahmad, M. Cost-effectiveness analysis of chip seal with and without millings. Int. J. Pavement Eng. 2016, 19, 893–900. [Google Scholar] [CrossRef]
  28. ISO 14040; Life Cycle Assessment. ISO: Geneva, Switzerland, 2016.
  29. JT/T 719-2016; Fuel Consumption Limits and Measurement Methods for Operating Goods Vehicles. Chinese Standard: Beijing, China, 2016.
  30. DB15/T 2882-2023; Carbon Emission Accounting Regulations for Highway Infrastructure Construction. Chinese Standard: Beijing, China, 2023.
  31. GB 384; Method for Determining the Calorific Value of Petroleum Products. Chinese Standard: Beijing, China, 1981.
  32. GB/T 2589-2020; General Principles for the Calculation of Comprehensive Energy Consumption. Chinese Standard: Beijing, China, 2020.
  33. Ma, H.; Zhang, Z.; Zhao, X.; Wu, S.; Wang, E. A Comparative Life Cycle Assessment (LCA) of Warm Mix Asphalt (WMA) and Hot Mix Asphalt (HMA) Pavement: A Case Study in China. Adv. Civ. Eng. 2019, 2019, 9391857. [Google Scholar] [CrossRef]
  34. Zheng, X.; Easa, S.M.; Yang, Z.; Ji, T.; Jiang, Z. Life-cycle sustainability assessment of pavement maintenance alternatives: Methodology and case study. J. Clean. Prod. 2019, 213, 659–672. [Google Scholar] [CrossRef]
  35. National Bureau of Statistics. China Energy Statistics Yearbook in 2022; China Statistics Press: Beijing, China, 2023. [Google Scholar]
  36. GB 175-2007; General Silicate Cement. Chinese Standard: Beijing, China, 2007.
  37. GB 16780-2007; Limit of Energy Consumption per Unit Product of Cement. Chinese Standard: Beijing, China, 2007.
  38. HJ 443-2008; Cleaner Production Standard-Petroleum Refining Industry (Asphalt). Chinese Standard: Beijing, China, 2008.
  39. Zhu, S.; Qin, X.; Xu, Z.; Xing, M. Life cycle assessment of energy consumption and carbon emissions of a green maintenance material for asphalt pavement: Warm mix OUFC-5. J. Clean. Prod. 2023, 428, 139481. [Google Scholar] [CrossRef]
  40. Liu, N.; Wang, Y.; Bai, Q.; Liu, Y.; Wang, P.; Xue, S.; Yu, Q.; Li, Q. Road life-cycle carbon dioxide emissions and emission reduction technologies: A review. J. Traffic Transp. Eng. (Engl. Ed.) 2022, 9, 532–555. [Google Scholar] [CrossRef]
  41. Zhong, Y.; Xu, S.; Zhang, B.; Cheng, H.; Wang, M.; Niu, Y.; Li, R. A study on carbon dioxide emissions of high-polymer road maintenance technology based on life cycle assessment evaluation. J. Clean. Prod. 2023, 426, 138944. [Google Scholar] [CrossRef]
  42. Liu, M.; Han, S.; Wang, Z.; Ren, W.; Li, W. Performance evaluation of new waterborne epoxy resin modified emulsified asphalt micro-surfacing. Constr. Build. Mater. 2019, 214, 93–100. [Google Scholar] [CrossRef]
  43. Xu, X.; Kong, L.; Li, X.; Lei, B.; Sun, B.; Li, X.; Qu, F.; Pang, B.; Dong, W. Energy conservation and carbon emission reduction of cold recycled petroleum asphalt concrete pavement with cement-stabilized phosphogypsum. Constr. Build. Mater. 2024, 433, 136696. [Google Scholar] [CrossRef]
  44. Jelti, F.; Saadani, R. Energy efficiency analysis of heavy goods vehicles in road transportation: The case of Morocco. Case Stud. Transp. Policy 2024, 17, 101260. [Google Scholar] [CrossRef]
  45. Santolini, E.; Tarsi, G.; Torreggiani, D.; Sangiorgi, C. Towards more sustainable infrastructures through circular processes: Environmental performance assessment of a case study pavement with recycled asphalt in a life cycle perspective. J. Clean. Prod. 2024, 448, 141380. [Google Scholar] [CrossRef]
  46. Yao, L.; Leng, Z.; Lan, J.; Chen, R.; Jiang, J. Environmental and economic assessment of collective recycling waste plastic and reclaimed asphalt pavement into pavement construction: A case study in Hong Kong. J. Clean. Prod. 2022, 336, 130405. [Google Scholar] [CrossRef]
Figure 1. Typical road sections and pavement structures.
Sustainability 17 06540 g001
Figure 2. Typical roadway lane distribution.
Sustainability 17 06540 g002
Figure 3. System boundary.
Sustainability 17 06540 g003
Figure 4. Energy consumption in the raw material production phase: (a) preventive maintenance techniques, (b) MR of different pavement structural layers.
Sustainability 17 06540 g004
Figure 5. Energy consumption in the preventive maintenance transportation phase.
Sustainability 17 06540 g005
Figure 6. Energy consumption of raw materials for restorative maintenance in transportation phase: (a) asphalt pavement surface layer, (b) cement-stabilized gravel layer.
Sustainability 17 06540 g006
Figure 7. Energy consumption in the construction phase: (a) total energy consumption for preventive maintenance construction, (b) energy consumption of different energy sources for MR.
Sustainability 17 06540 g007
Figure 8. Carbon emissions in the raw material production phase: (a) preventive maintenance techniques, (b) MR of different pavement structural layers.
Sustainability 17 06540 g008
Figure 9. Carbon emissions in the material transportation phase: (a) preventive maintenance techniques, (b) MR of different pavement structural layers.
Sustainability 17 06540 g009
Figure 10. Carbon emissions in the maintenance phase: (a) preventive maintenance techniques, (b) MR of different pavement structural layers.
Sustainability 17 06540 g010
Figure 11. Sensitivity analysis of carbon emissions from major energy sources and materials over the life cycle of road maintenance: (a) preventive maintenance sensitivity analysis, (b) MR sensitivity analysis.
Sustainability 17 06540 g011
Table 1. Design service life and life cycle maintenance frequency.
Maintenance TechnologyDesign Service Life/YearsFrequency
TS1–26–12
HAG1–38–12
SG1–36–10
MS2–33–5
SGS2–34–7
MR5–82–3
Table 2. Global warming potential (GWP).
SpeciesChemical FormulaGWPUnits
GHGCO21kgCO2e/kg
CH425
N2O298
Table 3. List of materials for preventive maintenance.
Maintenance TechnologyMaterialsUnitConsumption
TSSeam tapem1020
HAGSBS-modified asphaltkg529.2
SGGrouting gluekg349.6
Mineral powderkg700
MSEmulsified asphaltkg2224
Basalt aggregatesm312.58
Cementkg445
SGSSBS-modified asphaltkg2160
Coalkg244
Crushed stone (1.5 cm)m36.93
Table 4. Fuel consumption of transportation vehicles.
Type of Transport VehicleLoad (t)FuelCombined Fuel Consumption (L/100 km)
Self-discharging truck5Petrol24.4
12Diesel32.5
2038.9
Lorry2–3Petrol14.2
516.3
Table 5. Average transportation distance of maintenance materials.
Material to SiteAverage Transportation Distance (km)
Seam tape, Asphalt, SBS-modified asphalt, Emulsified asphalt, Grouting glue790.28
mineral powder106
Basalt aggregates, Coal, Crushed stone104.96
Cement89.33
Water16.43
Gravel, Mechanical sand32.9
Asphalt mixing plant21.61
Cement-stabilized gravel mixing plant33.66
Table 6. Preventive maintenance construction equipment and energy consumption.
Maintenance TechnologyMachinery and EquipmentEnergyMachine-Team/Energy Consumption (kg)
TSPortable blowerElectricity5/0.2
HAGAsphalt grouting machineDiesel5.5/9.81
SGRoad grouting machine (110 DH)1.8/9.81
21 kW Asphalt pavement grooving machineHeavy oil1.8/18.3
Portable blowerElectricity0.9/0.2
MS3.0 m3 Tire loaderDiesel0.44/115.15
2.5–3.5 m Thin slurry sealer0.9/103.54
Micro-surface sealer trucks
SX5315XJFC
Heavy oil0.48/157.25
SGS3.0 m3 Tire loaderDiesel0.15/155.15
20–25 t Tire roller0.13/50.40
Synchronized gravel sealer0.15/130.4
Industrial boilerCoal0.1/2440
Table 7. Restorative maintenance construction equipment and energy consumption.
Machinery and Equipment4 cmEvery 1 cmEnergyEnergy Consumption
Milling of pavements (1000 m2)
Road milling machine (2000 mm)0.2360.069Diesel190.46
6 t SDT1.0630.26544.00
6000 L Sprinkler truck0.1440.016Petrol34.29
Resurfacing of pavements (1000 m2)
12.5 m Asphalt paver0.070.018Diesel136.23
15 t Vibratory rollers (double drum)0.2950.07480.80
20–25 t Tire roller0.0980.02550.40
3 t Lorry0.0280.007Petrol26.12
10,000 L Sprinkler truck0.0240.006Diesel52.8
Table 8. Typical fuel net calorific value.
EnergyAverage Net Calorific Value
MJ/kgMJ/kWh
Petrol56.18
Diesel55.75
Heavy oil54.47
Electricity 8
Coal20.9
Table 9. Carbon emission factors for energy.
EnergyUnitCEF (tCO2e/t or MWh)
ElectricityMWh0.805
Heavy oilt3.06
Petrolt2.929
Dieselt3.1
Coalt1.9
Table 10. Carbon emission factors for maintenance materials.
MaterialsUnitCEF (kgCO2e/t or kgCO2e/m3)
Petroleum asphaltt270
Modified asphaltt311
Emulsified asphaltt412
Cementt735
Gravelt2.51
Crushed or broken rock (d = 10–30 mm)t2.18
Mineral powdert84.4
Mechanized sandm33.11
Table 11. Maintaining energy consumption for raw material production.
MaterialsEnergy Consumption
MJ/tMJ/m3 or kWh
Coarse aggregates37.3359.74
Fine aggregates58.5693.71
Asphalt4649.2
Emulsified asphalt2825.87
Rubber-modified asphalt3200
SBS-modified asphalt10,575.5
Cement2302.32
Mineral powder77.85
Table 12. Energy intensity and life cycle energy consumption.
Maintenance TechnologyEnergy ConsumptionLife Cycle Energy Consumption
MJ/km or 1000 m2MJ/km or 1000 m2
TS428.7130,009.7
HAG5624.85584,984.4
SG7086.19389,740.45
MS29,719.2412,482,080.8
SGS35,244.162,819,532.8
MR250,809.03118,905,954.4
Table 13. Carbon emission intensity and life cycle carbon emissions.
Maintenance TechnologyCarbon EmissionLife Cycle Carbon Emission
kgCO2e/km or 103 m2kgCO2e/km or 103 m2
TS63.534447.1
HAG379.9839,517.92
SG352.3919,381.45
MS2444.421,026,656.4
SGS1997.2159,776
MR15,095.67 9,308,635.2
Disclaimer/Publisher’s Note: The statements, opinions and data contained in all publications are solely those of the individual author(s) and contributor(s) and not of MDPI and/or the editor(s). MDPI and/or the editor(s) disclaim responsibility for any injury to people or property resulting from any ideas, methods, instructions or products referred to in the content.

