
Monitoring Forest Cover Trends in Nepal: Insights from 2000–2020


Abstract
1. Introduction
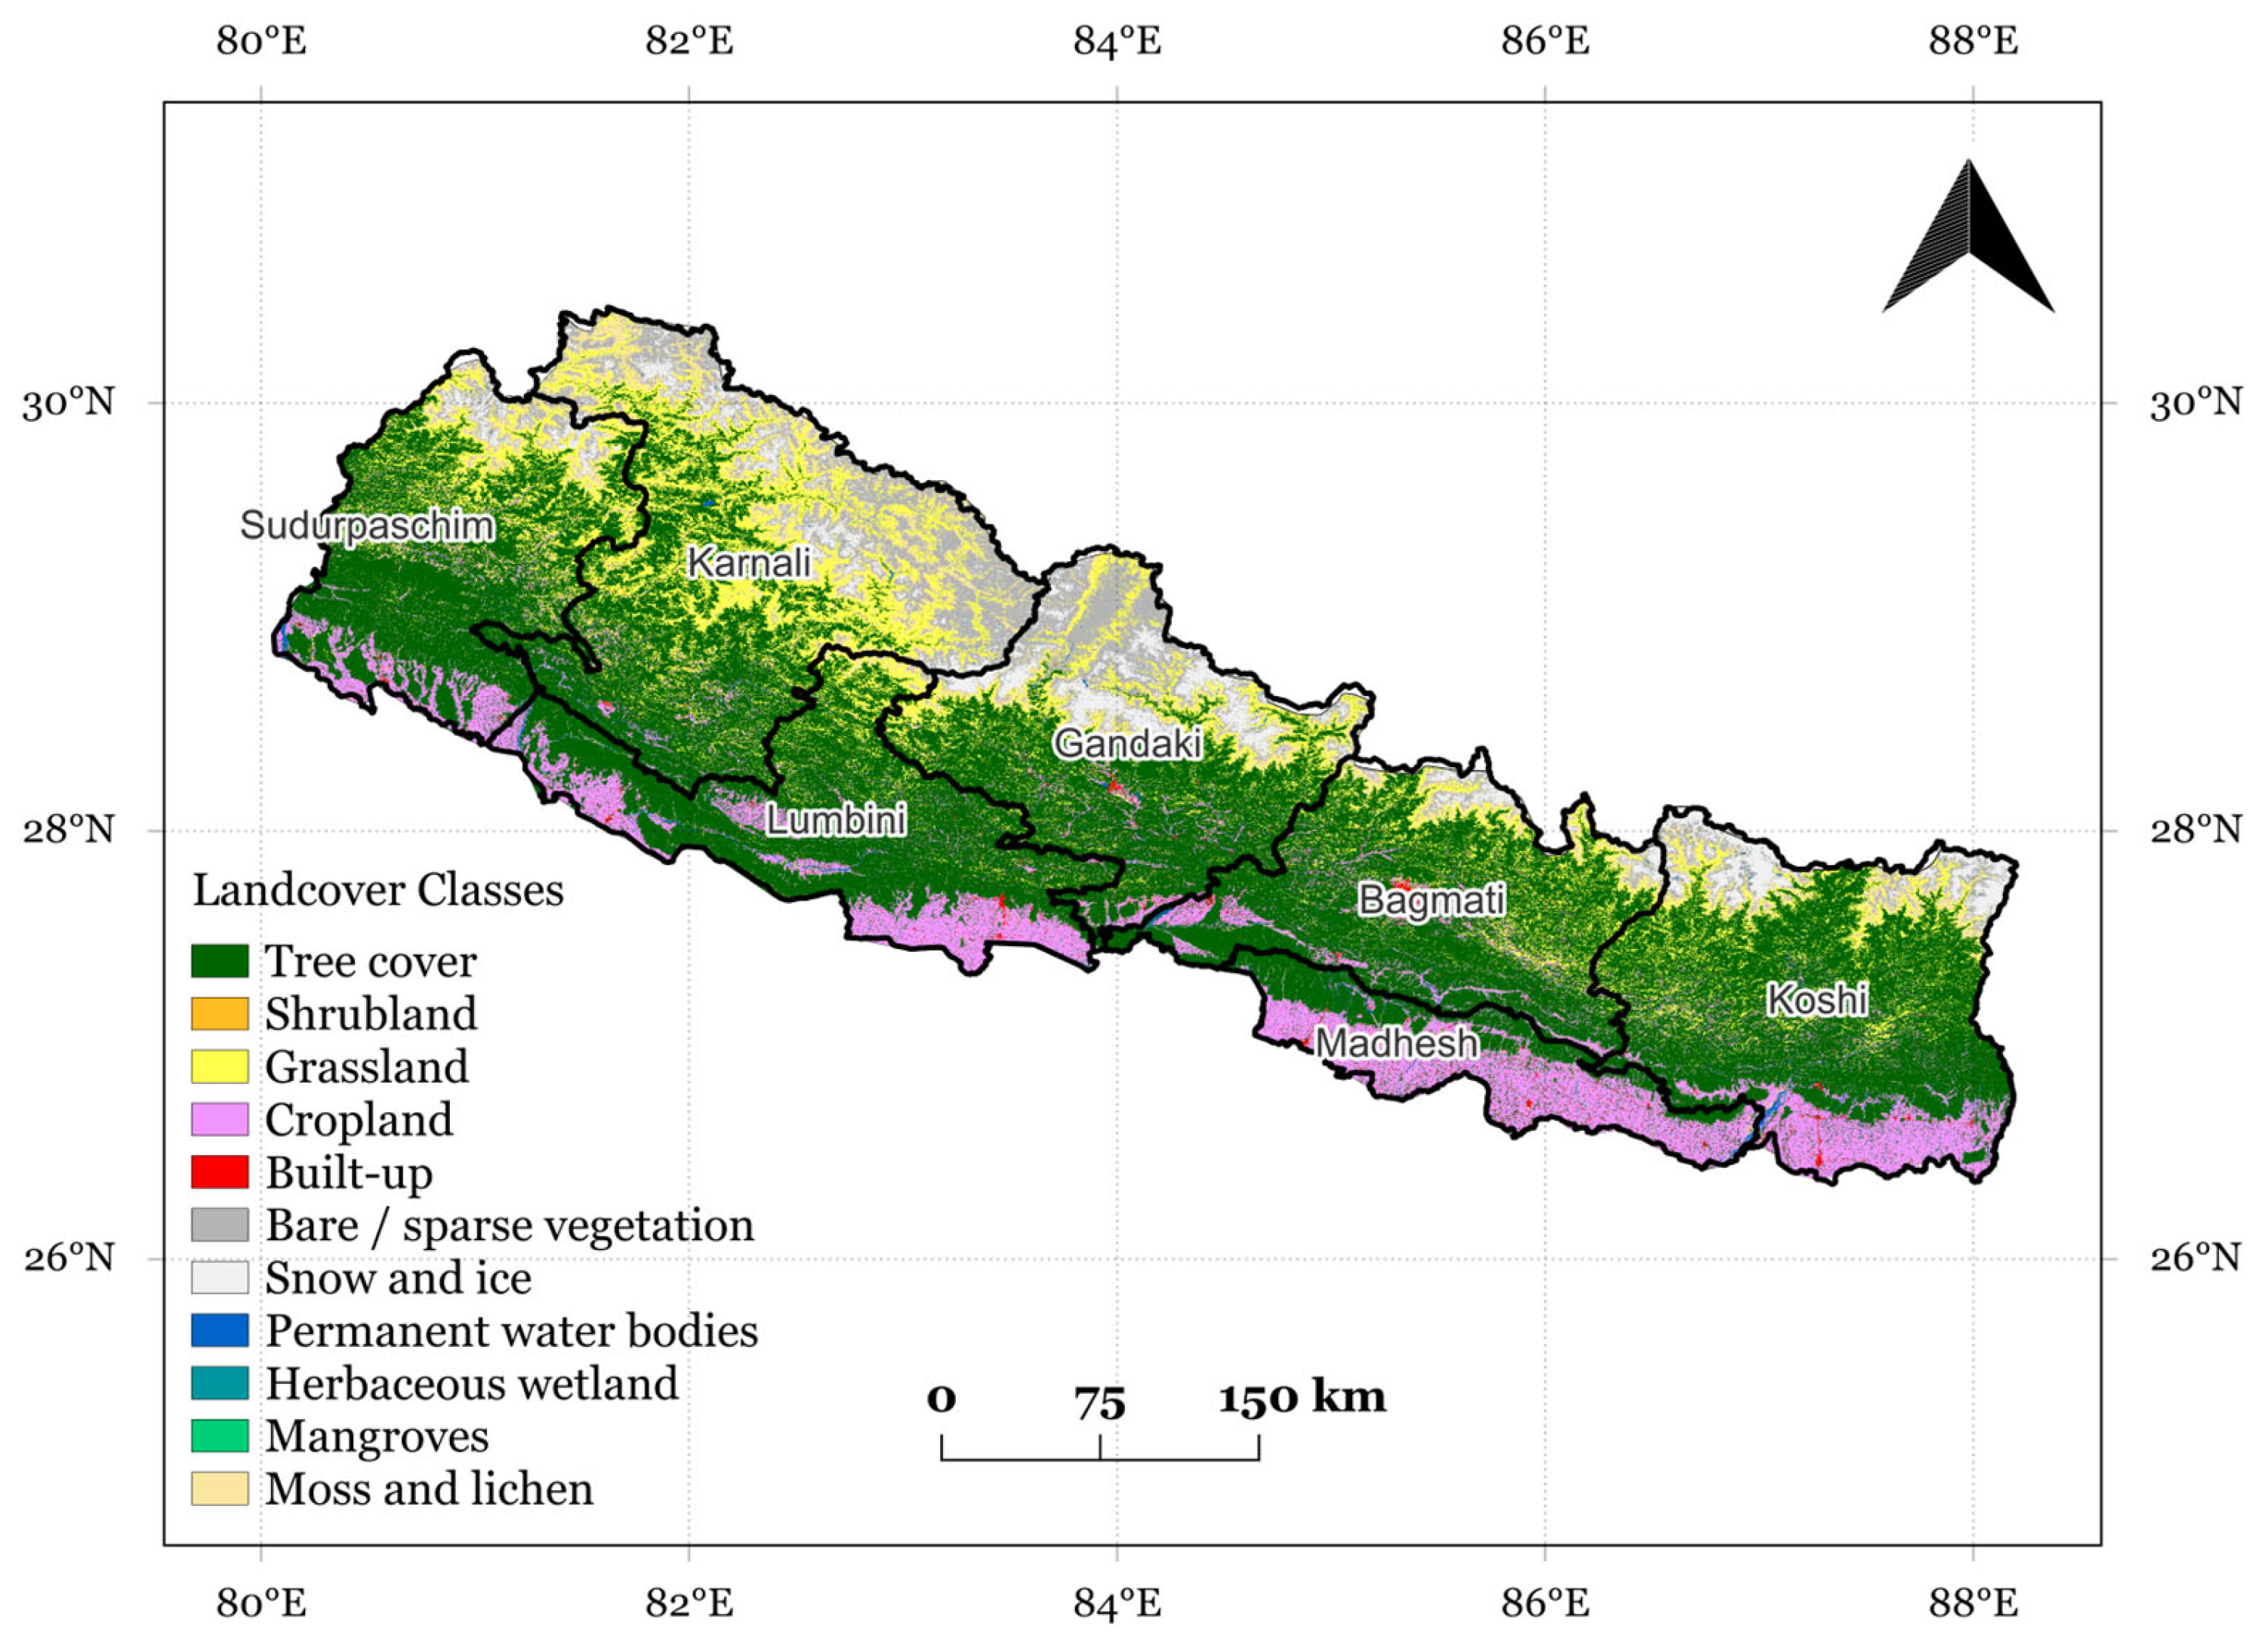
2. Study Area
3. Data and Sources
4. Materials and Methods
4.1. Linear Regression
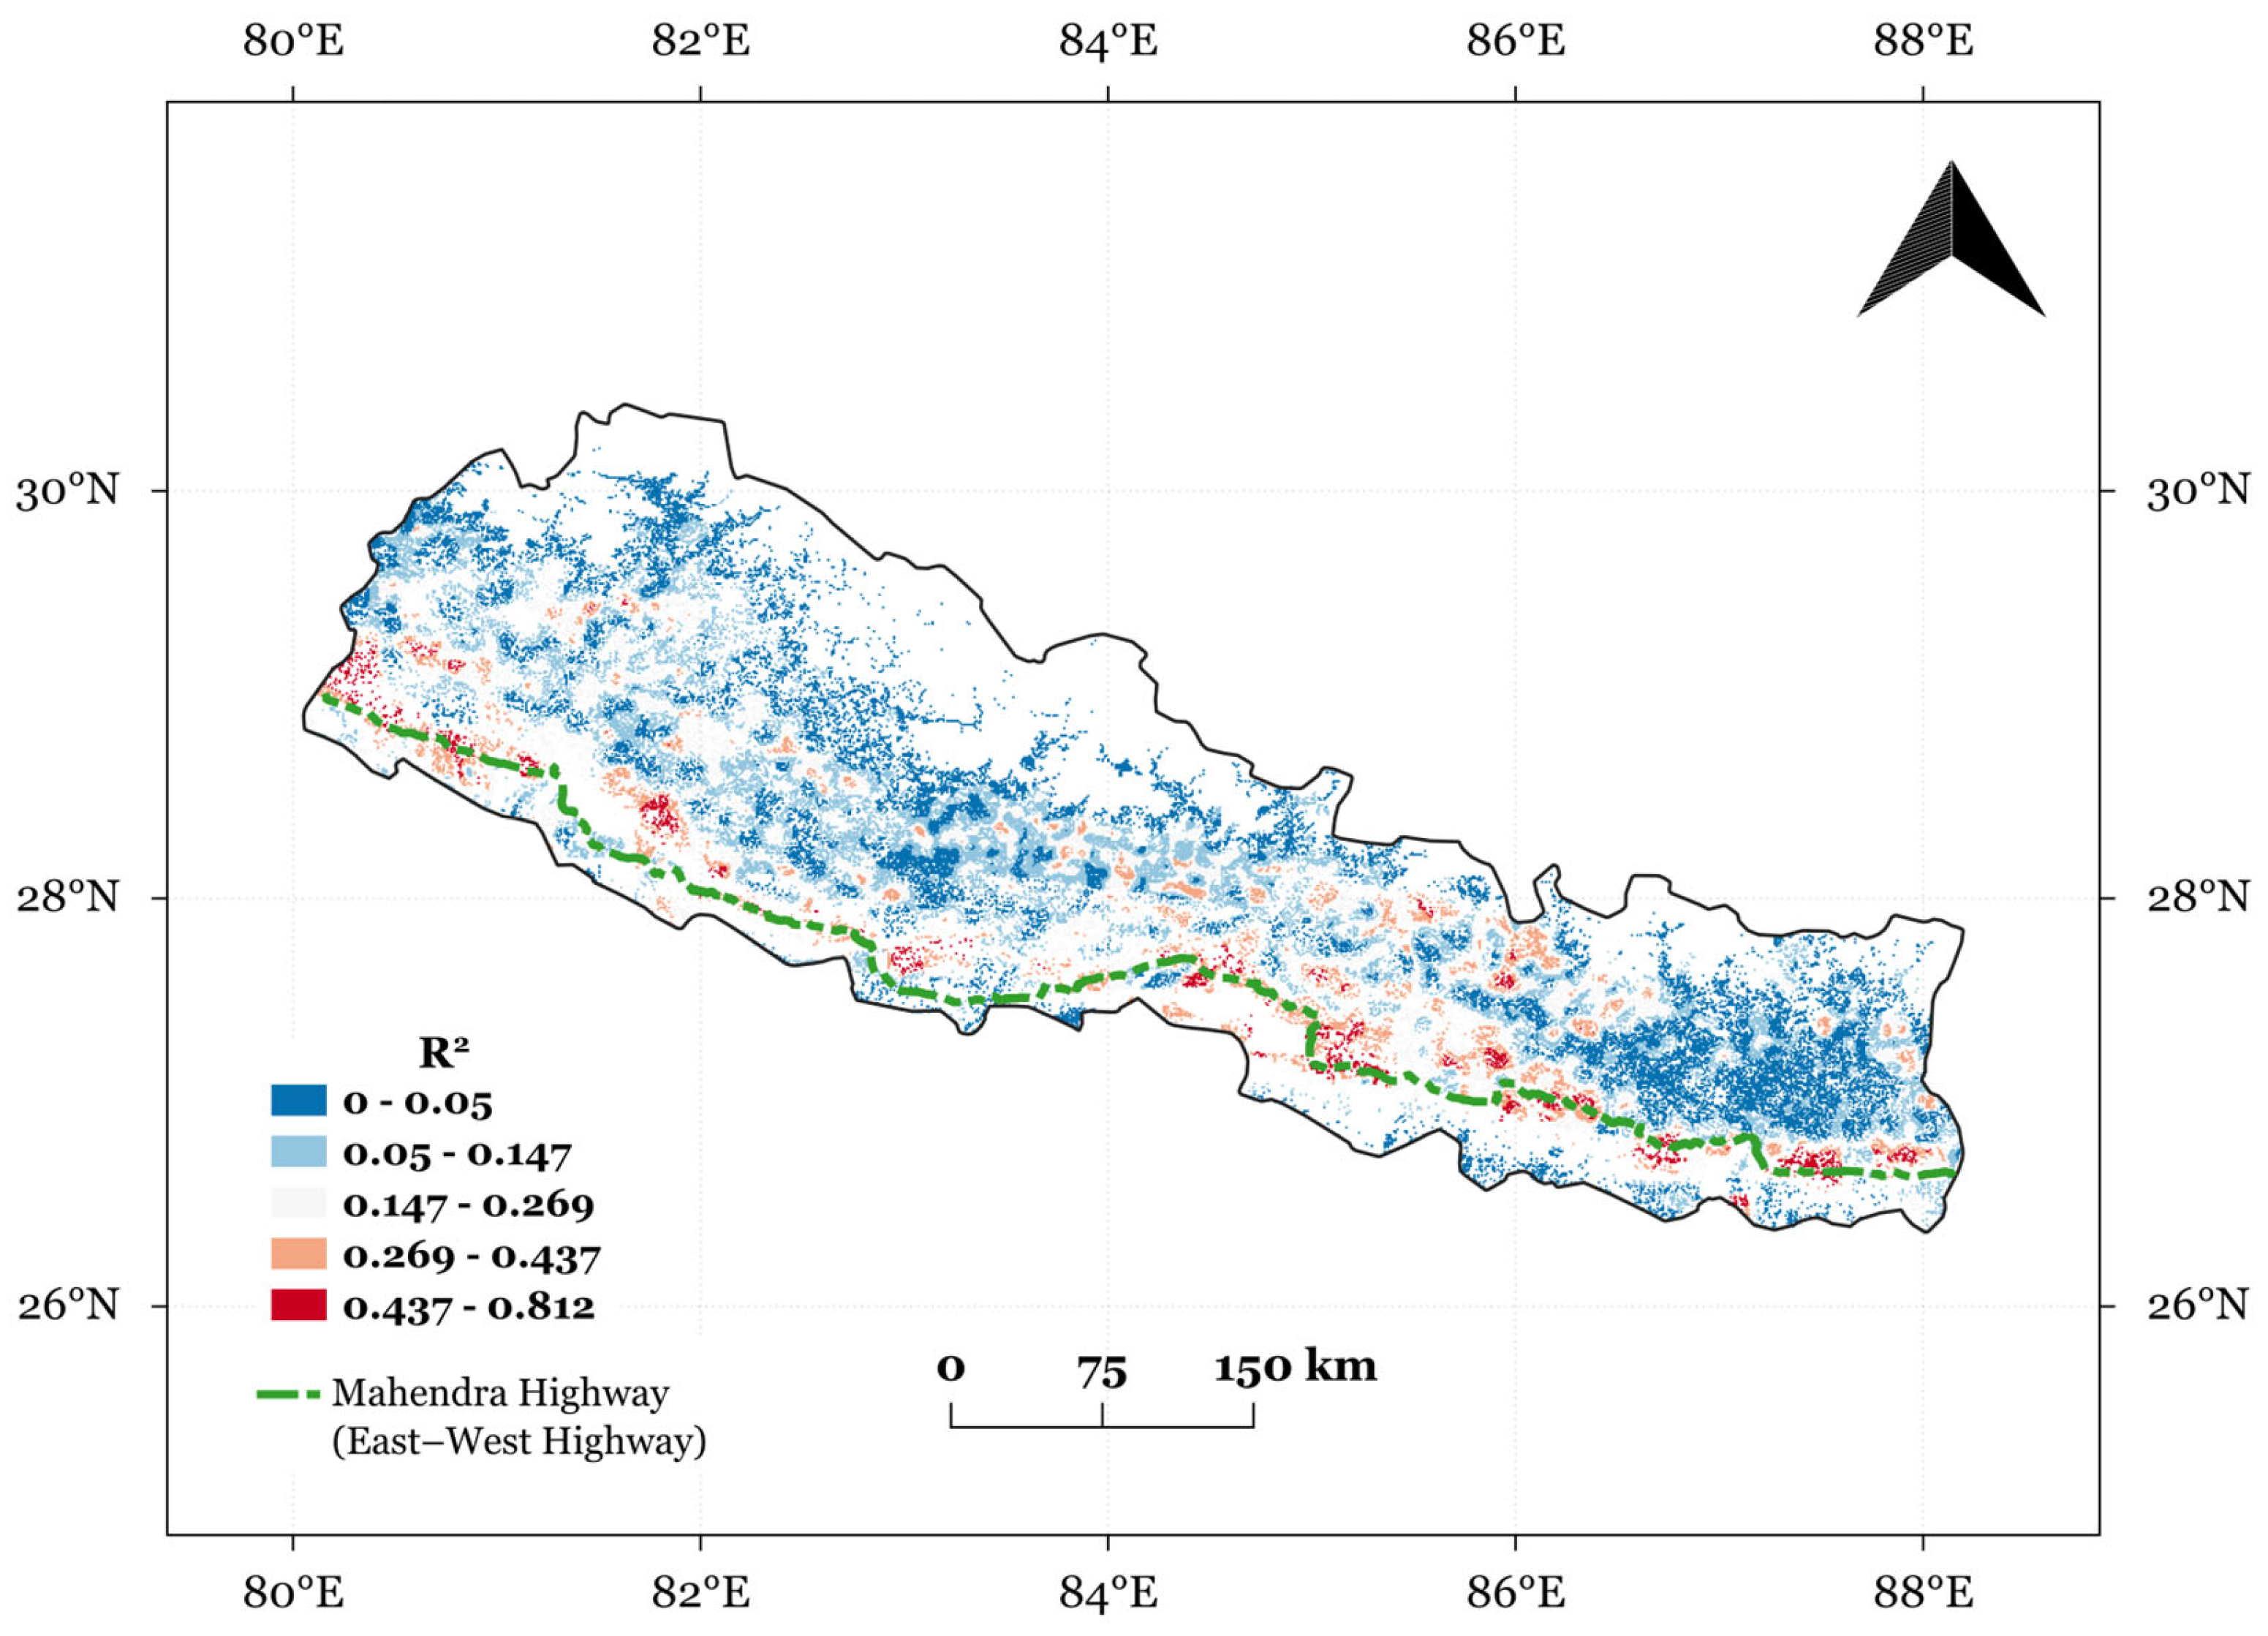
4.2. Geographically Weighted Regression
5. Results and Discussion
6. Conclusions
- This study demonstrates that the relationship between population growth and tree cover loss in Nepal is spatially variable and has become increasingly structured over time.
- The correlation between total population and forest loss (2000–2020) at the national level in Nepal suggests little to no direct impact of population growth on forest loss. However, sub-national analysis revealed localized forest degradation, especially in the mid-hills and urban fringes, highlighting the importance of thorough spatial and regional assessments to uncover forest and land cover changes masked by national trends.
- Traditional linear regression models fail to capture these complexities. In contrast, Geographically Weighted Regression (GWR), supported by very high-resolution (VHR) spatial data, provides a more accurate and insightful understanding of localized environmental dynamics.
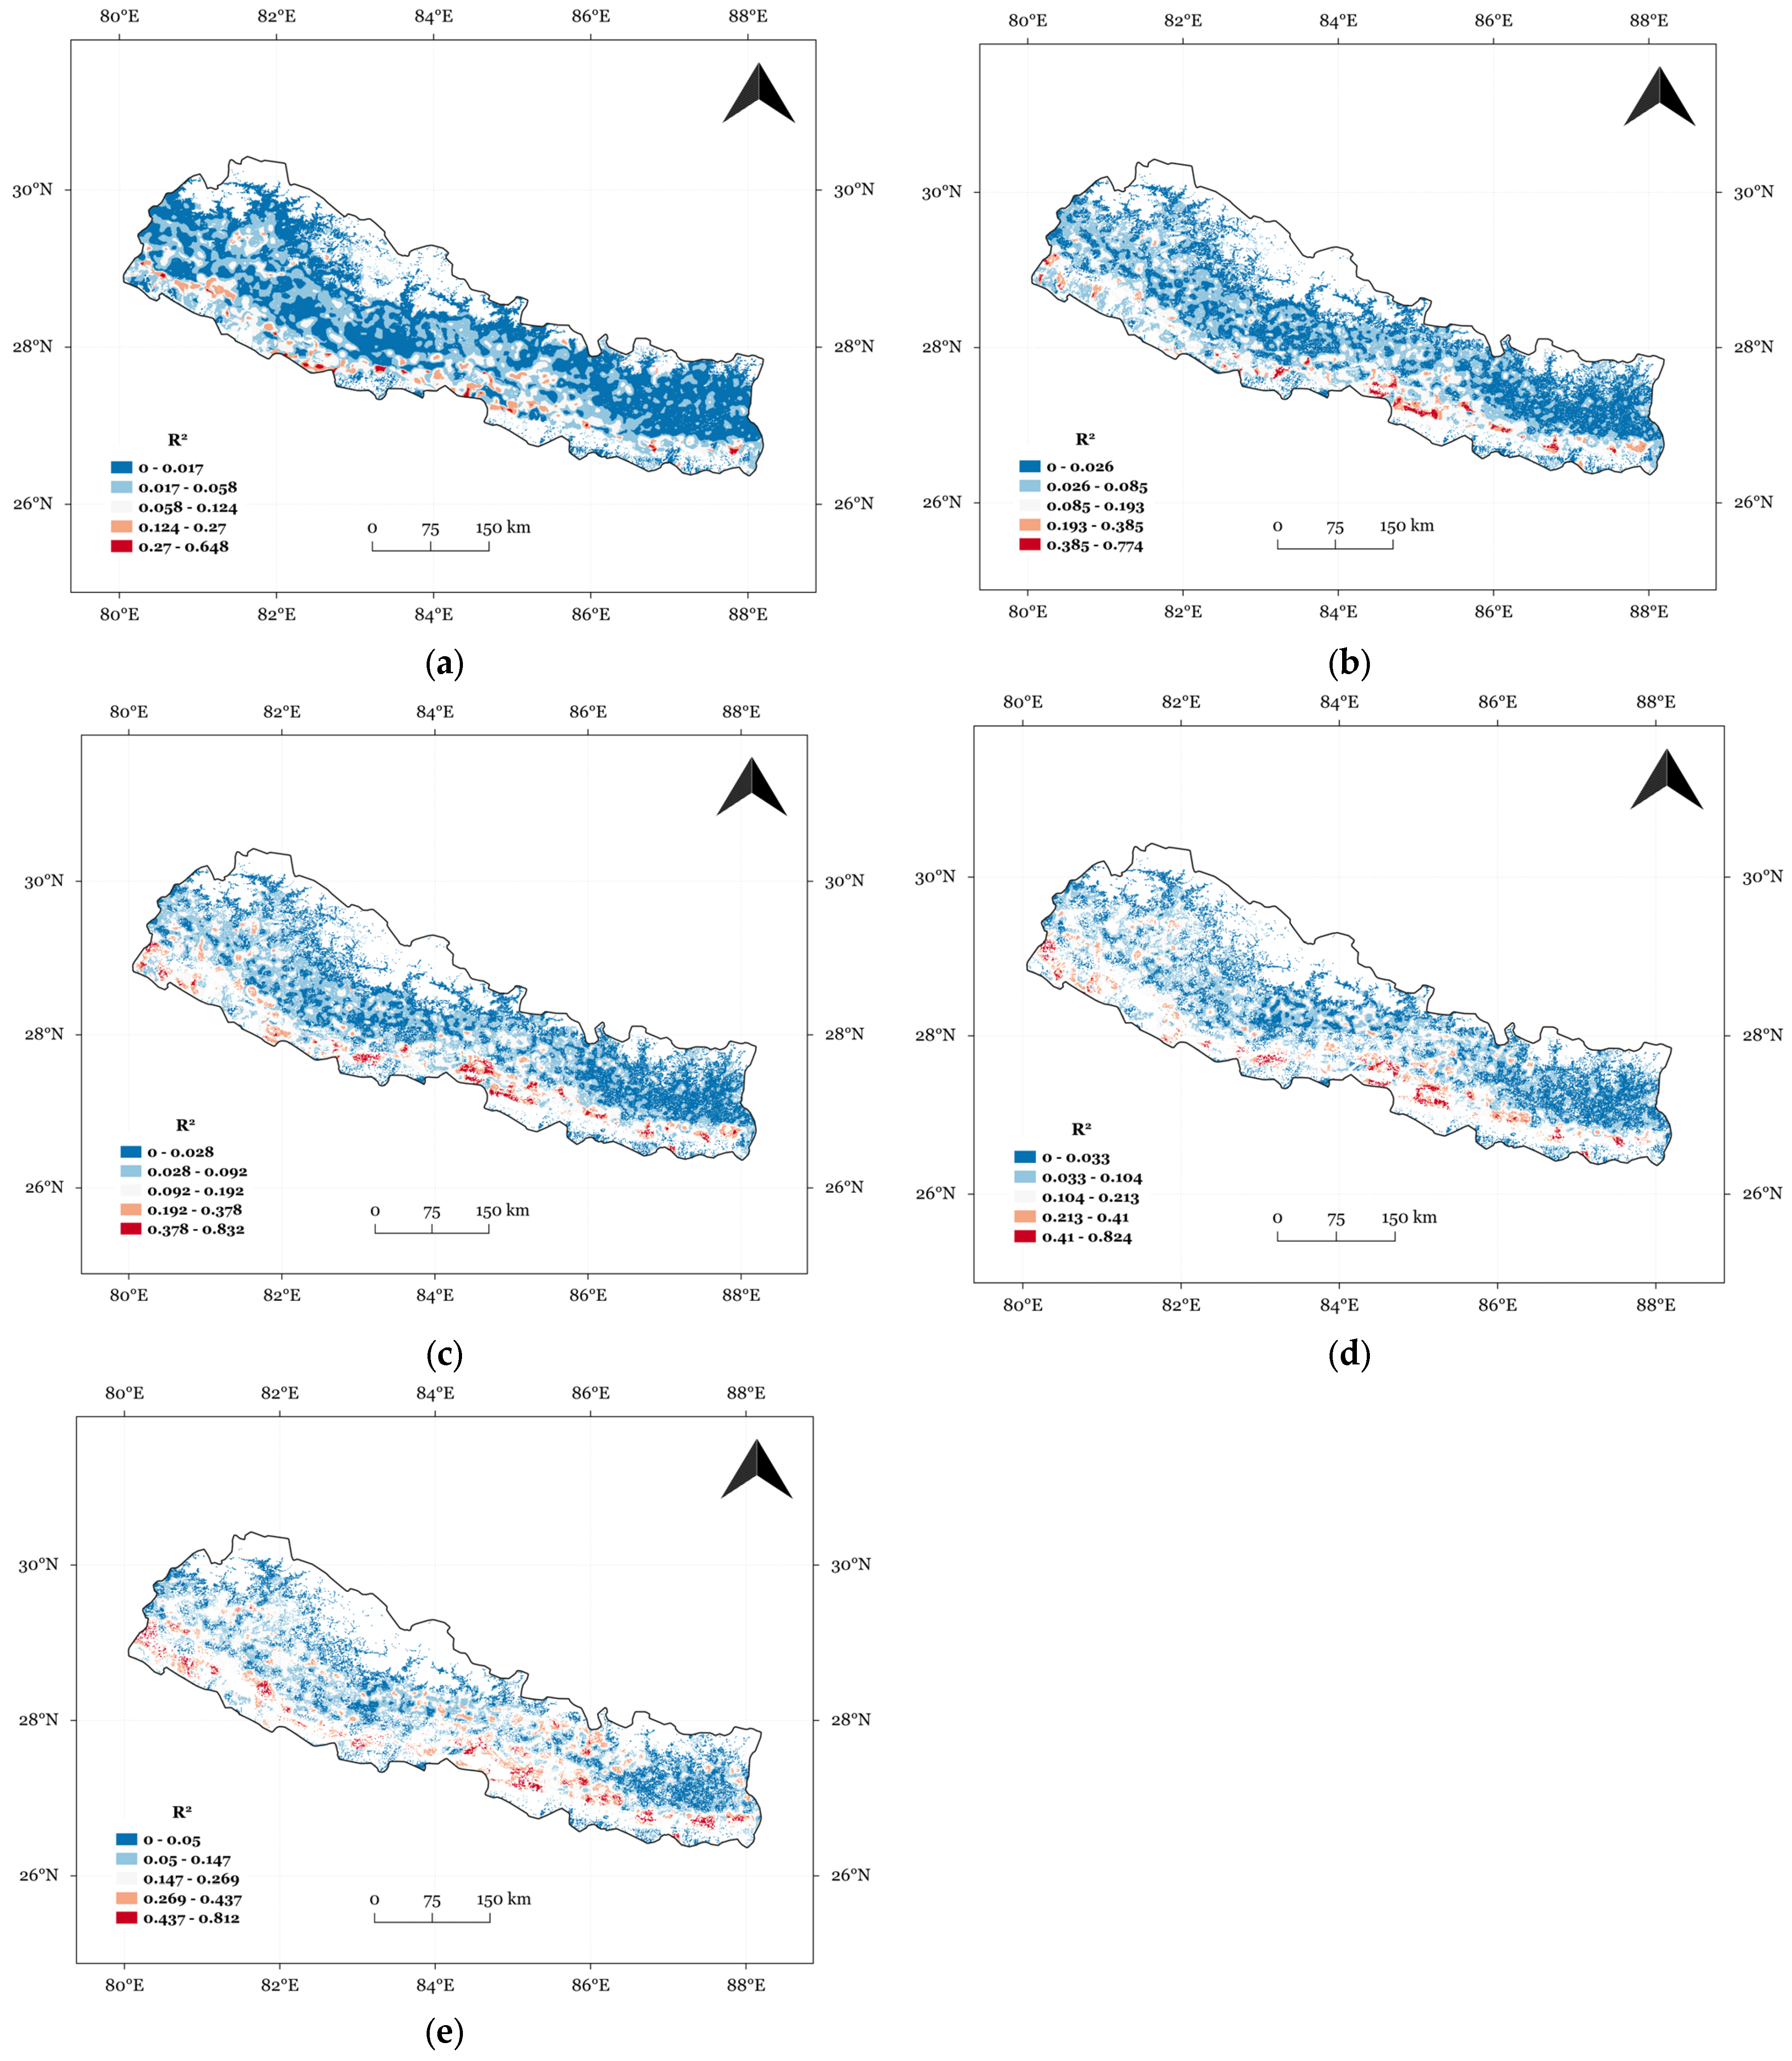
- Increasing R2 values between the tree cover loss and population over the past two decades in some regions of Nepal highlight a growing spatial association between population distribution and tree cover loss, particularly in areas experiencing rapid development and improved accessibility.
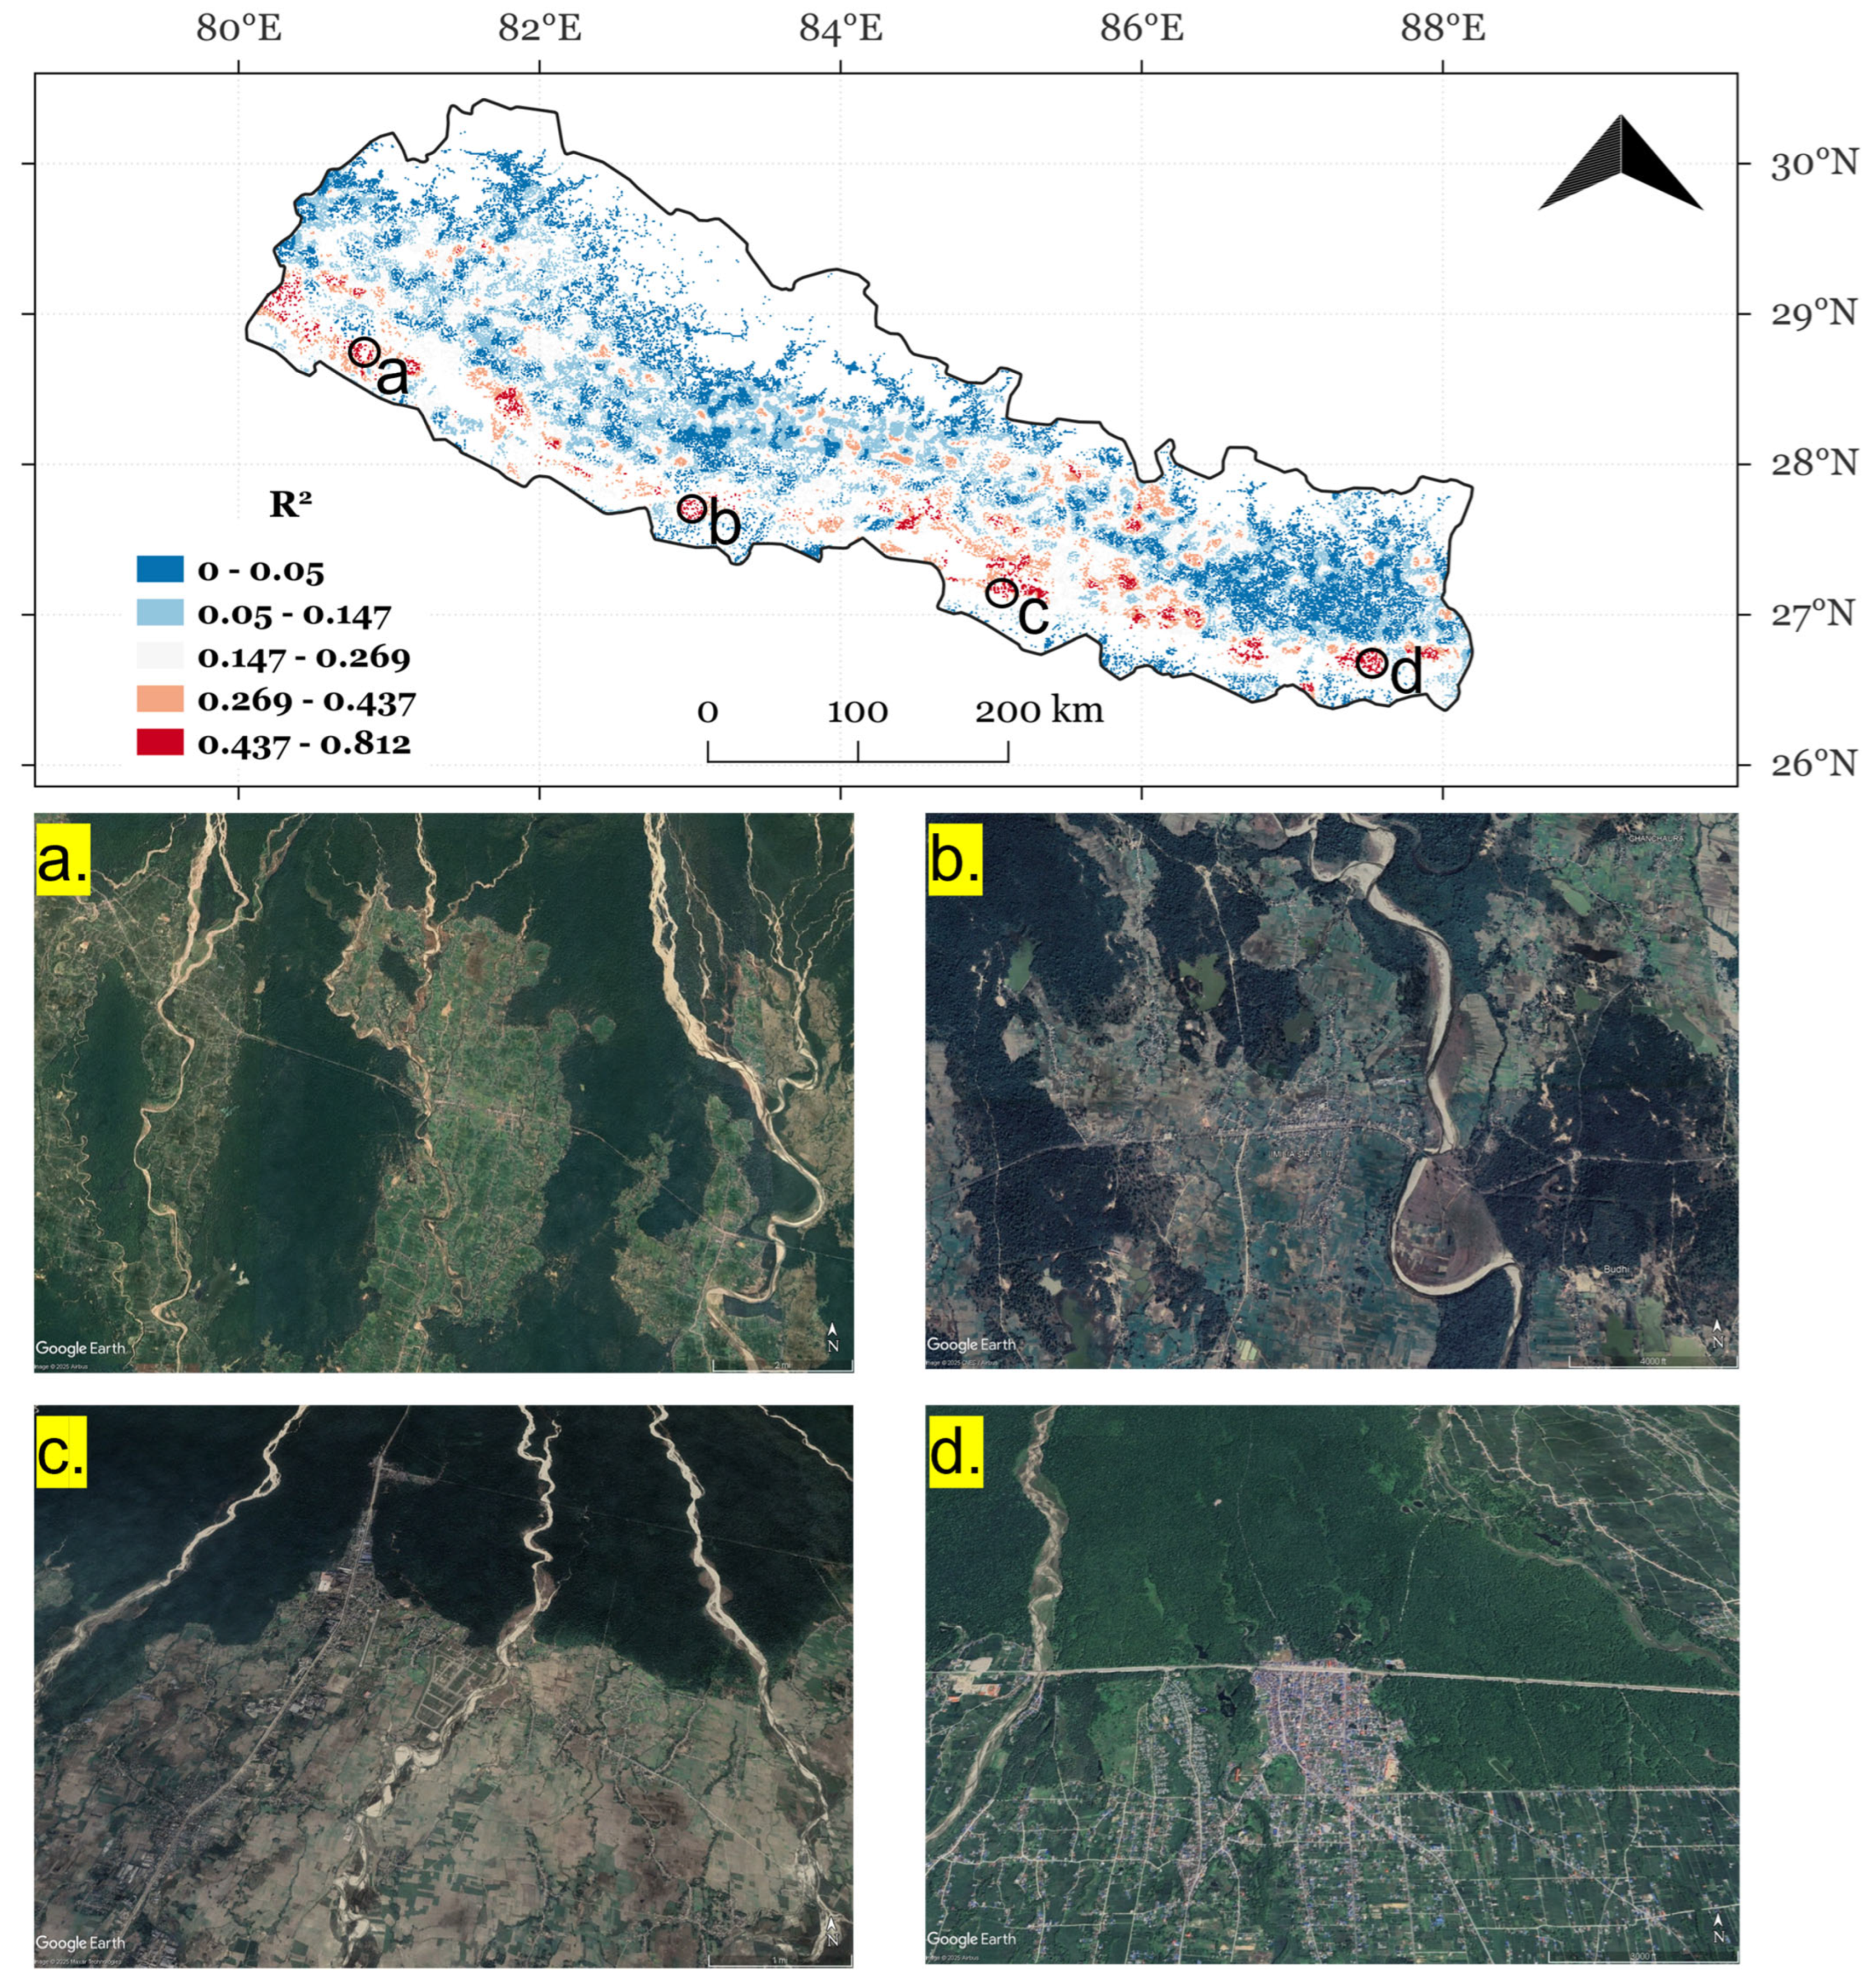
- High-R2 hotspots identified using GWR along the Mahendra Highway corridor reveal the critical role of infrastructure in shaping land use change.
- These findings not only validate the effectiveness of GWR and VHR data in capturing fine-scale human–environment interactions but also highlight the urgent need for spatially informed decision-making.
- As Nepal continues to develop, integrating spatial analytics into land management and policy frameworks will be essential to mitigate environmental degradation and promote sustainable development across the country.
Funding
Institutional Review Board Statement
Informed Consent Statement
Data Availability Statement
Acknowledgments
Conflicts of Interest
Abbreviations
| LR | Linear Regression |
| GWR | Geographically Weighted Regression |
| R2 | Coefficient of Determination |
| VHR | Very High Resolution |
| ORNL | Oak Ridge National Laboratory |
| UMD | University of Maryland |
| USGS | United States Geographical Survey |
| NASA | National Aeronautics and Space Administration |
| AIC | Akaike Information Criterion |
| AICc | Corrected Akaike Information Criterion |
| OLS | Ordinary Least Squares |
| ESA | European Space Agency |
| GFC | Global Forest Change |
| LULC | Land Use Land Cover |
| QGIS | Quantum Geographic Information System |
| GEE | Google Earth Engine |
References
- Nowak, D.J. Urban biodiversity and climate change. In Urban Biodiversity and Design; Blackwell Publishing Ltd.: Oxford, UK, 2010; pp. 101–117. [Google Scholar]
- Aram, F.; García, E.H.; Solgi, E.; Mansournia, S. Urban green space cooling effect in cities. Heliyon 2019, 5, e01339. [Google Scholar] [CrossRef]
- De Carvalho, R.M.; Szlafsztein, C.F. Urban vegetation loss and ecosystem services: The influence on climate regulation and noise and air pollution. Environ. Pollut. 2019, 245, 844–852. [Google Scholar] [CrossRef] [PubMed]
- Ferrini, F.; Fini, A.; Mori, J.; Gori, A. Role of vegetation as a mitigating factor in the urban context. Sustainability 2020, 12, 4247. [Google Scholar] [CrossRef]
- De la Barrera, F.; Rubio, P.; Banzhaf, E. The value of vegetation cover for ecosystem services in the suburban context. Urban For. Urban Green. 2016, 16, 110–122. [Google Scholar] [CrossRef]
- DeFries, R.; Asner, G.; Houghton, R. (Eds.) Ecosystems and Land Use Change; Geophysical Monograph Series; AGU: Washington, DC, USA, 2004; Volume 153. [Google Scholar]
- Bloom, D.E.; Canning, D.; Malaney, P.N. Population dynamics and economic growth in Asia. Popul. Dev. Rev. 2000, 26, 257–290. [Google Scholar]
- Rahman, M.M.; Husnain, M.I.U.; Azimi, M.N. An environmental perspective of energy consumption, overpopulation, and human capital barriers in South Asia. Sci. Rep. 2024, 14, 4420. [Google Scholar] [CrossRef]
- Teo, H.C.; Lamba, A.; Ng, S.J.W.; Nguyen, A.T.; Dwiputra, A.; Lim, A.J.Y.; Nguyen, M.N.; Tor-ngern, P.; Zeng, Y.; Dewi, S.; et al. Reduction of deforestation by agroforestry in high carbon stock forests of Southeast Asia. Nat. Sustain. 2025, 8, 358–362. [Google Scholar] [CrossRef]
- Koh, M.; Teo, R.; Tan, E. Deforestation and Forest Degradation: Drivers and Impacts on Biodiversity in Southeast Asia. J. Selvic. Asean 2024, 1, 198–207. [Google Scholar]
- Nandini, S. Colonial Exploitation and Beyond: Revisiting Indian Environmental History and Historiography. South India J. Soc. Sci. 2024, 22, 297–303. [Google Scholar] [CrossRef]
- Sundar, N. Unpacking the ‘joint’ in joint forest management. Dev. Change 2000, 31, 255–279. [Google Scholar] [CrossRef]
- Kumar, S. Status of India’s Forests. In Forest Policies, Laws, and Governance in India; Springer Nature: Singapore, 2024; pp. 207–232. [Google Scholar]
- Khurram, S.; Shalizi, M.N.; Bashari, M.; Akamani, K.; Groninger, J.W. Barriers and opportunities regarding community-based forest management in Afghanistan. Environ. Conserv. 2024, 51, 6–16. [Google Scholar] [CrossRef]
- Gouhari, S.; Forrest, A.; Roberts, M. Cost-effectiveness analysis of forest ecosystem services in mountain areas in Afghanistan. Land Use Policy 2021, 108, 105670. [Google Scholar] [CrossRef]
- Islam, S.D.U.; Bhuiyan, M.A.H. Sundarbans mangrove forest of Bangladesh. Environ. Sustain. 2018, 1, 113–131. [Google Scholar] [CrossRef]
- Rasul, G. Political ecology of the degradation of forest commons in the Chittagong Hill Tracts of Bangladesh. Environ. Conserv. 2007, 34, 153–163. [Google Scholar] [CrossRef]
- Ahmad, A.; Liu, Q.-J.; Nizami, S.M.; Mannan, A.; Saeed, S. Carbon emission from deforestation, forest degradation and wood harvest in Pakistan. Land Use Policy 2018, 78, 781–790. [Google Scholar] [CrossRef]
- Sabir, M.; Ali, Y.; Khan, I.; Salman, A. Plant species selection for afforestation: A case study of the Billion Tree Tsunami Project of Pakistan. J. Sustain. For. 2022, 41, 537–549. [Google Scholar] [CrossRef]
- Ranwala, S.M. Threats and Conservation of Biodiversity in Sri Lanka. In Biodiversity Hotspot of the Western Ghats and Sri Lanka; Apple Academic Press: Palm Bay, FL, USA, 2024; pp. 599–614. [Google Scholar]
- Baral, S.; Paudel, S.; Basnyat, B.; Rai, R.K. The Economics of Forest Restoration: A cost-effectiveness analysis of the leasehold forestry programme in Nepal. Trees For. People 2025, 19, 100785. [Google Scholar] [CrossRef]
- Pandey, H.P.; Maraseni, T.N.; Apan, A.; Pokhrel, S.; Zhang, H. Lessons from a participatory forest restoration program on socio-ecological and environmental aspects in Nepal. Trees For. People 2025, 20, 100854. [Google Scholar] [CrossRef]
- Marquardt, K.; Khatri, D.; Pain, A. REDD+, forest transition, agrarian change and ecosystem services in the hills of Nepal. Hum. Ecol. 2016, 44, 229–244. [Google Scholar] [CrossRef]
- The World Bank. World Development Indicators—Nepal. 2024. Available online: https://data.worldbank.org/country/nepal (accessed on 16 June 2025).
- International Monetary Fund (IMF). Nepal: Country Data and Projections. 2024. Available online: https://www.imf.org/en/Countries/NPL (accessed on 16 June 2025).
- World Bank KNOMAD. Migration and Development Brief 41: Remittances Remain Resilient. 2024. Available online: https://www.knomad.org/publication/migration-and-development-brief-41 (accessed on 15 June 2025).
- Department of Forest Research and Survey (DFRS). State of Nepal’s Forests. Ministry of Forests and Soil Conservation, Government of Nepal. December 2015. Available online: https://frtc.gov.np/downloadfiles/StateofNepalsForestsDFRS_1457599484-1729667336.pdf (accessed on 15 June 2025).
- Ministry of Forests and Environment (MoFE). National Biodiversity Strategy and Action Plan 2014–2020: Final Assessment Report. Government of Nepal. 2019. Available online: https://www.cbd.int/doc/world/np/np-nbsap-v2-en.pdf (accessed on 16 June 2025).
- Federation of Community Forestry Users Nepal (FECOFUN). Annual Progress Report 2022/23. 2023. Available online: https://fecofun.org.np/ (accessed on 16 June 2025).
- Gautam, A.P.; Webb, E.L.; Eiumnoh, A. GIS assessment of land use/land cover changes associated with community forestry implementation in the Middle Hills of Nepal. Mt. Res. Dev. 2002, 22, 63–69. [Google Scholar] [CrossRef]
- Food and Agriculture Organization of the United Nations (FAO). Global Forest Resources Assessment 2020: Nepal Country Report. 2020. Available online: https://www.fao.org/forest-resources-assessment (accessed on 15 June 2025).
- Central Bureau of Statistics (CBS). National Population and Housing Census 2021: National Report. National Statistics Office, Government of Nepal: Kathmandu, Nepal, May 2023. Available online: https://censusnepal.cbs.gov.np/results/files/result-folder/National%20Report_English.pdf (accessed on 15 June 2025).
- Chapagain, P.S.; Aase, T.H. Changing forest coverage in Nepal Himalayas. Geogr. J. Nepal 2020, 13, 1–28. [Google Scholar] [CrossRef]
- Bhattarai, K.; Adhikari, A.P.; Gautam, S.P. State of urbanization in Nepal: The official definition and reality. Environ. Chall. 2023, 13, 100776. [Google Scholar] [CrossRef]
- Rijal, S.; Sinutok, S.; Techato, K.; Gentle, P.; Khanal, U.; Gyawali, S. Community-managed sal-based forest in climate change adaptation. Forests 2022, 13, 262. [Google Scholar] [CrossRef]
- Government of Nepal. The Forests Act, 2019 (2076). Law Commission of Nepal. 2019. Available online: https://faolex.fao.org/docs/pdf/nep202856.pdf (accessed on 16 June 2025).
- Government of Nepal, Ministry of Forests and Environment. National Forest Policy, 2015. 2015. Available online: https://redd.gov.np/upload/e66443e81e8cc9c4fa5c099a1fb1bb87/files/ESMF__with_IPPF_and_RPF__NE_FFPP_8Mar2020.pdf (accessed on 16 June 2025).
- The World Bank. Nepal and World Bank Sign Innovative Financing Agreement on Forests and Climate Change for Building Back Greener. Press Release, 26 February 2021. 2021. Available online: https://www.worldbank.org/en/news/press-release/2021/02/26/nepal-and-world-bank-sign-innovative-financing-agreement-on-forests-and-climate-change-for-building-back-greener (accessed on 16 June 2025).
- Thapa, M. Internal Migration in Nepal. Unity J. 2025, 6, 79–92. [Google Scholar] [CrossRef]
- World Bank Group. Nepal Country Profile. Available online: https://databank.worldbank.org/reports.aspx?source=2&country=NPL (accessed on 27 March 2025).
- Flora of Nepal. Provinces and Districts. Available online: https://floraofnepal.org.np/distribution-physiographic-regions-provinces-and-districts (accessed on 27 March 2025).
- Google Earth Engine. LandScan Global. Available online: https://developers.google.com/earth-engine/datasets/catalog/projects_sat-io_open-datasets_ORNL_LANDSCAN_GLOBAL (accessed on 21 March 2025).
- Hansen, M.C.; Potapov, P.V.; Moore, R.; Hancher, M.; Turubanova, S.A.; Tyukavina, A.; Thau, D.; Stehman, S.V.; Goetz, S.J.; Loveland, T.R.; et al. High-resolution global maps of 21st-century forest cover change. Science 2013, 342, 850–853. [Google Scholar] [CrossRef] [PubMed]
- Bhaduri, B.; Bright, E.; Coleman, P.; Dobson, J. LandScan: Locating people is what matters. Geoinformatics 2002, 5, 34–37. [Google Scholar]
- Fotheringham, A.S.; Brunsdon, C.; Charlton, M. Geographically weighted regression. In The Sage Handbook of Spatial Analysis; SAGE Publications Ltd.: New York, NY, USA, 2009; pp. 243–254. [Google Scholar]


| Year | Tree Cover Pixels | Population Pixels | Tree Cover ∩ Population Pixels |
|---|---|---|---|
| 2000 | 122,588 | 163,960 | 121,990 |
| 2005 | 112,277 | 129,268 | 94,121 |
| 2010 | 94,560 | 131,352 | 81,097 |
| 2015 | 74,074 | 126,889 | 61,132 |
| 2020 | 66,455 | 119,109 | 51,324 |
| Latitude | Longitude | District | Municipality | Local R2 |
|---|---|---|---|---|
| 27.1559 | 85.0794 | Bara | Jitpur Simara | 0.812 |
| 27.1738 | 85.0524 | Bara | Jitpur Simara | 0.812 |
| 27.1469 | 85.0794 | Bara | Jitpur Simara | 0.802 |
| 27.1738 | 85.0704 | Bara | Jitpur Simara | 0.797 |
| 27.1559 | 85.0883 | Bara | Kolhabi | 0.796 |
| 27.1648 | 85.2680 | Rautahat | Gujara | 0.796 |
| 27.1828 | 85.2680 | Rautahat | Gujara | 0.794 |
| 27.1738 | 85.2590 | Rautahat | Gujara | 0.791 |
| 27.1648 | 85.2770 | Rautahat | Gujara | 0.790 |
| 27.1828 | 85.2590 | Rautahat | Gujara | 0.787 |
Disclaimer/Publisher’s Note: The statements, opinions and data contained in all publications are solely those of the individual author(s) and contributor(s) and not of MDPI and/or the editor(s). MDPI and/or the editor(s) disclaim responsibility for any injury to people or property resulting from any ideas, methods, instructions or products referred to in the content. |
© 2025 by the author. Licensee MDPI, Basel, Switzerland. This article is an open access article distributed under the terms and conditions of the Creative Commons Attribution (CC BY) license (https://creativecommons.org/licenses/by/4.0/).
Share and Cite
Eaturu, A. Monitoring Forest Cover Trends in Nepal: Insights from 2000–2020. Sustainability 2025, 17, 6511. https://doi.org/10.3390/su17146511
Eaturu A. Monitoring Forest Cover Trends in Nepal: Insights from 2000–2020. Sustainability. 2025; 17(14):6511. https://doi.org/10.3390/su17146511
Chicago/Turabian StyleEaturu, Aditya. 2025. "Monitoring Forest Cover Trends in Nepal: Insights from 2000–2020" Sustainability 17, no. 14: 6511. https://doi.org/10.3390/su17146511
APA StyleEaturu, A. (2025). Monitoring Forest Cover Trends in Nepal: Insights from 2000–2020. Sustainability, 17(14), 6511. https://doi.org/10.3390/su17146511