1. Introduction
As a country endowed with rich fossil energy resources, Indonesia has long positioned itself as a key global player in the export of coal and crude oil. With coal export volumes exceeding 470 million metric tons in 2022 and oil exports continuing to play a vital role in regional trade, fossil fuel exports have contributed significantly to the country’s GDP, government revenues, and foreign exchange reserves. However, this reliance on fossil fuel exports also presents a complex policy challenge [
1]. While the energy export sector bolsters economic resilience, it simultaneously raises environmental concerns, particularly in the context of rising greenhouse gas (GHG) emissions and Indonesia’s commitment to global climate goals [
2].
This tension is particularly relevant in the context of the Sustainable Development Goals (SDGs). On the one hand, Goal 8 emphasizes sustained economic growth and increased exports as key indicators of development. On the other hand, Goal 13 urges nations to take urgent action against climate change, while Goal 7 calls for affordable, reliable, and sustainable energy systems. These intersecting goals illustrate the fundamental dilemma: can Indonesia maintain its economic gains from fossil fuel exports without undermining its environmental sustainability commitments? The answer to this question is far from straightforward and demands deeper empirical investigation.
Equally important, this dilemma presents theoretical considerations that merit deeper investigation. The international trade of fossil fuels by a resource-abundant, middle-income country such as Indonesia likely plays a significant role in shaping domestic environmental outcomes. The extent to which established frameworks—such as the Environmental Kuznets Curve (EKC) or the Resource Curse Theory—can account for the concurrent trends of economic advancement and ecological degradation remains insufficiently explored, particularly within the context of Indonesia’s export-driven emissions trajectory. However, existing formulations of these theories often treat trade activities, especially fossil fuel exports, as purely economic drivers and overlook their indirect yet significant impact on domestic emissions via upstream processes. This study aims to contribute a theoretical refinement by reconceptualizing fossil fuel exports as environmental stressors within the EKC and Resource Curse paradigms.
While exported coal and oil are ultimately combusted abroad, contributing to the global carbon budget, domestic extraction, transportation, and port operations tied to these exports also generate significant CO
2 emissions [
3]. Therefore, fossil fuel exports should not be treated as environmentally neutral activities. Despite this, much of the existing literature on Indonesia’s emissions profile tends to focus on energy consumption, industrial output, or land use change, with relatively little attention paid to the role of energy exports as a driver of domestic emissions.
This oversight reflects a broader theoretical gap. Most existing frameworks treat fossil fuel exports primarily as economic variables or revenue generators. Rarely are they positioned within theoretical models as integrated drivers of environmental stress, particularly through indirect channels such as domestic infrastructure expansion, upstream energy use, or environmental externalities in extraction zones. This paper addresses this gap by repositioning fossil fuel exports as endogenous components in the theoretical modeling of environmental degradation, thus expanding the analytical scope of existing environmental–economic frameworks.
Several studies have examined the environmental consequences of energy use in varying economic and regional contexts. For example, Zhang et al. [
4] found a strong positive correlation between oil prices, urbanization, and CO
2 emissions among G7 countries, while Sam et al. [
5] demonstrated that oil prices and financial development significantly influence emissions levels in Oman. In the European context, Javed et al. [
6] analyzed the complex nexus between oil prices, foreign direct investment, and energy consumption in Italy using wavelet and ARDL approaches, revealing dynamic and lagged effects. Additionally, Salahodjaev and Sadikov [
7] emphasized how structural economic factors and renewable energy adoption intersect in shaping emissions across countries with high health vulnerabilities. In terms of methodological advancement, Marín-Rodríguez et al. [
8] employed wavelet analysis to assess how oil prices interact with carbon markets and green finance, highlighting the need for more temporally sensitive models. Luo et al. [
9,
10], studying the co-movement of energy and carbon prices in China, further supported the notion that price dynamics play a critical role in shaping emission pathways. This study offers a chance to revisit and adapt established theoretical frameworks by applying them to the Indonesian context, helping to deepen understanding of how trade in extractive industries affects environmental outcomes.
Despite the growing volume of such research globally, Indonesia remains underrepresented in studies that specifically integrate fossil fuel export behavior with emissions dynamics using time-sensitive econometric approaches. Most existing studies still employ static regression models, which may capture correlation but overlook the temporal dynamics and feedback mechanisms that characterize the interaction between economic and environmental variables. There is a growing need for models that can reflect both immediate and lagged relationships—capturing, for instance, how rising oil prices today might incentivize export growth and influence emissions several years down the line.
This paper adopts an analytical lens that goes beyond empirical associations to conceptualize fossil fuel exports as endogenous elements in environmental transitions—mediating the relationship between price signals and ecological impact over time. This study seeks to address these gaps by analyzing the dynamic interrelationship between Indonesia’s energy exports (coal and oil), global crude oil prices, and CO2 emissions using a Vector Autoregressive (VAR) modeling approach. Unlike static models, VAR is well-suited for analyzing time-series data where variables are mutually endogenous and evolve over time. This method enables a deeper understanding of both the direction and strength of inter-variable interactions, offering more robust insights for policy formulation. Moreover, by applying VAR in this specific context, this study contributes methodologically to the literature by demonstrating the utility of this approach in tracing shock propagation and feedback among trade, price, and environmental variables—an area that remains underdeveloped in sustainability science.
Data used in this study span from 2002 to 2022 and are drawn from internationally recognized sources, including Statistics Indonesia (BPS), the World Bank’s Pink Sheet, and the EDGAR and WDI emissions databases [
11,
12,
13]. The analysis focuses not only on estimating long-run relationships but also on tracing short-term responses to shocks in the system using Impulse Response Functions (IRFs) and Forecast Error Variance Decomposition (FEVD).
The novelty of this research lies in three key aspects. First, it offers an export-centered perspective on Indonesia’s emissions profile, an angle that has been largely underrepresented in the empirical literature. Second, it incorporates international oil price dynamics as an exogenous force shaping national energy export behavior and, indirectly, environmental outcomes. Third, it employs a VAR framework, which is underutilized in this context, to capture the temporal complexity of the energy–environment nexus in an economy that is both energy-rich and climate-vulnerable. Theoretically, this study expands the scope of environmental–economic models by integrating fossil fuel export activities as embedded drivers of emission outcomes rather than exogenous economic inputs. Taken together, these elements represent more than a descriptive case study—they form the foundation for theoretical refinement. This paper contributes to a growing body of work that reconceptualizes how trade and environmental outcomes co-evolve, especially in nations positioned at the intersection of extractive dependence and climate vulnerability.
The findings of this study are expected to support more integrated policymaking by revealing how Indonesia’s fossil fuel export activities influence its emission trajectory, both directly and indirectly. Such insights are crucial as the country navigates a critical transition: balancing the economic benefits of energy exports with its responsibility to mitigate climate change under its nationally determined contributions (NDCs).
2. Materials and Methods
2.1. Data Description
This study utilizes annual time-series data from 2002 to 2022 to investigate the relationship between energy exports, global oil prices, and carbon dioxide (CO
2) emissions in Indonesia. The selection of this period is based on the availability of consistent and complete data across all variables involved. Although spanning 21 years, this duration is considered sufficient for annual time-series analysis using VAR and cointegration models, as supported by the prior empirical literature [
12,
14]. The chosen timeframe is also methodologically relevant and contextually significant, as it includes key macroeconomic and policy events that have shaped Indonesia’s energy–environment landscape. Among these are the 2008 global financial crisis, the 2014–2016 oil price collapse, the 2020 COVID-19 pandemic, and Indonesia’s ratification of the Paris Agreement in 2016. These events introduce structural variations and behavioral shifts in both energy trade and emissions patterns, providing valuable dynamic information for empirical modeling. Thus, the period 2002–2022 offers not only data completeness but also substantive policy relevance for exploring long-run and short-run interactions among the studied variables.
Four main indicators are employed in the analysis. First, coal export volume, measured in million tons, reflects Indonesia’s coal export performance and is obtained from Statistics Indonesia (BPS). Second, oil export volume, in million barrels, represents the volume of crude oil exported annually, also collected from BPS and validated through UN Comtrade. Third, crude oil prices, expressed in US dollars per barrel, are used as a proxy for international energy market conditions and are sourced from the World Bank Pink Sheet database. Lastly, CO2 emissions, measured in million metric tons, are used to represent the environmental outcome of energy-related activities, drawn from the World Development Indicators (WDIs) and EDGAR databases.
To further enhance theoretical engagement, this study incorporates a targeted literature review on emissions drivers and energy trade dynamics in middle-income, resource-exporting countries. The theoretical rationale for selecting these variables is grounded in the strong interdependence between fossil fuel trade and environmental externalities. Crude oil prices influence the profitability of energy exports, which in turn affects production levels and, consequently, emissions associated with extraction, processing, and logistics. In resource-rich economies like Indonesia, fluctuations in global oil prices often lead to shifts in export volume as producers respond to market incentives [
5,
15]. At the same time, higher export volumes can indirectly shape the national emission profile, especially when upstream activities—such as mining, refining, and transport—remain carbon-intensive [
16,
17]. In this context, studying the triadic link between prices, trade flows, and emissions offers a comprehensive view of how external economic signals propagate through the domestic energy system and affect sustainability outcomes.
This study makes a marginal contribution by extending the Environmental Kuznets Curve (EKC) and trade–environment frameworks to the case of an energy-exporting developing country with volatile macroeconomic exposure. By situating Indonesia’s fossil fuel export behavior within these models, this research highlights how energy trade acts not only as an economic lever but also as a dynamic environmental pressure point—especially under fluctuating oil price regimes. The choice of variables is guided by theoretical integration. Crude oil prices act as a global market signal, influencing export incentives and production intensity. Fossil fuel exports, in turn, drive domestic emissions through upstream activities. Thus, this study conceptualizes energy exports not only as economic outputs but as embedded environmental processes. This orientation aligns with theories such as the Environmental Kuznets Curve (EKC), the Resource Curse, and the trade–environment nexus. In particular, this study extends EKC by emphasizing how trade-related activity—rather than just income—affects emissions, especially under volatile price regimes. Similarly, it enriches the trade–environment literature by demonstrating how upstream export processes generate environmental burdens often overlooked in consumption-based frameworks.
All variables were converted to a consistent annual frequency and processed using standard techniques. A logarithmic transformation was applied to variables exhibiting skewness or heteroscedasticity, while differencing was used to address non-stationarity where detected. These preprocessing steps ensure that the time-series data meet the assumptions required for Vector Autoregression (VAR) modeling and allow for meaningful interpretation of both short-term dynamics and long-term trends.
In terms of theoretical framing, this study draws from several foundational concepts in environmental economics and international trade. The Environmental Kuznets Curve (EKC) hypothesis, for instance, suggests that environmental degradation initially rises with economic growth but eventually declines after surpassing a certain income threshold. While useful, this theory often omits the distinct role of fossil fuel exports in shaping environmental outcomes, especially in resource-rich developing countries. Similarly, the Resource Curse Theory emphasizes how an overreliance on extractive exports can undermine long-term economic development and governance—but its environmental dimension is frequently underdeveloped. This study also engages with the broader trade–environment nexus, which examines how trade openness and commodity flows influence ecological indicators. By situating Indonesia’s fossil fuel export patterns within this theoretical spectrum, this research aims to assess and refine these frameworks in a context marked by export-driven growth and rising carbon emissions. Furthermore, the inclusion of global oil prices introduces a market-driven mechanism that links international economic conditions to domestic environmental consequences—an area that remains weakly theorized in the existing literature.
2.2. Methodological Approach
To capture the interdependencies and time-lagged relationships among the variables, this study applies a Vector Autoregression (VAR) model. The VAR model is particularly suitable for systems where all variables are potentially endogenous and where the objective is to understand the mutual influence of variables across time. In this context, energy exports, global oil prices, and CO2 emissions are likely to exhibit complex feedback effects and delayed responses, making VAR a methodologically appropriate and flexible framework.
The general structure of the VAR model is as follows:
where
is a vector of endogenous variables at time
t,
are coefficient matrices,
c is a vector of constants, and
is a vector of white noise disturbances. In this study, the variable vector time series is as follows:
The VAR model does not require strong theoretical assumptions about which variables are exogenous or endogenous. This makes it ideal for exploratory analysis in macroeconomic and environmental systems where causality may be bidirectional or uncertain. For instance, while energy exports may contribute to rising emissions, increases in emissions or global oil prices may also influence future energy policy and export behavior. The VAR framework captures such interdependencies by modeling each variable as a function of its own past values and the past values of all other variables in the system.
Furthermore, the VAR approach allows for the application of Impulse Response Functions (IRFs) to trace the effects of shocks in one variable on others over multiple periods, as well as Forecast Error Variance Decomposition (FEVD) to assess the relative importance of each shock in explaining the variability of a target variable. These tools are essential for deriving dynamic policy insights, especially when dealing with time-lagged effects or feedback mechanisms.
In interpreting the VAR coefficients, it is important to note that a statistically significant positive coefficient indicates that an increase in the lagged value of an explanatory variable is associated with an increase in the dependent variable, holding other factors constant. Conversely, a negative coefficient suggests a dampening effect. For instance, a positive and significant lag of crude oil prices on CO2 emissions may reflect cost-driven incentives for expanded extraction and export activities, ultimately contributing to higher domestic emissions. However, when coefficients are found to be statistically insignificant, they do not necessarily imply an absence of relationship; rather, such results may reflect underlying structural inertia, measurement imprecision, or the presence of delayed effects not fully captured by the current lag specification. These outcomes warrant careful interpretation, particularly in complex systems where policy, market, and environmental responses unfold over extended periods.
Prior studies have validated the VAR framework in similar settings. The use of this approach in macroeconomics to model dynamic feedback without imposing unrealistic identifying restrictions [
12]. Later, Ref. [
14] applied VAR-based cointegration and causality testing to explore energy–growth interlinkages in OECD countries, confirming bidirectional influences. These applications demonstrate VAR’s capacity to uncover both immediate and delayed responses, reinforcing our choice to employ VAR in examining Indonesia’s energy-export–emission nexus.
2.3. Estimation Procedures
Before model estimation, the stationarity of each variable was tested using the Augmented Dickey–Fuller (ADF) test. Variables found to be non-stationary were differenced accordingly. The optimal lag length for the VAR model was determined using the Akaike Information Criterion (AIC) and Schwarz Bayesian Criterion (SBC) to ensure the best model fit.
Estimation was performed using the vars package in R, with all equations in the system estimated by Ordinary Least Squares (OLS). Following model estimation, two diagnostic tools were applied. First, Impulse Response Functions (IRFs) were used to trace the effect of one-time shocks to one variable on the current and future values of the other variables. Second, Forecast Error Variance Decomposition (FEVD) was conducted to determine the contribution of each shock to the forecast error variance of CO2 emissions. These tools allow for a deeper understanding of the temporal influence between energy export behavior and environmental outcomes.
2.4. Analytical Framework
To guide the research process and ensure methodological transparency, this study follows a structured analytical framework as illustrated in
Figure 1 below.
The framework begins with data collection, which involves gathering consistent annual records for energy exports, oil prices, and emissions. This is followed by data preprocessing, including transformation and stationarity testing to meet the assumptions of time-series modeling. The next step is the estimation of the VAR model, where lag selection and equation estimation are conducted. Once the model is established, post-estimation analysis is carried out using IRF and FEVD to uncover the dynamic interactions and forecast impacts. Finally, the results are interpreted in light of energy and climate policy goals, highlighting how fossil fuel export behavior influences environmental sustainability.
The design of this framework reflects an intentional alignment between economic theory and empirical modeling. Rather than treating energy exports as passive outputs, the framework positions them as mediators between global price signals and environmental outcomes, operationalizing the conceptual links embedded in the EKC, resource curse, and trade–environment literature.
This analytical approach is further underpinned by several theoretical frameworks that inform the expected relationships among variables. The Environmental Kuznets Curve (EKC) suggests that emissions rise with economic growth at early stages and decline after a certain threshold—though it typically centers on income rather than trade. The Resource Curse Theory warns of the developmental pitfalls of dependence on resource exports but often overlooks environmental consequences. Meanwhile, the trade–environment nexus framework examines how international trade activities—such as fossil fuel exports—can lead to environmental degradation, especially when upstream activities remain carbon-intensive. By integrating these perspectives, the analytical framework posits that oil price fluctuations act as external stimuli, influencing export volumes, which in turn affect CO2 emissions through domestic production processes. The use of VAR modeling helps to empirically trace these theoretical linkages across time.
3. Results and Discussions
3.1. Descriptive Statistics
To contextualize the dynamic relationships examined later in the model, this section presents summary statistics that reflect Indonesia’s dual status as both a major energy exporter and an emissions-intensive economy. These statistics align with theoretical expectations from the Environmental Kuznets Curve (EKC), Resource Curse Theory, and trade–environment literature. These descriptive trends highlight the likelihood of inter-dependency among variables, where price shocks and export volumes may shape emissions outcomes over time. These patterns also justify the application of a dynamic model like VAR.
Table 1 presents the descriptive statistics for the four main variables over the period 2002–2022: coal export volume, oil export volume, crude oil price, and CO
2 emissions. The data show considerable variation across years, reflecting both market dynamics and structural transitions in Indonesia’s energy sector.
These patterns mirror expectations from the EKC, which anticipates emissions growth during early economic expansion, and from the trade–environment nexus, which posits environmental degradation tied to fossil export dependency.
The average volume of coal exports during the observed period was approximately 171 million tons, with a relatively high standard deviation (±74.18), indicating rapid expansion over the two decades. The distribution shows positive skewness, suggesting that extreme high export years are more common than extremely low ones.
Conversely, oil export volumes averaged 336 million barrels, showing a declining trend toward the latter years of the sample. The slightly negative skewness suggests a concentration of data on the higher side, reflecting historical overreliance on oil exports in the early 2000s and a tapering off afterward due to resource depletion and shifting energy strategies.
Crude oil prices fluctuated significantly over the sample period, from as low as USD 24 per barrel to over USD 110. This high variation mirrors major global events such as the 2008 financial crisis, the oil price collapse of 2014–2016, and pandemic-related disruptions [
18,
19]. The positive skewness and platykurtic distribution (kurtosis < 3) indicate a price distribution flatter than normal, with occasional but not extreme outliers.
CO
2 emissions rose steadily, averaging 453 million metric tons, with maximum emissions recorded in 2022. The nearly symmetrical skewness and low kurtosis indicate a relatively smooth upward trend, rather than sudden jumps or shocks. These trends are also depicted in
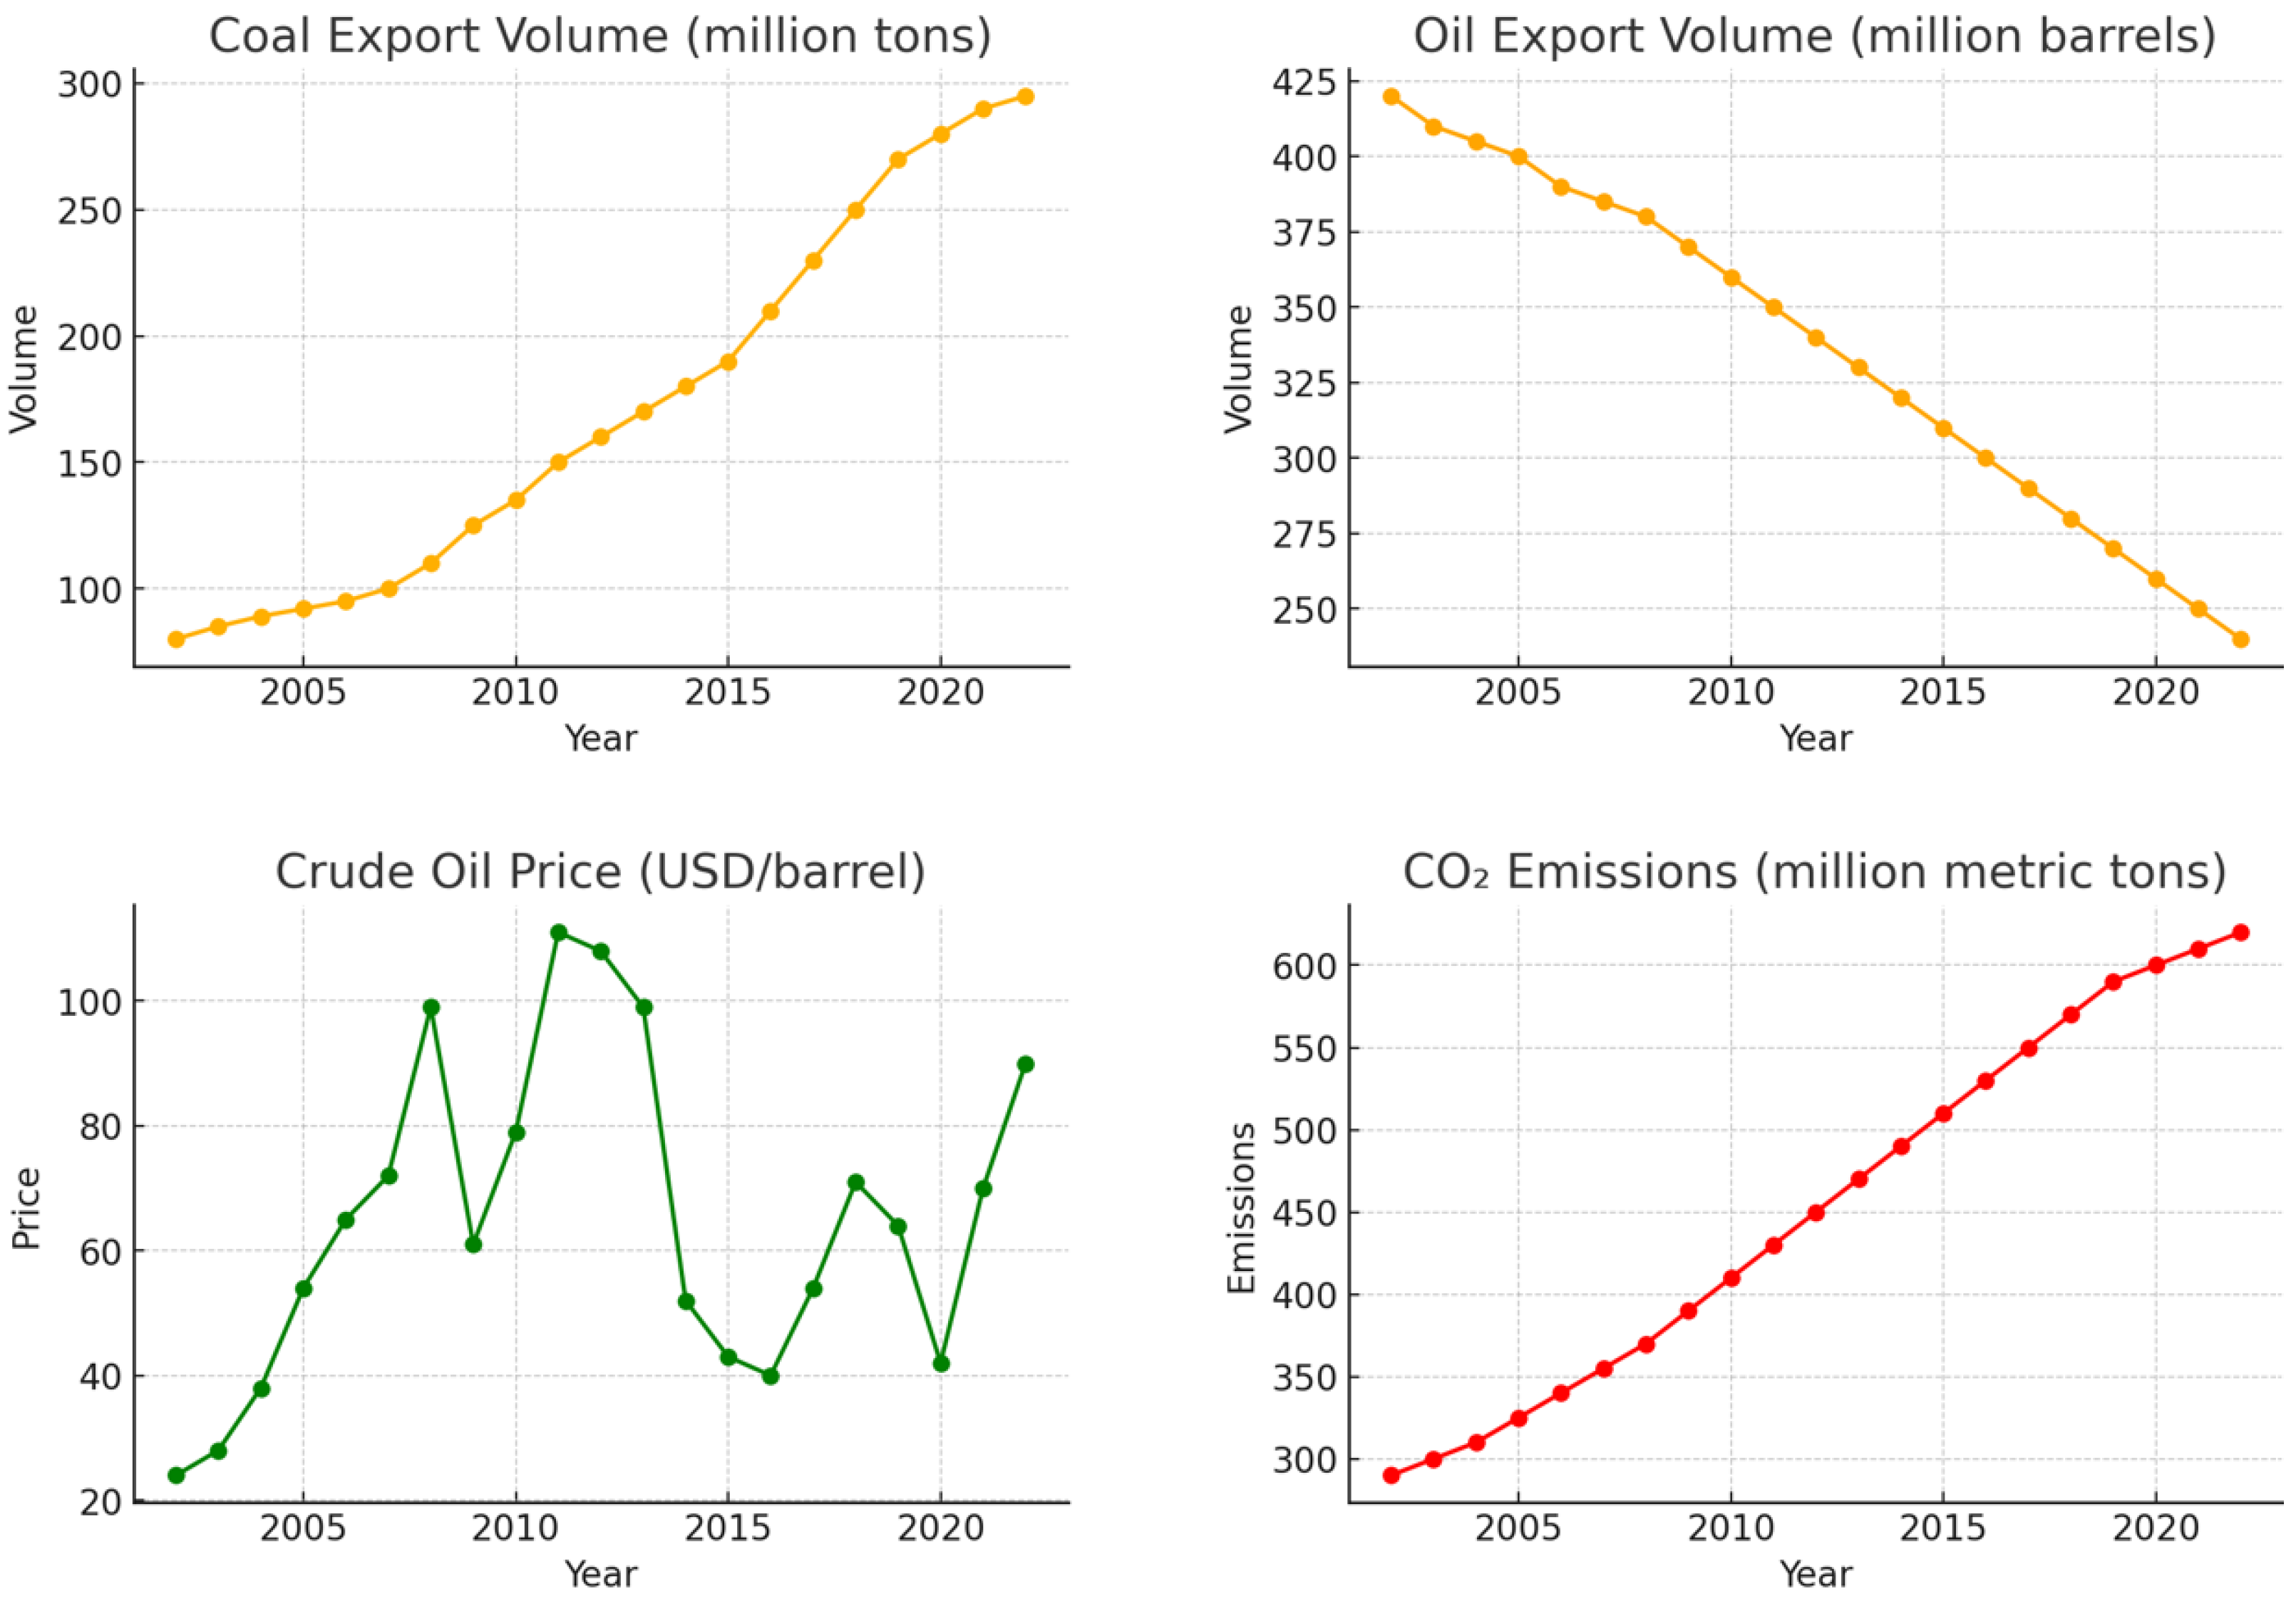
Figure 2, which illustrates the annual trajectories of all four variables over the sample period.
The visual trends illustrated in
Figure 2 provide several important insights into the evolution of Indonesia’s energy export activities and environmental outcomes over the two-decade period. The top-left panel shows a consistent upward trajectory in coal export volumes, highlighting the country’s growing dependence on coal as a major source of foreign revenue. This trend is particularly pronounced after 2010, aligning with rising global demand—especially from Asian economies such as China and India—and domestic policy support for coal production and export infrastructure.
In contrast, the top-right panel reveals a steady decline in oil export volumes from over 400 million barrels in 2002 to below 250 million barrels by 2022. This trend reflects resource depletion, a reduction in oil exploration investment, and rising domestic consumption, which has redirected oil supply toward internal use rather than export. The inverse relationship between coal and oil exports suggests a structural shift in Indonesia’s energy export composition, possibly driven by changing cost structures and market access.
The bottom-left panel depicts global crude oil price fluctuations, with sharp increases in 2008 and 2011 followed by collapses in 2009, 2015–2016, and again during the COVID-19 pandemic in 2020. These fluctuations reflect a combination of global financial shocks, geopolitical conflicts, and shifts in supply–demand balance. While the oil price is externally determined, it indirectly affects Indonesia’s energy export revenues and government fiscal planning.
Finally, the bottom-right panel shows a relatively linear upward trend in CO2 emissions, increasing from approximately 290 million metric tons in 2002 to over 600 million metric tons in 2022. The trajectory is notably smooth, indicating persistent growth in emission-intensive activities, likely tied to the expansion of fossil fuel production, power generation, and industrial development.
Figure 2 reveals several important temporal patterns. Coal exports exhibit a steady and consistent increase, especially after 2010, reflecting growing global demand and domestic production capacity. In contrast, oil exports display a gradual decline, likely due to falling reserves, higher domestic consumption, and shifts in extraction policy. Crude oil prices show sharp volatility, with noticeable peaks in 2008 and 2012, and deep troughs in 2016 and 2020. Meanwhile, CO
2 emissions demonstrate a nearly linear upward trend, reflecting structural dependence on fossil fuels in Indonesia’s economy.
3.2. Unit Root Test and Stationarity
To align the time-series structure with theoretical expectations such as the Environmental Kuznets Curve (EKC) and the resource-dependence hypothesis, this section conducts a unit root test to examine the stationarity properties of each variable. Stationarity is essential in time-series modeling as it ensures meaningful estimation and inference in a Vector Autoregression (VAR) framework.
Grounded in time-series theory, the Augmented Dickey–Fuller test is employed to ensure stationarity, a prerequisite for valid Vector Autoregression (VAR) modeling. This is vital for capturing the intertemporal propagation mechanisms suggested by theoretical frameworks like the EKC and the energy dependence hypothesis.
Before estimating the Vector Autoregressive (VAR) model, all time-series variables were subjected to stationarity testing using the Augmented Dickey–Fuller (ADF) test. This transformation ensures that all series used in the estimation are integrated of order zero, I(0), as required [
20,
21]. Stationarity is a crucial assumption in VAR modeling, as non-stationarity series may lead to spurious regression results and unreliable inferences. The test results are summarized in
Table 2.
Based on the results summarized in
Table 2, Oil Export Volume and Crude Oil Price are stationary at level, as indicated by their ADF test statistics and corresponding
p-values being below the 5% significance threshold. In contrast, Coal Export Volume and CO
2 Emissions are non-stationary at level, with their ADF statistics failing to reject the null hypothesis of unit root.
To meet the stationarity requirement for Vector Autoregression (VAR) modeling, the first differences of Coal Export Volume and CO2 Emissions were employed in subsequent estimations. This transformation ensures that all variables included in the model are integrated of order zero, I(0), and hence suitable for VAR analysis.
Such a mixed integration order is typical in macroeconomic and energy-related time series, where structural trends and long-term transitions—such as shifts in energy mix or gradual emissions accumulation—can affect stationarity. Differencing also helps to isolate short-run dynamics, which are crucial for understanding energy policy responsiveness and environmental outcomes. The necessity of differencing some variables reinforces the importance of rigorous pre-testing and preprocessing in dynamic modeling frameworks, particularly when the goal is to capture intertemporal causal mechanisms relevant to energy policy and environmental sustainability.
To complement the results of the Augmented Dickey–Fuller (ADF) test presented in
Table 2,
Figure 3 visualizes the time-series behavior of oil export volume and CO
2 emissions—two variables identified as non-stationary at level. Both the original and first-differenced forms are plotted to illustrate how differencing transforms the series into stationarity form suitable for VAR modeling.
Figure 3 illustrates the time-series patterns of Indonesia’s coal export volume and CO
2 emissions from 2002 to 2022, presented in both level and first-differenced formats. The upper panels reveal the original trajectories of the two variables. Coal exports display a consistent upward trend, with a notable acceleration after 2010. This long-term increase suggests the presence of non-stationarity and is consistent with Indonesia’s expanding role in global coal markets, driven by sustained international demand and domestic policies that have prioritized coal production and exportation as a key economic strategy.
The pattern of CO2 emissions similarly shows an uninterrupted rise over the two-decade period, growing from around 290 to over 620 million metric tons. This steady growth underscores the structural nature of emissions linked to fossil fuel extraction and use, particularly as energy demand intensifies alongside industrialization and economic expansion. The absence of fluctuations around a stable mean further supports the non-stationary nature of the emissions series, as also indicated by the unit root test.
In contrast, the lower panels of
Figure 3 display the first-differenced versions of both series. The transformation of the coal export data reduces the long-run trend and stabilizes the series around a zero mean, albeit with observable variations in specific years—especially between 2014 and 2020. Likewise, the differenced CO
2 emissions series exhibits relatively stable year-on-year increments, most pronounced between 2009 and 2019, before showing lower variability toward the end of the sample. These results indicate that both series become stationary after differencing, meeting one of the key assumptions for subsequent modeling using the Vector Autoregression (VAR) framework.
It is important to recognize that differencing unveils inter-annual volatility previously masked by cumulative trends, which aligns with theoretical expectations about energy policy shocks and environmental lag effects. In the case of coal exports, these variations likely reflect underlying structural shocks such as changes in international demand, domestic energy policy, and infrastructure constraints. For CO2 emissions, the differenced series appears flatter during periods of consistent emission increases, but sharp adjustments at the beginning and end of the series become more visible after transformation. Thus, the visual increase in variability does not indicate noise or instability, but rather uncovers short-term dynamics that are essential for time-series modeling.
The observed non-stationarity of emissions aligns with the notion of long-term environmental accumulation predicted by the EKC. The structural trends in coal exports also reflect path-dependent dynamics predicted by the Resource Curse Theory.
3.3. VAR Lag Selection and Model Estimation
This section empirically tests the dynamic interactions theoretically implied by the trade–environment nexus and the Environmental Kuznets Curve (EKC), focusing on how global oil price shocks influence export patterns and, subsequently, CO2 emissions. By applying the VAR framework, this section empirically tests the theoretically postulated dynamic linkages—such as oil price shocks influencing exports and exports influencing CO2 emissions. The model reflects a system of endogenous variables, congruent with the feedback-oriented nature of the trade–environment paradigm.
To estimate the dynamic relationship among the selected variables, a Vector Autoregression (VAR) model of order one [VAR(1)] was estimated. The model incorporates four endogenous variables: coal export volume, oil export volume, crude oil price, and the first-differenced CO
2 emissions. To ensure robustness, both the Akaike Information Criterion (AIC) and Schwarz Bayesian Criterion (SBC) were computed. While AIC suggested a lag length of 1, SBC also indicated the same optimal lag, reinforcing the selection of a parsimonious model structure.
Table 3 presents the estimation results for each of the four equations in the VAR system, including coefficient estimates, standard errors, t-values, and statistical significance levels.
Subsequently, the VAR(1) model was estimated, and the results are reported in
Table 4. Each equation in the system corresponds to one of the endogenous variables, and coefficients reflect the one-period lagged effects of other system variables. It is important to address the potential concern of endogeneity between energy exports, prices, and carbon emissions—particularly since these variables are likely to influence each other over time. This issue is precisely why the use of a VAR framework is appropriate. By design, VAR models treat all variables as endogenous, allowing each to be explained by its own past values and the lagged values of other variables in the system. This structure captures the mutual feedback and temporal interdependence without requiring external instruments or prior assumptions about causal ordering. In addition, the use of first-differenced CO
2 emissions helps remove non-stationary trends and reduces the risk of spurious correlations that may otherwise arise in a trending data environment. Thus, while endogeneity is a valid concern in many econometric contexts, the structure and estimation strategy of the VAR model adopted in this study are well-suited to account for it inherently.
It is important to address the potential concern of endogeneity between energy exports, prices, and carbon emissions—particularly since these variables are likely to influence each other over time. This issue is precisely why the use of a VAR framework is appropriate. By design, VAR models treat all variables as endogenous, allowing each to be explained by its own past values and the lagged values of other variables in the system. This structure captures the mutual feedback and temporal interdependence without requiring external instruments or prior assumptions about causal ordering. In addition, the use of first-differenced CO2 emissions helps remove non-stationary trends and reduces the risk of spurious correlations that may otherwise arise in a trending data environment. Thus, while endogeneity is a valid concern in many econometric contexts, the structure and estimation strategy of the VAR model adopted in this study are well-suited to account for it inherently.
The estimation results in
Table 4 reveal diverse dynamic patterns across Indonesia’s energy export and environmental systems. Coal export volume is highly persistent, with a strong autoregressive coefficient (0.826,
), indicating structural continuity in export behavior likely due to long-term contracts and sustained global demand. Additionally, lagged CO
2 emissions exert a marginally significant positive effect (
), potentially reflecting policy inertia or cyclical feedback between extraction intensity and emission output.
Coal exports exhibit strong autoregressive behavior, indicating path dependence and possibly long-term contracts or sustained infrastructure investment. The positive impact of lagged emissions suggests the presence of a structural feedback mechanism, possibly due to extractive intensity that links emissions and coal production.
Oil exports are predominantly explained by their own lagged values, with a near-unit root behavior (0.9998, p < 0.001), pointing to a rigid and self-reinforcing trend. Other variables, including coal exports and CO2 emissions, show negative yet insignificant effects, suggesting limited short-term responsiveness to broader energy system dynamics.
Crude oil prices, on the other hand, exhibit external determination, with statistical significance only in their own lags (0.621, ). This aligns with expectations in an open economy, wherein oil prices are shaped by global supply–demand fundamentals and geopolitical risks, rather than domestic energy or environmental conditions.
The equation for first-differenced CO2 emissions displays more dynamic responsiveness. Significant negative coefficients for lagged coal and oil exports (both ) suggest that higher export activity may be associated with reduced domestic emission growth—possibly due to emissions displacement or structural efficiency gains. The significant autoregressive term (0.530, ) indicates that emissions maintain strong internal momentum over time.
The results support the theoretical claim that emissions, trade, and global prices are part of a recursive feedback system. The asymmetric effects and mixed signs align with predictions from the Resource Curse theory—where export-driven growth leads to economic and environmental rigidity—and the EKC, which suggests rising emissions at early stages of development before a turning point is reached.
These results underscore the asymmetric interactions between energy exports, market prices, and environmental outcomes. The persistence in trade volumes contrasts with the limited influence of domestic variables on price evolution, while emissions appear to react more flexibly to lagged trade shocks. This highlights the importance of understanding time-dependent mechanisms when formulating balanced energy–environment policies in resource-exporting economies such as Indonesia.
These findings underscore the critical role of export composition and domestic processing in determining Indonesia’s emission trajectory. The use of a VAR model provides empirical grounding for these theoretical assertions and lays the foundation for further analysis through IRF and FEVD in subsequent sections.
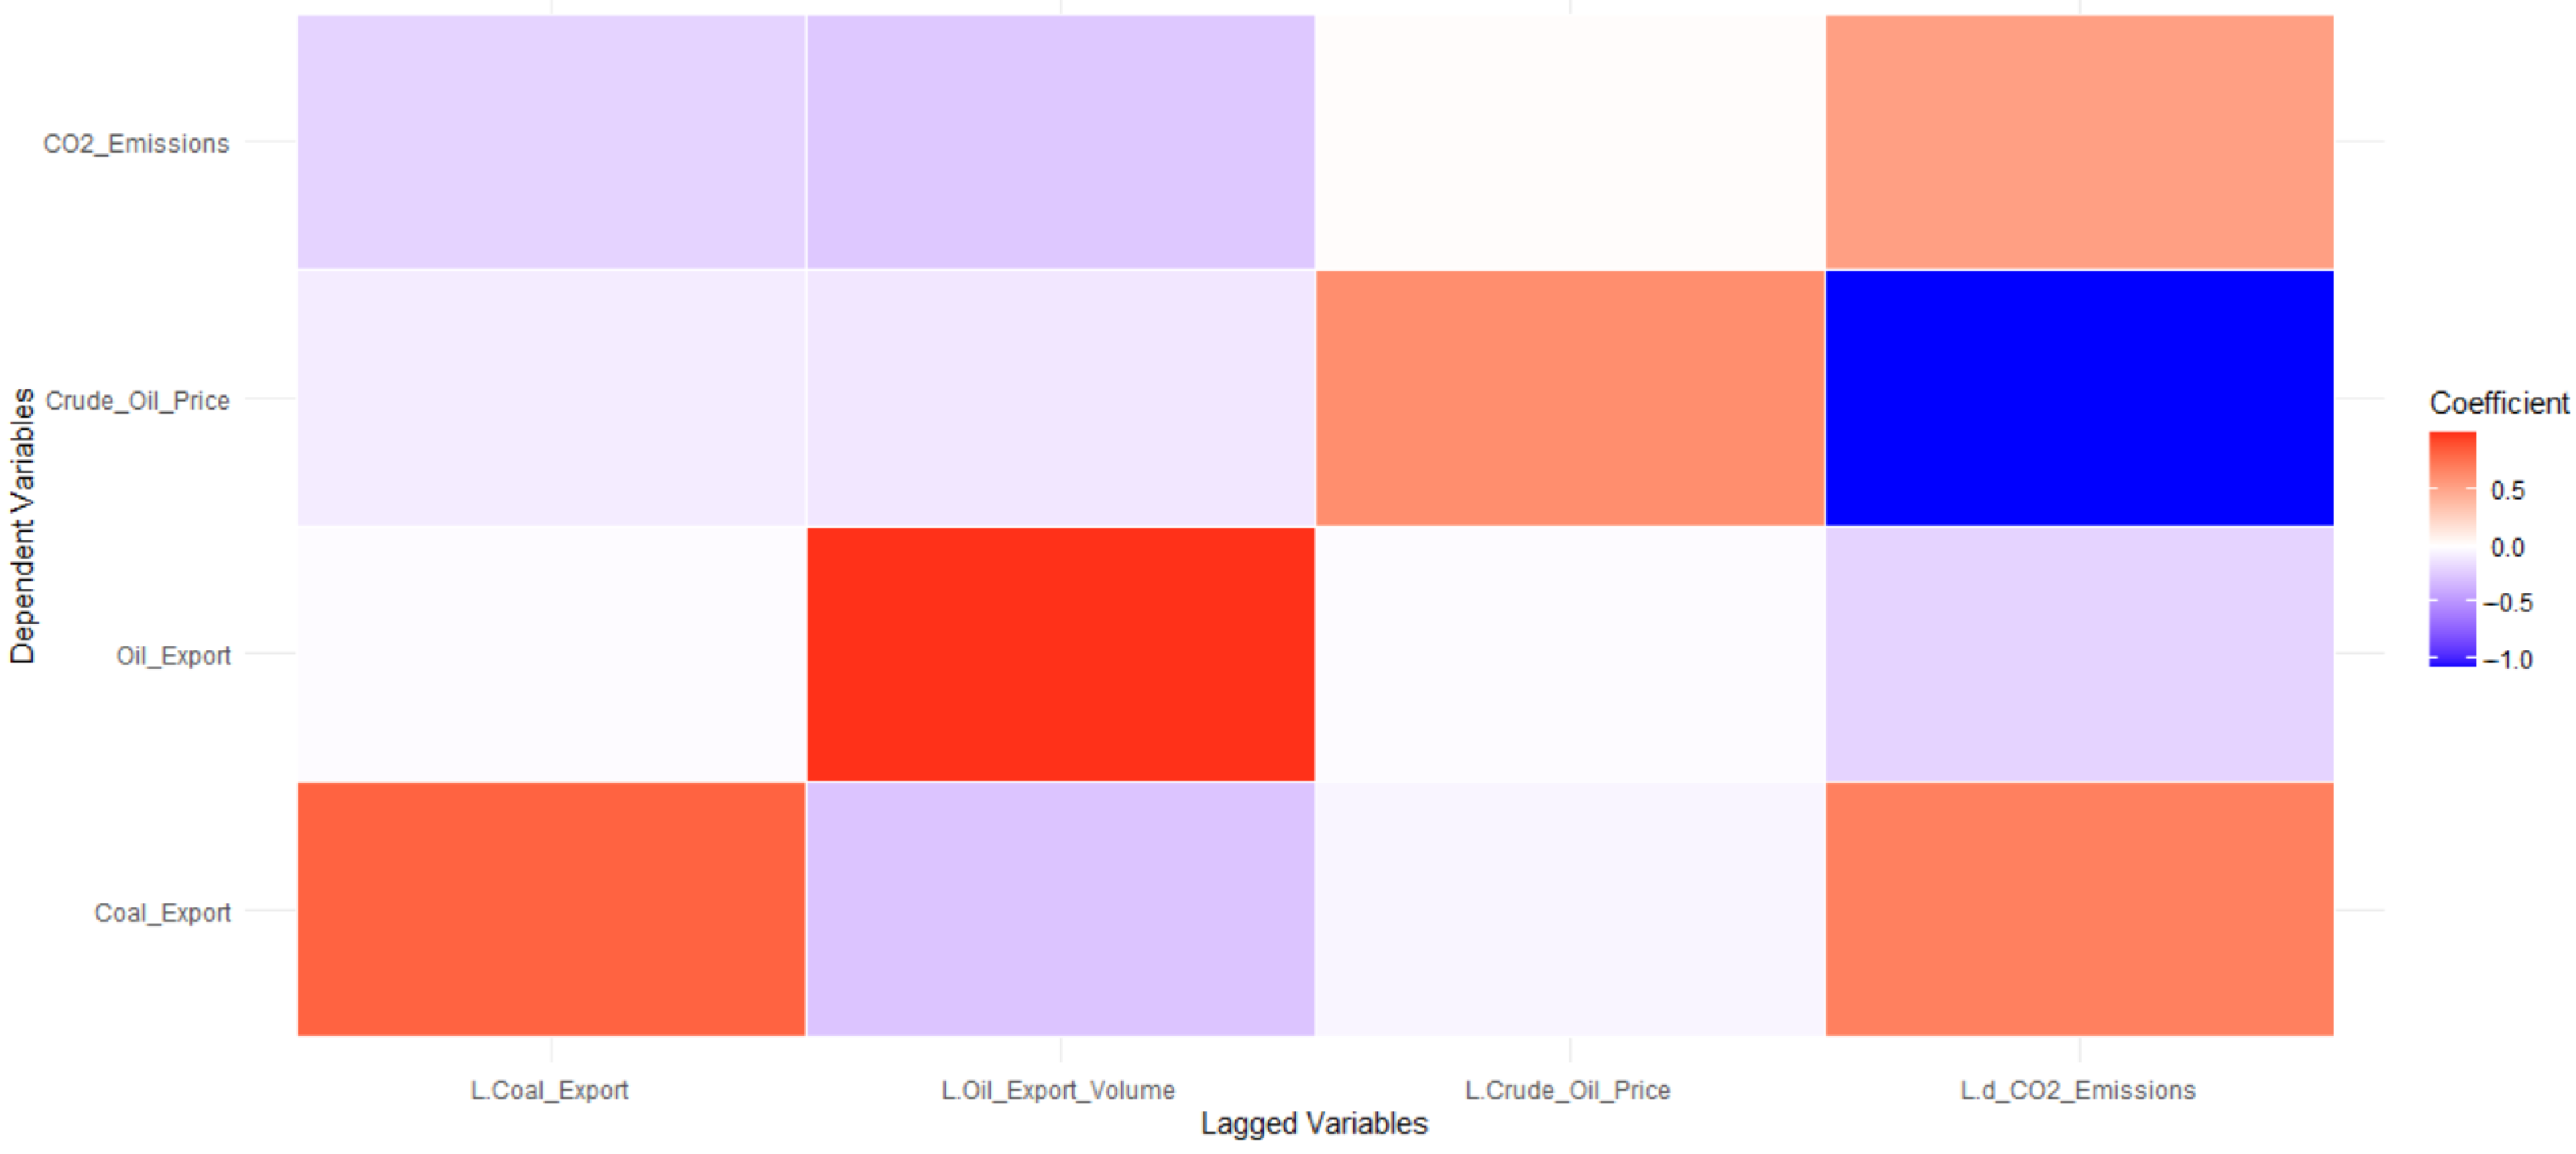
These results are visually summarized in
Figure 4, which presents the VAR(1) coefficient matrix as a heatmap.
Figure 4 provides a visual summary of the estimated coefficients from the VAR(1) model in the form of a heatmap, illustrating the direction and intensity of the lagged relationships among Indonesia’s key energy and environmental indicators. Warmer shades (red) denote positive effects, while cooler tones (blue) represent negative coefficients. The intensity of the color gradient reflects the relative magnitude of each estimated relationship, facilitating an intuitive interpretation of the complex interactions among variables.
Diagonal elements in the heatmap—especially for coal export volume, crude oil price, and CO2 emissions—are distinctly marked in red, signaling a high degree of own-lag dependence. This suggests that these variables are largely influenced by their respective past values, underscoring a persistent and autoregressive structure in Indonesia’s energy and environmental trends. Such persistence likely stems from long-term contracts, infrastructural inertia, and structural drivers in domestic energy demand.
Beyond the diagonal, several noteworthy cross-effects emerge. The heatmap reveals a significant positive influence of lagged CO2 emissions on coal export volume, potentially reflecting regulatory leniency or industrial demand patterns where rising emissions coincide with expanded coal production and exports. This may signal a feedback loop between export activity and environmental degradation, where emissions fail to constrain extractive policies.
In contrast, oil export volume appears negatively affected by both coal exports and CO2 emissions, as evidenced by the blue shades in the corresponding cells. This may indicate a resource reallocation effect—where increases in coal trade suppress oil export growth—or an adjustment mechanism in response to environmental and market pressures. The interplay suggests an ongoing restructuring in Indonesia’s fossil fuel portfolio, with coal increasingly dominating energy exports.
Crude oil prices, despite being a key economic variable, show limited responsiveness to export flows or emissions, aligning with the theoretical view that oil prices are driven primarily by external shocks in global markets. This reinforces Indonesia’s role as a price taker in international energy trade.
Lastly, CO2 emissions, while strongly dependent on their own historical path, are only weakly influenced by past values of trade or price variables. This implies that emissions in Indonesia may be shaped more by domestic consumption patterns, industrial activity, and broader development trends than by short-run export fluctuations.
In sum, the heatmap highlights asymmetric dependencies within the energy–environment system: coal exports and emissions are strongly self-reinforcing, oil exports are sensitive to structural shifts in fossil fuel dynamics, and emissions are persistently rising with limited immediate feedback from trade adjustments. These insights emphasize the necessity for targeted and coordinated energy–environment policies, especially as Indonesia navigates its dual objectives of economic development and climate responsibility.
3.4. Impulse Response Function (IRF) Analysis
The IRFs allow for empirical validation of theoretical assumptions—such as those from the EKC (nonlinear environmental responses), the Resource Curse Theory (resource volatility effects), and trade–environment feedback loops. To further explore the dynamic interactions among variables, Impulse Response Functions (IRFs) were generated based on the estimated VAR(1) model. IRFs trace the time-path effects of a one-standard-deviation shock in one variable on the current and future values of other variables in the system. This method is particularly useful for visualizing the temporal transmission of shocks and identifying delayed or persistent responses.
Figure 5 illustrates the 10-period horizon IRFs for each of the four endogenous variables: coal export volume, oil export volume (differenced), crude oil price, and CO
2 emissions (differenced). To focus on the environmental implications,
Table 5 summarizes the response of CO
2 emissions to shocks in each of the other three variables. This figure illustrates the dynamic responses of coal exports, oil exports (differenced), crude oil prices, and CO
2 emissions (differenced) to one-standard-deviation structural shocks from each variable in the system. The charts show how the effect of each shock evolves over a 10-period horizon, revealing persistence, decay, and direction of influence among the energy–environment variables. The impulse response results highlight several important transmission effects. The most pronounced result is the strong autoregressive behavior of CO
2 emissions. A shock to its own lag produces an immediate response of 1.0 (by construction), which then declines steadily across the horizon, reaching −0.17 by Period 9. This indicates persistent path dependency in Indonesia’s emissions, consistent with the EKC framework’s view that environmental pressures accumulate and dissipate slowly over time.
The impulse response analysis reveals distinct dynamic interactions among the studied variables. In the first row, shocks to each variable’s own innovation show expected self-reinforcing effects, particularly for coal export volume and CO2 emissions, which exhibit strong and persistent positive responses, suggesting internal momentum or structural persistence within those sectors. Meanwhile, oil export and crude oil price shocks exert minimal or neutral influence on coal exports in the short run. In the second row, the responses of oil export growth (d_Oil_Export) to external shocks are short-lived and tend to revert to equilibrium, indicating a stable adjustment mechanism. Crude oil price shocks lead to a sharp initial decline in oil exports, followed by stabilization, while CO2 emissions growth has a mild and transitory positive impact. The third row demonstrates how crude oil prices are most responsive to their own shocks, declining sharply before flattening out, which reflects the market’s self-correcting tendencies. Notably, coal and oil exports also influence crude oil prices negatively, though less persistently. In the final row, the growth in CO2 emissions (d_CO2_Emissions) shows a downward trend in response to coal and oil exports, as well as to its own shock–pointing to possible mitigation or substitution effects in energy use. Interestingly, crude oil price shocks initially increase CO2 emission growth before gradually tapering off. Overall, the results highlight that shocks originating from fossil fuel exports and prices have heterogeneous and time-dependent effects on CO2 emissions and inter-fuel dynamics, underlining the importance of accounting for short- and long-term feedbacks in energy-environment modeling.
A shock to coal export volume () generates a negative and persistent response in CO2 emissions, reaching approximately −0.06 by Period 9. This somewhat counterintuitive result may suggest that increases in coal exports could be associated with more efficient production practices or displacement of other emission-intensive sectors in the short run. Alternatively, it may indicate delayed emission accumulation beyond the model’s horizon or international outsourcing of emissions via exports.
In contrast, a shock to oil export initially leads to a positive effect on CO2 emissions (peaking at +0.22 in Period 1), followed by a rapid decline and eventual negative impact from Period 6 onward. This dynamic indicates a short-term linkage between rising oil exports and higher emissions—possibly through intensified refining or transport activity—followed by adjustment or substitution effects.
Shocks to crude oil prices have only a mild and consistently positive effect on CO2 emissions, though small in magnitude (peaking at ∼0.02). This suggests that price volatility alone is not a strong driver of emissions outcomes, possibly due to the dominance of long-term contracts and domestic policy buffers in Indonesia’s energy sector.
Table 5 provides a numerical summary of the impulse response of CO
2 emissions to one-standard-deviation shocks in coal exports, oil exports (in differenced form), crude oil prices, and its own past values. The clearest finding is the strong autoregressive nature of CO
2 emissions, as evidenced by the immediate response of 1.0 at Period 0 (by design), followed by a gradual decay over subsequent periods. This response declines from 0.80 in Period 1 to −0.17 by Period 9, confirming the strong but slowly dissipating path dependency of emissions in Indonesia. The initial negative response of CO
2 emissions to coal export shocks might reflect the displacement of combustion abroad or technological shifts—an insight that refines simplistic assumptions from standard trade–pollution models.
The response to a coal export shock is consistently negative across the 10-period horizon, starting from −0.014 in Period 1 and stabilizing near −0.06 by Period 9. Although modest in magnitude, the persistent downward trend is somewhat surprising given coal’s carbon-intensive nature. One possible explanation is that increased coal exports may shift some environmental burdens abroad, or reflect technological improvements in mining/export processes. Alternatively, emissions associated with increased coal activity may not appear in the short-run horizon analyzed here.
In contrast, a shock to oil exports (differenced) initially causes a positive response in CO2 emissions, with the peak impact of +0.22 appearing in Period 1. This likely reflects short-term increases in processing, transportation, and combustion activities linked to greater oil export volumes. However, this effect rapidly diminishes, turns negative after Period 5, and settles at −0.07 by Period 9, suggesting that the initial rise in emissions is offset by longer-term adjustments or economic rebalancing.
The response of emissions to crude oil price shocks is uniformly positive but very small, peaking at only +0.02 and gradually declining. This mild response indicates that global price dynamics have limited short-run influence on Indonesia’s domestic emission levels, possibly due to price-insulating mechanisms such as subsidies, long-term contracts, or limited flexibility in short-term energy use behavior.
Taken together, the impulse response patterns suggest that CO2 emissions in Indonesia are primarily driven by their own historical trajectory, with moderate short-run influence from oil export shocks, and minimal impact from coal exports or price volatility in the short term. This highlights the need for policy attention on domestic emission structures rather than relying solely on energy trade levers to manage environmental outcomes.
3.5. Forecast Error Variance Decomposition (FEVD)
FEVD provides insight into how shocks to trade volumes and prices contribute to CO2 emission volatility over time, consistent with systemic approaches in ecological macroeconomics. To complement the impulse response analysis, this section presents the Forecast Error Variance Decomposition (FEVD) for CO2 emissions. FEVD quantifies the relative importance of shocks in each variable in explaining the forecast error variance of a target variable over time. This provides a clearer picture of which variables matter most for predicting future changes in CO2 emissions in Indonesia.
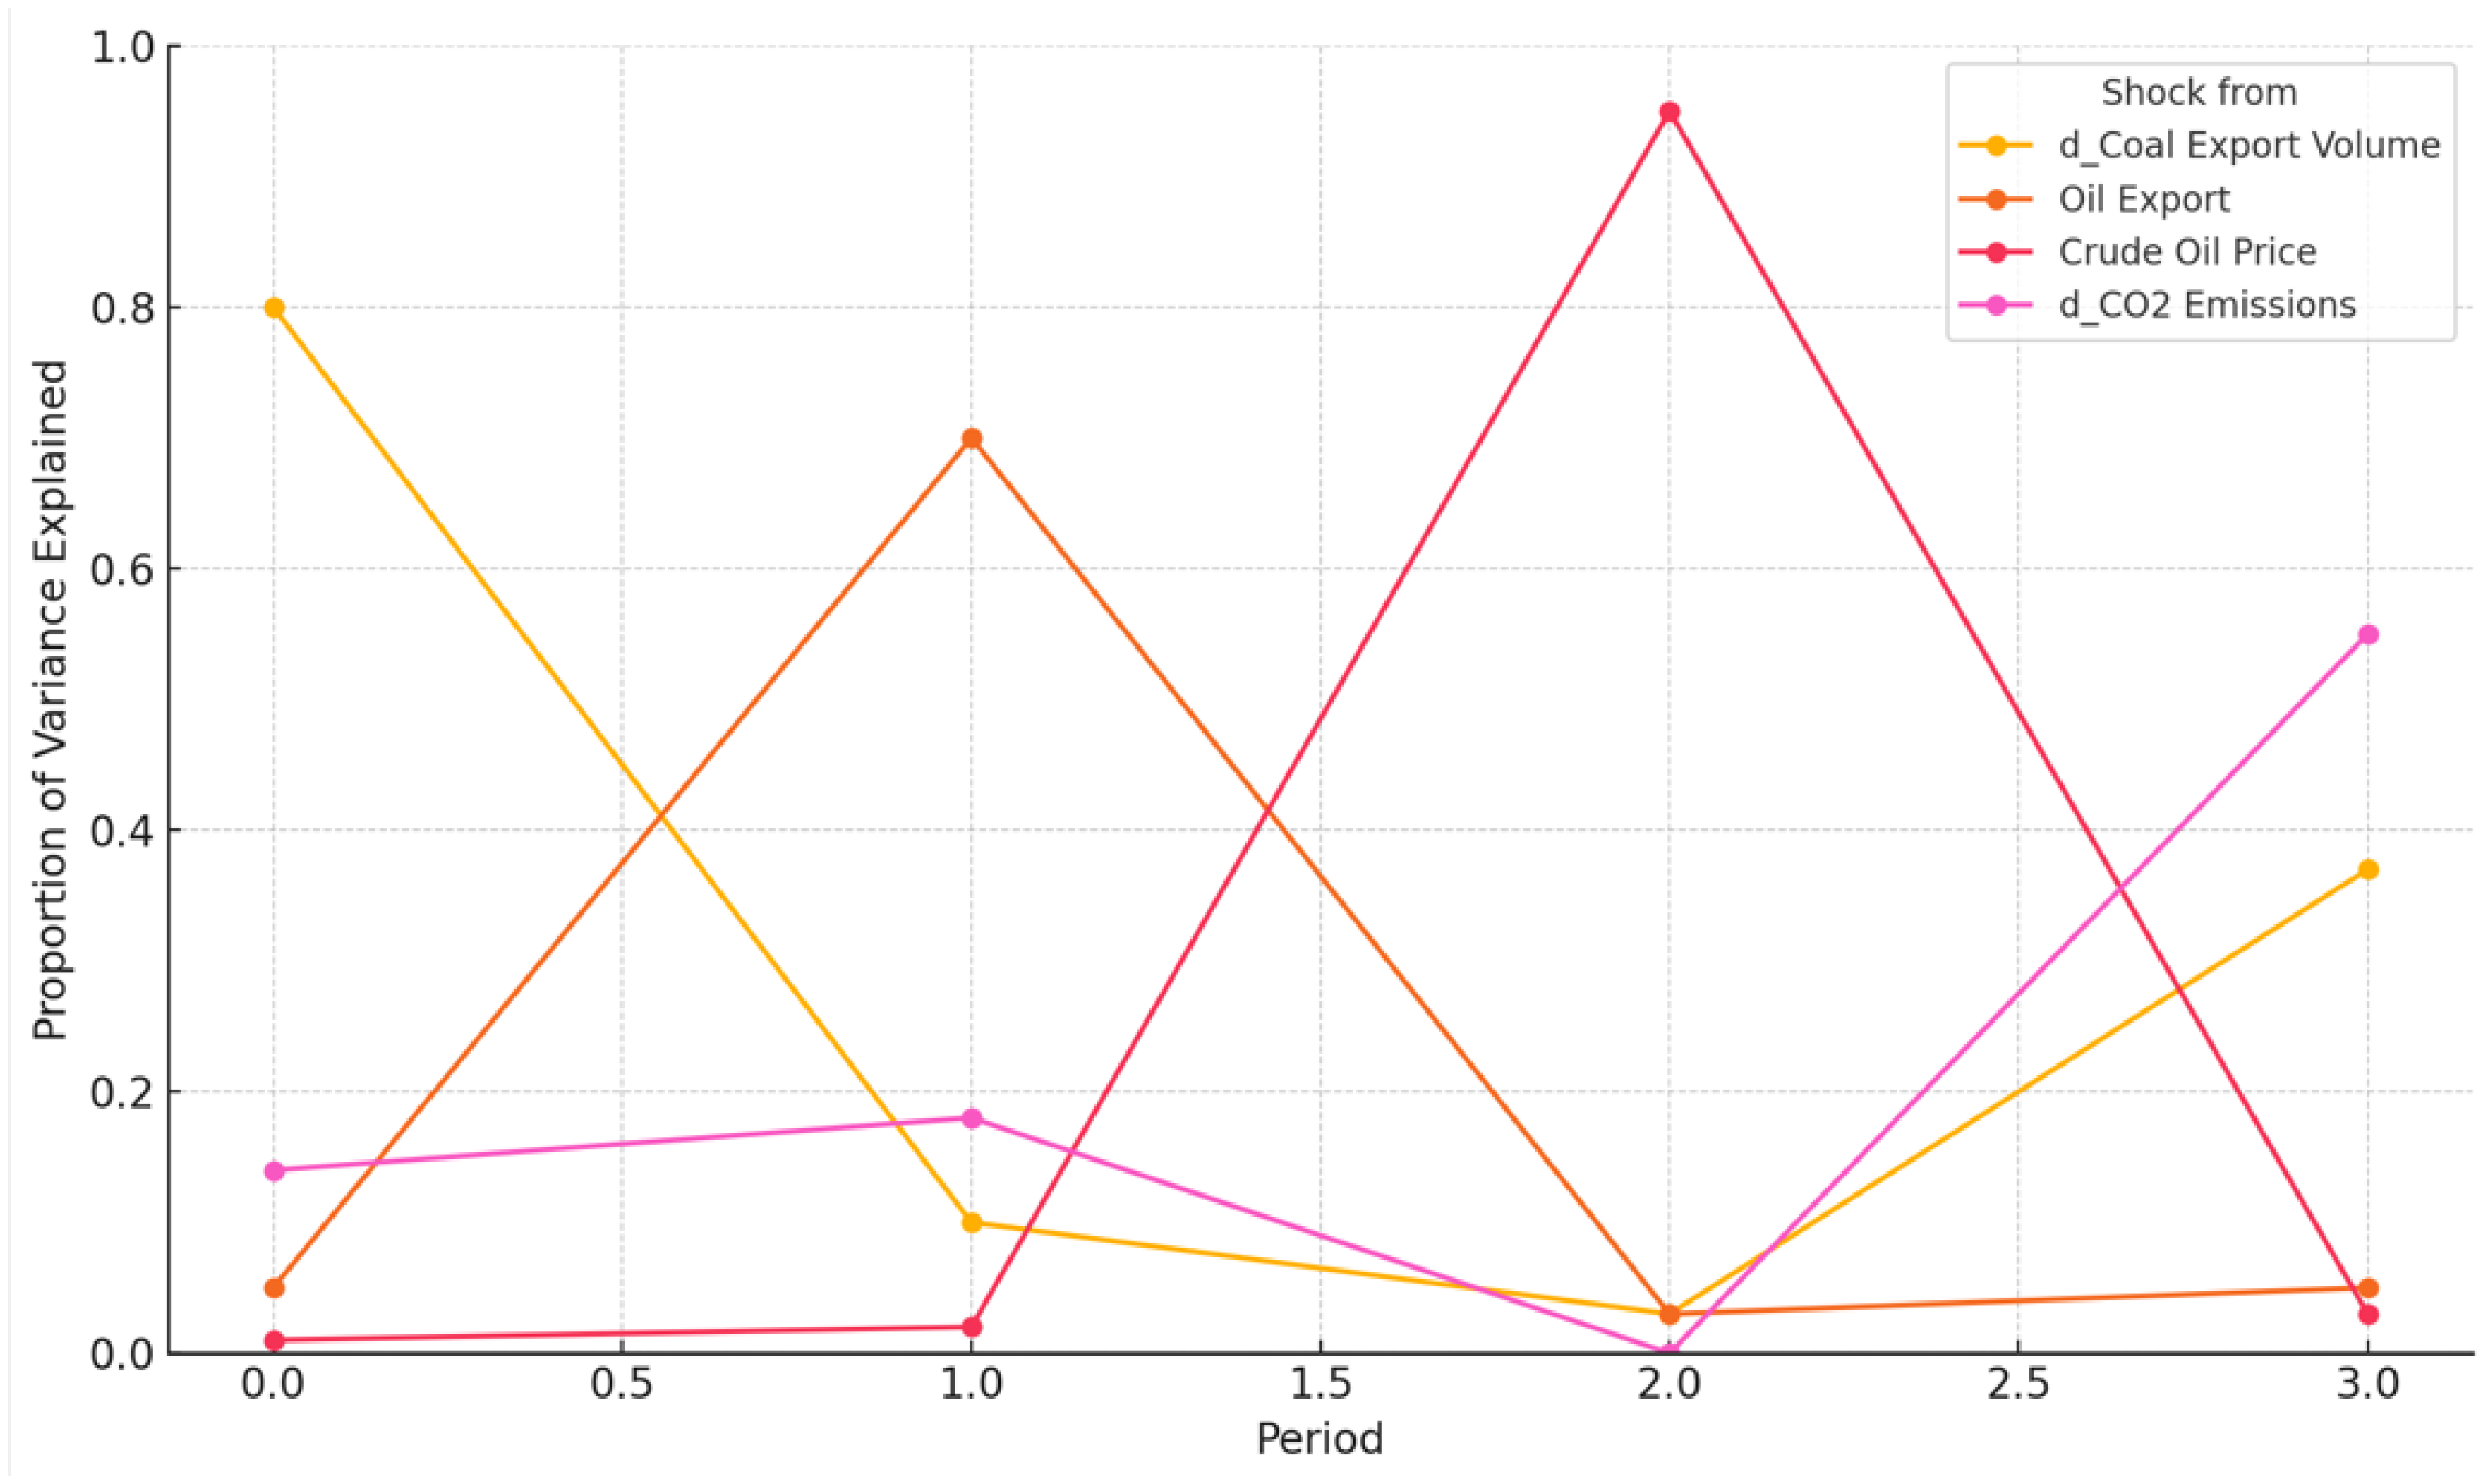
Figure 6 illustrates how the proportion of forecast error variance in CO
2 emissions is distributed among structural shocks to coal exports, oil exports, crude oil prices, and emissions themselves across a 10-period horizon.
Figure 6 presents the Forecast Error Variance Decomposition (FEVD) of CO
2 emissions across a four-period horizon, illustrating how the proportion of forecast error variance is attributed to structural shocks originating from coal export volume, oil exports (in differenced form), crude oil prices, and emissions themselves. The figure visually compares the relative contributions of these shocks over time, revealing important insights into the dynamic structure of emission predictability in Indonesia. The distribution pattern highlights how external trade-related shocks lose influence over time while the self-reinforcing nature of emissions becomes more prominent.
At Period 0, emissions volatility is primarily attributed to their own past values. As early as Period 1, over 89% of variation in emissions is explained by internal momentum. However, the influence of oil exports grows steadily, becoming a significant contributor by mid-horizon. Coal exports exert a delayed yet steadily increasing influence, while crude oil price shocks remain marginal throughout.
By Period 1, the influence of oil exports increases significantly, becoming the dominant external contributor with a variance share of approximately 70%, while the contribution of coal exports decreases sharply. This shift suggests that oil export shocks have a delayed but more concentrated impact on emissions, likely due to associated energy processing and transportation activities. Meanwhile, crude oil price shocks remain marginal throughout all periods, reinforcing their limited role in explaining short-term variation in domestic emissions.
Interestingly, the shock from CO2 emissions itself (differenced) grows gradually across the observed periods, signaling increasing internal inertia or autoregressive behavior in emissions. This pattern indicates that past emission dynamics increasingly shape their future behavior, particularly from Period 2 onwards, where their share rises while external influences diminish.
The large fluctuations visible in
Figure 6—particularly the sharp reversals in contribution shares between periods 0 to 3—are the result of interacting dynamic shocks within a short forecast horizon and reflect the mathematical redistribution of variance rather than erratic data behavior. These fluctuations are not only consistent with the realities of short-run emission drivers in Indonesia, but also capture how dominance among contributing factors shifts rapidly depending on market response lag, regulatory inertia, or the timing of trade volumes. In the early periods, emissions are more susceptible to abrupt changes in export behavior, while over time, internal momentum from the emissions process itself takes precedence. Hence, the volatility depicted in the early-period variance decomposition is both statistically plausible and reflective of the transitional dynamics observed in fossil-fuel-reliant economies.
Table 6 reports the FEVD values for CO
2 emissions over a 10-period forecast horizon. The results show the proportion of forecast error variance in CO
2 emissions that is attributable to shocks in coal exports, oil exports (first difference), crude oil price, and the variable’s own past innovations.
The FEVD results reinforce the findings from the IRF analysis and provide a clearer perspective on the relative importance of shocks. In the immediate term (Period 1), CO2 emissions are almost entirely self-driven, with nearly 90% of the forecast error variance explained by their own lagged innovations. However, this dominance gradually declines to just above 52% by Period 9, indicating that external shocks gain influence over time.
Among the external variables, shocks to oil exports emerge as the most influential driver of CO2 emissions’ forecast variance. By Period 9, over 36% of the forecast variance is attributable to oil export shocks, suggesting a relatively strong and sustained link between oil-related trade activity and emissions volatility.
Coal export shocks account for a smaller but steadily increasing share, rising from 1% to 9%, indicating their delayed but growing role in shaping emission dynamics—likely due to cumulative extraction effects or interaction with domestic coal consumption. In contrast, crude oil price shocks contribute minimally, rising from nearzero to just over 2%, reaffirming their limited short-term influence on Indonesia’s domestic environmental outcomes.
Overall, the decomposition underscores the dominant role of internal emission dynamics, yet it reveals the growing contribution of oil export activity in influencing CO2 emissions over time. This points to the strategic importance of monitoring oil sector policies, not only from a trade or revenue perspective, but also from the lens of environmental sustainability.
These empirical findings align with and also expand upon the existing literature in meaningful ways. Prior studies such as [
5] and [
15] highlight the strong connection between fossil fuel trade and emissions, particularly in energy-exporting nations. Similar to those studies, our results confirm that export-related activities—especially in the oil sector—play a significant role in shaping domestic environmental outcomes. However, in contrast to multi-country analyses like [
22], which emphasize energy consumption as the primary driver of CO
2 emissions, our Indonesia-focused model reveals that upstream trade behaviors (e.g., coal and oil exports) also exhibit significant short- and long-term influence on emission dynamics.
A noteworthy point of divergence is the counterintuitive negative effect of coal exports on short-term emissions identified through the impulse response functions. While this may seem inconsistent with the high carbon intensity of coal, it potentially reflects Indonesia’s structural reliance on export channels that displace combustion activities abroad, along with possible efficiency improvements in extraction and logistics. This nuance is rarely captured in cross-national studies, thereby reinforcing the value of country-specific time-series approaches like VAR. Thus, the VAR-based findings offer a theoretically grounded understanding of energy-emission linkages in Indonesia, validating the need for integrated policy approaches that account for both external trade shocks and internal emission momentum.
In methodological terms, the marginal role of oil price shocks differs from studies of Marín-Rodríguez et al. [
17], who used wavelet analysis to show dynamic interactions between energy prices and carbon markets. While their work focuses on financial linkages, our analysis provides evidence of temporal feedback within trade–environment systems. Together, these findings contribute to a broader understanding of how global energy markets interact with national environmental performance, particularly in emerging economies.
By incorporating country-specific time-series dynamics through VAR, this study reveals differentiated policy levers for Indonesia. Export governance—especially in the oil sector—should be linked to climate strategies, and internal emission momentum must be addressed with long-term decarbonization frameworks. The results offer both empirical clarity and theoretical refinement in understanding the trade–environment nexus in fossil fuel economies.
4. Conclusions
Indonesia’s pivotal role in the global fossil fuel market—particularly through its exports of coal and crude oil—has underpinned macroeconomic resilience via contributions to GDP, state revenues, and external balances. Yet, this export-driven strategy increasingly collides with mounting environmental responsibilities, particularly in light of Sustainable Development Goals (SDGs) 7 (Affordable and Clean Energy), 8 (Decent Work and Economic Growth), and 13 (Climate Action). Within this context, the present study employed a Vector Autoregressive (VAR) model to examine the dynamic interplay among energy exports, global oil prices, and domestic CO2 emissions over the period 2002–2022.
The empirical results demonstrate that Indonesia’s fossil fuel exports are deeply entangled with domestic emission trajectories. Coal exports show strong autoregressive tendencies and are positively influenced by past CO2 levels, suggesting a structural lock-in effect where historical emissions reinforce current extractive behavior. This persistence challenges the expectations of the Environmental Kuznets Curve (EKC) hypothesis, which posits that emissions eventually decline with economic development. Instead, the results imply that in fossil fuel-exporting countries, the turning point of the EKC may be delayed or altogether absent due to the embedded carbon footprint of trade. Meanwhile, oil exports appear to be negatively influenced by lagged emissions and coal exports, possibly indicating internal portfolio adjustments or cross-sectoral substitution effects.
Global oil prices, while central to external trade dynamics, exhibit limited explanatory power for domestic emissions—highlighting Indonesia’s status as a price taker in the international market. However, through Impulse Response Functions (IRFs) and Forecast Error Variance Decomposition (FEVD), the analysis uncovers that oil exports gradually gain significance in shaping future CO2 variability. This delayed influence signals that upstream activities—including mining, refining, and transport—generate tangible emissions, countering the notion that exporting countries bear minimal environmental responsibility simply because combustion occurs abroad.
By placing energy trade at the center of its analysis, this study offers a fresh perspective on the emissions landscape—one that complements and extends the existing literature that typically focuses on domestic consumption. Moreover, by employing a dynamic VAR framework, this study captures feedback effects and temporal dependencies that are often overlooked in static models.
From a policy standpoint, these findings underscore the urgency of harmonizing trade and climate agendas. Indonesia’s commitments under its nationally determined contributions (NDCs) cannot be fully met without recognizing the upstream emissions embedded in its fossil fuel exports. Effective climate policy should thus account not only for domestic energy use but also for the broader environmental footprint of its export-oriented development model. Designing integrated strategies that reflect both economic and environmental imperatives is essential for ensuring a just and sustainable energy transition.
It is important to acknowledge, however, that emissions are shaped by a broader constellation of factors—ranging from industrial structure and energy intensity to demographic shifts and urbanization. While the present model emphasizes the trade–environment nexus for parsimony, future research could benefit from incorporating these structural drivers. Doing so would allow for the examination of conditional dynamics—such as how trade shocks interact with levels of income or institutional quality—which may alter the direction or magnitude of emission responses.
Furthermore, while the linear VAR model provides a useful first approximation, it may not fully capture the nonlinear nature of environmental systems. Potential threshold effects, asymmetric policy responses, or regime shifts—as suggested by Resource Curse Theory—could give rise to different emission trajectories under varying economic conditions. Future studies may consider nonlinear extensions, such as Threshold VAR or Markov-Switching models, to detect these complex interactions and better inform targeted policy interventions.


