
Land Use Evolution and Multi-Scenario Simulation of Shrinking Border Counties Based on the PLUS Model: A Case Study of Changbai County

Abstract
1. Introduction
2. Literature Review
2.1. Measurement and Identification of Shrinking Cities
2.2. Causes and Mechanisms of Urban Shrinkage
2.3. Strategies and Practices for Urban Shrinkage
2.4. Existing Limitations and Purposes
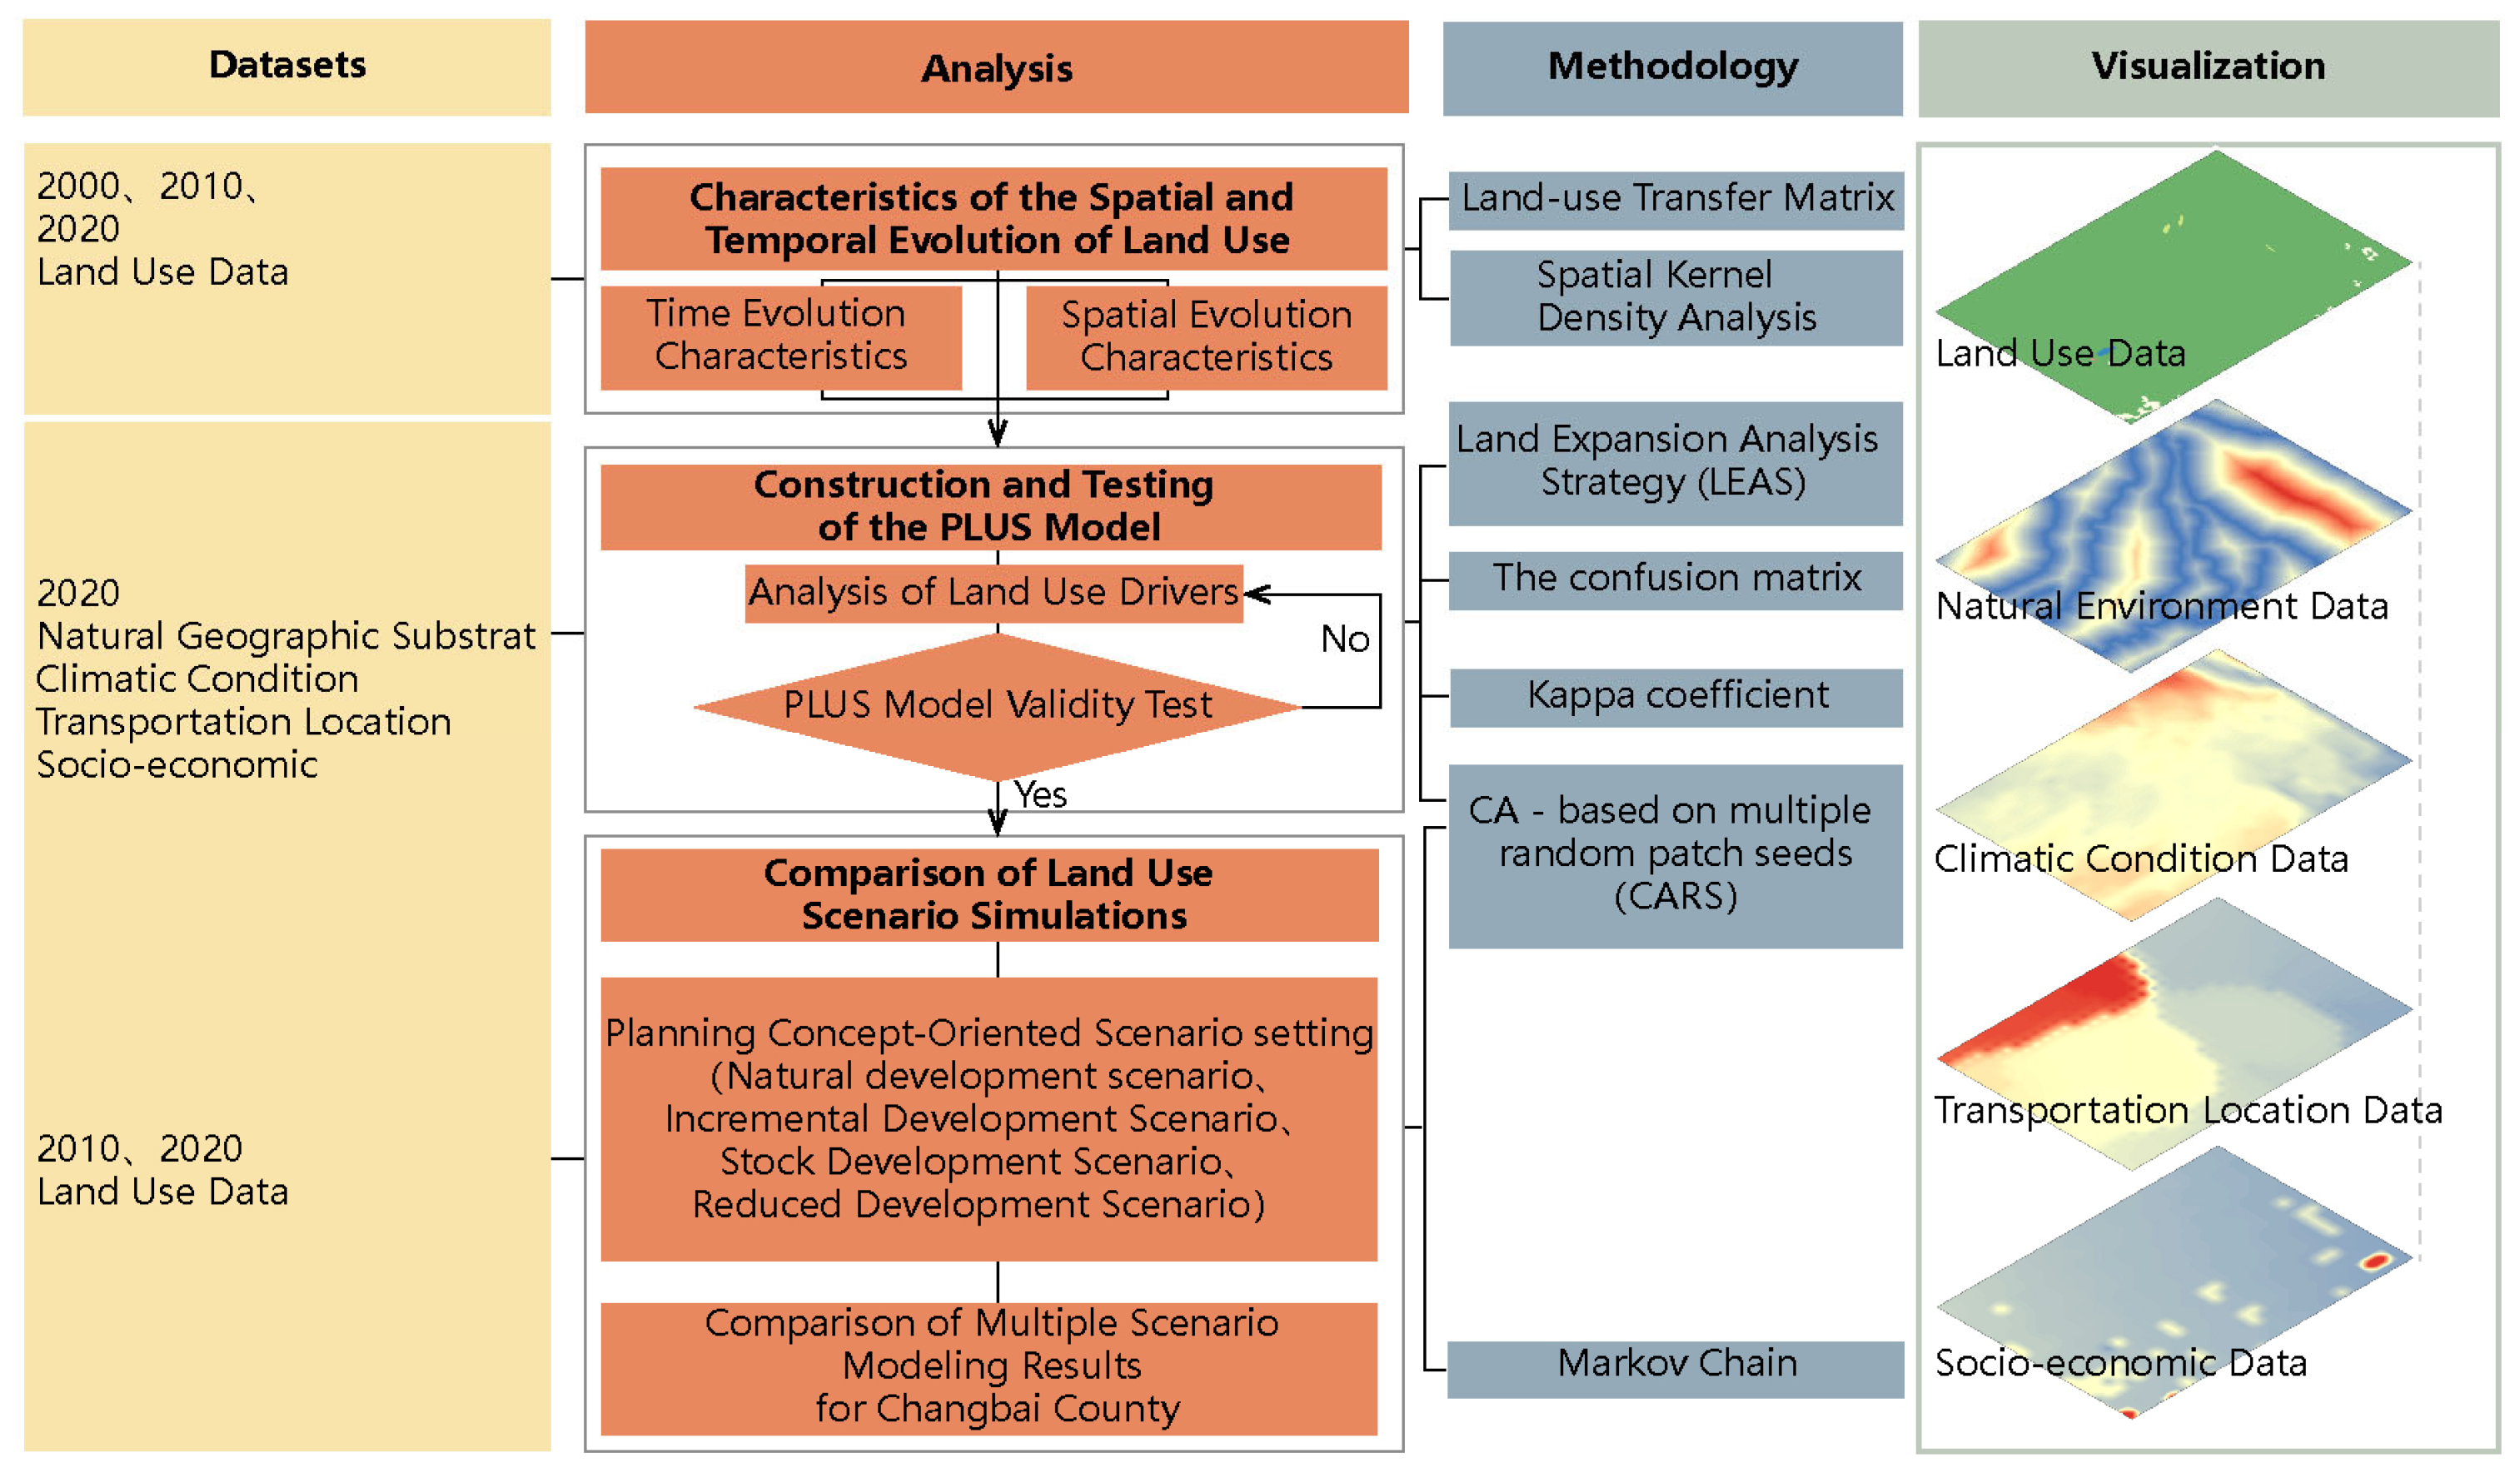
3. Materials and Methods
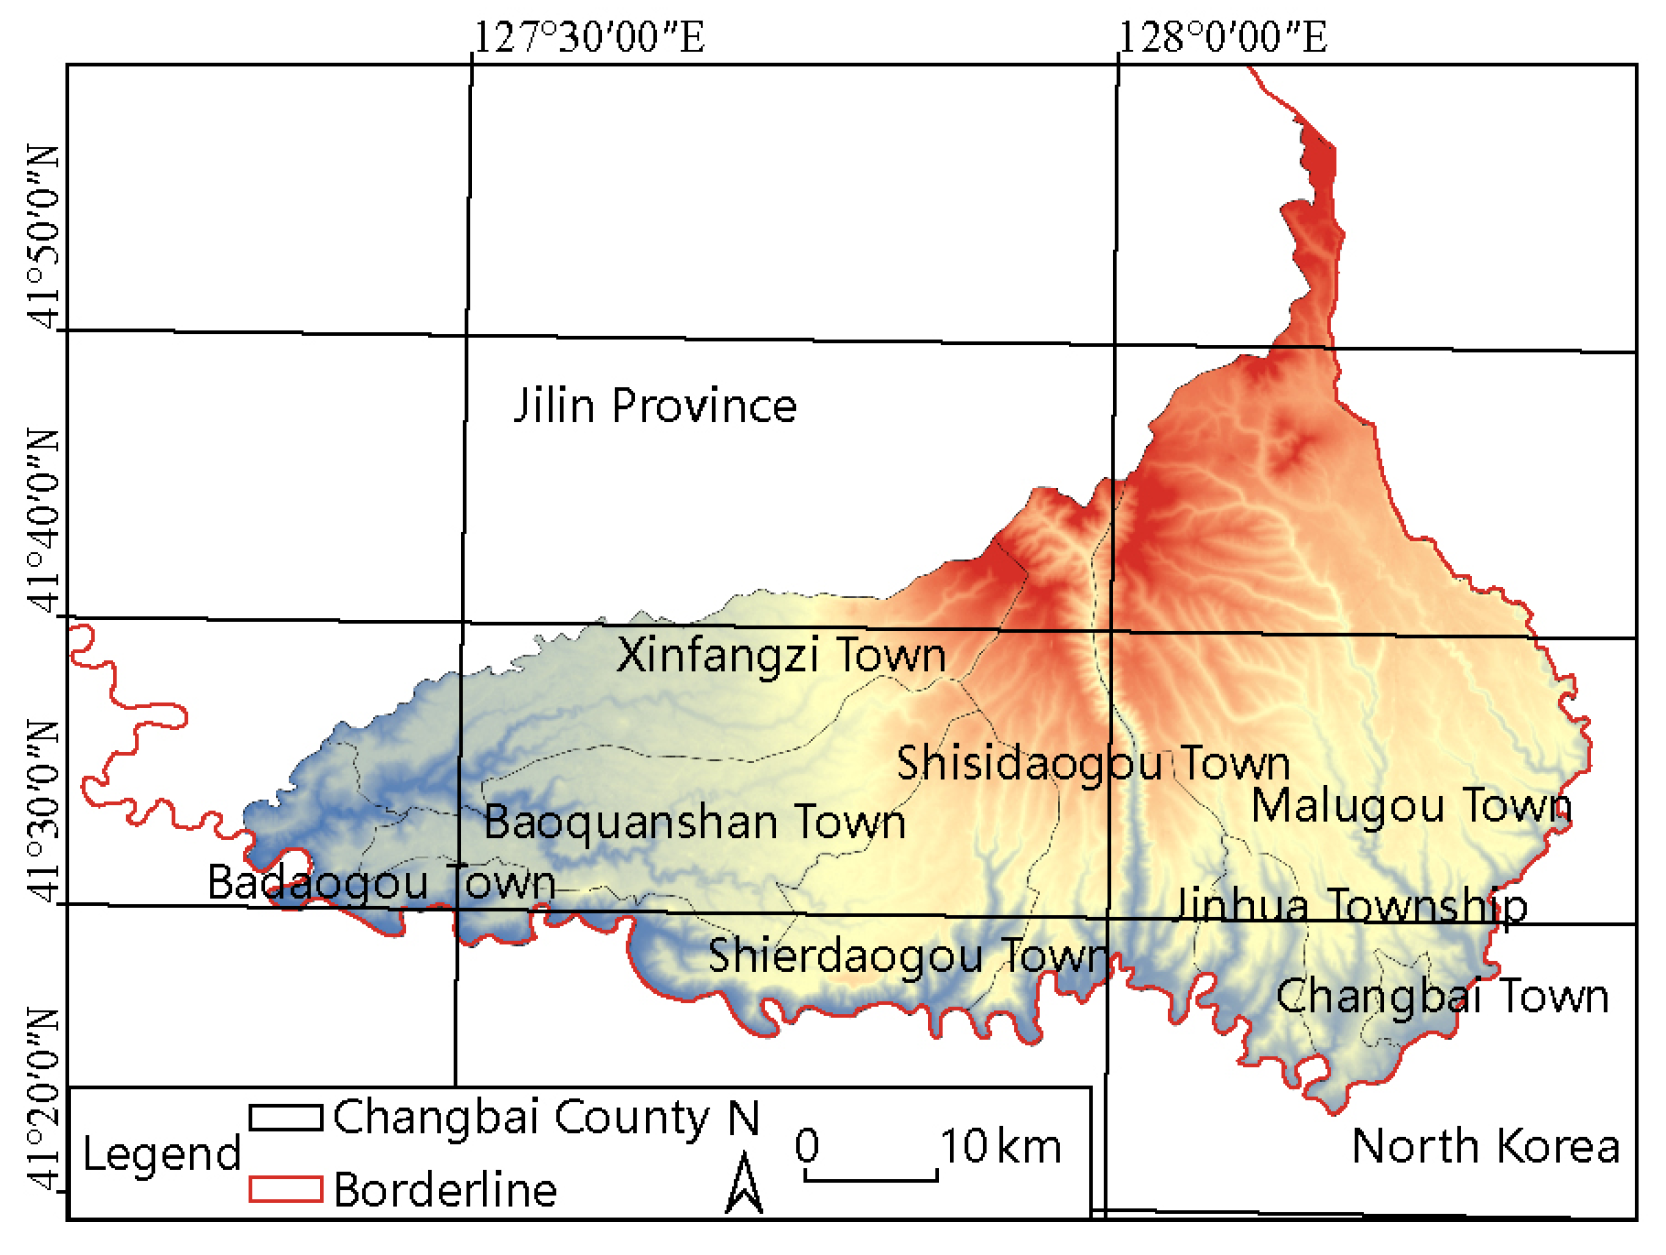
3.1. Research Area
3.2. Data Sources and Pre-Processing
3.2.1. Land Use Data
3.2.2. Natural Geographic Substrate Dataset
3.2.3. Climatic Condition Dataset
3.2.4. Transportation Location Dataset
3.2.5. Socio-Economic Dataset
3.3. Methods
3.3.1. Land Use Transfer Matrix
3.3.2. Spatial Kernel Density Analysis
3.3.3. The PLUS Model
- Land Expansion Analysis Strategy (LEAS)
- 2.
- CA based on multiple random patch seeds (CARS)
- 3.
- Model Validity Test
- The confusion matrix
- ①
- Overall Accuracy (OA) is calculated by the following formula:
- ②
- User’s accuracy and producer’s accuracy are calculated as follows:
- Kappa coefficient
3.3.4. Multi-Scenario Design
4. Results
4.1. Characteristics of the Spatial and Temporal Evolution of Land Use
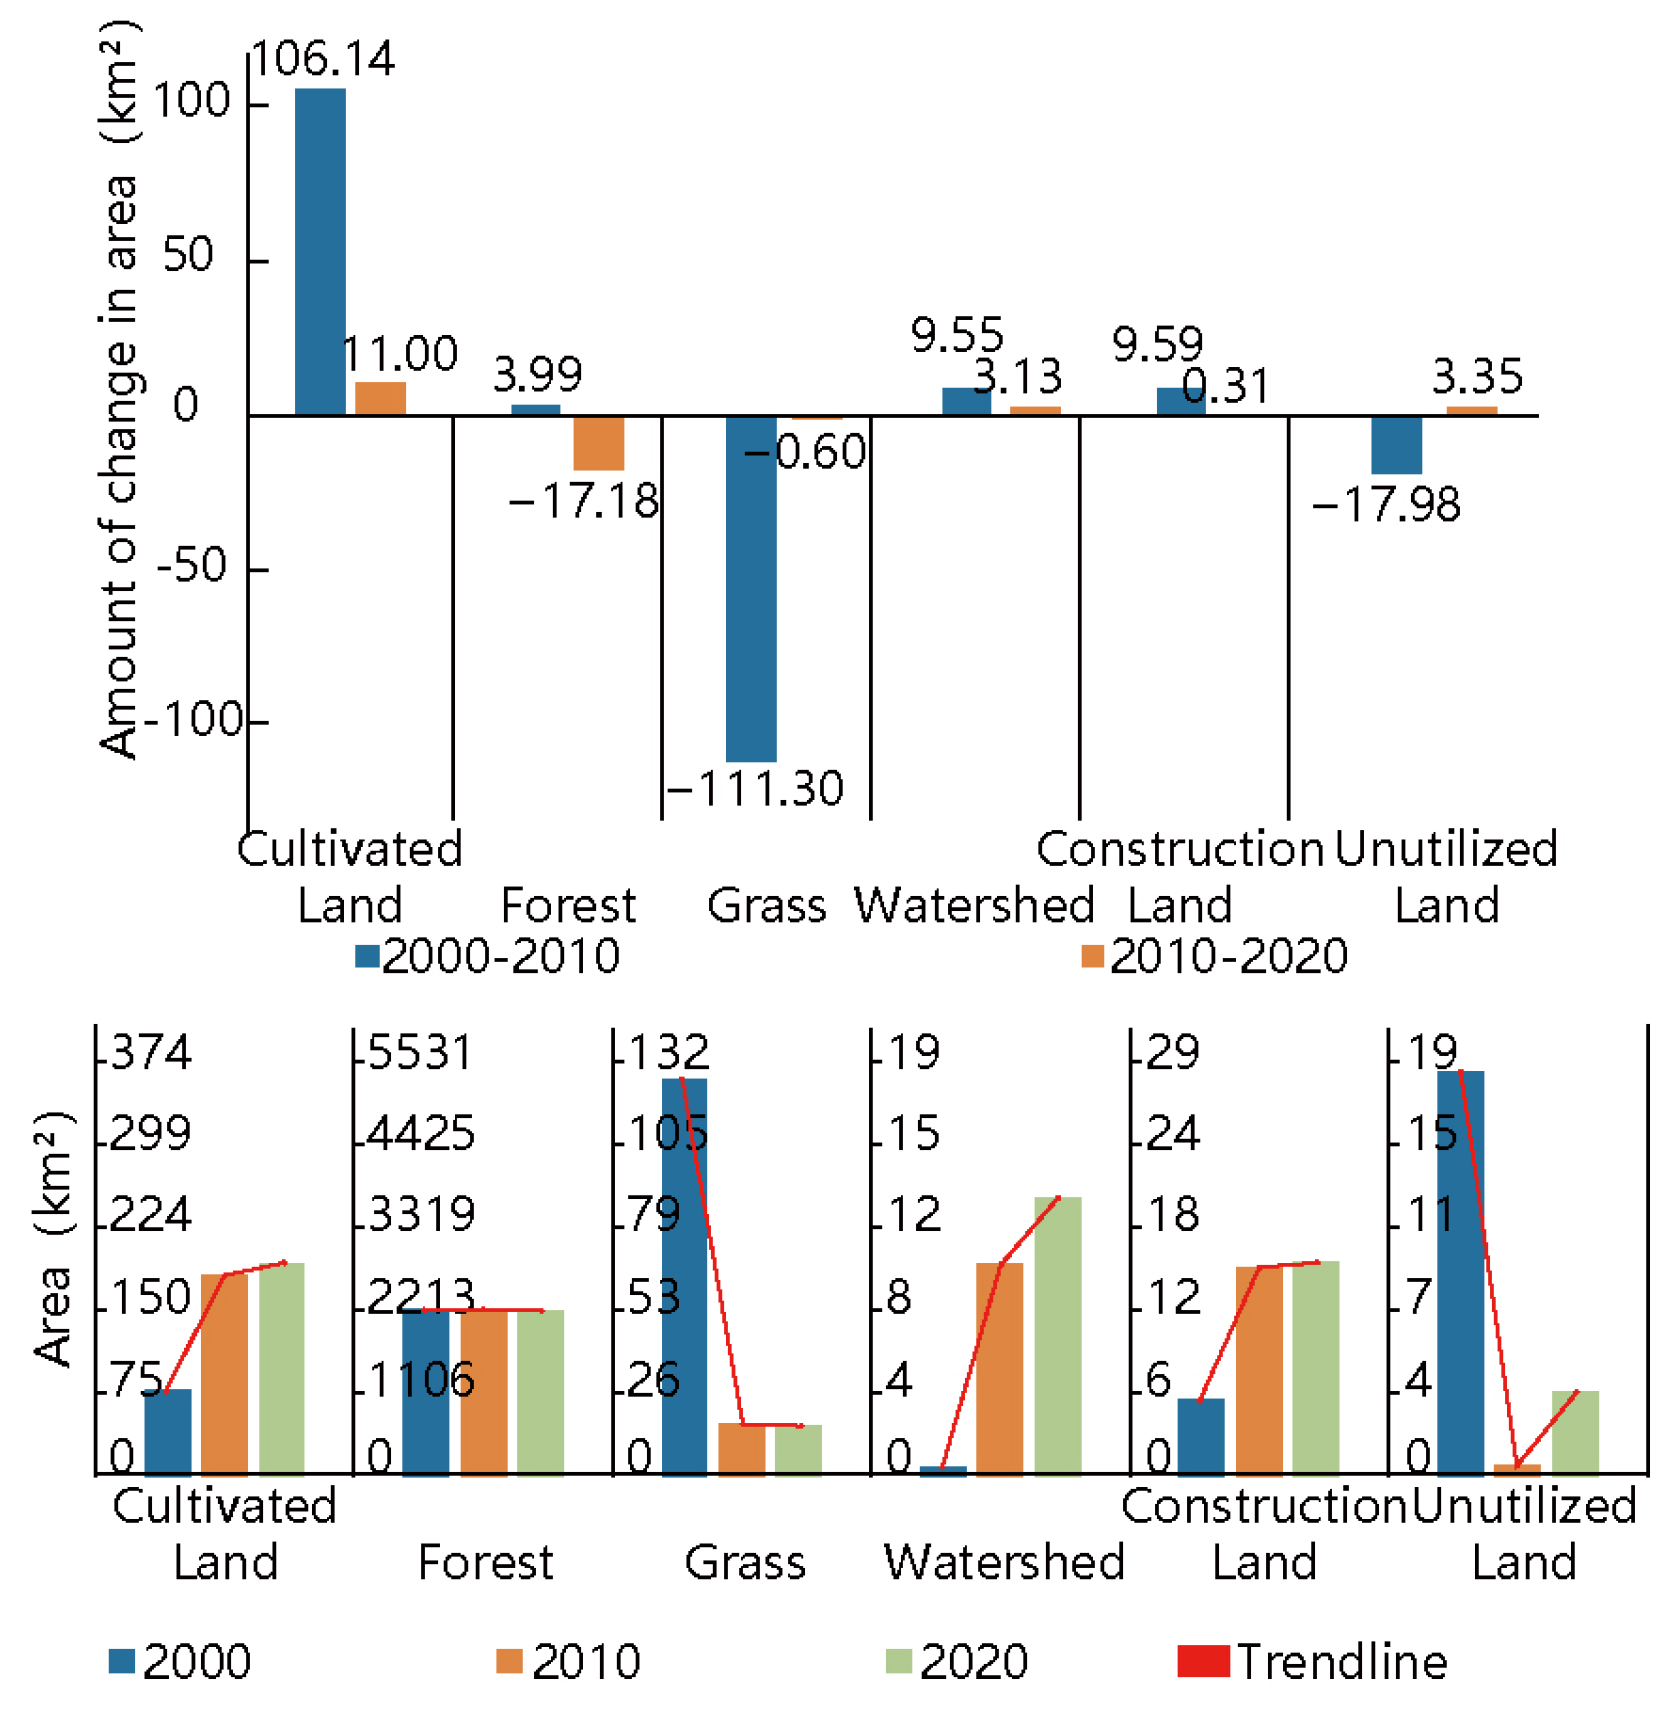
4.1.1. Time Evolution Characteristics
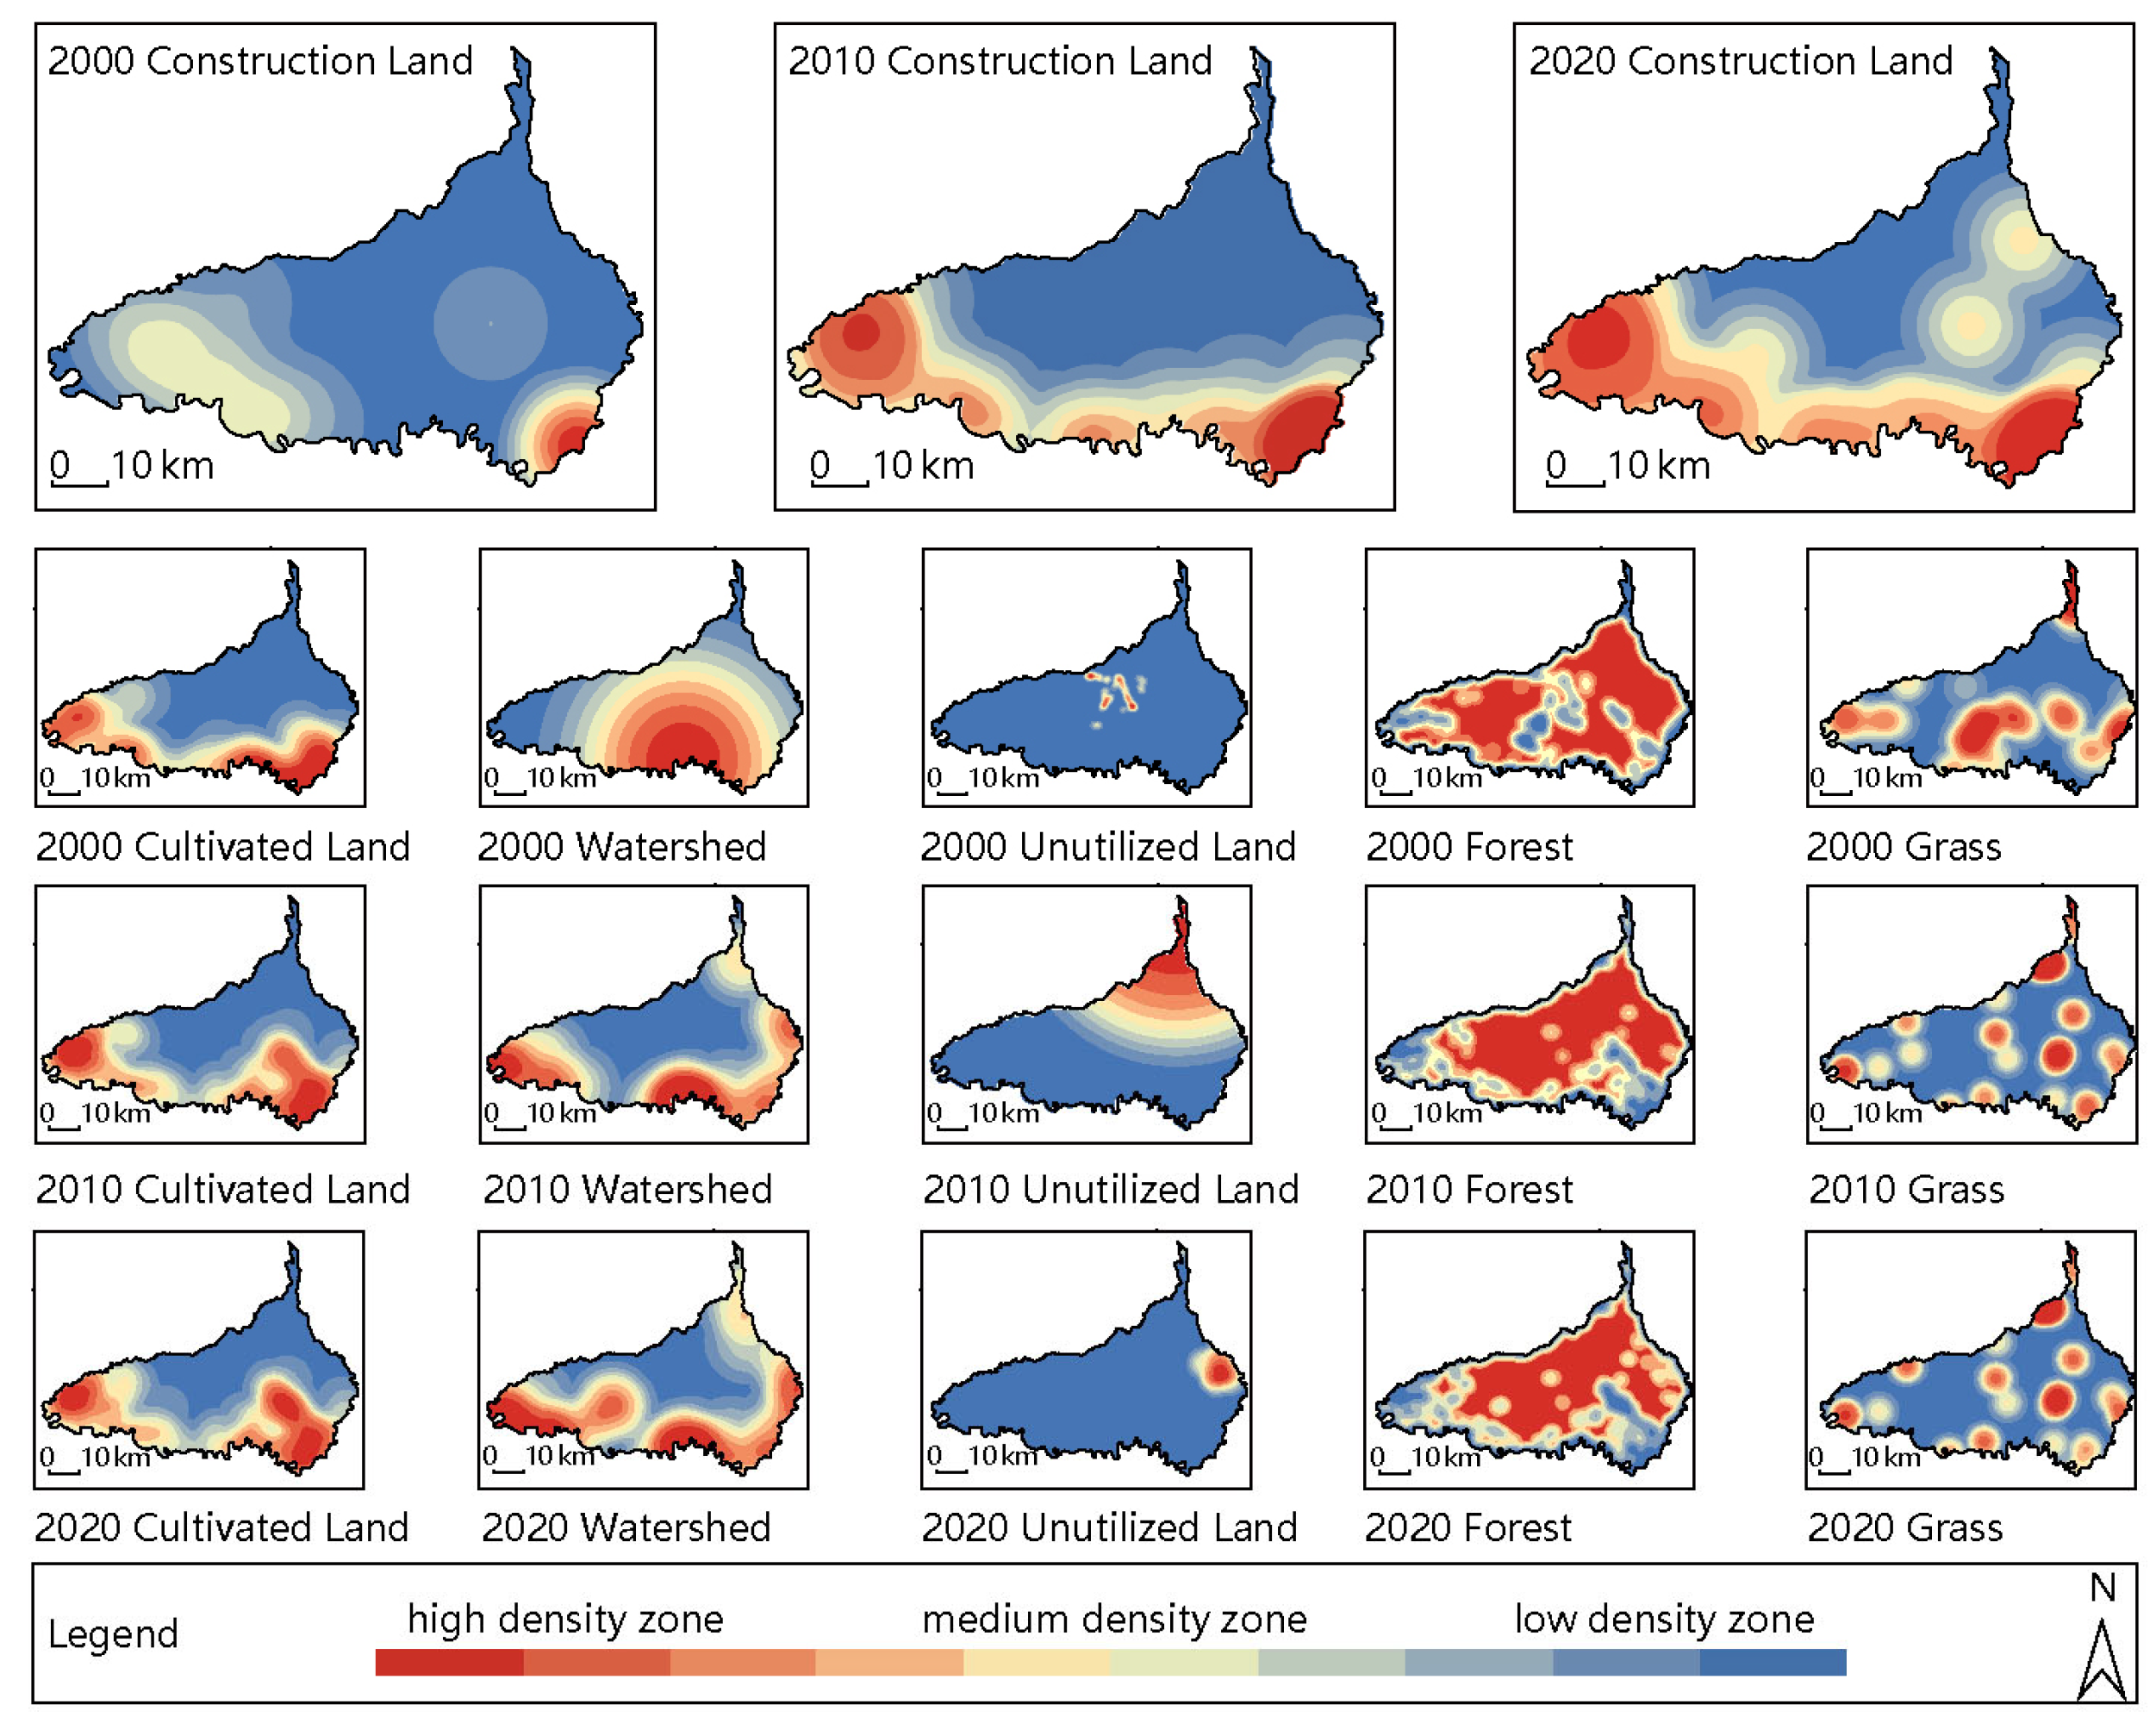
4.1.2. Spatial Evolution Characteristics
4.2. Construction and Testing of the PLUS Model
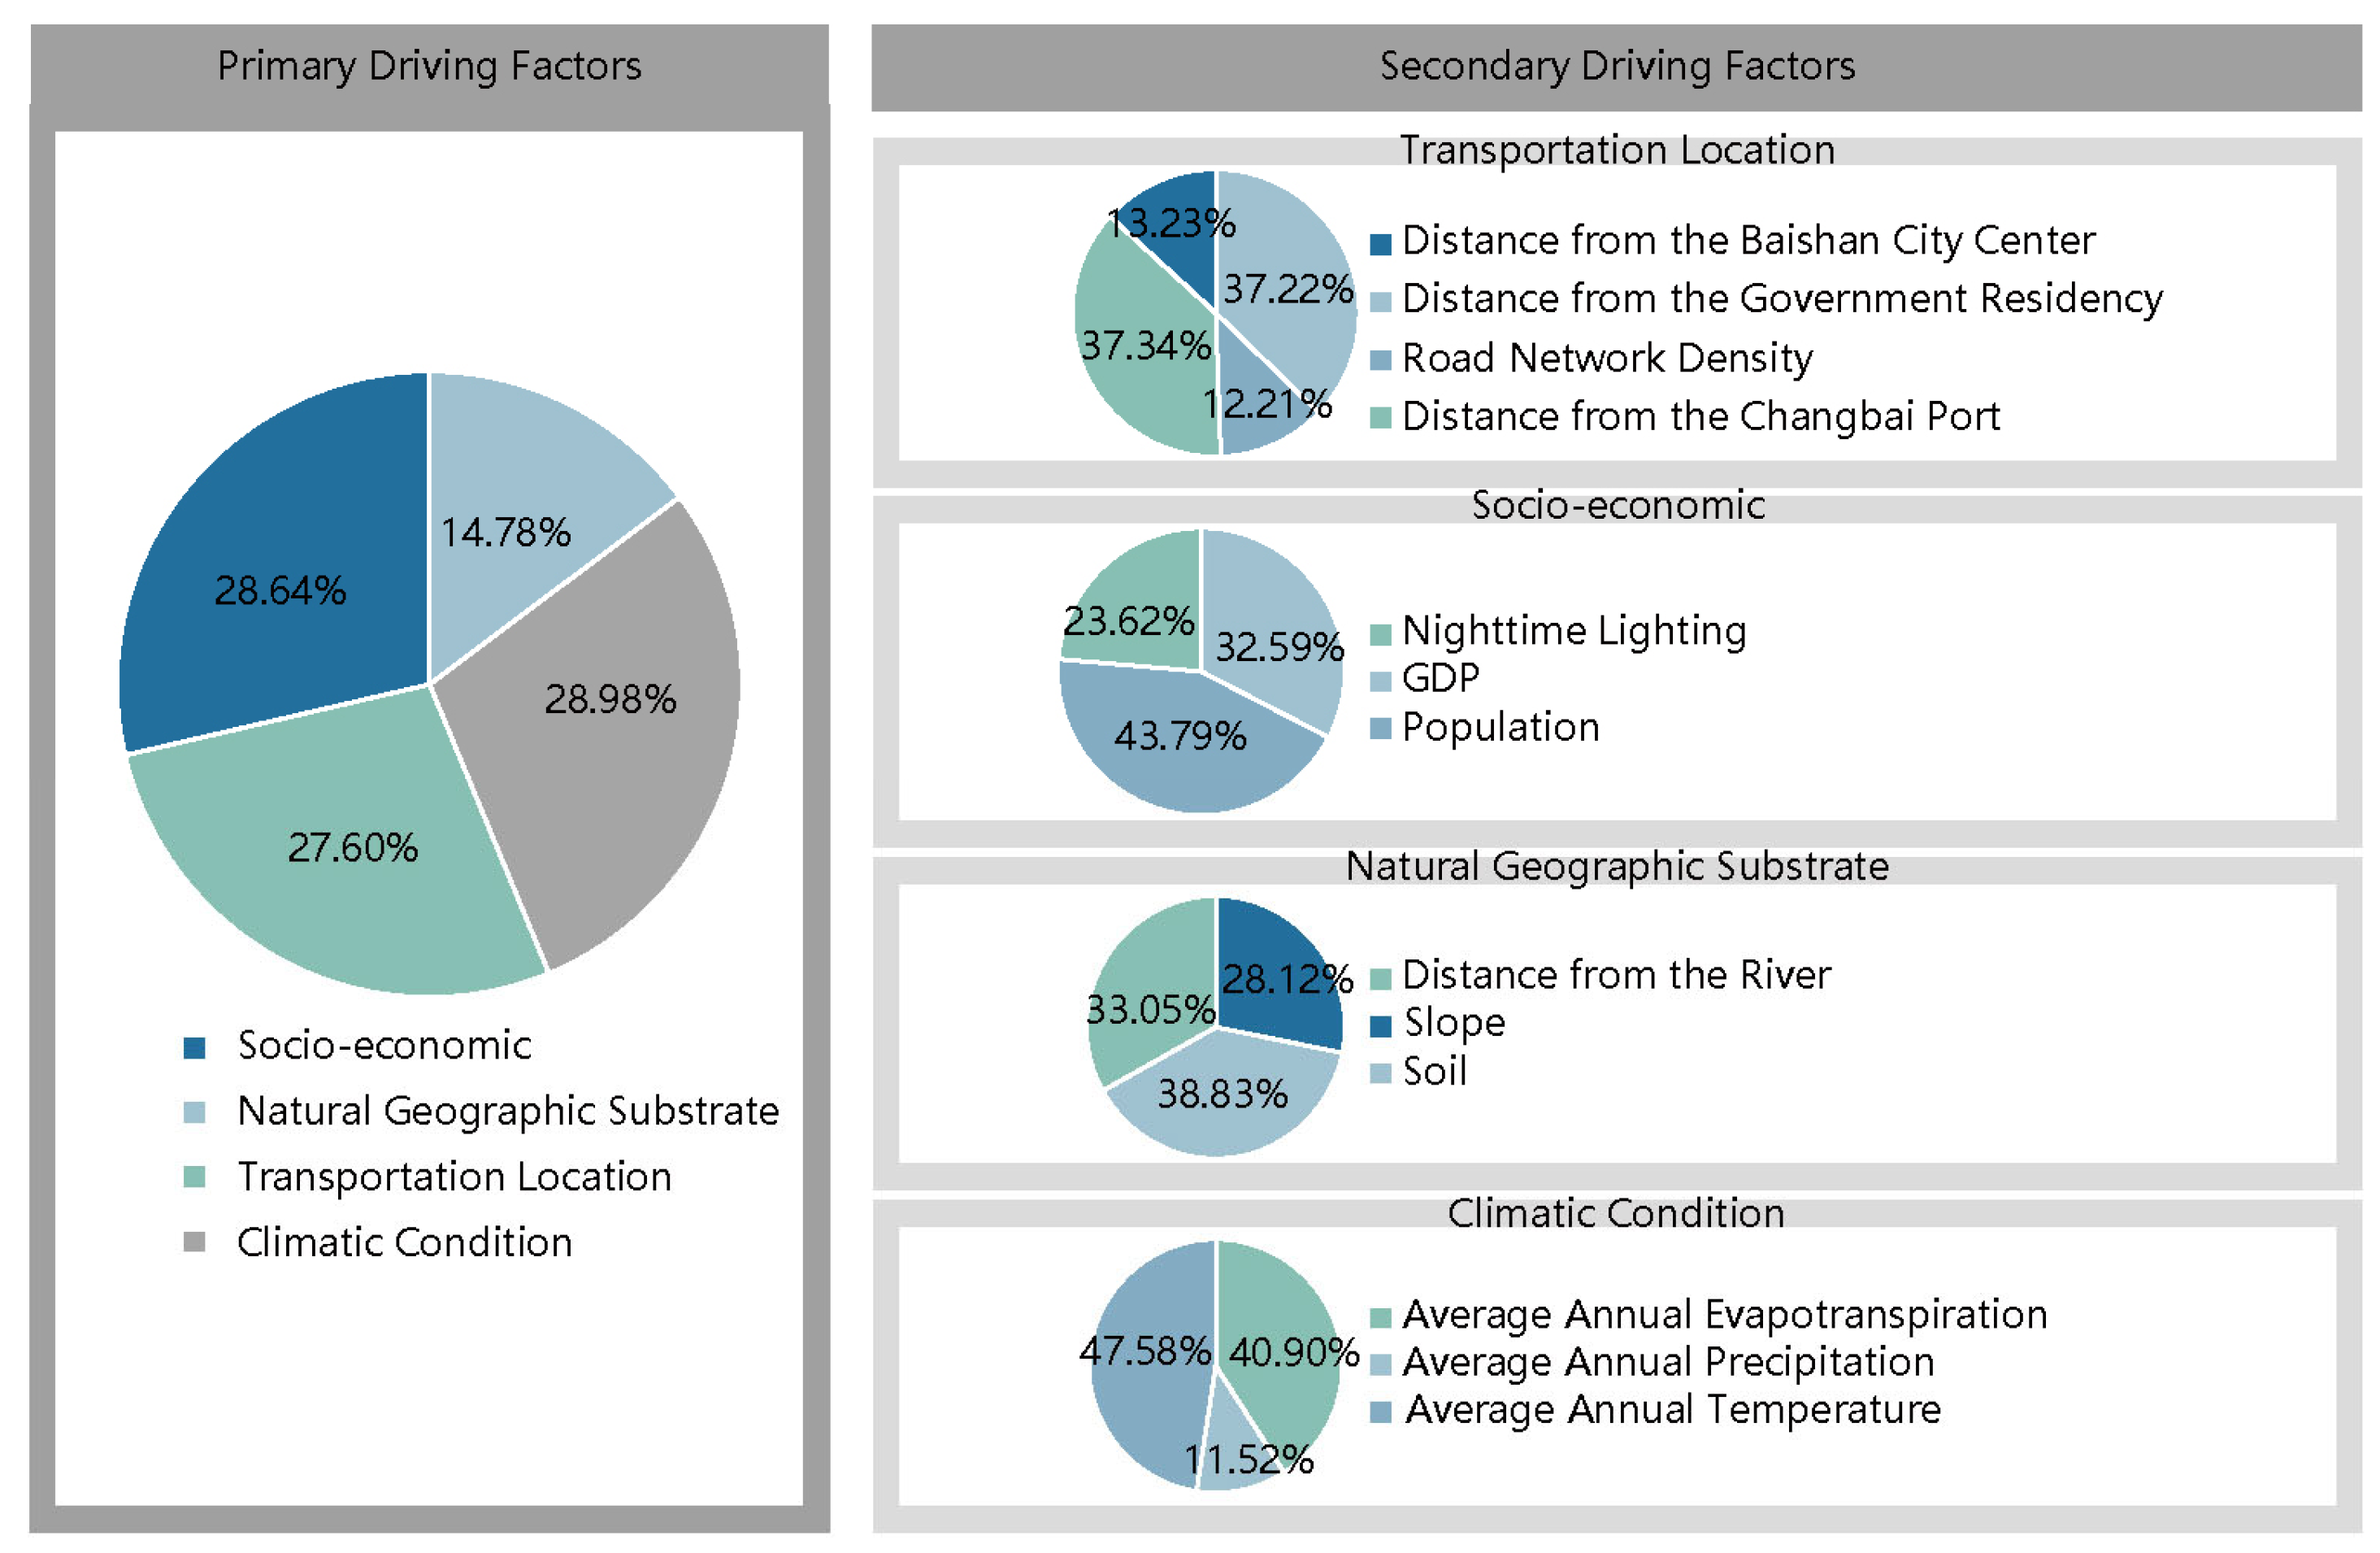
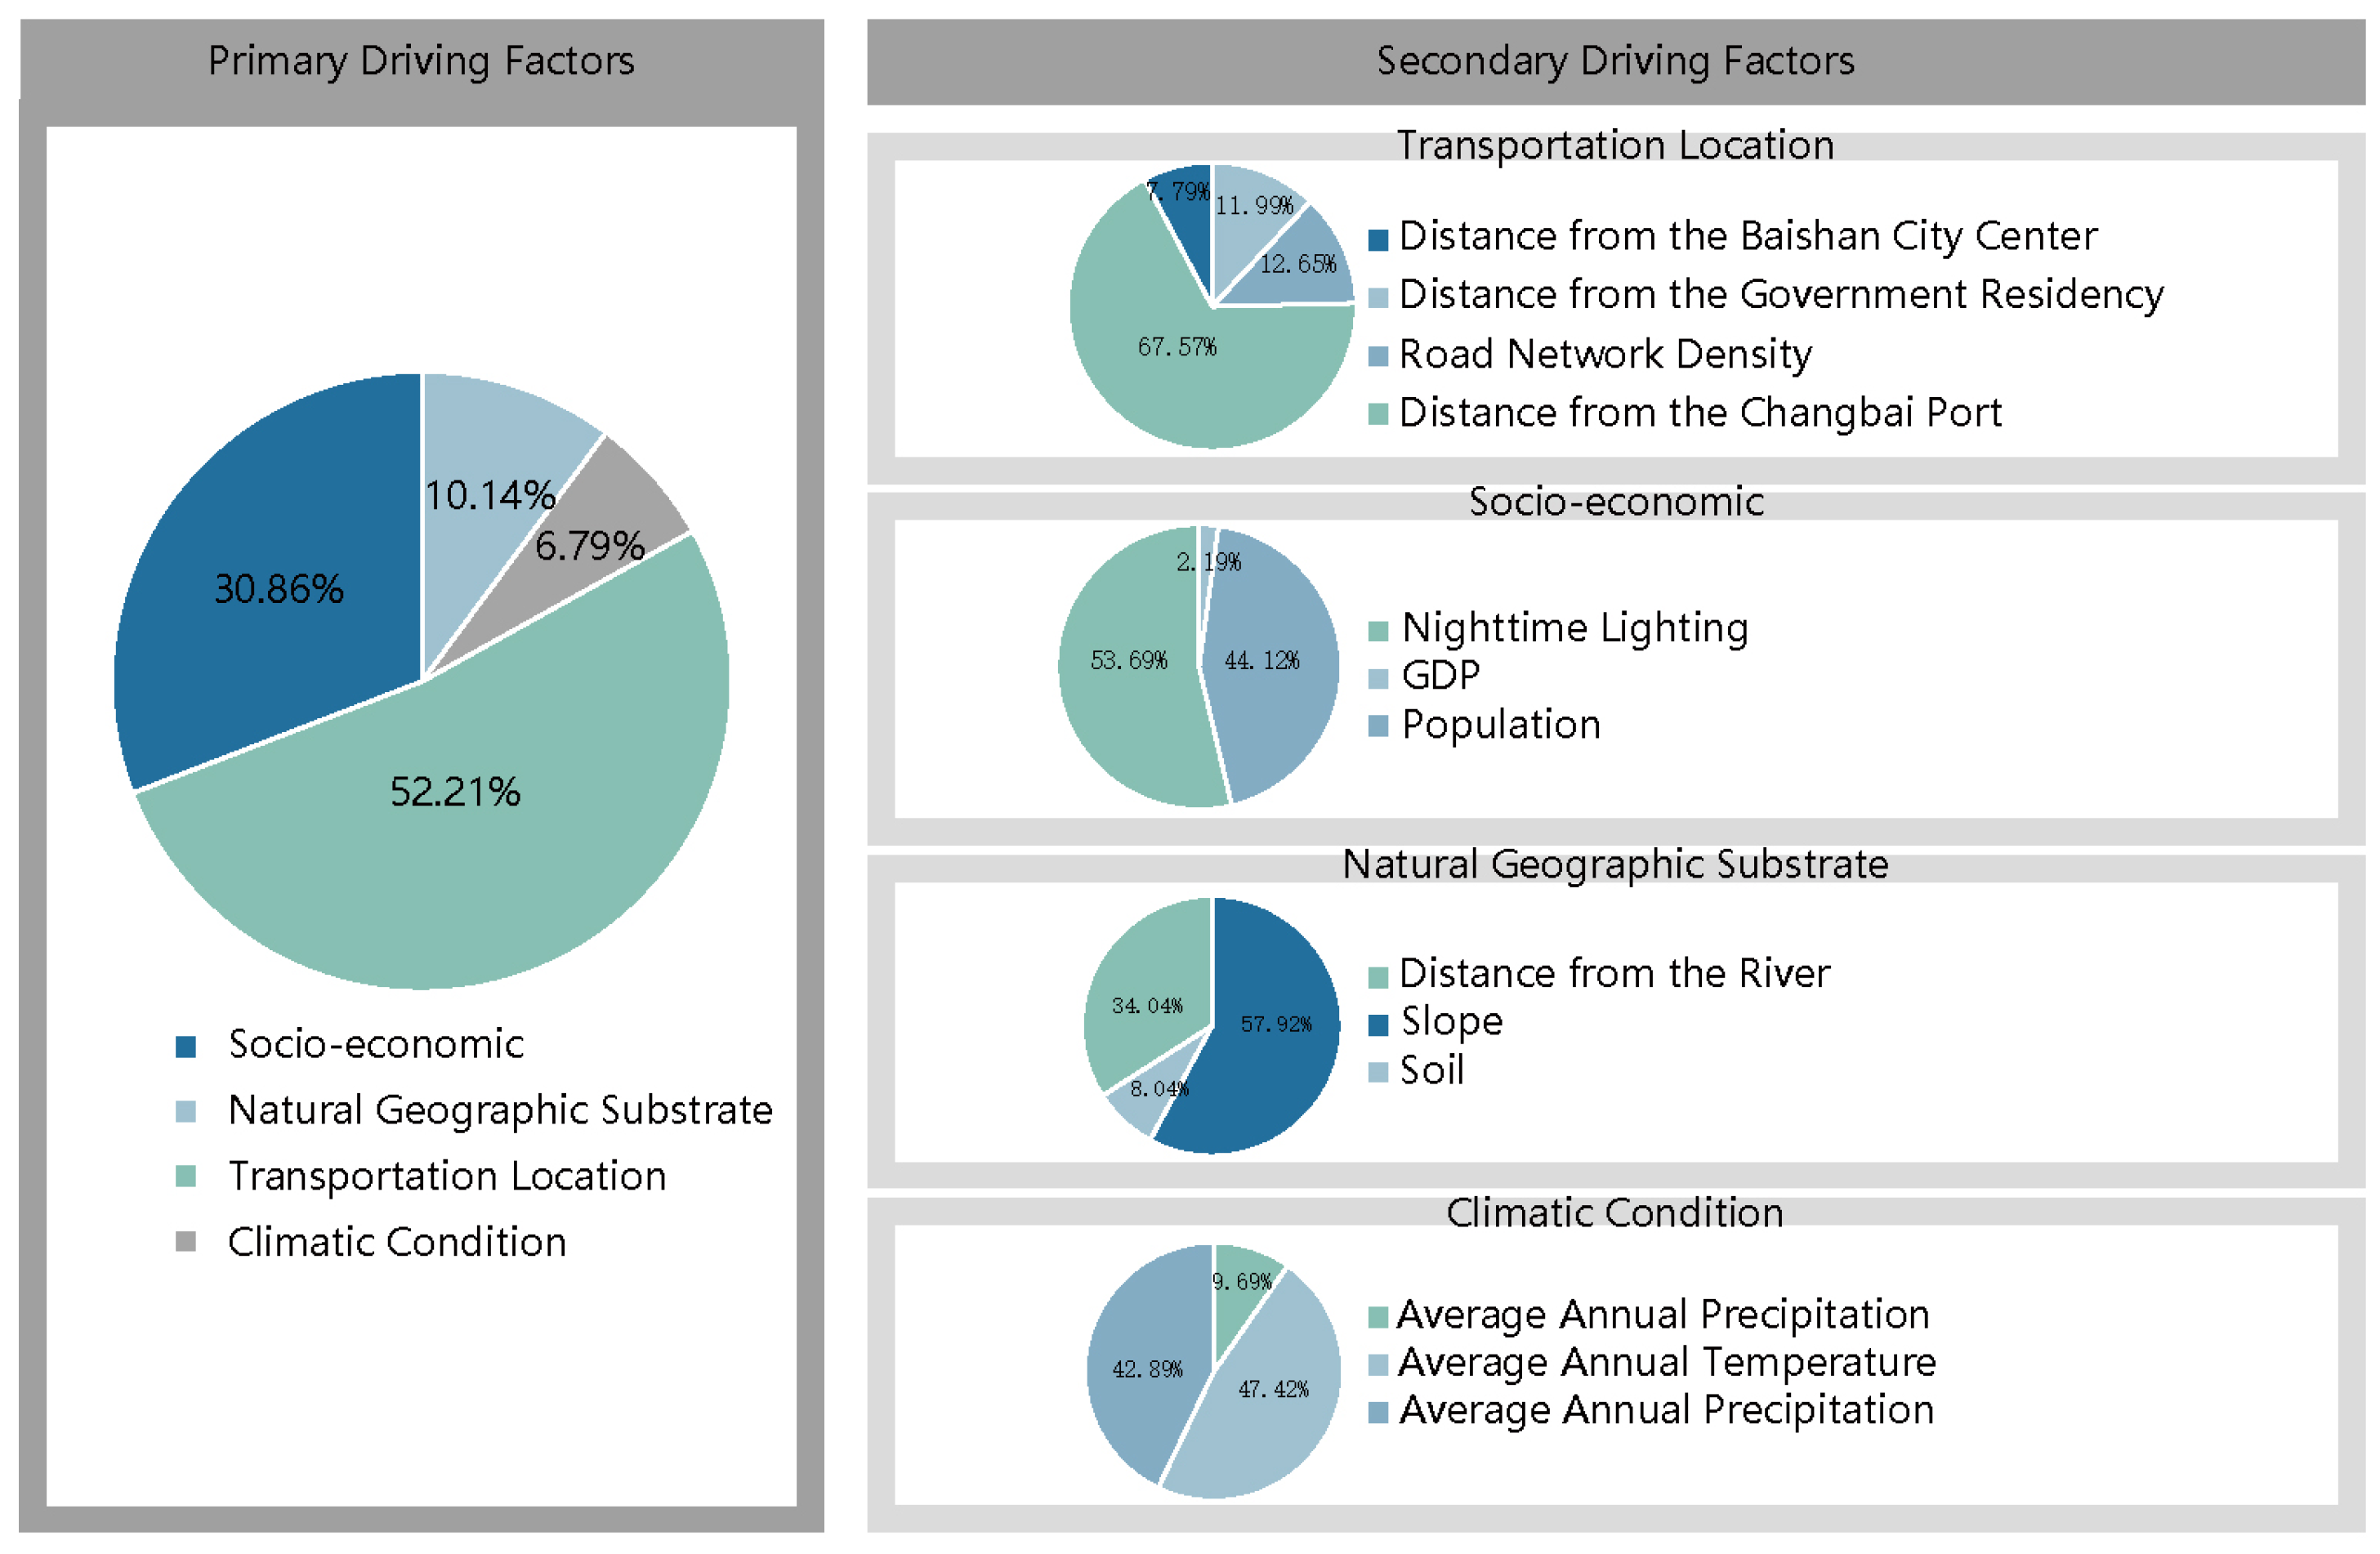
4.2.1. Analysis of Land Use Drivers
4.2.2. PLUS Model Validity Test
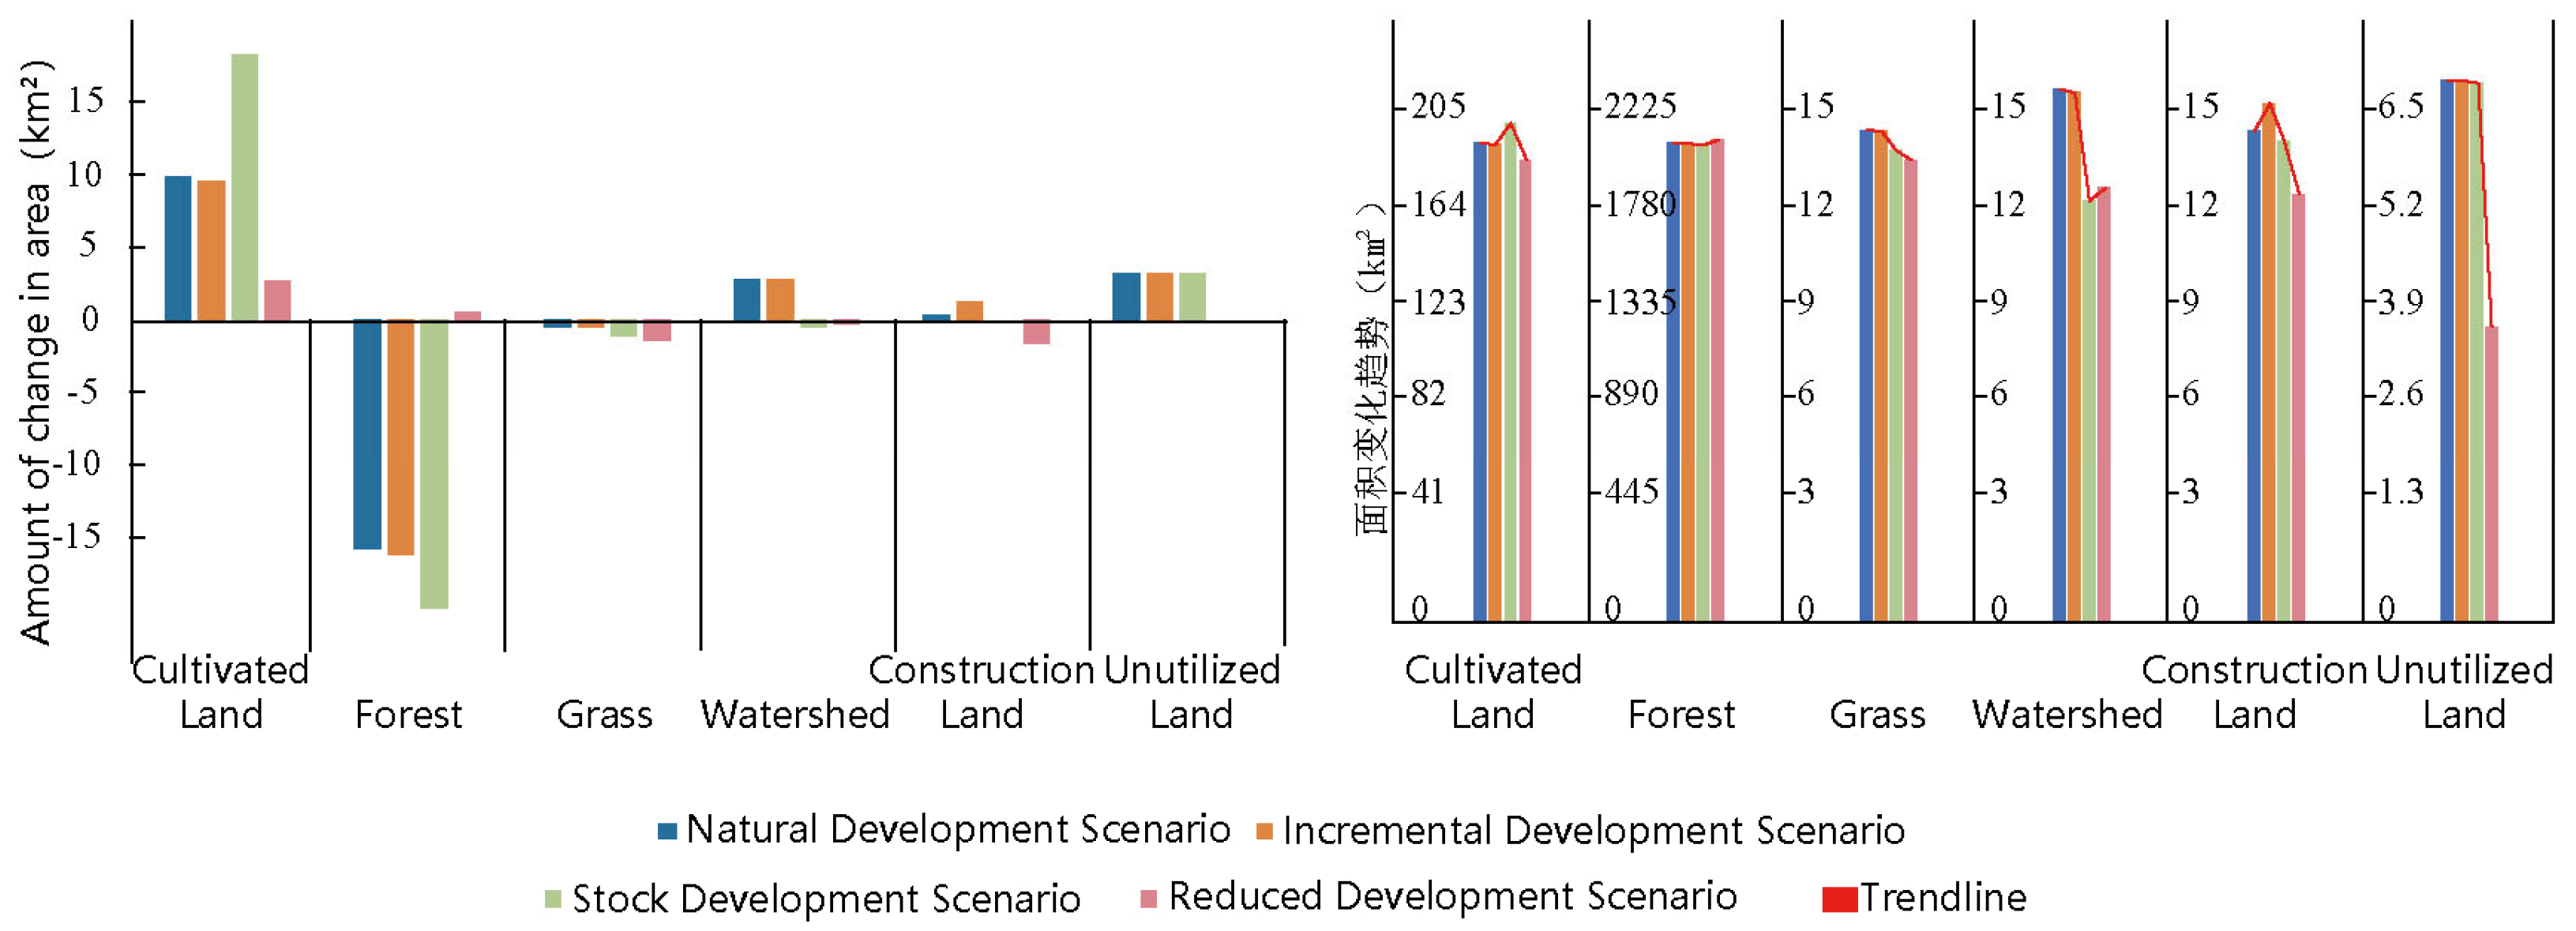
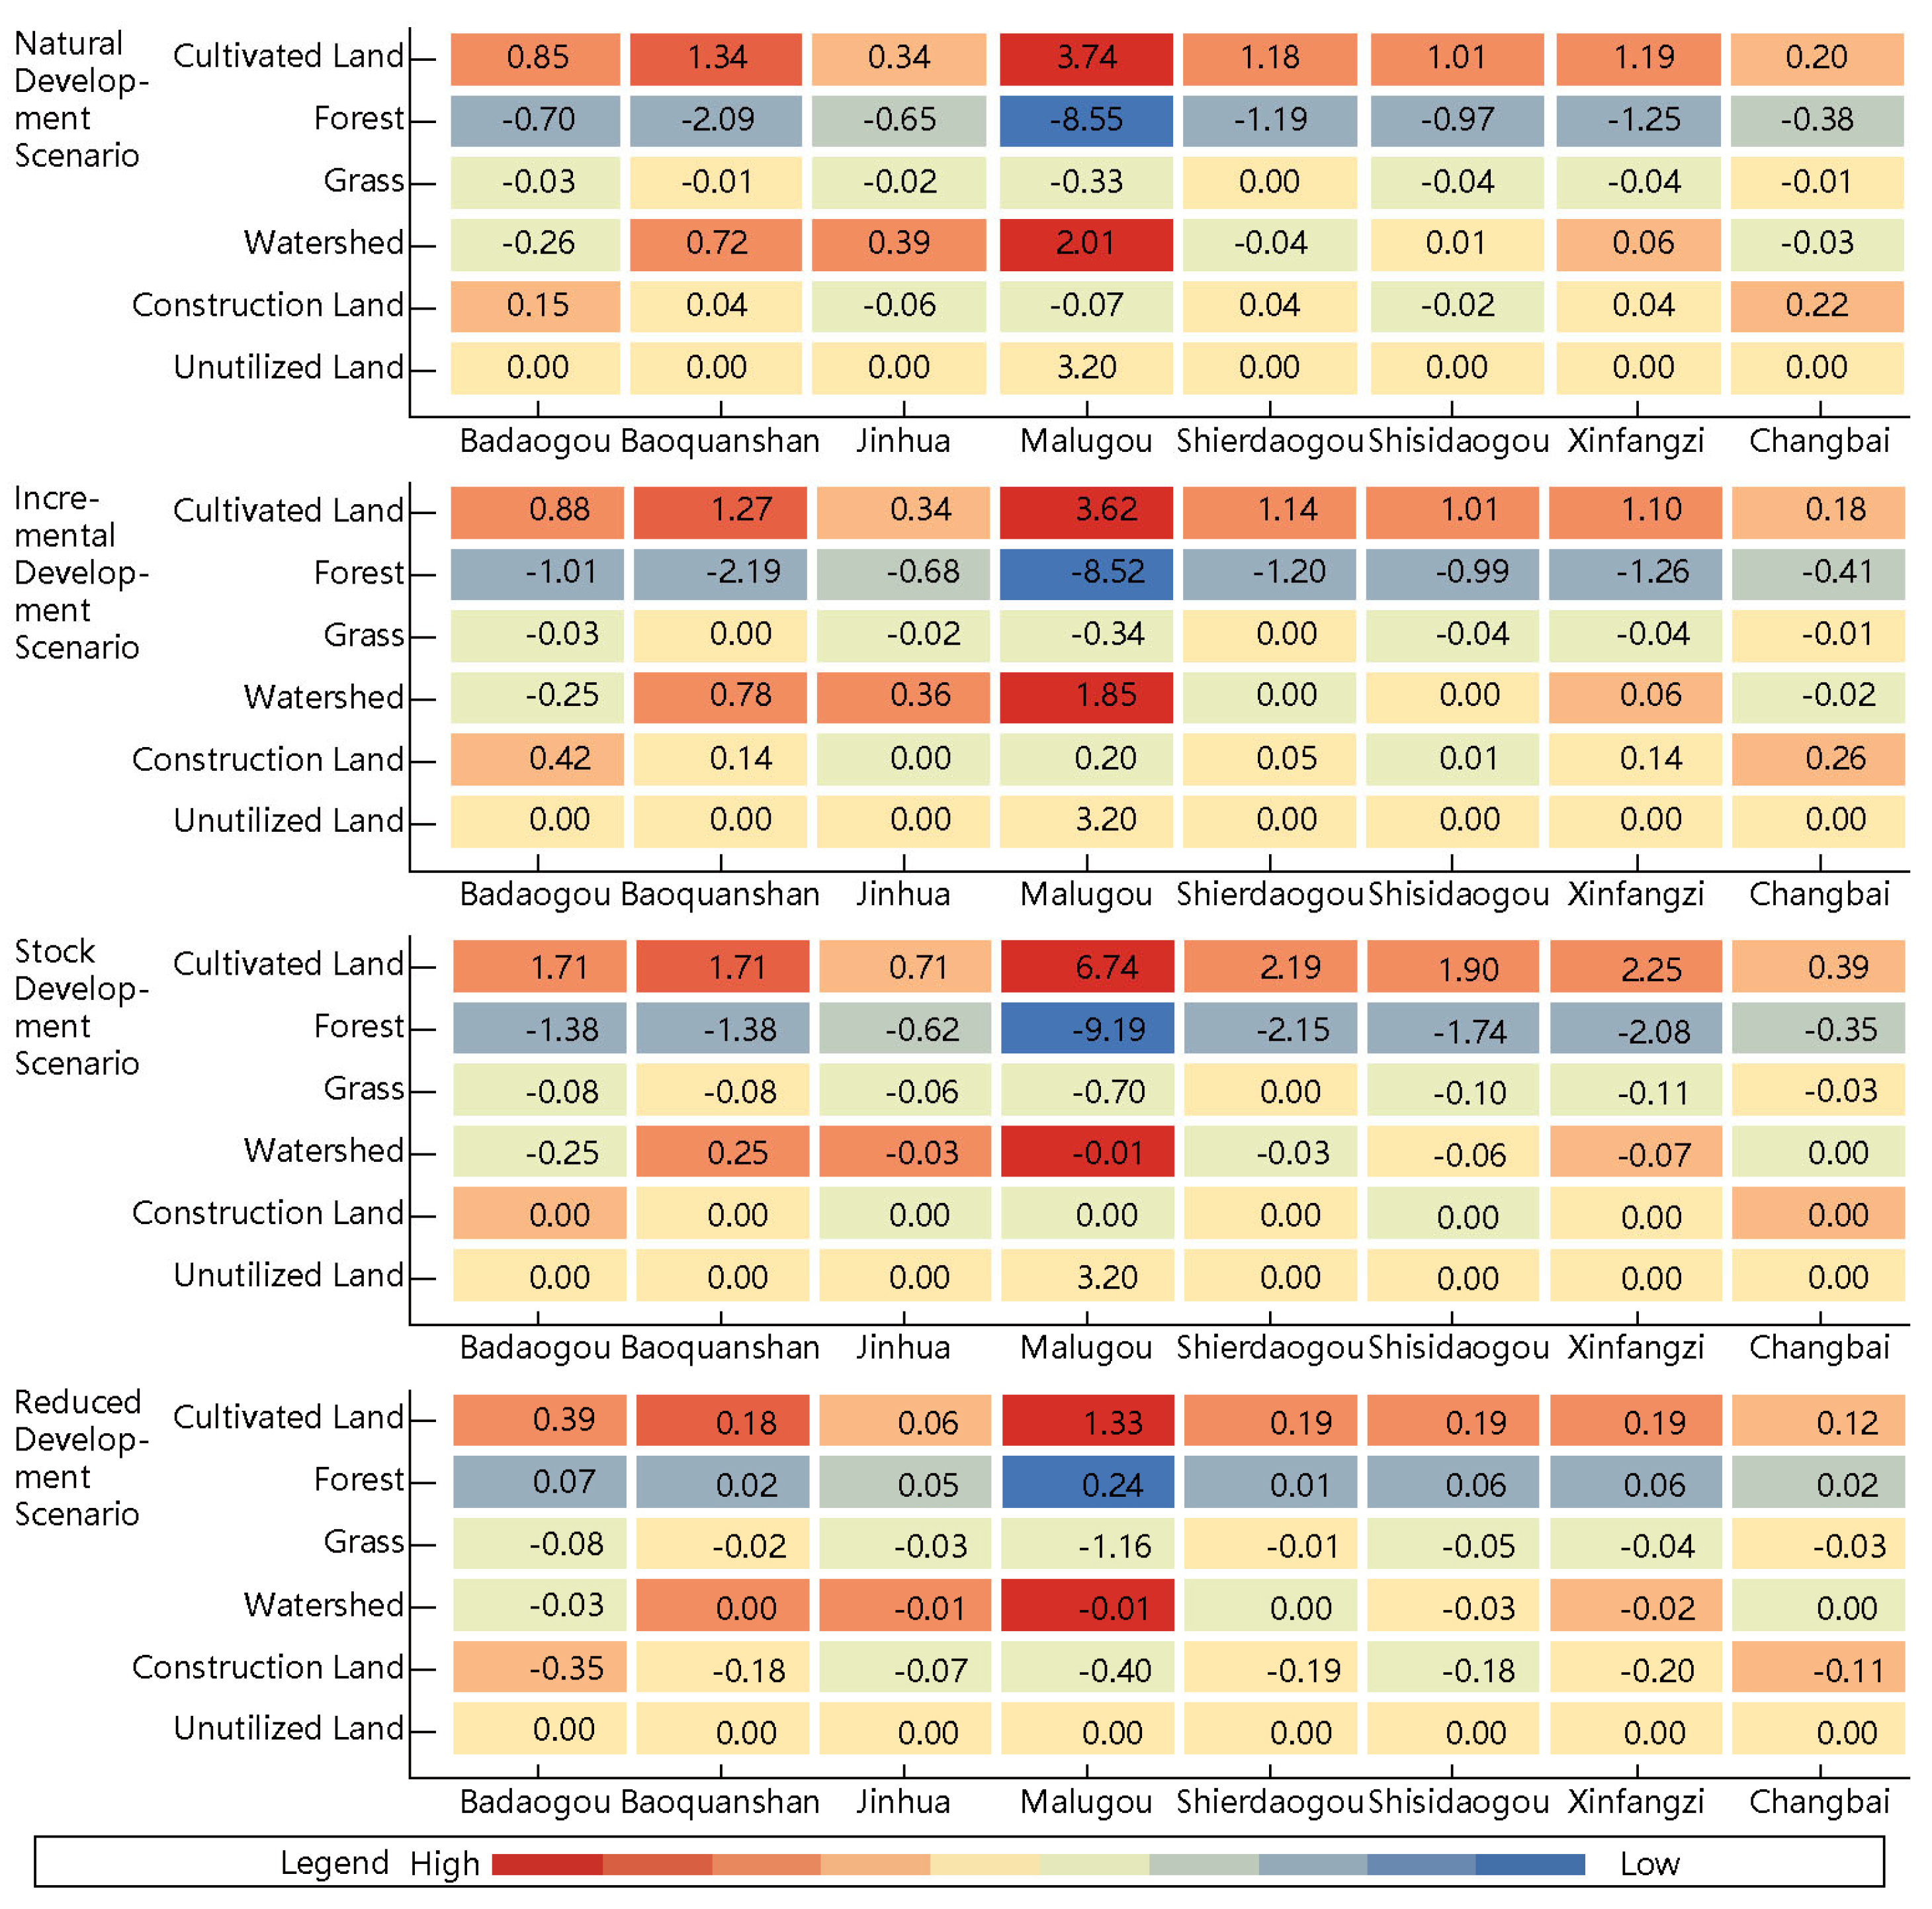
4.3. Comparison of Land Use Scenario Simulations
5. Discussion
5.1. Unique Spatial Distribution Characteristics of Border-Shrinking County Towns
5.2. The Advantages and Adaptability of Proactive Contract Planning
5.3. The Differences in Land Use Strategies Between Population Outflow Areas and Population Growth Areas in Northeast China: A Future Perspective
5.4. Planning and Development Strategies for Declining Border Counties
5.5. Innovation and Limitation
6. Conclusions
- (1)
- Incremental development exacerbates the conflict between people and land. The dual centers of Changbai Town and Malugou Town have not achieved effective synergy, resulting in a significant spatial mismatch between the expansion of construction land and higher-level planning.
- (2)
- Stock development presents a paradox. The fragmentation rate of cultivated land is high, leading to a conflict between the preservation of ecological spaces and agricultural areas. This situation reveals the dilemma of “protecting grain versus protecting forests” during the transformation process. The reduction of forest and grassland areas coexists with the successes of the policy aimed at returning farmland to forest, underscoring the stark contradiction between development and protection.
- (3)
- Reduced development emphasizes its benefits. Implementing decremental planning can enhance the efficient use of construction land, promote population concentration, and increase industrial carrying capacity, thereby validating the feasibility of “shrinkage and quality improvement.
Author Contributions
Funding
Institutional Review Board Statement
Informed Consent Statement
Data Availability Statement
Conflicts of Interest
References
- Ryan, B.D.; Gao, S. Plan implementation challenges in a shrinking city: A conformance evaluation of Youngstown’s (OH) comprehensive plan with a subsequent zoning code. J. Am. Plan. Assoc. 2019, 85, 424–444. [Google Scholar] [CrossRef]
- Zhou, K.; Liu, L.; Dai, Y. Theoretical Modeling of Shrinkage Governance, International Comparisons and Key Policy Areas. Int. Urban Plan. 2020, 35, 12–19. [Google Scholar]
- Martinez-Fernandez, C.; Weyman, T.; Fol, S.; Audirac, I.; Cunningham-Sabot, E.; Wiechmann, T.; Yahagi, H. Shrinking cities in Australia, Japan, Europe and the USA: From a global process to local policy responses. Prog. Plan. 2016, 105, 1–48. [Google Scholar] [CrossRef]
- Zhai, W.; Jiang, Z.; Meng, X.; Zhang, X.; Zhao, M.; Long, Y. Satellite monitoring of shrinking cities on the globe and containment solutions. Iscience 2022, 25, 104411. [Google Scholar] [CrossRef] [PubMed]
- Guo, F.; Qu, X.; Ma, Y.; Tong, L. Spatiotemporal pattern evolution and influencing factors of shrinking cities: Evidence from China. Cities 2021, 119, 103391. [Google Scholar] [CrossRef]
- Long, Y.; Ww, K.; Wang, J. China’s shrinking cities and its research framework. Mod. Urban Res. 2015, 9, 14–19. [Google Scholar]
- Ma, Z.; Li, C.; Zhang, J. Understanding urban shrinkage from a regional perspective: Case study of Northeast China. J. Urban Plan. Dev. 2020, 146, 05020025. [Google Scholar] [CrossRef]
- Zhang, Y.; Fu, Y.; Kong, X.; Zhang, F. Prefecture-level city shrinkage on the regional dimension in China: Spatiotemporal change and internal relations. Sustain. Cities Soc. 2019, 47, 101490. [Google Scholar] [CrossRef]
- Gong, P.; Zhang, L.; Wang, W. Evolutionary characteristics and spatial and temporal patterns of urban contraction in China from the population perspective—An analysis based on data from the seventh national census bulletin. Popul. Econ. 2022, 1–15. [Google Scholar] [CrossRef]
- Chen, R. Comprehensive Measurement and Analysis of Influential Factors of Shrinking Cities in China. Stat. Decis. Mak. 2021, 37, 68–71. [Google Scholar] [CrossRef]
- Tong, Y.; Liu, W.; Li, C.; Zhang, J.; Ma, Z. Understanding patterns and multilevel influencing factors of small town shrinkage in Northeast China. Sustain. Cities Soc. 2021, 68, 102811. [Google Scholar] [CrossRef]
- Deng, T.; Wang, D.; Yang, Y.; Yang, H. Shrinking cities in growing China: Did high speed rail further aggravate urban shrinkage? Cities 2019, 86, 210–219. [Google Scholar] [CrossRef]
- Li, H.; Mykhnenko, V. Urban shrinkage with Chinese characteristics. Geogr. J. 2018, 184, 398–412. [Google Scholar] [CrossRef]
- Guan, D.; He, X.; Hu, X. Quantitative identification and evolution trend simulation of shrinking cities at the county scale, China. Sustain. Cities Soc. 2021, 65, 102611. [Google Scholar] [CrossRef]
- Sun, P.; Zhang, K.; Cao, N.; Liu, J. Geographic perception and governance logic of regional urban contraction in Northeast China. J. Geogr. 2024, 79, 1918–1939. [Google Scholar]
- Li, W.; Li, H.; Wang, S.; Hao, F. Identification of shrinking cities and spatial and temporal evolution of their construction land expansion in Northeast China. Resour. Sci. 2024, 46, 368–385. [Google Scholar]
- Zhang, M.; Xiao, H. Characteristics of spatial pattern and role mechanism of urban contraction in Northeast China. Urban Issues 2020, 1, 33–42. [Google Scholar] [CrossRef]
- Yan, G.; Chen, X.; Zhang, Y. Research on the distribution pattern of shrinking cities and influencing factors in Northeast China based on random forest model. Geoscience 2021, 41, 880–889. [Google Scholar] [CrossRef]
- Song, X.; Feng, Q.; Xia, F.; Li, X.; Scheffran, J. Impacts of changing urban land-use structure on sustainable city growth in China: A population-density dynamics perspective. Habitat Int. 2021, 107, 102296. [Google Scholar] [CrossRef]
- Yang, L.; He, Y. Analysis of spatial distribution and influencing factors of shrinking cities in Jilin Province. J. West. Habitat 2018, 33, 21–27. [Google Scholar] [CrossRef]
- Häußermann, H.; Siebel, W. Die schrumpfende Stadt und die Stadtsoziologie. In Soziologische Stadtforschung; VS Verlag für Sozialwissenschaften: Wiesbaden, Germany, 1988. [Google Scholar]
- Wiechmann, T. Errors expected—Aligning urban strategy with demographic uncertainty in shrinking cities. Int. Plan. Stud. 2008, 13, 431–446. [Google Scholar] [CrossRef]
- Przybyła, K.; Kachniarz, M.; Hełdak, M. The Impact of Administrative Reform on Labour Market Transformations in Large Polish Cities. Sustainability 2018, 10, 2860. [Google Scholar] [CrossRef]
- Döringer, S.; Uchiyama, Y.; Penker, M.; Kohsaka, R. A meta-analysis of shrinking cities in Europe and Japan. Towards an integrative research agenda. Eur. Plan. Stud. 2020, 28, 1693–1712. [Google Scholar] [CrossRef]
- Reis, J.P.; Silva, E.A.; Pinho, P. Spatial metrics to study urban patterns in growing and shrinking cities. Urban Geogr. 2016, 37, 246–271. [Google Scholar] [CrossRef]
- Zhou, Y.; Li, C.; Ma, Z.; Hu, S.; Zhang, J.; Liu, W. Identification of shrinkage and growth patterns of a shrinking city in China based on nighttime light data: A case study of Yichun. Sustainability 2019, 11, 6906. [Google Scholar] [CrossRef]
- Couch, C.; Karecha, J.; Nuissl, H.; Rink, D. Decline and sprawl: An evolving type of urban development—Observed in Liverpool and Leipzig. Eur. Plan. Stud. 2005, 13, 117–136. [Google Scholar] [CrossRef]
- Schetke, S.; Haase, D. Multi-criteria assessment of socio-environmental aspects in shrinking cities. Exp. East. Germany. Environ. Impact Assess. Rev. 2008, 28, 483–503. [Google Scholar] [CrossRef]
- Haase, D.; Haase, A.; Kabisch, N.; Kabisch, S.; Rink, D. Actors and factors in land-use simulation: The challenge of urban shrinkage. Environ. Model. Softw. 2012, 35, 92–103. [Google Scholar] [CrossRef]
- Lee, J.; Newman, G. Forecasting urban vacancy dynamics in a shrinking city: A land transformation model. ISPRS Int. J. Geo-Inf. 2017, 6, 124. [Google Scholar] [CrossRef]
- Ding, X.; Wang, C.; Zhang, S.; Wang, R. A review of urban shrinkage research at home and abroad—Knowledge mapping analysis based on Citespace. J. Nat. Sci. Hunan Norm. Univ. 2022, 1–10. Available online: http://kns.cnki.net/kcms/detail/43.1542.n.20221103.0952.002.html (accessed on 26 October 2024).
- Wu, K. Cognitive Misconceptions of Urban Shrinkage and Spatial Planning Response. Beijing Plan. Constr. 2019, 3, 4–11. [Google Scholar]
- Long, Y.; Wu, K. Shrinking cities in rapidly urbanizing China. Environ. Plan. A 2016, 48, 220–222. [Google Scholar] [CrossRef]
- Zhang, J.; Feng, C.; Chen, H. International research and Chinese localization exploration of urban shrinkage. Int. Urban Plan. 2017, 32, 1–9. [Google Scholar]
- Liu, H. Progress of quantitative calculation methods for shrinking cities. Mod. Urban Res. 2016, 17–22. [Google Scholar] [CrossRef]
- Song, X.; Wen, M.; Shen, Y.; Feng, Q.; Xiang, J.; Zhang, W.; Zhao, G.; Wu, Z. Urban vacant land in growing urbanization: An international review. J. Geogr. Sci. 2020, 30, 669–687. [Google Scholar] [CrossRef]
- Jiang, Z.; Zhai, W.; Meng, X.; Long, Y. Identifying shrinking cities with NPP-VIIRS nightlight data in China. J. Urban Plan. Dev. 2020, 146, 04020034. [Google Scholar] [CrossRef]
- Zhou, Y.; Li, C.; Zheng, W.; Rong, Y.; Liu, W. Identification of urban shrinkage using NPP-VIIRS nighttime light data at the county level in China. Cities 2021, 118, 103373. [Google Scholar] [CrossRef]
- Lu, M.; Liang, F.; Ww, Y. An international and Chinese localization analysis of the definition and classification of shrinking cities in the context of shrinkage planning. Int. Urban Plan. 2023, 38, 66–73+82. [Google Scholar] [CrossRef]
- Sun, H.; Liu, Y.; Fu, H.; Jin, Y.; Zhou, G. Spatio-temporal differentiation and influence mechanism of housing vacancy in shrinking cities in Northeast China—Based on physical geographic city scale. J. Geogr. 2024, 79, 1412–1432. [Google Scholar]
- Liu, G.; Zhou, T.; Luo, F. Analysis and dynamic prediction of factors affecting commercial housing vacancy rate in shrinking cities—Taking Hegang as an example. Pract. Underst. Math. 2024, 54, 239–249. [Google Scholar]
- Gao, S. A review of research on shrinking cities. Urban Plan. Forum 2015, 3, 44–49. [Google Scholar] [CrossRef]
- Hartt, M. The prevalence of prosperous shrinking cities. Ann. Am. Assoc. Geogr. 2019, 109, 1651–1670. [Google Scholar] [CrossRef]
- Wiechmann, T.; Pallagst, K.M. Urban shrinkage in Germany and the USA: A comparison of transformation patterns and local strategies. Int. J. Urban Reg. Res. 2012, 36, 261–280. [Google Scholar] [CrossRef]
- Fernandes, A.C.; Novy, A. Reflections on the unique response of Brazil to the financial crisis and its urban impact. Int. J. Urban Reg. Res. 2010, 34, 952–966. [Google Scholar] [CrossRef]
- Lauf, S.; Haase, D.; Seppelt, R.; Schwarz, N. Simulating demography and housing demand in an urban region under scenarios of growth and shrinkage. Environ. Plan. B: Plan. Des. 2012, 39, 229–246. [Google Scholar] [CrossRef]
- Hoekveld, J. Time-space relations and the differences between shrinking regions. Built Environ. 2012, 38, 179–195. [Google Scholar] [CrossRef]
- Haase, A.; Rink, D.; Grossmann, K.; Bernt, M.; Mykhnenko, V. Conceptualizing urban shrinkage. Environ. Plan. A 2014, 46, 1519–1534. [Google Scholar] [CrossRef]
- Wu, K.; Long, Y.; Yang, Y. Localized contraction in Beijing-Tianjin-Hebei and the Yangtze River Delta:Patterns, types and identification of influencing factors. Mod. Urban Res. 2015, 9, 26–35. [Google Scholar]
- Zhou, K.; Qian, F. Shrinking cities:Progress in research on urban development paths under counter-growth scenarios. Mod. Urban Res. 2015, 9, 2–13. [Google Scholar]
- Großmann, K.; Bontje, M.; Haase, A.; Mykhnenko, V. Shrinking cities: Notes for the further research agenda. Cities 2013, 35, 221–225. [Google Scholar] [CrossRef]
- Chen, W.; Yan, C.; Li, W.; Yang, Y. Coupling system-based spatiotemporal variation and influence factors analysis of city shrinkage in Henan. Pol. J. Environ. Stud. 2021, 30, 3497–3510. [Google Scholar] [CrossRef]
- Wang, P. Implications of Detroit’s Shrinking City Planning for Ordos City. China Society of Urban Planning, Hangzhou Municipal People’s Government. In Sharing and Quality—Proceedings of the 2018 China Urban Planning Annual Conference (11 Urban Master Planning), Hangzhou, China, 24 November 2018; Shenzhen Urban Planning and Design Research Institute Limited: Shenzhen, China, 2018; pp. 939–948. [Google Scholar]
- Zhou, P.; Wu, J.; Wu, X. Research on shrinkage urban renewal strategy based on green infrastructure construction. Int. Urban Plan. 2017, 32, 91–98. [Google Scholar] [CrossRef]
- Rhodes, J.; Russo, J. Shrinking ‘smart’?: Urban redevelopment and shrinkage in Youngstown, Ohio. Urban Geogr. 2013, 34, 305–326. [Google Scholar] [CrossRef]
- Shetty, S.; Reid, N. Global challenges and local responses: Creating a new urban world in the shrinking cities of the US industrial midwest. Reg. Sci. Policy Pract. 2013, 5, 201–218. [Google Scholar] [CrossRef]
- Liu, C.; Ma, X.; Lu, H.; Jin, W. Exploring the planning paradigm of “shrinking urban areas”. J. Urban Plan. 2017, S2, 136–141. [Google Scholar] [CrossRef]
- Wang, J.; Ye, J. Analysis of Population and Residential Market in Industrial Decline Shrinking Cities—Based on Data Analysis of Dongguan City. Urban Issues 2020, 6, 56–63. [Google Scholar] [CrossRef]
- Du, R.; Wu, M.; Zhang, Y.; Liu, C. Characteristics of “shrinking city” and planning response strategies in Muleng City, Heilongjiang Province. Planner 2018, 34, 118–122. [Google Scholar]
- Zhou, K.; Tu, H.; Dai, Y. Spatial form adjustment in urban contraction and revitalization under territorial spatial planning. Econ. Geogr. 2021, 41, 212–220. [Google Scholar] [CrossRef]
- Ning, L.; Lian, H.; Niu, Y.; Sheng, S.; Gao, Z. Identifying, classifying and exploring factors of contraction state of urban development—Taking the Gansu section of the Yellow River Basin as an example. Arid Zone Geogr. 2023, 46, 492–504. [Google Scholar]
- Liang, X.; Guan, Q.; Clarke, K.C.; Liu, S.; Wang, B.; Yao, Y. Understanding the drivers of sustainable land expansion using a patch-generating land use simulation (PLUS) model: A case study in Wuhan, China. Comput. Environ. Urban Syst. 2021, 85, 101569. [Google Scholar] [CrossRef]
- Development and Reform Bureau of Changbai Autonomous County. Outline of the 14th Five-Year Plan for National Economic and Social Development of Changbai Autonomous County and Vision 2035 [EB/OL]. Available online: http://xxgk-cb.cbs.gov.cn/zcbm/fgw/xbxxgkml/202405/t20240508_809010.html (accessed on 8 May 2024).
- Xu, X.; Liu, J.; Zhang, S.; Li, R.; Yan, C.; Wu, S. China Multi-Period Land Use Remote Sensing Monitoring Dataset (CNLUCC). Resource and Environmental Science Data Registration and Publication System. 2018. Available online: https://www.resdc.cn/DOI/doi.aspx?DOIid=54 (accessed on 8 May 2024).
- Lu, L.; Liu, C. Chinese Soil Dataset Based on the World Soil Database (HWSD) (v1.1). National Glacial Tundra Desert Science Data Center. 2019. Available online: https://cstr.cn/CSTR:11738.11.ncdc.Westdc.2020.585 (accessed on 8 May 2024).
- Peng, S. Monthly Precipitation Dataset of China at 1 km Resolution (1901–2023). National Tibetan Plateau Data Center. 2020. Available online: https://www.tpdc.ac.cn/en/data/faae7605-a0f2-4d18-b28f-5cee413766a2 (accessed on 8 May 2024).
- Peng, S. China 1km Monthly Potential Evapotranspiration Dataset (1901–2023). National Tibetan Plateau Data Center. 2022. Available online: https://data.tpdc.ac.cn/en/data/8b11da09-1a40-4014-bd3d-2b86e6dccad4 (accessed on 8 May 2024).
- Peng, S. Monthly Maximum Temperature Dataset of China at 1 km Resolution (1901–2023). National Tibetan Plateau Data Center. 2022. Available online: https://zenodo.org/records/3185722 (accessed on 8 May 2024).
- Xu, X. A Kilometer-Grid Dataset of Spatial Distribution of GDP in China. Resource and Environmental Science Data Registration and Publication System. 2017. Available online: https://www.resdc.cn/DOI/doi.aspx?DOIid=33 (accessed on 8 May 2024).
- Xu, X. Annual Dataset of Nighttime Lighting in China. Resource Environmental Science Data Registration and Publication System. 2022. Available online: https://www.resdc.cn/DOI/doi.aspx?DOIid=105 (accessed on 8 May 2024).
- Lin, X.; Fu, H. Multi-scenario simulation analysis of cultivated land based on PLUS model—A case study of Haikou, China. Front. Ecol. Evol. 2023, 11, 1197419. [Google Scholar] [CrossRef]
- Lillesand, T.; Kiefer, R.W.; Chipman, J. Remote Sensing and Image Interpretation; John Wiley & Sons: Hoboken, NJ, USA, 2015. [Google Scholar]
- Ginevan, M.E. Testing land-use map accuracy: Another look. Photogramm. Eng. Remote Sens. 1979, 45, 1371–1377. [Google Scholar]
- Xu, L.; Liu, X.; Tong, D.; Liu, Z.; Yin, L.; Zheng, W. Forecasting urban land use change based on cellular automata and the PLUS model. Land 2022, 11, 652. [Google Scholar] [CrossRef]
- Thomlinson, J.R.; Bolstad, P.V.; Cohen, W.B. Coordinating methodologies for scaling landcover classifications from site-specific to global: Steps toward validating global map products. Remote Sens. Environ. 1999, 70, 16–28. [Google Scholar] [CrossRef]
- Congalton, R.G.; Green, K. Assessing the Accuracy of Remotely Sensed Data: Principles and Practices; CRC Press: Boca Raton, FL, USA, 2019. [Google Scholar] [CrossRef]
- Congalton, R.G. A review of assessing the accuracy of classifications of remotely sensed data. Remote Sens. Environ. 1991, 37, 35–46. [Google Scholar] [CrossRef]
- Foody, G.M. Status of land cover classification accuracy assessment. Remote Sens. Environ. 2002, 80, 185–201. [Google Scholar] [CrossRef]
- Aronoff, S. The map accuracy report: A user’s view. Photogramm. Eng. Remote Sens. 1982, 48, 1309–1312. [Google Scholar]
- McHugh, M.L. Interrater reliability: The kappa statistic. Biochem. Medica 2012, 22, 276–282. [Google Scholar] [CrossRef]
- Shen, J.; Chen, G.; Zhao, X. Planning Change under the Threshold of Transformational Development—Thinking Based on Incremental Planning, Inventory Planning and Reduction Planning. In China Society of Urban Planning, Shenyang Municipal People’s Government. 60 Years of Planning:Achievements and Challenges—Proceedings of the 2016 China Urban Planning Annual Conference (12 Planning Implementation and Management), Shanghai, China, 15–20 August 2016; China Architecture Industry Press: Liaoning, China, 2016; pp. 325–333. [Google Scholar]
- Deng, Z.; Quan, B. Intensity characteristics and multi-scenario projection of land use and land cover change in Hengyang, China. Int. J. Environ. Res. Public Health 2022, 19, 8491. [Google Scholar] [CrossRef]
- Zou, B. Transformation from incremental planning to stock planning:Theoretical analysis and practical response. J. Urban Plan. 2015, 5, 12–19. [Google Scholar] [CrossRef]
- Chen, H.; Wang, X.; Guo, Z. The Flux of Planning—Thinking about Incremental Planning, Inventory Planning, and Reduction Planning. Mod. Urban Res. 2015, 9, 44–48. [Google Scholar] [CrossRef]
- Zhao, X.; Ti, L.; Meng, H.; Jiang, Q.; Fu, S. Progress and Prospect of Research on Reduction of Urban and Rural Construction Land in China. Resour. Sci. 2024, 46, 235–248. [Google Scholar]
- Wang, P.; Li, R.; Liu, D.; Wu, Y. Dynamic characteristics and responses of ecosystem services under land use/land cover change scenarios in the Huangshui River Basin, China. Ecol. Indic. 2022, 144, 109539. [Google Scholar] [CrossRef]
- Lu, C.; Qi, X.; Zheng, Z.; Jia, K. PLUS-model based multi-scenario land space simulation of the Lower Yellow River Region and its ecological effects. Sustainability 2022, 14, 6942. [Google Scholar] [CrossRef]
- Hou, X.; Di, X.; Hou, W.; Wu, L.; Liu, J.; Wang, J.; Su, H.; Lu, X.; Ying, L.; Yu, X.; et al. Remote sensing mapping and accuracy evaluation of land use in China’s coastal zone. J. Earth Inf. Sci. 2018, 20, 1478–1488. [Google Scholar]
- Gao, X. Research Progress on Urban Shrinkage Issues. Econ. Trends 2021, 3, 145–158. [Google Scholar]
- Oswalt, P. Rienitz. Atlas of Shrinking Cities; Hatje Crantz: Ostfildern, Germany, 2006. [Google Scholar]
- Yang, Y.; Dong, Z.; Zhou, B.B.; Liu, Y. Smart Growth and Smart Shrinkage: A Comparative Review for Advancing Urban Sustainability. Land 2024, 13, 660. [Google Scholar] [CrossRef]
- Wu, Y.; Liang, F.; Qu, K.; Lu, M.; Zhao, R.; Kong, L. Research on the Measurement of Ecological Demand and Planning Strategies in Contraction Cities under Multiple Scenarios: A Case Study of Hegang City. Ecol. Econ. 2024, 40, 89–94+117. [Google Scholar]
- Lü, H.; Rong, L.; Yan, X. Urban Planning Responses in Northeast Forest Region Towns under the “Smart Shrinkage” Concept: A Case Study of Genhe City, Inner Mongolia. Mod. Urban Res. 2020, 3, 33–37. [Google Scholar]
- Tian, J.; Wang, B.; Cheng, L.; Wang, S. The Process and Mechanism of Regional Land Use Transformation under Policy Guidance: A Case Study of Northeast China. Geogr. Res. 2020, 39, 805–821. [Google Scholar]
- Tian, J.; Wang, B.; Wang, S. Measurement and Mechanism Exploration of Land Use Transformation Characteristics in Northeast China. Econ. Geogr. 2020, 40, 184–195. [Google Scholar] [CrossRef]
- Zhao, Y.; Wang, Y.; Lyu, X. Spatio-temporal Pattern and Driving Mechanism of Land Development Intensity in Northeast China. Geogr. Geo-Inf. Sci. 2022, 38, 76–83. [Google Scholar]
- Li, Q.; Pu, Y.; Zhang, Y. Study on the Spatio-Temporal Evolution of Land Use in Resource-Based Cities in Three Northeastern Provinces of China—An Analysis Based on Long-Term Series. Sustainability 2022, 14, 13683. [Google Scholar] [CrossRef]
- Yin, C.; Shi, Y. Simulation of Urban Land Use Spatial Pattern under Planning Scenario Constraints. Geogr. Geo-Inf. Sci. 2014, 30, 66–71. [Google Scholar]
- Du, J.; Zhu, J.; Xie, J.; Ma, Z. Research Progress on Urban Land Use Based on GIS. Remote Sens. Land Resour. 2018, 30, 9–17. [Google Scholar]
- Zhu, G. Development of land use research based on satellite remote sensing technology. Remote Sens. Inf. 2001, 4, 34–37+39. [Google Scholar]

| Datasets | Data Name | Data Type |
|---|---|---|
| Land Use Dataset | Land Use Data of 2000, 2010, and 2020 | raster data/30 m |
| Natural Geographic Substrate Dataset | Slope | raster data/30 m |
| Soil | raster data/1 km | |
| Distance from the River | raster data/30 m | |
| Climate Condition Dataset | Average Annual Precipitation | raster data/1 km |
| Average Annual Evapotranspiration | ||
| Average Annual Temperature | ||
| Transportation Location Dataset | Distance from the Government Residency | raster data/30 m |
| Distance from the Baishan City Center | ||
| Distance from the Changbai Port | ||
| Road Network Density | ||
| Socio-economic Dataset | Population density data | raster data/1 km |
| Spatial Distribution Kilometer Grid Data of China’s GDP | raster data/1 km | |
| Nighttime Lighting | raster data/1 km |
| Predicted Value | Row Totals | |||||
|---|---|---|---|---|---|---|
| Type | 1 | 2 | … | k | ||
| True Value | 1 | … | ||||
| 2 | … | |||||
| … | … | … | … | … | … | |
| k | … | |||||
| Total Columns | … | |||||
| Land Use Type | Cultivated Land | Forest | Grass | Watershed | Construction Land | Unutilized Land | |
|---|---|---|---|---|---|---|---|
| Natural development scenario | Cultivated Land | 1 | 1 | 1 | 1 | 1 | 0 |
| Forest | 1 | 1 | 1 | 1 | 1 | 1 | |
| Grass | 1 | 1 | 1 | 1 | 1 | 0 | |
| Watershed | 1 | 1 | 1 | 1 | 1 | 0 | |
| Construction Land | 1 | 1 | 1 | 1 | 1 | 0 | |
| Unutilized Land | 0 | 1 | 1 | 0 | 0 | 1 | |
| Incremental Development Scenario | Cultivated Land | 1 | 1 | 1 | 1 | 1 | 0 |
| Forest | 1 | 1 | 1 | 1 | 1 | 1 | |
| Grass | 1 | 1 | 1 | 1 | 1 | 0 | |
| Watershed | 1 | 1 | 1 | 1 | 1 | 0 | |
| Construction Land | 1 | 0 | 0 | 0 | 1 | 0 | |
| Unutilized Land | 0 | 1 | 1 | 0 | 1 | 1 | |
| Stock Development Scenario | Cultivated Land | 1 | 1 | 1 | 1 | 0 | 0 |
| Forest | 1 | 1 | 1 | 1 | 0 | 0 | |
| Grass | 1 | 1 | 1 | 1 | 0 | 0 | |
| Watershed | 1 | 1 | 1 | 1 | 0 | 0 | |
| Construction Land | 0 | 0 | 0 | 0 | 1 | 0 | |
| Unutilized Land | 0 | 1 | 1 | 0 | 0 | 1 | |
| Reduced Development Scenario | Cultivated Land | 1 | 1 | 1 | 1 | 0 | 0 |
| Forest | 1 | 1 | 0 | 0 | 0 | 0 | |
| Grass | 1 | 1 | 1 | 1 | 0 | 0 | |
| Watershed | 1 | 1 | 1 | 1 | 0 | 0 | |
| Construction Land | 1 | 1 | 1 | 1 | 1 | 1 | |
| Unutilized Land | 0 | 1 | 1 | 0 | 0 | 1 | |
| Land Use Type | 2000 | 2010 | 2020 | |||
|---|---|---|---|---|---|---|
| Area | Share | Area | Share | Area | Share | |
| Cultivated Land | 77.61 | 3.13 | 183.75 | 7.40 | 194.74 | 7.85 |
| Forest | 2251.64 | 90.74 | 2255.61 | 90.90 | 2238.43 | 90.20 |
| Grass | 127.96 | 5.15 | 16.66 | 0.67 | 16.06 | 0.65 |
| Watershed | 0.39 | 0.02 | 9.94 | 0.40 | 13.10 | 0.53 |
| Construction Land | 5.45 | 0.22 | 15.05 | 0.61 | 15.35 | 0.62 |
| Unutilized Land | 18.45 | 0.74 | 0.47 | 0.02 | 3.82 | 0.15 |
| 2000 | 2010 | Turnover | ||||||
|---|---|---|---|---|---|---|---|---|
| Cultivated Land | Forest | Grass | Watershed | Construction Land | Unutilized Land | Total | ||
| Cultivated Land | 57.02 | 10.35 | 0.03 | 3.68 | 6.53 | 0.00 | 77.61 | 20.59 |
| Forest | 108.98 | 2121.74 | 12.72 | 4.81 | 3.37 | 0.00 | 2251.62 | 129.88 |
| Grass | 16.57 | 105.02 | 3.29 | 1.14 | 1.46 | 0.47 | 127.95 | 124.66 |
| Watershed | 0.01 | 0.13 | 0.00 | 0.26 | 0.00 | 0.00 | 0.39 | 0.14 |
| Construction Land | 1.17 | 0.54 | 0.00 | 0.05 | 3.69 | 0.00 | 5.45 | 1.76 |
| Unutilized Land | 0.00 | 17.84 | 0.61 | 0.00 | 0.00 | 0.00 | 18.45 | 18.45 |
| Total | 183.75 | 2255.61 | 16.66 | 9.94 | 15.05 | 0.47 | — | — |
| Inflow | 126.73 | 133.88 | 13.37 | 9.68 | 11.36 | 0.47 | — | — |
| 2010 | 2020 | Turnover | ||||||
| Cultivated Land | Forest | Grass | Watershed | Construction Land | Unutilized Land | Total | ||
| Cultivated Land | 165.79 | 15.79 | 0.1 | 1.22 | 0.85 | 0.00 | 183.75 | 17.96 |
| Forest | 27.59 | 2220.62 | 0.63 | 2.82 | 0.59 | 3.37 | 2255.61 | 35 |
| Grass | 0.12 | 1.17 | 15.30 | 0.05 | 0.01 | 0.00 | 16.66 | 1.35 |
| Watershed | 0.43 | 0.58 | 0.01 | 8.90 | 0.03 | 0.00 | 9.94 | 1.04 |
| Construction Land | 0.81 | 0.27 | 0.01 | 0.08 | 13.88 | 0.00 | 15.05 | 1.17 |
| Unutilized Land | 0.00 | 0.01 | 0.01 | 0.00 | 0.00 | 0.45 | 0.47 | 0.02 |
| Total | 194.74 | 2238.43 | 16.06 | 13.07 | 15.35 | 3.82 | — | — |
| Inflow | 28.95 | 17.81 | 0.76 | 4.17 | 1.48 | 3.37 | — | — |
| Primary Driving Factors | Secondary Driving Factors | Cultivated Land | Forest | Grass | Watershed | Construction Land | Unutilized Land |
|---|---|---|---|---|---|---|---|
| Natural Geographic Substrate Dataset | Slope | 0.05 | 0.04 | 0.09 | 0.02 | 0.06 | 0.00 |
| Soil | 0.13 | 0.18 | 0.02 | 0.01 | 0.01 | 0.00 | |
| Distance from the River | 0.07 | 0.06 | 0.05 | 0.08 | 0.03 | 0.00 | |
| Climatic Condition | Average Annual Precipitation | 0.05 | 0.10 | 0.07 | 0.40 | 0.01 | 0.09 |
| Average Annual Temperature | 0.02 | 0.03 | 0.06 | 0.05 | 0.03 | 0.00 | |
| Average Annual Evapotranspiration | 0.11 | 0.14 | 0.26 | 0.28 | 0.03 | 0.01 | |
| Transportation Location | Distance from the Government Residency | 0.22 | 0.14 | 0.05 | 0.00 | 0.26 | 0.14 |
| Road Network Density | 0.06 | 0.04 | 0.01 | 0.03 | 0.35 | 0.00 | |
| Distance from Changbai Port | 0.05 | 0.10 | 0.10 | 0.01 | 0.35 | 0.01 | |
| Distance from Baishan City Center | 0.07 | 0.06 | 0.03 | 0.01 | 0.04 | 0.01 | |
| Socio-economic | GDP | 0.05 | 0.03 | 0.14 | 0.04 | 0.01 | 0.30 |
| Population | 0.07 | 0.04 | 0.02 | 0.04 | 0.14 | 0.45 | |
| Nighttime Lighting | 0.07 | 0.04 | 0.10 | 0.03 | 0.17 | 0.00 |
| Predicted Value | Row Totals | Producer’s Accuracy | |||||||
|---|---|---|---|---|---|---|---|---|---|
| Land Use Type | Cultivated Land | Forest | Grass | Watershed | Construction Land | Unutilized Land | |||
| True Value | Cultivated Land | 18,754 | 2560 | 40 | 133 | 86 | 0 | 21,573 | 86.93% |
| Forest | 2630 | 244,574 | 89 | 316 | 119 | 341 | 248,069 | 98.59% | |
| Grass | 8 | 114 | 1642 | 5 | 0 | 0 | 1769 | 92.82% | |
| Watershed | 43 | 382 | 0 | 918 | 6 | 0 | 1349 | 68.05% | |
| Construction Land | 94 | 87 | 0 | 12 | 1477 | 0 | 1670 | 88.44% | |
| Unutilized Land | 0 | 387 | 1 | 0 | 0 | 57 | 445 | 12.81% | |
| Total Columns | 21,529 | 248,104 | 1772 | 1384 | 1688 | 398 | 274,875 | — | |
| User’s accuracy | 87.11% | 98.58% | 92.66% | 66.33% | 87.50% | 14.32% | — | — | |
| Overall Accuracy = 97.29% | |||||||||
| Kappa Coefficient | Producer’s Accuracy | |||||
|---|---|---|---|---|---|---|
| Cultivated Land | Forest | Grass | Watershed | Construction Land | Unutilized Land | |
| 0.85 | 0.87 | 0.99 | 0.93 | 0.68 | 0.88 | 0.13 |
Disclaimer/Publisher’s Note: The statements, opinions and data contained in all publications are solely those of the individual author(s) and contributor(s) and not of MDPI and/or the editor(s). MDPI and/or the editor(s) disclaim responsibility for any injury to people or property resulting from any ideas, methods, instructions or products referred to in the content. |
© 2025 by the authors. Licensee MDPI, Basel, Switzerland. This article is an open access article distributed under the terms and conditions of the Creative Commons Attribution (CC BY) license (https://creativecommons.org/licenses/by/4.0/).
Share and Cite
Li, B.; He, C.; Jiang, X.; Zheng, Q.; Li, J. Land Use Evolution and Multi-Scenario Simulation of Shrinking Border Counties Based on the PLUS Model: A Case Study of Changbai County. Sustainability 2025, 17, 6441. https://doi.org/10.3390/su17146441
Li B, He C, Jiang X, Zheng Q, Li J. Land Use Evolution and Multi-Scenario Simulation of Shrinking Border Counties Based on the PLUS Model: A Case Study of Changbai County. Sustainability. 2025; 17(14):6441. https://doi.org/10.3390/su17146441
Chicago/Turabian StyleLi, Bingxin, Chennan He, Xue Jiang, Qiang Zheng, and Jiashuang Li. 2025. "Land Use Evolution and Multi-Scenario Simulation of Shrinking Border Counties Based on the PLUS Model: A Case Study of Changbai County" Sustainability 17, no. 14: 6441. https://doi.org/10.3390/su17146441
APA StyleLi, B., He, C., Jiang, X., Zheng, Q., & Li, J. (2025). Land Use Evolution and Multi-Scenario Simulation of Shrinking Border Counties Based on the PLUS Model: A Case Study of Changbai County. Sustainability, 17(14), 6441. https://doi.org/10.3390/su17146441