Article

The Hydrochemical Characteristics Evolution and Driving Factors of Shallow Groundwater in Luxi Plain

1
School of Geography and Environment, Liaocheng University, Liaocheng 252000, China
2
Liaocheng Hydrology Center, Liaocheng 252000, China
*
Author to whom correspondence should be addressed.
Sustainability 2025, 17(14), 6432; https://doi.org/10.3390/su17146432
Submission received: 30 May 2025 / Revised: 9 July 2025 / Accepted: 11 July 2025 / Published: 14 July 2025

Abstract

As China’s primary grain-producing area, the Luxi Plain is rich in groundwater resources, which serves as the main water supply source in this region. Investigating the evolution of hydrochemical characteristics and influencing factors of groundwater in this region is crucial for maintaining the safety of groundwater quality and ensuring the high-quality development of the water supply. This study took Liaocheng City in the hinterland of the Luxi Plain as the study area. To clarify the hydrochemical characteristics evolution trend of groundwater in the area, the hydrochemical characteristics of shallow groundwater in recent years were systematically analyzed. The methods of ion ratio, correlation analysis, Gibbs and Gaillardet endmember diagrams, as well as the application of the absolute principal component scores–multiple linear regression (APCS-MLR) receptor model were used to determine the contribution rates of different ion sources to groundwater and to elucidate the driving factors behind the evolution of groundwater chemistry. Results showed significant spatiotemporal variations in the concentrations of major ions such as Na+, SO42−, and Cl in groundwater in the study area, and these variations demonstrated an overall increasing trend. Notably, the increases in total hardness (THRD), SO4, and Cl concentrations were particularly pronounced, while the variations in Na+, Mg2+, Ca2+ and other ions were relatively gradual. APCS-MLR receptor model analysis revealed that the ions such as Na+, Ca2+, Mg2+, SO42−, Cl, HCO3 and NO3 all have a significant influence on the hydrochemical composition of groundwater due to the high absolute principal component scores of them. The hydrochemical characteristics of groundwater in the study area were controlled by multiple processes, including evaporites, silicates and carbonates weathering, evaporation-concentration, cation alternating adsorption and human activities. Among the natural driving factors, rock weathering had a greater influence on the evolution of groundwater hydrochemical characteristics. Moreover, mining activities were the most important anthropogenic factor, followed by agricultural activities and living activities.

1. Introduction

Groundwater is one of the available freshwater resources. As a natural regulator of ecosystems, it plays a crucial role in maintaining ecological balance and promoting socio-economic development [1]. Climate-wise, the value of groundwater is especially significant in arid and semi-arid regions with limited surface water [2]. However, over the past few decades, regional groundwater pollution incidents have occurred occasionally [3]. By analyzing the evolution of regional groundwater hydrochemical characteristics and their driving factors, we can not only assess the extent of water pollution and its influencing factors but also clarify the fundamental chemical properties and functional uses of groundwater. This will provide a scientific basis for the efficient management of groundwater resources, which is of great significance for ensuring regional water security and advancing the high-quality development of the water conservancy industry.
The chemical composition of water in an area determines its quality, which is generally affected by geogenic and anthropogenic sources [4]. The major ion compositions in water provide valuable insights into the controlling factors and material sources of groundwater chemistry [5]. Anthony et al. conducted to appraise the hydrogeochemical characteristics of groundwater in the Nsuta manganese mining area in western Ghana using by multivariate statistical analysis [6]. Gbolahan et al. Assessed the hydrogeochemical characteristics of groundwater samples and pollution sources using physico-chemical parameters and hydrochemical facies via Piper trilinear plot and principal component analysis, respectively [7]. Additionally, Zhang et al. comprehensively applied descriptive statistics, correlation analysis, ion ratio coefficients, and Piper diagrams to study the spatiotemporal variation characteristics and evolution patterns of groundwater hydrochemistry in the Songnen Plain of Northeast China. Their findings indicated that weathering and dissolution, evaporation and concentration, cation exchange, and anthropogenic factors are the dominant hydrogeochemical processes controlling groundwater quality evolution [8]. Overall, it is obvious that current research primarily focuses on spatial scales or relatively short time scales [9,10,11], such as wet and dry seasons within a single year. However, since groundwater hydrochemical characteristics are relatively stable due to low recharge rates and long residence times (months to years) [12], they typically do not exhibit significant changes within a year [9,10]. Therefore, it is necessary to conduct a systematic analysis of the interannual variations in regional groundwater hydrochemical characteristics to better reveal their evolutionary patterns and driving factors.
The Luxi Plain is strategically located within the Yellow River Basin, characterized by a typical semi-arid plain and renowned for its abundant resources and highly developed agriculture. As a key production area for crops such as wheat, corn, cotton, and soybeans, it holds significant importance in China’s national food security. Groundwater serves as the primary source of water for domestic and industrial use in this region. This study focuses on Liaocheng City, situated in the heart of the Luxi Plain. Firstly, the hydrochemical compositions and types in shallow groundwater from 2020 to 2022 were analyzed to identify the evolutionary trends of groundwater hydrochemical characteristics. Then, by integrating ion ratio, correlation analysis, Gibbs and Gaillardet endmember diagrams—along with the Absolute Principal Component Score–Multiple Linear Regression (APCS-MLR) receptor model, the contribution rates of different ion sources to groundwater solutes were quantified. This approach helps clarify the driving factors behind the evolution of groundwater hydrochemical characteristics, providing a scientific basis for the integrated management of groundwater resources in the region.

2. Materials and Methods

2.1. Study Area

This study focused on Liaocheng City, situated in the core area of the Luxi Plain, with geographical coordinates spanning 115°16′–116°32′ E and 35°47′–37°02′ N, covering a total area of 8628 km2 and encompassing eight counties (districts/cities). Liaocheng is not only a significant grain production area in China, but also a key industrial hub in Shandong Province, with enterprises in mining/metallurgy, biopharmaceuticals and other fields. Among them, the mining and metallurgical enterprises are mainly distributed in Chiping, Yanggu, Linqing, Gaotang and Guan counties. Meanwhile, biopharmaceutical plants are concentrated in Dongchangfu District. Additionally, large-scale livestock farms are widely distributed across Dongchangfu and Shen County. These enterprises have had a significant impact on the quality of groundwater. Moreover, Liaocheng experiences a semi-arid continental climate, with a mean annual precipitation of 578.7 mm and evaporation reaching 1708.7 mm (evaporation/precipitation ratio ≈ 2.95). Approximately 50% of the annual rainfall occurs during June–August and minimal accumulation in January [13].
The study area boasts abundant groundwater resources, which serve as a vital source for sustaining local agricultural production and urban–rural water supply. The development, distribution, and burial depth of the phreatic aquifer are influenced by the Yellow River channel. Along the mainstream, the aquifer is thicker. In the transition zone between the channel and its margin, the aquifer thickness ranges from 5 to 15 m, primarily composed of fine sand and silt. In contrast, the marginal zone has a thinner aquifer (<5 m), with lithology dominated by silt and fine sand [14].

2.2. Sample Collection and Analysis

To comprehensively analyze the hydrochemical characteristics of groundwater in the study area and elucidate its evolutionary patterns, a total of 60 samples were collected across the region. Sampling was conducted on 18–22 October 2020, 19–23 October 2021, and 17–22 October 2022, respectively. Before sampling, essential parameters including GPS coordinates (longitude and latitude), well depth, and sampling time were recorded using portable instruments. At each sampling well, approximately 15–20 min of purging was performed before collecting 4 L of water samples. The samples were stored in pre-rinsed plastic containers and transported to the laboratory for analysis, with all measurements completed within 48 h of collection [15]. The spatial distribution of sampling locations was illustrated in Figure 1.
A total of 15 water quality parameters including pH, total hardness (TH as CaCO3), total dissolved solids (TDS), Na+, K+, Ca2+, Mn2+, Mg2+, SO42−, Cl, NO3-N, HCO3, CO32−, chemical oxygen demand (COD) and NH4+-N. The analytical methods were as follows. pH was measured using a pHS-3C precision pH meter; TDS was determined by the gravimetric method using an electronic balance; and THRD (calculated as CaCO3) was measured by EDTA titration with a 50 mL alkaline burette. CO32− and HCO3 were analyzed by acid-base titration. COD was determined by acidic potassium permanganate titration. The cations such as Na+, K+, Ca2+, Mg2+, Mn2+ were measured using an ICP6300 inductively coupled plasma optical emission spectrometer (ICP-OES). Anions (SO42−, Cl, NO3) were analyzed by the ICS-2100 ion chromatography system. The method detection limit and permissible drinking limit of the 15 parameters were shown in Table 1.

2.3. The Absolute Principal Component Score–Multiple Linear Regression Receptor Model

The receptor model used for ion source analysis of groundwater employed a combination of two statistical techniques, multiple linear regression (MLR) and absolute principal component scores (APCS) [17]. In this model, the absolute factor scores served as independent variables, while ion concentrations were designated as dependent variables. Using regression coefficients derived from the APCS-MLR method, the factor scores from APCS analysis were transformed to estimate the proportional contribution of each ion source. The model enables both qualitative evaluation of variable loading patterns and precise quantitative assessment of the source impacts [18,19]. The specific steps were detailed in the previous study given by Jin et al. [20].

2.4. Water Quality Assessment

Water quality assessment was performed using an integrated approach combining the single-factor index (SFI) and entropy water quality index (EWQI). For the SFI, each water quality parameter is compared directly with its corresponding threshold in national standards (GB/T 14848-2017) [21]. Therefore, the SFI can provide a clear identification of key pollutants exceeding standards.
The EWQI is a comprehensive water quality assessment method that objectively evaluates overall water status through multi-parameter integration. As an improved version of the traditional WQI, the EWQI utilizes information entropy theory to determine parameter weights, effectively reducing subjective bias in conventional weighting approaches. The detailed steps for calculating EWQI values were adopted from the previous study [13].

2.5. Statistical Analysis

Descriptive analysis, ion ratio and contributions, and correlation analysis were conducted by SPSS 16.0. Gibbs plots, Gaillardet endmember and Piper three-line diagrams were drawn through Origin.

3. Results and Discussions

3.1. Hydrochemical Characteristics of Groundwater in the Study Area

The study area, Liaocheng City, comprises eight county-level administrative divisions, including Dongchangfu District, Chiping District, and Linqing City et al. To facilitate subsequent comparative analysis of the data, the measured values of each parameter from all sampling sites within the same administrative division during 2020–2022 were averaged to simplify the data distribution. The mean values of groundwater quality parameters for each county-level division from 2020 to 2022 were detailed in Table 2, Table 3 and Table 4.
During 2020–2022, the pH values of groundwater in the study area ranged from 7.51 to 7.69, 7.25–7.90, and 7.02–7.52, with corresponding mean values of 7.60, 7.55, and 7.30, respectively. These values indicated that the groundwater in the study area was slightly alkaline and gradually approached neutral. The THRD of groundwater ranged between 500 and 1200 mg/L. The permissible drinking limit for THRD is 450 mg/L (Table 1). From 2020 to 2022, the mean THRD values were 741 mg/L, 734 mg/L, and 732 mg/L, respectively, showing high levels. TDS concentrations varied significantly among sampling sites, generally ranging from 700 to 2300 mg/L, indicating consistently high levels. This phenomenon was closely related to the content of Ca2+, Mg2+ and other ions in the groundwater. The mean TDS values were 1689 mg/L in 2020, 1511 mg/L in 2021, and 1689 mg/L in 2022, exceeding the drinking water quality standard limit of 1000 mg/L (Table 1). According to previous studies [22], water quality can be classified based on TDS levels. TDS < 50 mg/L: excellent drinking water, 50–300 mg/L: good drinking water, 300–600 mg/L: acceptable water quality, 600–900 mg/L: moderate water quality, 900–1200 mg/L: high hardness water, and >1200 mg/L: poor water quality. The shallow groundwater in the study area predominantly fell into the high hardness water category (TDS: 900–1200 mg/L), with some samples exceeding 1200 mg/L. In addition, except for COD and NH4+-N, other parameters were found to exceed the drinking water quality standards in some county-level regions of the study area. Overall, the chemical composition of groundwater in the study area from 2020 to 2022 revealed that the groundwater quality in 2020 was markedly poorer compared to 2021 and 2022, as shown in Table 5. The groundwater testing data of 2020 provided a more representative assessment of groundwater degradation, thereby, groundwater function and hydrogeochemical processes can be accurately evaluated. Therefore, subsequent analyses utilized the data of the 2020 set as the reference baseline.

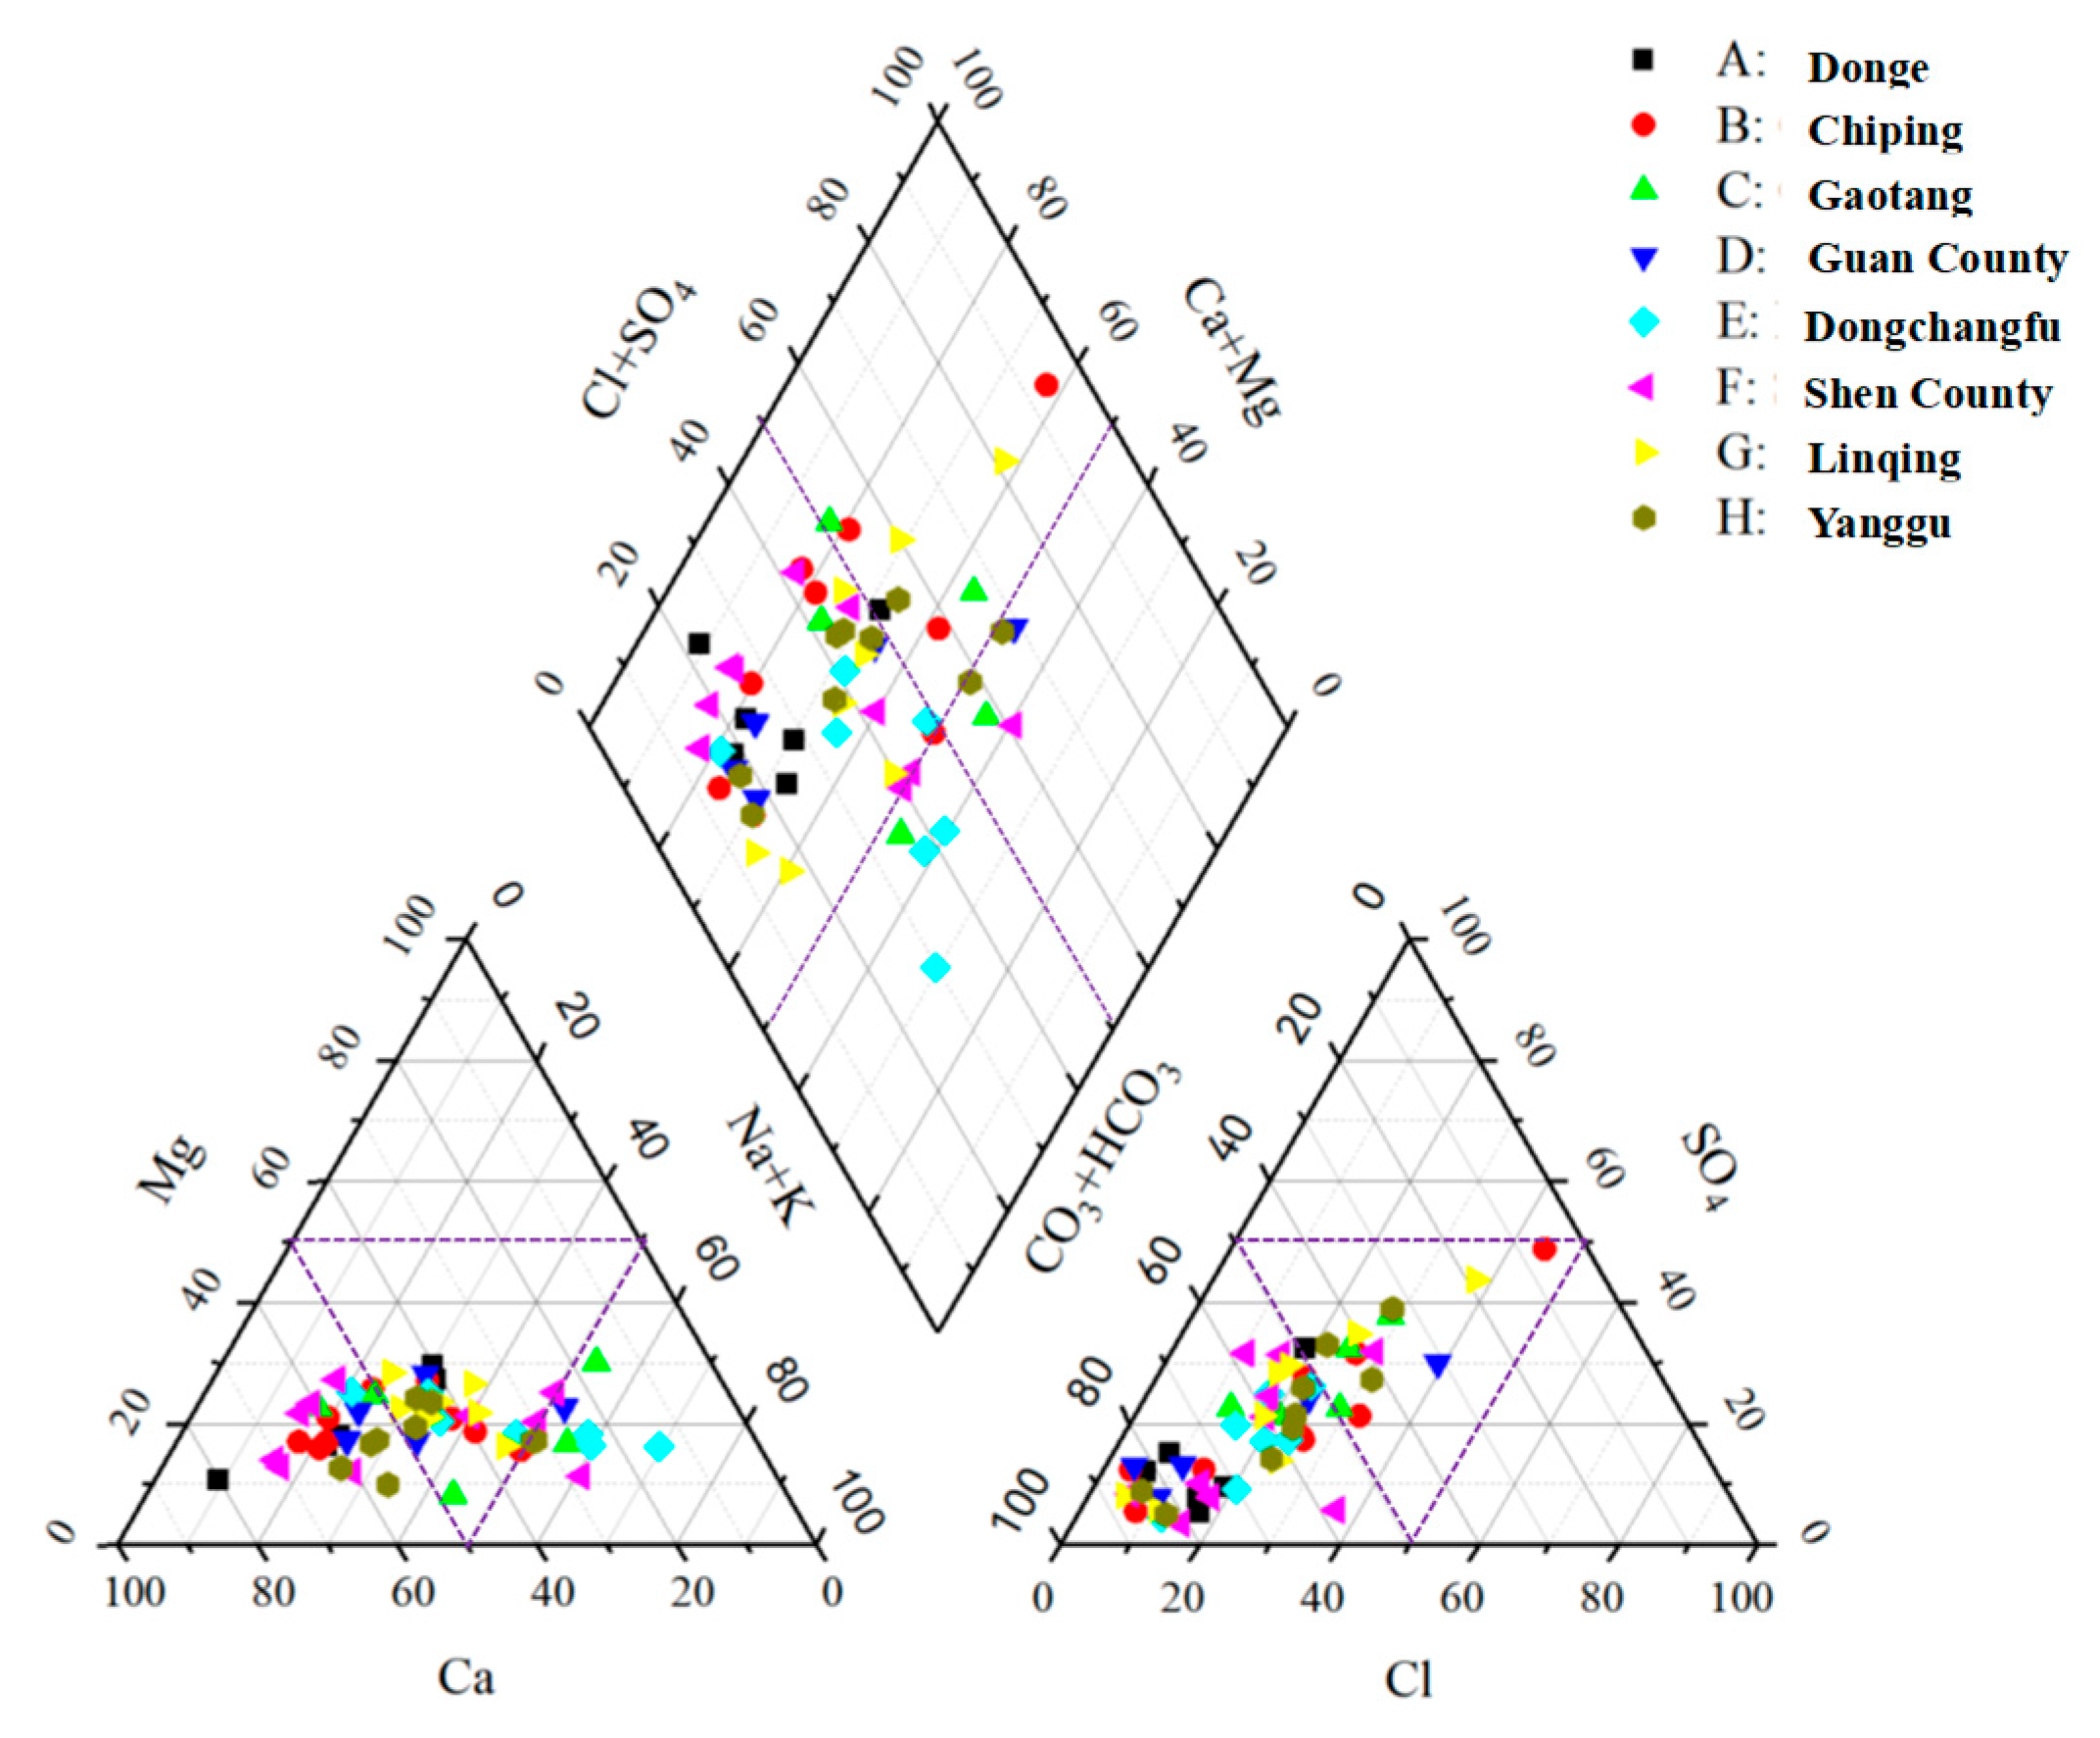
3.2. Types of Groundwater Chemistry in the Study Area

Piper trilinear diagram analysis can effectively visualize hydrochemical facies and relative ion concentrations in water samples [23,24]. As shown in Figure 2, groundwater samples were predominantly clustered in two distinct zones. The cation data points were closely aligned with the Ca2+ axis, indicating calcium dominance in shallow groundwater, with an average milliequivalent percentage of 44.1%. Concurrently, anion data points clustered near the (CO32− + HCO3) axis, with average milliequivalent percentages of 54.1%. This was mainly caused by the high concentration of bicarbonate (HCO3) in groundwater, with the average concentration of 720.62 mg/L (Table S1). This ionic composition likely originated from the weathering dissolution of carbonate minerals. The relative abundance of cations and anions followed the trends of Ca2+ > (Na+ + K+) > Mg2+ and HCO3 > SO42− > Cl, respectively. These results demonstrated that the groundwater was primarily HCO3-Ca type, with secondary facies including HCO3·SO4-Ca type, HCO3·Cl-Ca type and HCO3-Ca·Mg type. Compared to the testing data of 2020–2022, the hydrochemical facies gradually transitioned from the dominant HCO3-Ca type to mixed types including HCO3·SO4-Ca, HCO3·Cl-Ca, HCO3-Na, and HCO3·Cl-Na.

3.3. Shallow Groundwater Quality Assessment

The water quality evaluation was performed using an integrated approach combining the single-factor index (SFI) and the entropy water quality index (EWQI). The SFI identified key pollutants exceeding standards, while the EWQI provided overall quality classification based on weighted parameters. The eight parameters of pH, TH, TDS, Mn2+, SO42−, Cl, COD, and NH4+-N were selected and evaluated in accordance with the standard for groundwater quality (GB/T 14848-2017) [21]. The SFI revealed that most of the groundwater in the study area fell into Class III or IV quality categories, whereas the EWQI classified the groundwater as Class III from 2020 to 2022, indicating generally poor quality (Table 6). Class III water quality was suitable for centralized drinking water and industrial/agricultural use after meeting health benchmarks, and Class IV water was appropriate for agricultural/industrial use with treatment [25]. Groundwater contamination is closely related to the geographical environment, for example, sustained groundwater depletion due to prolonged over-extraction, intensive anthropogenic pressures including improper disposal of domestic waste and untreated sewage, and agricultural runoff containing fertilizers and pesticides [13,26]. In order to identify the specific sources of pollution, the ion sources and driving factors study was conducted.

3.4. Analysis of Major Ion Sources and Driving Factors

3.4.1. Different Ion Contributions

The APCS-MLR receptor model analysis was performed by first standardizing the groundwater monitoring data, followed by dimensionality reduction through factor analysis in SPSS 16.0 to obtain component matrices and total variance data. After varimax orthogonal rotation, two principal factors with eigenvalues greater than 1 were extracted, accounting for a cumulative variance contribution rate of 86.95%. The absolute principal component scores (APCS1 and APCS2) for each groundwater sample were then calculated (Table 7) to quantitatively determine the contribution rates of these principal factors to various water quality parameters [19]. The results showed that, except for K+, the ions such as Na+, Ca2+, Mg2+, SO42−, Cl, HCO3 and NO3 all have a significant influence on the hydrochemical composition of groundwater in the study area.

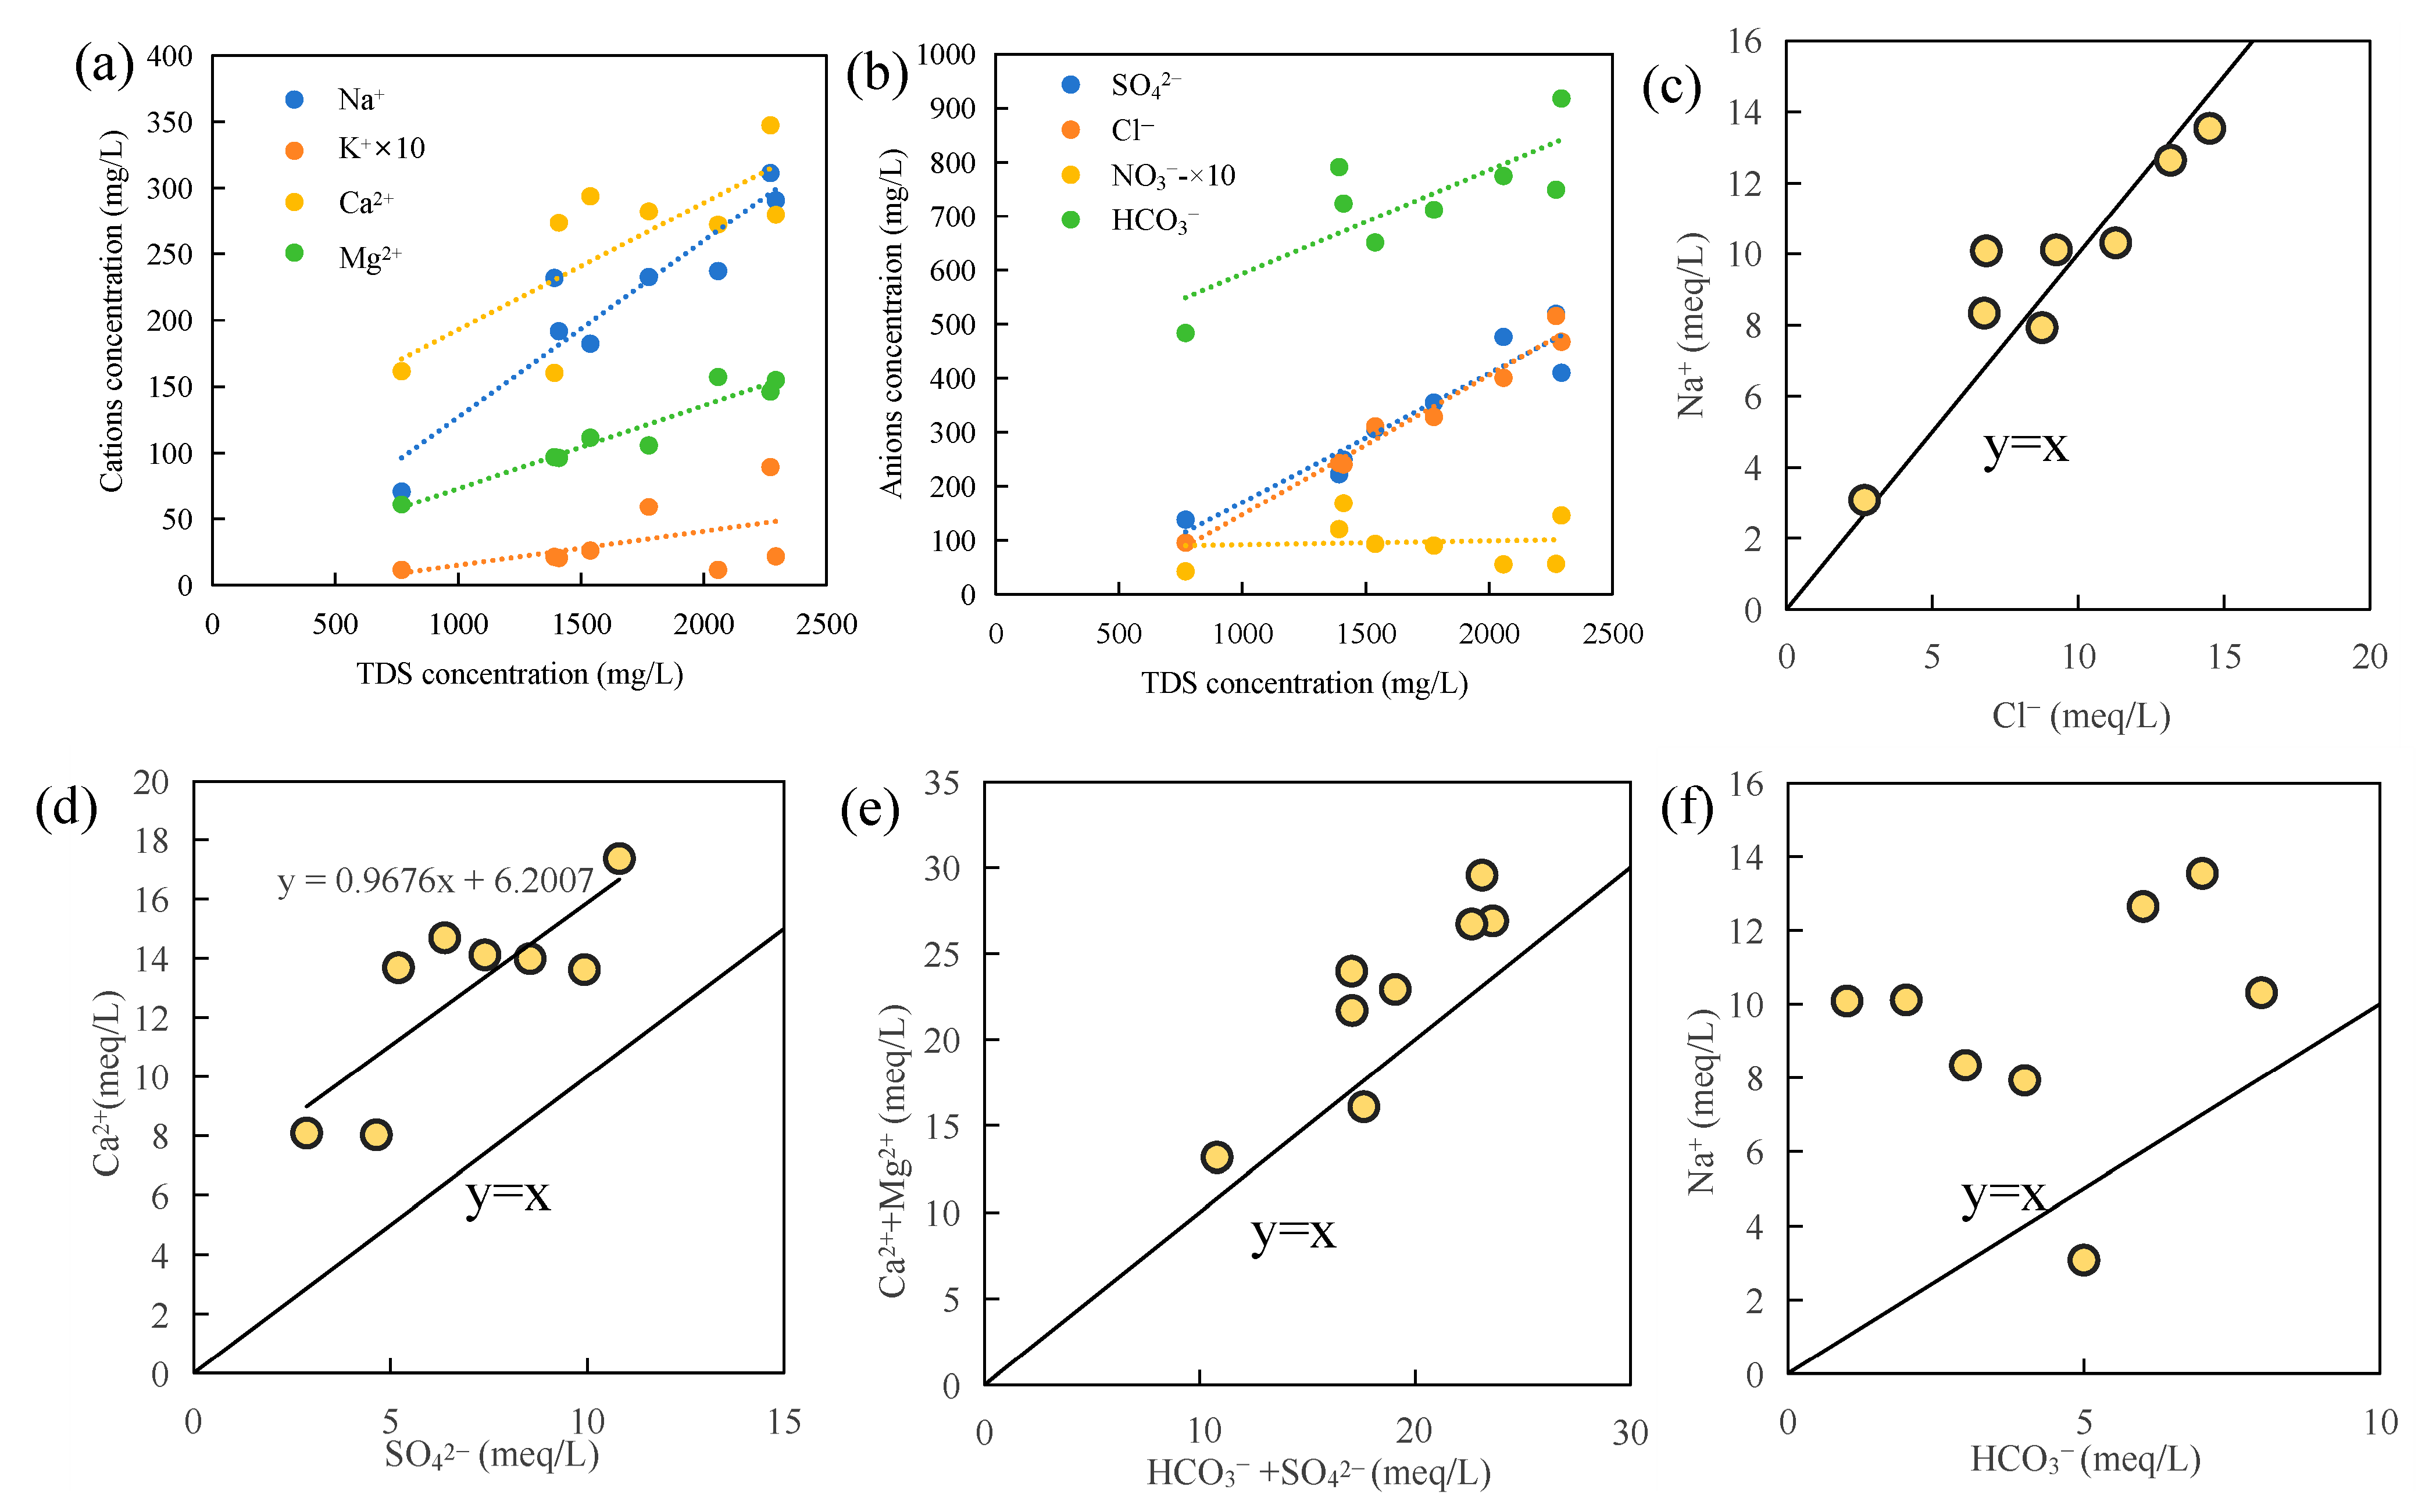
3.4.2. Relationships Between Main Ions

The ionic proportional relationships in water can, to some extent, reveal hydrochemical processes resulting from interactions between groundwater and various lithologies [27]. Figure 3 illustrated the relationships between different ions. With increasing TDS concentration, Na+, Ca2+, and HCO3 concentrations showed significant increases, while K+ and NO3 concentrations at some sampling points exhibited an inverse correlation with TDS (Figure 3a,b). This suggested that most ions in groundwater primarily originated from soluble salt dissolution, reflecting complex hydrochemical processes including water–rock interactions, dissolution-precipitation, and ion exchange [28]. The [Na+]/[Cl] scatter plot revealed that groundwater samples predominantly plot near the 1:1 equilibrium line (Figure 3c), indicating that halite dissolution likely contributes to Na+ and Cl enrichment in the shallow aquifer [29]. Cl is relatively stable in the natural environment and generally is not affected by biogeochemical processes, which is predominantly influenced by domestic wastewater [30]. Spearman correlation analysis showed that Cl was significantly correlated with Na+, Mg2+, and SO42− (Table 8). Na+ and SO42− served as diagnostic indicators of mining wastewater impacts [31], and the correlation coefficient was 0.881, revealing substantial mining-derived contamination in shallow groundwater. Ca2+ showed a strong correlation with SO42− (R2 = 0.97, Figure 3d), suggesting gypsum dissolution as a primary source of these ions. However, the [Ca2+]/[SO42−] molar ratio > 1 implied additional Ca2+ inputs from other processes (e.g., carbonates weathering, cation exchange). Additionally, the [Ca2+ + Mg2+]/[HCO3] ratios > 1 (Figure 3e) also reflected that gypsum dissolution was the major source of the ions. While [Na+]/[HCO3] ≥ 1 (Figure 3f) indicated that the main water–rock action in the process of groundwater runoff was the silicate weathering, and cation exchange was also a possible source [32]. NO3 is a characteristic factor reflecting human activities. The existence of NO3 indicated that groundwater may have been affected by human activities, such as sewage discharge and farmland fertilization et al. [33,34]. The co-occurrence of these processes suggested a complex hydrogeochemical evolution in the aquifer.

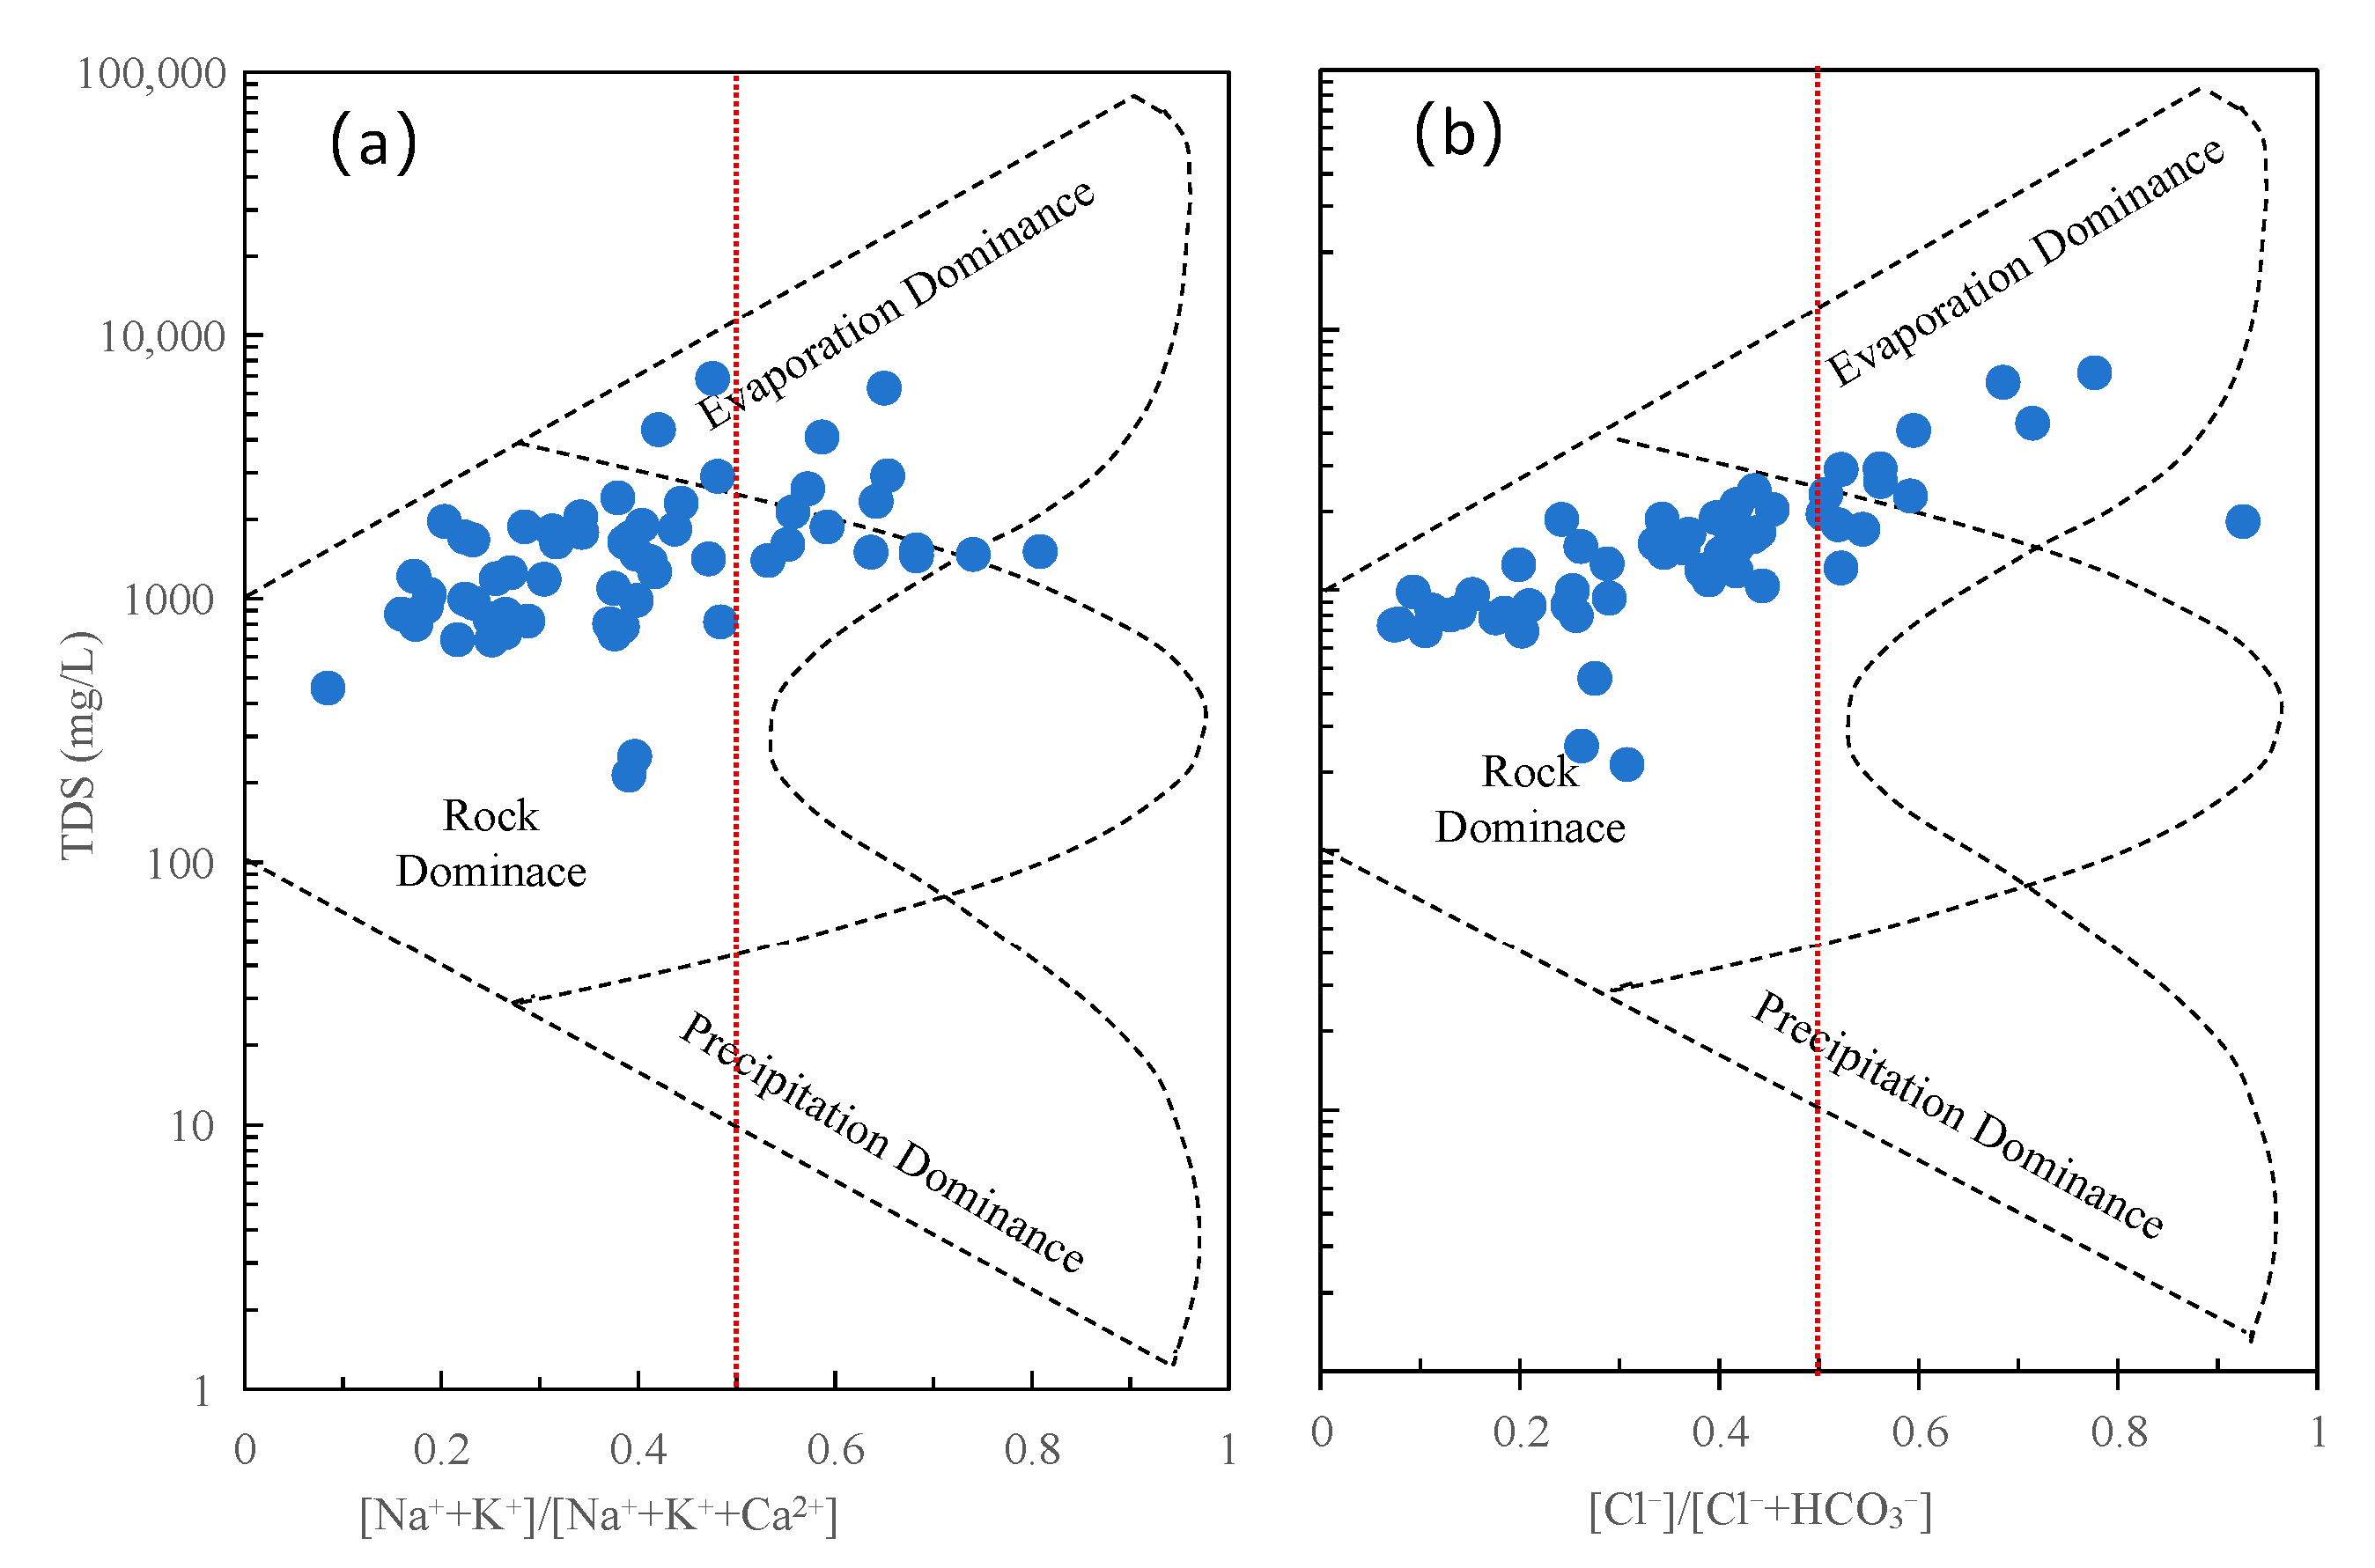
3.4.3. Rock Weathering

The Gibbs diagram, originally developed for characterizing formation mechanisms and controlling factors of surface water chemistry (rivers, lakes and oceans), has been subsequently applied to groundwater studies [35,36]. This method classifies the origins of groundwater chemical components into three categories: rock weathering, evaporation-crystallization, and atmospheric precipitation. Generally, rock weathering is a primary source of soluble ions in natural water systems [37]. Figure 4 presented the Gibbs plots of TDS versus [Cl]/[Cl + HCO3] and [Na+ + K+])/[Na+ + K+ + Ca2+] ratios derived from shallow groundwater chemistry data in 2020 in the study area.
The relationship between TDS and [Na+ + K+]/[Na+ + K+ + Ca2+] was shown in Figure 4a, at [Na+ + K+]/[Na+ + K+ + Ca2+] < 0.5, i.e., [Ca2+] > [Na+ + K+], chemical weathering of carbonates predominated [38]. Due to the high SO42− concentration in the groundwater, with an average value of 335 mg/L, the gypsum dissolution was also an important process.
CaCO3 → Ca2+ + CO32−
CaSO4 → Ca2+ + SO42−
CaMg(CO3)2 → Ca2+ + Mg2+ + 2CO32−
At [Na+ + K+]/[Na+ + K+ + Ca2+] > 0.5, i.e., [Na+ + K+] > [Ca2+], there was an increasing participation of chemical weathering of silicates in the series albite-anorthite and microcline [38]:
NaAlSi3O8 → Na+ + AlO2 + 3SiO2
CaAl2Si2O8 → Ca2+ + 2AlO2+ 2SiO2
KAlSi3O8 → K+ + AlO2 + 3SiO2
Figure 4b demonstrated that at [Cl]/[Cl + HCO3] < 0.5, i.e., [HCO3] > [Cl], the participation of seawater was insignificant compared to rock weathering processes [38]. Therefore, the groundwater chemical characteristics were predominantly influenced by carbonates, gypsum and silicates weathering. These processes were superimposed by a strong effect of evaporation, which led to a shift in the points towards increasing TDS values.
The groundwater samples in the study area exhibited a bimodal distribution. As illustrated in Figure 5a. The majority of sample points clustered near the weathering end-members of silicates and evaporites, while Figure 5b showed that most samples distributed between the silicates and carbonates weathering end-members. This phenomenon suggested that groundwater chemistry was primarily controlled by incongruent weathering of evaporites, silicates and carbonates. Moreover, the uneven distribution of groundwater samples implied additional influencing factors beyond water–rock interactions.

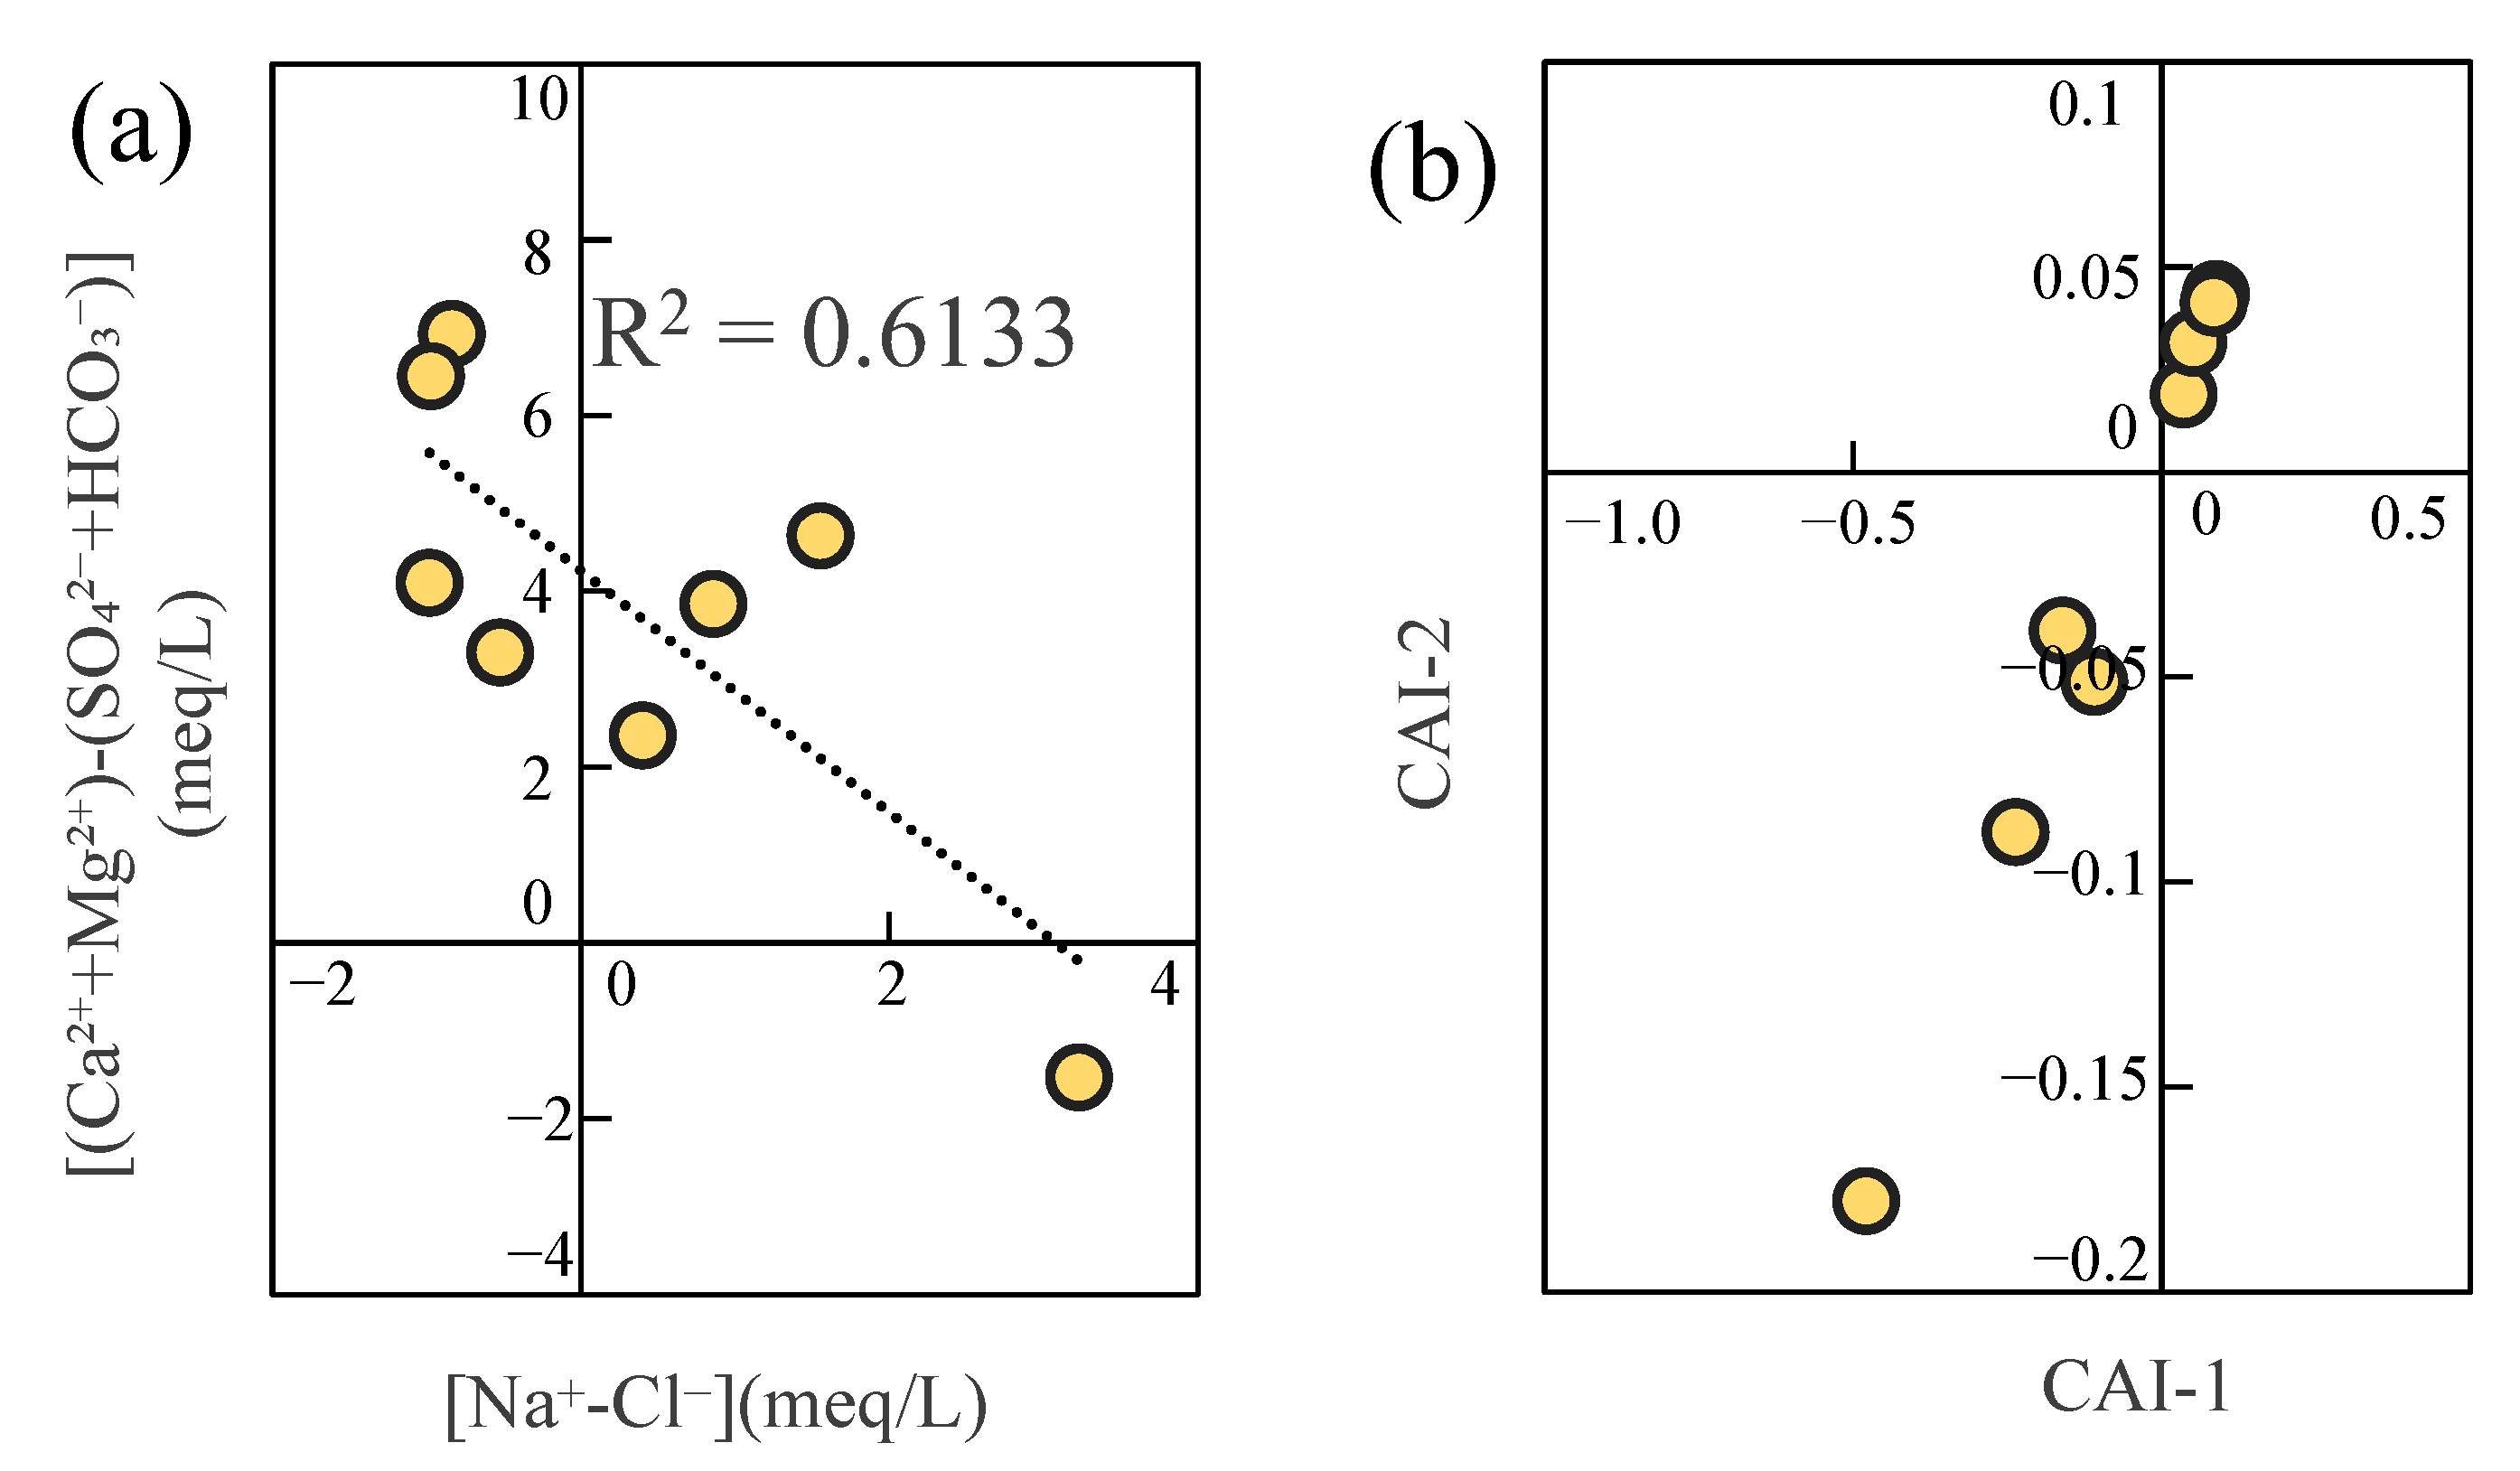
3.4.4. Cation Exchange Adsorption

Cation exchange adsorption refers to the process where negatively charged clay particles adsorb certain cations from groundwater while releasing previously adsorbed cations into the aqueous phase [39]. The occurrence of cation exchange is typically determined using the [Na+ − Cl]/[(Ca2+ + Mg2+) − (SO42− + HCO3)] ratio (γ) and chloro-alkaline indices (CAI-1 and CAI-2) [40]. Positive index values mean the replacement of Ca2+ and Mg2+ in aquifer media by Na+ and K+ from groundwater, whereas negative values suggest the reverse exchange process. Furthermore, larger absolute values of CAI-1 and CAI-2 correspond to more intensive cation exchange activity [41]. The γ values derived from the [Na+ − Cl]/[(Ca2+ + Mg2+) − (SO42− + HCO3)] were summarized in Table 9.
As shown in Table 9, the positive values of γ in Yanggu, Shen County and Donge, indicated that Na+ and K+ in groundwater replaced Ca2+ and Mg2+ in the aquifer media, and a reverse exchange process occurred in the other districts. The plot of [(Ca2+ + Mg2+) − (SO42− + HCO3)] against [Na+ − Cl] could be employed to evaluate the role of water–rock interaction on hydrochemistry [42]. If the relation between these two parameters is linear with a slope of 1.0, silicates weathering and ion exchange are significant in controlling geochemical composition. In this study, the slope was found to be 0.61 (Figure 6a), indicating that groundwater could have been influenced by other processes except for silicates weathering and ion exchange. Moreover, relatively strong cation exchange was observed in the groundwater of Dongchangfu and Shen County (Figure 6b). Overall, these results demonstrated that, in addition to rock weathering and cation exchange, the groundwater chemical characteristics were contributed by other processes.

3.4.5. Anthropogenic Influences on Groundwater Chemistry

Human activities constitute a major factor driving the evolution of groundwater chemical characteristics. Specifically, SO42− primarily originates from mining operations, while Cl, NO3, and Na+ are predominantly influenced by agricultural activities and domestic wastewater discharge [43]. The sources of NO3 can be effectively identified through the analysis of NO3/Cl ratio and Cl concentration, where: (i) high Cl with low NO3/Cl (<0.5) indicates fecal and sewage contamination, (ii) low Cl with high NO3/Cl (>1.0) suggests agricultural inputs, and (iii) low values for both parameters reflect soil organic nitrogen sources [44,45]. In this study, the mean values of 0.088 for NO3/Cl and 325 mg/L for Cl (Table 10), demonstrated that NO3 in groundwater in the study area was derived from multiple sources including animal waste and domestic sewage, and soil organic nitrogen, while Cl mainly originated from animal waste and domestic wastewater.
Furthermore, through the relationship between SO42−/Ca2+ and NO3/Ca2+, the influence of human activities on water can be further judged [45,46], where mining activities typically exhibit SO42−/Ca2+ > 1.0 and agricultural areas show NO3/Ca2+ > 0.5 [45]. The significantly higher SO42−/Ca2+ ratios compared to NO3/Ca2+ in the groundwater system provided compelling evidence that mining operations exerted substantially stronger influence (approximately 33-fold greater) than agricultural activities on groundwater chemistry across the study region. This quantitative assessment highlighted the urgent need for targeted management strategies to mitigate mining-derived contamination in local groundwater resources.
In conclusion, among natural driving factors, rock weathering played the most significant role in influencing groundwater hydrochemical characteristics. Regarding anthropogenic factors, mining activities emerged as the predominant driver of groundwater chemical evolution, followed by agricultural practices and domestic activities.

4. Conclusions

(1) During 2020–2022, the shallow groundwater in the study area exhibited pH values ranging from 7.02 to 7.90, and showed a gradual decreasing trend annually. The average THRD was approximately 735.74 mg/L, while TDS ranged between 700 and 2300 mg/L, primarily contributed by Na+, Ca2+, Mg2+, HCO3, SO42−, and Cl. The dominant cations were Ca2+ and Na+, with HCO3 being the predominant anion.
(2) The hydrochemical facies evolved from the HCO3-Ca type toward mixed types including HCO3·SO4-Ca, HCO3·Cl-Ca, HCO3-Na, and HCO3·Cl-Na. Most shallow groundwater samples were classified as Class III/IV.
(3) The APCS-MLR receptor model analysis revealed that groundwater chemistry was predominantly influenced by Na+, Ca2+, SO42−, Cl, NO3 and HCO3. The hydrochemical chemistry was driven by silicates, evaporites and carbonates weathering (dominant), evaporation, cation exchange and anthropogenic activities. Among the identified driving factors, rock weathering emerged as the predominant natural influence on groundwater chemistry. Regarding anthropogenic impacts, mining operations constituted the most significant driver of hydrochemical evolution, followed by agricultural and domestic activities.

Supplementary Materials

The following supporting information can be downloaded at: https://www.mdpi.com/article/10.3390/su17146432/s1, Table S1: The results of the collected samples in the study area in 2020.

Author Contributions

Conceptualization, N.Y. and Y.H.; methodology, N.Y. and Y.H.; validation, G.L., N.Y. and Y.H.; writing—original draft preparation, N.Y.; writing—review and editing, Y.H., F.Z. and Q.W.; supervision, Q.W. and F.Z. All authors have read and agreed to the published version of the manuscript.

Funding

This research received no external funding.

Institutional Review Board Statement

Not applicable.

Informed Consent Statement

Not applicable.

Data Availability Statement

The data that support the findings of this study are available from the corresponding author upon reasonable request.

Conflicts of Interest

The authors declare no conflicts of interest.

References

  1. Mthembu, P.P.; Elumalai, V.; Senthilkumar, M.; Wu, J. Investigation of geochemical characterization and groundwater quality with special emphasis on health risk assessment in alluvial aquifers, South Africa. Int. J. Environ. Sci. Technol. 2021, 18, 3711–3730. [Google Scholar] [CrossRef]
  2. Van Wyk, Y.; Ubomba-Jaswa, E.; Dippenaar, M.A. Potential SARS-CoV-2 contamination of groundwater as a result of mass burial: A mini-review. Sci. Total Environ. 2022, 835, 155473. [Google Scholar] [CrossRef] [PubMed]
  3. Natishah, A.J.; Samuel, M.S.; Velmurugan, K.; Showparnickaa, S.R.; Indumathi, S.M.; Kumar, M. Contamination of groundwater by microorganisms and risk management: Conceptual model, existing data, and challenges. Groundw. Sustain. Dev. 2025, 29, 101408. [Google Scholar] [CrossRef]
  4. Negi, R.S.; Aswal, R.S.; Negi, J.S.; Prasad, M.; Joshi, A.; Ramola, R.C. Distribution and risk estimation of potentially toxic elements in potable groundwater of Kumaun Himalaya, India. Groundw. Sustain. Dev. 2024, 25, 101105. [Google Scholar] [CrossRef]
  5. Gupta, S.; Nandimandalam, J.R.; Pant, D.; Chatterjee, S.; Ram, P. Environmental isotope constraints and hydrogeochemical evolution of groundwater in the semi-arid national capital environs of Delhi, India. Urban Clim. 2023, 49, 101481. [Google Scholar] [CrossRef]
  6. Ewusi, A.; Sunkari, E.D.; Seidu, J.; Coffie-Anum, E. Hydrogeochemical characteristics, sources and human health risk assessment of heavy metal dispersion in the mine pit water-surface water-groundwater system in the largest manganese mine in Ghana. Environ. Technol. Innvo. 2022, 26, 102312. [Google Scholar] [CrossRef]
  7. Folarin, G.M.; Badmus, B.S.; Akinyemi, O.D.; Idowu, O.A.; Oke, A.O.; Badmus, G.O. Groundwater quality assessment using physico-chemical parameters and pollution sources apportionment in selected farm settlements of Southwestern Nigeria. Int. J. Energy Water Resour. 2023, 7, 85–103. [Google Scholar] [CrossRef]
  8. Zhang, G.X.; Deng, W.; He, Y.; Ramis, S. Hydrochemical characteristics and evolution laws of groundwater in Songnei Plain, Northeast China. Adv. Water Sci. 2006, 17, 20–28. (In Chinese) [Google Scholar]
  9. Ustaoglu, F.; Tepe, Y.; Tas, B. Assessment of stream quality and health risk in a subtropical Turkey river system: A combined approach using statistical analysis and water quality index. Ecol. Indic. 2020, 113, 105815. [Google Scholar] [CrossRef]
  10. Adimalla, N.; Qian, H. Groundwater quality evaluation using water quality index (WQI) for drinking purposes and human health risk (HHR) assessment in an agricultural region of Nanganur, South India. Ecotoxicol. Environ. Saf. 2019, 176, 153–161. [Google Scholar] [CrossRef]
  11. Karunanidhi, D.; Aravinthasamy, P.; Deepali, M.; Subramani, T.; Bellows, B.C.; Li, P. Groundwater quality evolution based on geochemical modeling and aptness testing for ingestion using entropy water quality and total hazard indexes in an urban-industrial area (Tiruppur) of Southern India. Environ. Sci. Pollut. Res. 2021, 28, 18523–18538. [Google Scholar] [CrossRef] [PubMed]
  12. Alley, W.M.; Healy, R.W.; LaBaugh, J.W.; Reilly, T.E. Flow and storage in groundwater systems. Science 2002, 296, 1985–1990. [Google Scholar] [CrossRef] [PubMed]
  13. Yu, N.; Lv, Y.; Liu, G.; Zhuang, F.; Wang, Q. Spatial–temporal changes in shallow groundwater quality with human health risk assessment in the Luxi Plain (China). Water 2023, 15, 4120. [Google Scholar] [CrossRef]
  14. Yu, H.C.; Liu, X.Z.; Zhang, G.Y. Exploration and management of shallow groundwater over-exploitation area in Luxi Plain. Groundwater 2010, 4, 24–25. (In Chinese) [Google Scholar]
  15. APHA. Standard Methods for the Examination of Water and Wastewater, 20th ed.; American Public Health Association: Washington, DC, USA, 1999. [Google Scholar]
  16. GB 5749–2022; Standards for Drinking Water Quality. Inspection and Quarantine of the P.R. China. China Standard Press: Beijing, China, 2022. (In Chinese)
  17. Meng, L.; Zuo, R.; Wang, J.S.; Yang, J.; Teng, Y.G.; Shi, R.T.; Zhai, Y.Z. Apportionment and evolution of pollution sources in a typical riverside groundwater resource area using PCA-APCS-MLR model. J. Contam. Hydrol. 2018, 218, 70–83. [Google Scholar] [CrossRef]
  18. Huang, Y.; Deng, M.; Wu, S.; Japenga, J.; Li, T.; Yang, X.; He, Z. A modified receptor model for source apportionment of heavy metal pollution in soil. J. Hazard. Mater. 2018, 354, 161–169. [Google Scholar] [CrossRef]
  19. Thurston, G.D.; Spengler, J.D. A quantitative assessment of source contributions to inhalable particulate matter pollution in metropolitan Boston. Atmos. Environ. 1985, 19, 9–25. [Google Scholar] [CrossRef]
  20. Jin, G.; Fang, W.; Shafi, M.; Wu, D.; Li, Y.; Zhong, B.; Ma, D.; Liu, D. Source apportionment of heavy metals in farmland soil with application of APCS-MLR model: A pilot study for restoration of farmland in Shaoxing City Zhejiang, China. Ecotoxicol. Environ. Saf. 2019, 184, 109495. [Google Scholar] [CrossRef]
  21. GB/T 14848–2017; Standard for Groundwater Quality. Inspection and Quarantine of the P.R. China. China Standard Press: Beijing, China, 2017. (In Chinese)
  22. Albi, L.S.; Kartohardjono, S. The combined process of coagulation flocculation and membrane separations to treat wastewater from Tofu industry. AIP Conf. Proc. 2020, 2230, 030010. [Google Scholar]
  23. Ngwese, S.N.; Mouri, H.; Akoachere, R.A.I.; McKinley, J.; Candeias, C. Assessment of potentially harmful elements in surface and groundwater from the granito-gneissic aquiferous formations in Bertoua city and environs, East Region, Cameroon, Central Africa: Effects on human health. Groundw. Sustain. Dev. 2025, 29, 101420. [Google Scholar] [CrossRef]
  24. Qi, H.; Ma, C.; He, Z.; Hu, X.; Gao, L. Lithium and its isotopes as tracers of groundwater salinization: A study in the southern coastal plain of Laizhou Bay, China. Sci. Total Environ. 2019, 650, 878–890. [Google Scholar] [CrossRef] [PubMed]
  25. You, C.Y. Feasibility Assessment of River Bank Filtration Along the Second Songhua River and Yinma River. Master’s Thesis, Jilin University, Changchun, China, 2016. (In Chinese). [Google Scholar]
  26. Ren, L.; Ding, Q.Z.; Zhou, Y.Z.; Zhou, J.L. Analysis of groundwater hydrochemical variation and its source during the low water level period in the southern oasis area of Gaochang District, Turpan City. Environ. Sci. 2025, 46, 227–238. (In Chinese) [Google Scholar]
  27. Liu, Q.H.; Wu, B.; Wu, G.; Gao, F.; Du, M.L.; Cao, W. Evolution and mechanism analysis of groundwater chemical characteristics in the context of overexploitation—A case study of Qitai County, eastern part of Changji Prefecture, Xinjiang. Acta Sci. Circumstantiae 2024, 44, 168–178. [Google Scholar]
  28. Chen, J.; Wu, H.; Qian, H. Groundwater nitrate contamination and associated health risk for the rural communities in an agricultural area of Ningxia, northwest China. Expos. Health 2016, 8, 349–359. [Google Scholar] [CrossRef]
  29. Hua, K.; Xiao, J.; Li, S.; Li, Z. Analysis of hydrochemical characteristics and their controlling factors in the Fen River of China. Sustain. Cities Soc. 2020, 52, 101827. [Google Scholar] [CrossRef]
  30. Zheng, W.; Wang, S. Extreme precipitation accelerates the contribution of nitrate sources from anthropogenetic activities to groundwater in a typical headwater area of the North China Plain. J. Hydrol. 2021, 603, 127110. [Google Scholar] [CrossRef]
  31. Mohan, T.; Sheik Farid, N.S.; Swathi, K.V.; Sowmya, A.; Ramani, K. Sustainable biological system for the removal of high strength ammoniacal nitrogen and organic pollutants in poultry waste processing industrial effluent. J. Air Waste Manag. Assoc. 2020, 70, 1236–1243. [Google Scholar] [CrossRef]
  32. Hounslow, A.W. Water Quality Data: Analysis and Interpretation; CRC Press: Florida, BR, USA, 2018. [Google Scholar]
  33. Biddau, R.; Dore, E.; Da Pelo, S.; Lorrai, M.; Botti, P.; Testa, M.; Cidu, R. Geochemistry, stable isotopes and statistic tools to estimate threshold and source of nitrate in groundwater (Sardinia, Italy). Water Res. 2023, 232, 119663. [Google Scholar] [CrossRef]
  34. Zhang, Q.; Qian, H.; Xu, P.; Li, W.; Feng, W.; Liu, R. Effect of hydrogeological conditions on groundwater nitrate pollution and human health risk assessment of nitrate in Jiaokou irrigation district. J. Clean. Prod. 2021, 298, 126783. [Google Scholar] [CrossRef]
  35. Gibbs, R.J. Mechanisms controlling world water chemistry. Science 1970, 170, 795–840. [Google Scholar] [CrossRef]
  36. Liang, H.; Wang, W.; Li, J.; Fang, Y.; Liu, Z. Hydrochemical characteristics and health risk assessment of groundwater in Dingbian county of the Chinese Loess Plateau, northwest China. Environ. Earth Sci. 2022, 81, 319. [Google Scholar] [CrossRef]
  37. Lasaga, A.C.; Soler, J.M.; Ganor, J.; Burch, T.E.; Nagy, K.L. Chemical weathering rate laws and global geochemical cycles. Geochim. Cosmochim. Acta. 1994, 58, 2361–2386. [Google Scholar] [CrossRef]
  38. Malov, A.I. The Conditions for the Formation of Strontium in the Water of Ancient Silicate Deposits Near the Arctic Coast of Russia. Water 2024, 16, 2369. [Google Scholar] [CrossRef]
  39. Wu, Y.; Luo, Z.; Luo, W.; Ma, T.; Wang, Y. Multiple isotope geochemistry and hydrochemical monitoring of karst water in a rapidly urbanized region. J. Contam. Hydrol. 2018, 218, 44–58. [Google Scholar] [CrossRef]
  40. Wang, H.; Jiang, X.W.; Wan, L.; Han, G.; Guo, H. Hydrogeochemical characterization of groundwater flow systems in the discharge area of a river basin. J. Hydrol. 2015, 527, 433–441. [Google Scholar] [CrossRef]
  41. Liu, H.; Song, Y.; Li, Y.C.; Wei, W.; Zhao, G.H.; Wang, X.D.; Huang, J.M. Hydrochemical characteristics and control factors of shallow groundwater in Anqing section of the Yangtze River Basin. Environ. Sci. 2024, 45, 1525–1538. (In Chinese) [Google Scholar]
  42. Ma, R.; Shi, J.; Liu, J.; Gui, C. Combined use of multivariate statistical analysis and hydrochemical analysis for groundwater quality evolution: A case study in north chain plain. J. Earth Sci. 2014, 25, 587–597. [Google Scholar] [CrossRef]
  43. Zhang, W.; Wang, D.W.; Lei, K.; Lv, X.B.; Chen, Y.; Yang, L.B. Hydrochemical characteristics and impact factors in the middle and lower reaches of the Yellow River in the wet season. Res. Soil Water Conserv. 2020, 27, 380–386. (In Chinese) [Google Scholar]
  44. Wang, S.; Chen, J.; Zhang, S.; Zhang, X.; Chen, D.; Zhou, J. Hydrochemical evolution characteristics, controlling factors, and high nitrate hazards of shallow groundwater in a typical agricultural area of Nansi Lake Basin, North China. Environ. Res. 2023, 223, 115430. [Google Scholar] [CrossRef]
  45. Tu, C.L.; Yang, R.B.; Ma, Y.Q.; Linghu, C.W.; Zhao, R.G.; He, C.Z. Characteristics and driving factors of hydrochemical evolution in Tuochangjiang River Basin, Western Guizhou Province. Environ. Sci. 2023, 44, 740–751. (In Chinese) [Google Scholar]
  46. Widory, D.; Kloppmann, W.; Chery, L.; Bonnin, J.; Rochdi, H.; Guinamant, J.L. Nitrate in groundwater: An isotopic multi-tracer approach. J. Contam. Hydrol. 2004, 72, 165–188. [Google Scholar] [CrossRef] [PubMed]
Figure 1. Sampling locations in the study area.
Sustainability 17 06432 g001
Figure 2. Piper diagram of groundwater samples in the study area.
Sustainability 17 06432 g002
Figure 3. Relationships between the main ions in groundwater in the study area: (a) relationship between TDS and cations concentration; (b) relationship between TDS and anions concentration; (c) relationship between [Cl] and [Na+]; (d) relationship between [SO42−] and [Ca2+]; (e) relationship between [HCO3 + SO42−] and [Ca2+ + Mg2+]; (f) relationship between [HCO3] and [Na+].
Sustainability 17 06432 g003
Figure 4. Gibbs diagrams of shallow groundwater in 2020: (a) Relationship between TDS and [Na+]/[Na+ + K+ + Ca2+] and (b) between TDS and [Cl]/[Cl + HCO3].
Sustainability 17 06432 g004
Figure 5. Gaillardet endmember diagram of groundwater chemistry in the study area in 2020: (a) relationship between [Ca2+]/[Na+] and [HCO3]/[Na+] and (b) relationship between [Ca2+]/[Na+] and [Mg2+]/[Na+].
Sustainability 17 06432 g005
Figure 6. The relationship between [(Ca2+ + Mg2+) − (SO42− + HCO3] and [(Na+ − Cl)] (a), and between CAI-1 and CAI-2, (b) in groundwater.
Sustainability 17 06432 g006
Table 1. The method detection limit and permissible drinking limit of each parameter.
ParametersUnitsDetection LimitsChinese Standards [16]
pH--6.5–8.5
TDSmg/L4450
THRDmg/L51000
CODmg/L0.53
K+mg/L0.03-
Na+mg/L0.02200
Ca2+mg/L0.002200
Mg2+mg/L0.02150
Mn2+mg/L0.050.1
NH4+-Nmg/L0.0250.5
Clmg/L0.1250
SO42−mg/L0.1250
HCO3mg/L5-
CO32−mg/L5-
NO3-Nmg/L0.110
Table 2. Hydrochemical characteristics of shallow groundwater in the study area in 2020.
DistrictspHTHRDTDSNa+Mn2+SO42−ClNO3-NCODNH4+-N
-mg/Lmg/Lmg/Lmg/Lmg/Lmg/Lmg/Lmg/Lmg/L
Dognchangfu7.6059813922320.3022324312.01.800.18
Yanggu7.5973217762330.263553298.981.770.17
Shen County7.5166214101920.2125024116.91.510.10
Chiping7.5879515381820.363063119.292.620.13
Donge7.5742177070.90.1613895.24.221.620.37
Guan County7.6489822932910.2941046714.61.890.26
Gaotang7.6592222713110.425195155.602.000.26
Linqing7.6989920582370.284764015.511.550.18
Table 3. Hydrochemical characteristics of shallow groundwater in the study area in 2021.
DistrictspHTHRDTDSNa+Mn2+SO42−Cl−NO3-NCODNH4+-N
-mg/Lmg/Lmg/Lmg/Lmg/Lmg/Lmg/Lmg/Lmg/L
Dognchangfu7.9051712061930.581081610.331.550.43
Yanggu7.5770914501750.402571458.182.130.24
Shen County7.6561710821050.2859.01670.231.140.08
Chiping7.6980520903990.313863394.611.650.05
Donge7.605289571230.7194.048.60.261.160.14
Guan County7.2577015702500.262741501.531.980.30
Gaotang7.50118022502500.963465020.151.400.08
Linqing7.2774514801980.511922030.141.490.24
Table 4. Hydrochemical characteristics of shallow groundwater in the study area in 2022.
DistrictspHTHRDTDSNa+Mn2+SO42−ClNO3CODNH4+-N
-mg/Lmg/Lmg/Lmg/Lmg/Lmg/Lmg/Lmg/Lmg/L
Dognchangfu7.4254112692060.301551981.461.140.27
Yanggu7.5282021673920.1245148210.21.390.06
Shen County7.3764512391130.3993.92433.270.770.11
Chiping7.3187326505460.296125925.031.170.02
Donge7.174639321340.5097.538.51.311.020.05
Guan County7.1172016052550.193132030.940.800.24
Gaotang7.02113021502310.713555051.670.760.02
Linqing7.5266613381880.211981900.731.210.09
Table 5. Descriptive statistics of the chemical compositions of groundwater.
ParametersUnits202020212022
MinMaxMeanMinMaxMeanMinMaxMean
pH7.208.107.607.007.907.556.747.837.30
TDSmg/L214683616897913010151181750501689
THRDmg/L125236374145011807344571290732
CODmg/L0.817.261.850.753.041.550.142.171.07
Na+mg/L19.290121564.669021281.81210214
Clmg/L31.3165431846.854620938.513903089
SO42−mg/L20.8192133020.663320557.61420302
Table 6. Assessment results of shallow groundwater in the study area from 2020 to 2022.
YearItemsEWQI
pHTHRDTDSSO42−ClMn2+CODNH4+-N
2020IIVIVIVIVIVIIIIIIII
2021IIVIVIIIIIIIVIIIVIII
2022IIVIVIVIVIVIIIIIIII
Table 7. APCS values of hydrochemical parameters in shallow groundwater.
ItemsAPCS1APCS2
TDS0.990.12
Na+0.930.23
K+0.065−0.51
Ca2+0.83−0.19
Mg2+0.930.15
SO42−0.97−0.16
Cl0.990.022
NO30.0170.89
HCO30.730.66
Table 8. Correlation coefficient matrix of hydrochemical parameters in shallow groundwater.
pHTHRDTDSNa+K+Ca2+Mg2+SO42−NO3ClHCO3
pH1
THRD0.701
TDS0.510.91 **1
Na+0.610.81 *0.88 **1
K+0.170.460.490.471
Ca2+0.230.670.620.410.83 *1
Mg2+0.690.91 **0.88 **0.76 *0.250.411
SO42−0.700.98 **0.93 **0.88 **0.480.640.88 **1
NO3−0.67−0.0950.0950.0480.180.048−0.071−0.121
Cl0.690.93 **0.95 **0.93 **0.590.620.88 **0.95 **−0.0481
HCO30.230.410.550.71 *0.036−0.170.570.430.430.551
Note: ** Correlation is significant at the 0.01 level (2-tailed); * correlation is significant at the 0.05 level (2-tailed).
Table 9. CAI and γ values of shallow groundwater in each county of the study area.
DistrictsγCAI-1CAI-2
Dognchangfu−2.11−0.48−0.18
Yanggu0.22−0.11−0.051
Shen County0.34−0.24−0.088
Chiping−0.120.0880.043
Donge0.17−0.16−0.039
Guan County−0.160.0360.019
Gaotang−0.150.0510.032
Linqing−0.240.0840.041
Table 10. The relationship between ions of shallow groundwater in each county of the study area.
DistrictsNO3/ClClSO42−/Ca2+NO3/Ca2+
Dognchangfu0.0492431.390.075
Yanggu0.0273291.260.032
Shen County0.0702410.910.062
Chiping0.0303111.040.032
Donge0.04495.20.850.026
Guan County0.0314671.470.052
Gaotang0.0115151.490.016
Linqing0.0144011.750.020
Disclaimer/Publisher’s Note: The statements, opinions and data contained in all publications are solely those of the individual author(s) and contributor(s) and not of MDPI and/or the editor(s). MDPI and/or the editor(s) disclaim responsibility for any injury to people or property resulting from any ideas, methods, instructions or products referred to in the content.

