Article

Addressing the Sustainability Challenges: Digital Economy Information Security Risk Assessment

School of Public Administration, Xiangtan University, Xiangtan 411105, China
*
Author to whom correspondence should be addressed.
Sustainability 2025, 17(14), 6428; https://doi.org/10.3390/su17146428
Submission received: 8 June 2025 / Revised: 5 July 2025 / Accepted: 12 July 2025 / Published: 14 July 2025

Abstract

In the digital economy, sustainable development is based on digital technologies. However, information security issues arising from its use pose significant challenges to sustainable development. Assessing information security risks in the digital economy is crucial for sustainable development. This paper constructs an information security risk assessment indicator system for the digital economy based on information ecology theory. Using game theory to combine CRITIC weights and entropy weights, the information security risk values for the digital economy in 29 provinces of China from 2019 to 2021 are calculated. Quantitative analysis is conducted using Ward’s method and the obstacle degree model. The combined weighting results indicate that the information security risks of the digital economy are mostly influenced by information infrastructure. Additionally, the spatio–temporal evolution pattern shows that the risk values of provinces vary to different degrees over time, with a distribution pattern of southern regions > northern regions > northwestern regions. Furthermore, the clustering results indicate that information technology is the primary cause of risk gaps. Finally, the obstacle degree model indicates that digital criminal behavior is the greatest obstacle to information security in the digital economy. The research findings hold significant implications for addressing information security challenges in the global digital economy’s sustainable development process, particularly in terms of the replicability of the research methodology and the valuable case study of China.

1. Introduction

The digital economy is a key driving force behind economic restructuring and promoting high–quality, sustainable economic development. It is reshaping the global economic landscape. The digital economy plays a vital role in fostering technological innovation [1] and mitigating environmental pollution [2] and is a significant force for achieving the United Nations Sustainable Development Goals (SDGs). The China Academy of Information and Communications Technology’s “2023 Global Digital Economy White Paper” states that the combined GDP of 51 nations’ digital economies in 2022 was USD 41.4 trillion, or 46.1% of their total GDP. This implies that the digital economy is now a vital pillar of economic growth in nations all over the world.
However, with the deep integration of data elements into the social economy, the digital economy faces numerous threats. Information is a vital component of the digital economy, and information security in the digital economy has become a serious challenge facing the world [3]. According to the international standard ISO/IEC 27002, information security is the protection of protected information against accidental destruction, loss, alteration, disclosure, or unauthorized access during transmission, storage, and processing [4]. Common information security issues in the digital economy are privacy breaches and infrastructure damage. For example, on 4 October 2021, Facebook experienced a DNS server outage that disrupted services across multiple platforms for six hours. Experts estimated the global economic loss caused by the outage to be as high as USD 160 million [5]. The sustainable operation of information and communications infrastructure in the digital economy affects the sustainability of national security [6]. Therefore, the governance of digital economy information security is critical for advancing sustainable development. To strike a balance between development and security, the Central Committee of the Communist Party of China and the State Council proposed in their February 2023 “Overall Plan for the Construction of a Digital China” that establishing trustworthy and controllable digital security safeguards is critical for strengthening core digital capabilities. Nearly 100 nations and territories have passed legislation protecting digital economic security to date; the EU’s General Data Protection Regulation is one such example.
Information security risks are the root cause of information security issues and a major obstacle to sustainable development. Advancing sustainable development goals critically depends on monitoring and evaluation [7]. Information security risk assessment is a method of describing information security risks that can intuitively reflect the risk status and existing problems of the assessment object. How can information security risks in the digital economy be assessed to better address the challenges of sustainable development in the digital economy? According to the Global Digital Economy 2023 White Paper, China’s digital economy is the second largest in the world, and it is an important participant and driver of the global digital economy. At the same time, China is also an important force in promoting global sustainable development; for example, China strives to achieve peak carbon by 2030. Therefore, assessing the information security risk of China’s digital economy is of profound significance for the sustainable development of the global digital economy. In light of this, the objective of this study is to calculate the level of information security risks in China’s digital economy, reveal its characteristics, propose specific governance pathways for information security issues in the digital economy, and formulate sustainable development strategies.
The following three categories best describe this paper’s contributions. First, our research introduces information ecology theory into the construction of a digital economy information security risk indicator system, integrating information security risks across four dimensions: information personnel, information, information technology, and information environment. This provides an information ecology perspective for current digital economy information security research, which lacks theoretical foundations and systematic thinking. Second, this paper uses game theory combination weighting methods to calculate the weights of each evaluation indicator, a method that can find a reasonable balance among multiple weights. This provides an effective method for combining multiple weights in information security risk analysis. Finally, we conducted an in-depth analysis of the information security risk status of the digital economy from three aspects: spatio–temporal evolution patterns, cluster analysis, and obstacle degree analysis. This offers new insights and targeted recommendations for addressing the sustainable development challenges currently facing the digital economy.

2. Literature Review

2.1. Information Security Issues in the Digital Economy and Sustainable Development

The goal of sustainable development is to satisfy current demands while protecting the ability of future generations to satisfy their own [8]. Achieving sustainable development requires striking a balance between the economic, social, and environmental facets, according to the UN’s 2030 Agenda for Sustainable Development [9]. Digital technology is a key enabler of the sustainable development of the digital economy. It primarily contributes to a more sustainable and equitable world through seven key areas: renewable energy and sustainable technologies, data analytics, consumer empowerment and value co-creation, sustainable urbanization, sustainable consumption, responsible business models, and policy interventions [10]. Information processing, transmission, and storage are essential to the usage of digital technology. As a result, the sustainable growth of the digital economy is seriously threatened by information security concerns. The following section will focus on the impact of information security issues on the sustainable growth of the digital economy, taking into account information availability, confidentiality, and integrity.
The leakage of consumers’ personal information can lead to trust deficit issues, which in turn can weaken their willingness to engage in sustainable practices in the digital economy [10]. Inaccurate or unreliable information can lead to mistakes in sustainable development decision-making, such as inaccurate monitoring and tracking of a company’s environmental impact [10,11]. Attacks such as denial-of-service (DDoS) interrupt the delivery of digital economy services by disrupting information availability, which not only undermines trust but also increases e-waste, which is not conducive to sustainable development [12]. Therefore, existing research has recognized that addressing information security issues in the digital economy is beneficial for sustainable development; however, it has not specifically addressed how to address these issues.

2.2. Information Security Risks in the Digital Economy

An effective approach to addressing information security issues is to identify existing risks. Information security risk refers to the likelihood of specific threats exploiting asset vulnerabilities and the resulting damage [13]. Assets in the digital economy are primarily presented in the form of data [14], so information security risks mainly target data vulnerabilities and damage. Existing research on cybersecurity risks in the digital economy is primarily theoretical and can be summarized as follows. In the face of complex and changing data information resources, unreliable non–cash payment security systems, irregular information, and digital space legal frameworks, as well as incomplete commercial information confidentiality legal systems, all pose risks to information security [15]. The information infrastructure carries a large amount of essential data, and its destruction threatens information security, affecting the sustainable development of the digital economy [16]. Information security vulnerabilities can compromise the diversity, integrity, and confidentiality of user information, as well as the integrity of technical information, thereby increasing information security risks in the digital economy [17]. Cross–border data flows require clarification of data sovereignty. Ambiguity in data jurisdiction and governance rights, as well as asymmetrical data governance capabilities, will pose threats to information security [18].
In general, first, current research has identified digital economy information security risks from specific perspectives, but there has been little attention paid to constructing a digital economy information risk factor indicator system from a holistic and systematic perspective. Second, existing research remains at the theoretical analysis level and has not conducted in–depth research on issues such as critical information security risks, spatio–temporal evolution patterns, and obstacles to information security. Therefore, it has not been able to put forward targeted sustainable development recommendations.

2.3. Information Security Risk Analysis

Information security risks are formed by the intertwining of various complex factors in the system. The right models and technical measurements must be used in order to evaluate the risks and meet risk management goals. Risk identification, risk analysis, and risk evaluation are the three main parts of information security risk assessment. Among them, risk analysis can be divided into qualitative risk analysis, quantitative risk analysis, and semi-quantitative analysis [13]. Quantitative analysis methods can provide more objective and accurate analysis results and are commonly used risk analysis methods. The key to quantifying risk lies in reasonably weighing risk evaluation indicators. Common subjective weighting methods include AHP [19], DEMATEL [20], etc. Objective weighting methods include the CRITIC method [21], the entropy weight method [22], the coefficient of variation method [23], etc. Objective weighting is a method of assigning weights based on the patterns of the data itself, which can effectively avoid the interference of subjectivity in the results. Combining weights obtained from different methods can yield more reasonable results. However, previous studies have primarily used the multiplication synthesis method [21,22], which is relatively simple but prone to significant deviations when weight distributions are uneven.
Based on existing research, this paper constructs an information security risk assessment index system for the digital economy based on information ecology theory, and assesses information security risks in the digital economy from a relatively systematic and comprehensive perspective. At the same time, the CRITIC–entropy weight–game theory method (CRITIC–EWM–GT) is used to calculate the information security risk value of the digital economy. Subsequently, Ward’s method and the obstacle degree model are used to analyze the risk situation. This provides a reference basis for better responding to the challenges of sustainable development in the digital economy.

3. Theoretical Analysis and Research Methods

3.1. Theoretical Analysis

The governance of digital economy information security issues cannot be approached solely from a technical perspective, as people drive the development of the digital economy. At the same time, digital economy information security risks are composed of multiple factors, including digital system, information infrastructure, and information security vulnerabilities, forming a complex system. Therefore, digital economy information security risks must be identified from a systemic perspective. Information ecology theory provides a highly applicable framework for analyzing information security issues [24].
Information ecology was first proposed in the 1960s. It is a set of theories that reflect the connection between ecological thinking and the digital-information environment [25]. Nardi and O’Day believe that information ecosystems are complex systems composed of people, work, values, and technology in specific environments [26]. Many scholars believe that information personnel, information, information technology, and information environment are the four basic elements that constitute an information ecosystem [27,28]. In information ecology theory, the information personnel is the main subject that leads the entire process of information activities; the information is an object that is not subject to human will; the information technology is the medium for information transmission; the information environment is the field where the subject and object interact [28].
In the context of the digital economy, information professionals are the main actors in digital economic activities such as digital products and digital services. Information refers to all information that exists in digital economic activities, including data, information products, etc. Information technology refers to technologies that support the development of the digital economy, such as information and communication technology and big data analysis technology. The information environment includes the internal environment, such as the digital economy system and the rule of law, and the external environment, such as the digital economy’s social and cultural environment. These elements interact with each other through information flows, collectively forming an information ecosystem. Therefore, based on information ecology theory, this study uses information personnel, information, information technology, and the information environment as primary indicators.
Based on a thorough review of relevant research, the primary indicators are scientifically refined to produce 12 secondary indicators:
From an information personnel perspective, information security awareness and digital criminal behavior can pose information security risks to the digital economy. A lack of information security awareness is detrimental to establishing proper security procedures and principles, thereby leading to information security risks related to users [29]. Digital crimes threaten information security through online fraud, malware attacks, and other means. Their digital objects are mainly manifested in areas such as digital financial assets [30].
From an information perspective, false information, the scale of data resources, and information security services pose information security risks to the digital economy. False information is information that is intentionally misleading and intended to cause harm [31]. Malicious brushing and other behaviors in digital economic activities generate false information that disrupts market order and poses information security risks. The expansion of data resources has brought about difficulties in data management and storage, making it easier for information security risks such as unauthorized access, data leakage, and privacy breaches to occur [32].
From an information technology perspective, information infrastructure, digital innovation capabilities, and security protection capabilities pose information security risks to the digital economy. Information infrastructure is the foundation for the development of the digital economy. However, as information infrastructure becomes increasingly sophisticated, it also expands the attack surface and exacerbates information security risks [33]. The development of the digital economy has intensified technological dependence. A lack of independent innovation capabilities often makes it easier to fall victim to cyberattacks, thereby increasing information security risks [34]. Security protection capabilities include application hardening, vulnerability detection, etc. The higher the security protection capabilities, the more helpful it is in discovering and fixing potential information security issues [35,36]. Information security services are information activities that protect information security, including patch management, software management, risk management, etc. [37]. The more developed the information security services are, the stronger the information security protection capabilities are, and the lower the information security risks are.
From an information environment perspective, the social credit system, digital economy system, digital rule of law, and level of information dissemination all influence the information security risks of the digital economy. To achieve information security in the digital economy, it is necessary to start from the macro level and strengthen top–level design to guide the development of the digital economy [38]. The social credit system helps build a safer digital economy credit environment by improving financial credit ratings, strengthening market supervision, and optimizing social governance [39,40]. Digital economy system can effectively enhance the ability to detect information security risks by establishing cybersecurity safeguards [41]. Digital rule of law can effectively prevent risks such as data leakage, tampering, and destruction. A higher level of digital rule of law helps build a sound digital ecosystem, create a safer digital economic information environment, and reduce the occurrence of information security incidents [42]. Information security awareness campaigns primarily influence information security risks by impacting individuals’ awareness of information security [43]. In other words, high–level information security awareness campaigns can enhance personal information security awareness, thereby reducing information security risks in the digital economy.
Based on the quantitative indicators selected by referring to Refs. [44,45,46], and in accordance with the principles of data availability and quantifiability, this study develops 18 quantitative indicators and establishes a digital economy information security risk assessment indicator system. The indicator framework is shown in Figure 1, and Table 1 presents the data sources and attributes of the indicators.

3.2. Research Methods

Based on the principles of data completeness and accessibility, this study selects panel data from 29 provinces in China from 2019 to 2021 to assess the information security risks of the digital economy.

3.2.1. Min–Max Normalization

Since the units of the quantitative indicators in this paper are different, it is necessary to process the original data to eliminate the influence of different units of measurement on the analysis results. This paper uses the min–max normalization method to perform a linear transformation on the data, mapping the original data to the interval [0, 1].
Positive indicators:
y i j = x i j min ( x i j ) max ( x i j ) min ( x i j )
Negative indicators:
y i j = max ( x i j ) x i j max ( x i j ) min ( x i j )
where xij represents the actual value of the jth indicator in the ith object, yij represents the result of the data processing, i = 1, …, m, j = 1, …, n.

3.2.2. CRITIC–EMW–GT Weighting

This paper employs a method that combines the CRITIC method and the entropy weight method to calculate the weights of indicators, allowing for a more objective and accurate reflection of these weights. The reason for this is that the entropy weight method can assess the degree of dispersion between indicators, whereas the CRITIC approach can evaluate the intensity of comparison and the degree of conflict between indicators [47].
Calculate the information content Cj of the jth indicator using the CRITIC method:
y ¯ j = 1 m i = 1 m y i j
S j = i = 1 m ( y i j y ¯ j ) 2 m 1
C j = S j k = 1 m 1 r k j
where Sj is the standard deviation of the jth indicator, and rkj is the correlation coefficient between the kth indicator and the jth indicator. The standard deviation reflects the strength of comparison between indicators, while the correlation coefficient reflects the degree of conflict between indicators.
The weight w1j of the jth indicator obtained by the CRITIC method:
w 1 j = C j j = 1 n C j
  • The entropy weight method’s primary concept is to measure the amount of information entropy in order to determine the degree of dispersion of indicators. The degree of dispersion of the indicators and the influence on the evaluation outcomes increase with decreasing information entropy [48].
Weight pij of the jth indicator:
p ij = y i j i = 1 m y i j
Information entropy ej of the jth indicator:
e j = 1 ln m i = 1 m p i j ln p i j
The weight w2j of the jth indicator obtained by the entropy weight method:
w 2 j = 1 e j j = 1 n ( 1 e j )
  • Following Refs. [49,50], this paper uses the game theory combination weighting method to determine the weighting coefficients. The game theory weighting method can minimize the sum of the deviations between the combined weights and the individual weights.
The vector w of the combination weights can be expressed as
w = α 1 w 1 T + α 2 w 2 T
where α1 is the CRITIC method coefficient, and α2 is the entropy weight method coefficient, w1 = w11, w12, …, w1n, w2 = w21, w22, …, w2n.
The objective function that minimizes the deviation between w and w1 and w2 is
min w w p T ,   p = 1 , 2
Based on the properties of matrix differentiation, the equivalent system of linear equations of the above equation can be expressed as
w 1 w 1 T w 2 w 1 T w 1 w 2 T w 2 w 2 T α 1 α 2 = w 1 w 1 T w 2 w 2 T
Considering that weight coefficients may be negative, take the absolute value of the weight coefficients and perform normalization:
α 1 * = α 1 α 1 + α 2 α 2 * = α 2 α 1 + α 2
where α1* is the normalized CRITIC method coefficient, and α2* is the normalized entropy weight method coefficient.
Finally, the combination weight Wj of the jth indicator can be obtained:
W j = α 1 * w 1 j + α 2 * w 2 j
  • The risk rating value Ri of the ith research subject is
R i = j = 1 n W j y i j

3.2.3. Ward’s Method

The Ward’s method is a hierarchical clustering algorithm. This method first treats all samples as separate categories, then merges categories to form new ones, combining the two categories with the smallest sum of squared deviations until all samples are grouped into a single category [51]. The Ward’s method can minimize intra-class differences while maximizing inter-class differences, and has strong clustering capabilities. If categories a and b are merged, the increase in the sum of squared deviations L(a,b) is
L ( a , b ) = n a n b n a + n b c a c b 2
where na is the number of samples in category a, and nb is the number of samples in category b, ca is the center point of category a, and cb is the center point of category b.

3.2.4. Obstacle Degree Model

The obstacle degree model measures the degree of obstacles to the development of indicators based on the contribution of factors and the deviation of indicators [52]. In this paper, factor contribution is represented by indicator weights, and indicator deviation is replaced by normalized sample data.
The obstacle degree Oij of the jth indicator of the ith object:
O i j = W j × y i j j = 1 n W j × y i j × 100 %

4. Results and Discussion

4.1. CRITIC–EWM–GT Weight

The weighting of indicators for digital economy information security risk assessment is shown in Table 2.
The data in the table shows that the combined weight of internet bandwidth access port density (C13) is the highest, at 0.1658. In the digital economy, the density of internet bandwidth access ports has the biggest influence on the degree of information security concerns. Furthermore, the density of optical cable connections and mobile phone base stations can have a big impact on how risky information security is in the digital economy.
Therefore, the information security risk of the digital economy is most significantly influenced by the scale of information infrastructure. This may be because digital infrastructure serves as the foundational architecture of the digital economy, and its security status dictates the evolution of risks [53]. The digital economy cannot flourish without the construction of information infrastructure; yet, in order to encourage long-term growth, it is critical to continuously monitor the information security risks associated with such expansion.

4.2. Spatio–Temporal Pattern Evolution of Information Security Risks in the Digital Economy

4.2.1. Time Evolution Pattern Analysis

According to Table 3, the digital economy information security risk values and risk rankings of various provinces have undergone significant changes over time. Figure 2 provides a more intuitive illustration of this change. Between 2019 and 2021, there were certain differences in the digital economy information security risk values among different provinces. Shanghai has always been the province with the highest risk of digital economy information security, while Xinjiang has the lowest overall risk. The digital economy information security risk values in Hebei, Shanghai, Zhejiang, Fujian, Shandong, Guangxi, and Guizhou have been increasing year by year, while those in Shanxi, Inner Mongolia, Liaoning, Jiangsu, Jiangxi, Hunan, and Sichuan have been decreasing year by year.
To further analyze the reasons for the year-on-year increase and decrease in risk values, we selected the three provinces with the largest increases (Shanghai, Zhejiang, and Guizhou) and the three provinces with the largest decreases (Jiangsu, Jiangxi, and Hunan) for analysis. As shown in Figure 3, the primary reason for the increase in Shanghai’s risk value is the information dimension, specifically the increase in the scale of data resources, which corresponds to the full completion of Shanghai’s “big data resource platform”. The primary reason for the increase in Zhejiang’s risk value is also the information dimension, specifically the significant increase in the scale of digital resources, which corresponds to the completion of several “data highways” in Zhejiang Province. The primary reason for the increase in Guizhou’s risk value is the information personnel dimension, specifically the increase in digital criminal activities, which corresponds to the sharp rise in the growth rate of telecommunications network fraud cases in Guizhou.
As shown in Figure 4, the decrease in Jiangsu’s risk value is mainly due to the information dimension and the information environment dimension. Specifically, this is attributed to the reduction in the scale of false information and data resources, as well as the decrease in all secondary indicators under the information environment dimension. The decrease in Jiangxi’s risk value is mainly due to the information personnel dimension, specifically the improvement in information security awareness, which corresponds to Jiangsu’s ongoing cybersecurity publicity campaigns and educational efforts. The decrease in Hunan’s risk value is also mainly due to the information personnel dimension, specifically the improvement in information security awareness and the reduction in digital criminal activities, which corresponds to Hunan’s public security authorities’ stringent crackdown on telecommunications network fraud and other criminal activities. Although the risk reduction in these three provinces is significant, the overall level of digital economy development is still increasing [54], effectively balancing the development and security of the digital economy.

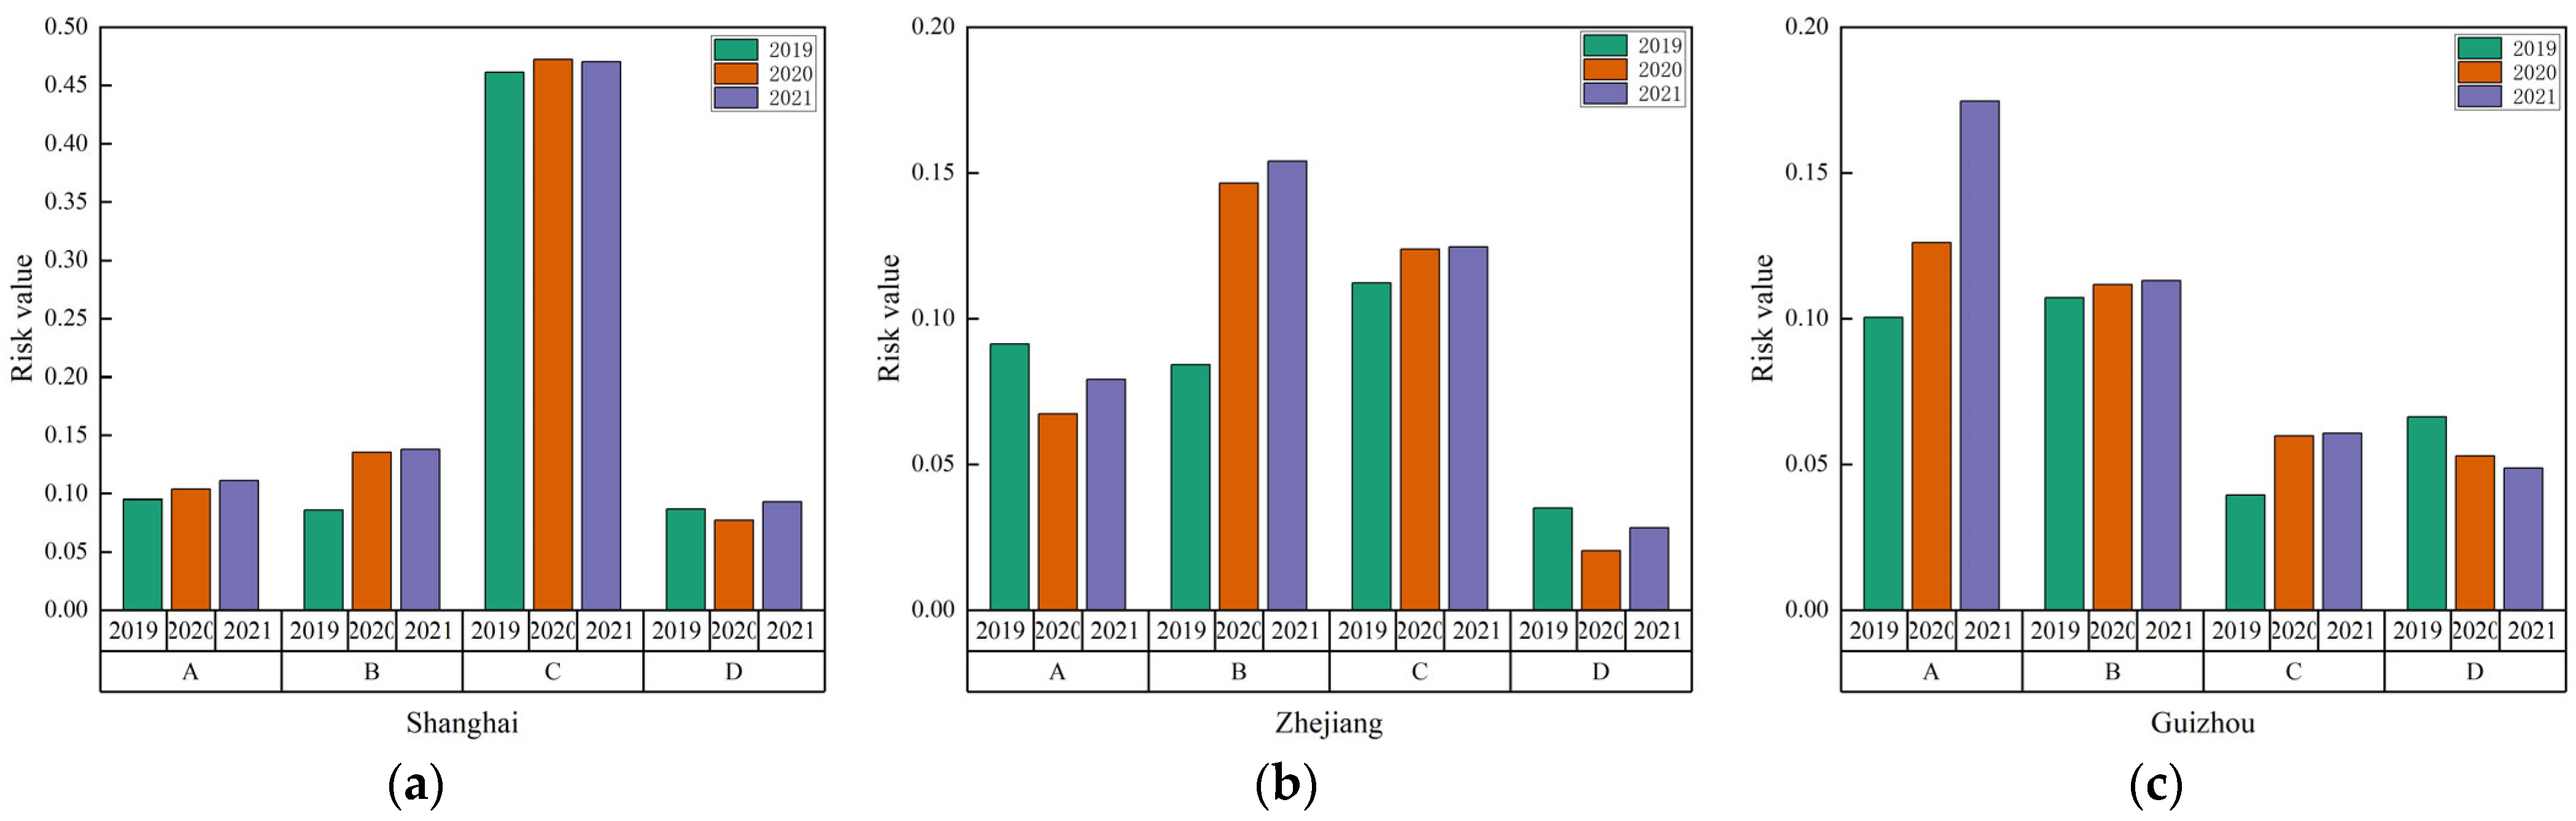
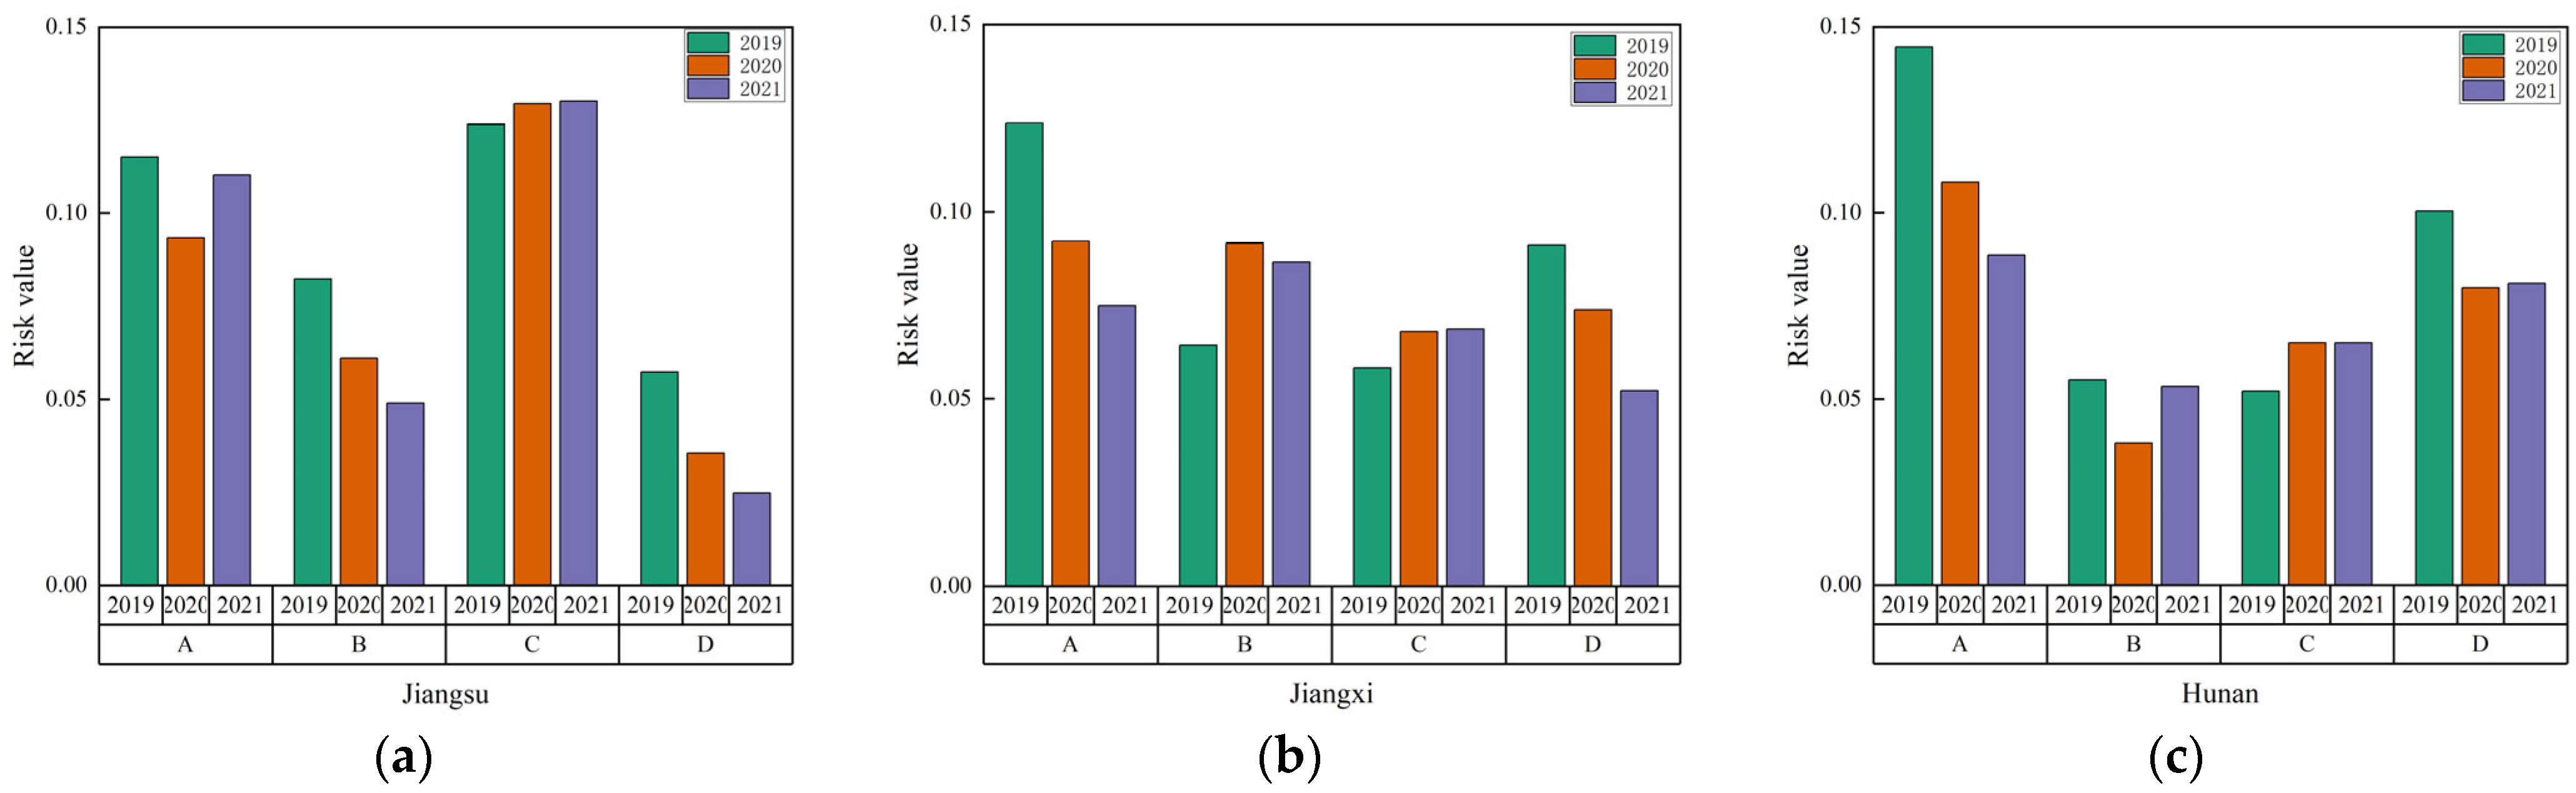
4.2.2. Spatial Evolution Pattern Analysis

Replace actual risk with relative risk and use the natural breakpoint method in ArcGIS 10.8.1 software to classify risk values into five categories: very high, high, medium, low, and very low. Figure 5 intuitively shows the spatial variation in China’s digital economy information security risk levels. Overall, the risk values are distributed in the following order: southern region > northern region > northwestern region. This distribution pattern is similar to Ref. [55], where the level of digital economic development in the southern areas is higher than that in northern regions. Therefore, a high level of digital economy development is likely to be accompanied by high information security risk levels, necessitating a focused approach to preventing security issues. The vast majority of provinces are at medium or low risk levels, with high risk levels mainly concentrated in the eastern coastal regions. The risk gap between provinces in 2020 was smaller than in the other two years, possibly due to the COVID-19 pandemic driving digital transformation in the different areas [56].

4.3. Classification of Provinces

To analyze the causes of the differences in risk levels across provinces, the average risk values over three years for each province are clustered. IBM SPSS Statistics 26 software is used to perform ward clustering, and Figure 6 displays the clustering results. Based on the clustering results, all provinces are divided into three categories. The overall risk averages and the risk averages of the four primary indicators are calculated for each of the three categories, with the results presented in Table 4. First, there are significant differences in the overall risk averages across different categories. The risk differences in the information personnel dimension across the three categories are not significant, indicating that information personnel is not the primary cause of the disparities. The information technology dimension is the key factor contributing to the differences in digital economy information security risk values, with the mean value for Category III being significantly higher than that of the other two categories. Category I is information-personnel-information-environment-dominated risk type, Category II is information-personnel-information-technology-dominated risk type, and Category III is information-information-technology-dominated risk type.
This finding expands the insights of Ref. [10], indicating that disparities in information technology not only lead to the digital divide and uneven development but also result in disparities in digital economy information security risks. Additionally, provinces should implement targeted preventive measures based on their specific risk characteristics to ensure the sustainable development of the digital economy.

4.4. Barriers to Digital Economy Information Security Risks

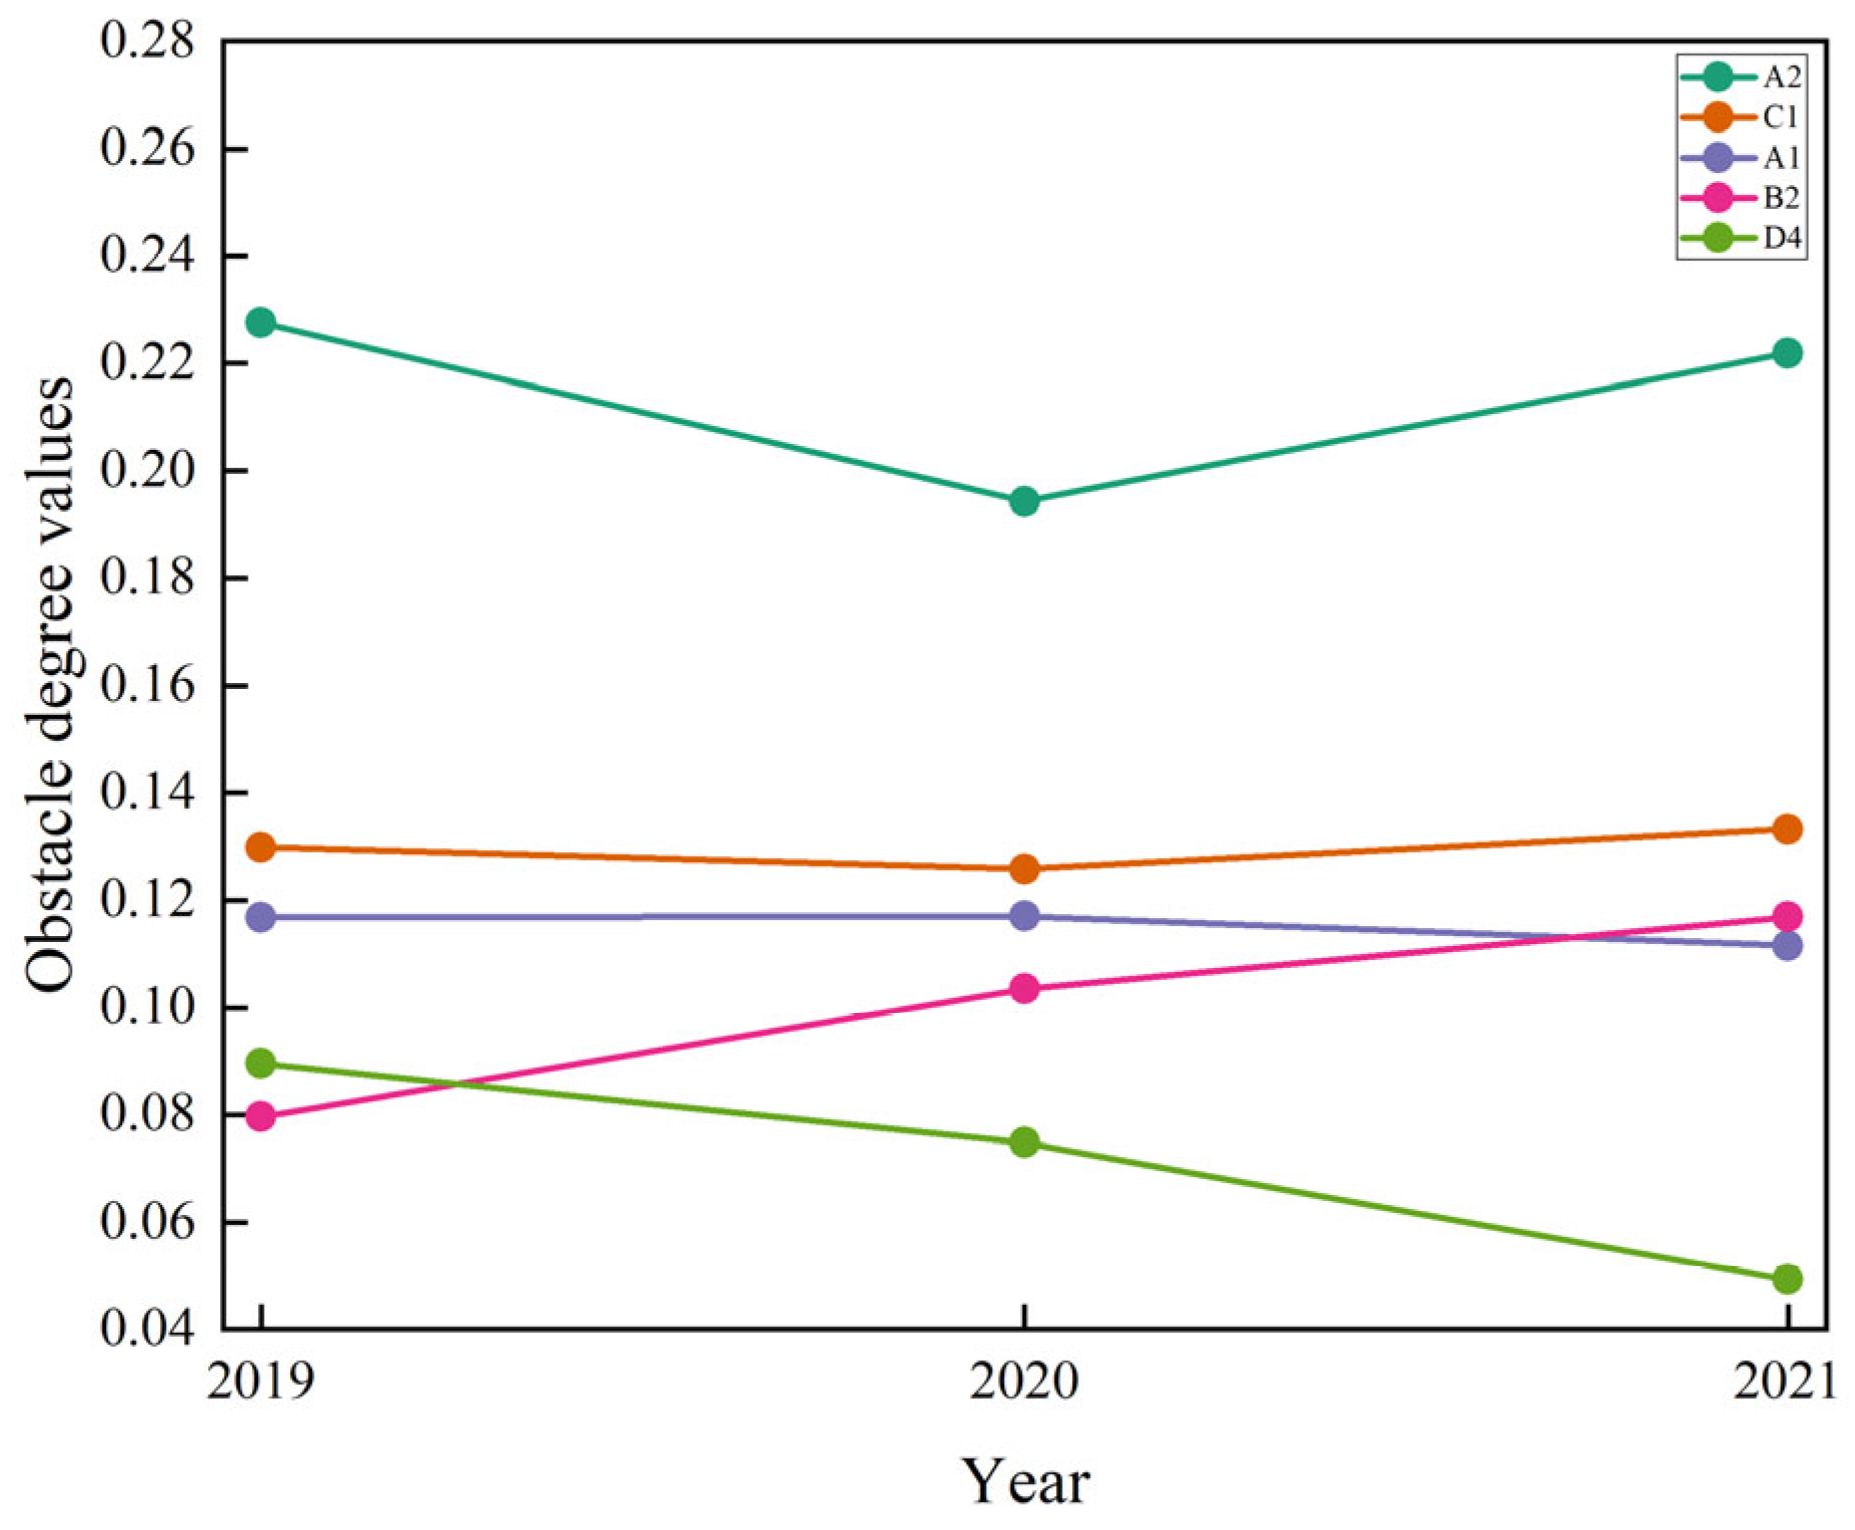
4.4.1. Overall Obstacle Factors

Calculate the average value of the obstacle scores for all secondary indicators. The top five secondary indicators with the highest scores are identified as the key obstacles constraining the digital economy’s information security. The results are shown in Table 5. The average obstacle scores for secondary indicators, from highest to lowest, are as follows: Digital criminal behavior (A2) > Information infrastructure (C1) > Information security awareness (A1) > Data resource scale (B2) > Information security promotion level (D4). Therefore, digital criminal behavior is the largest obstacle to the security of information in the digital economy. This is primarily due to the neglect of data protection, which leads to privacy breaches, and privacy breaches further exacerbate digital criminal behavior [3].
The obstacle score for information security awareness in Figure 7 has been declining year by year, which corresponds to the increasing importance China attaches to information security education and awareness. The degree of obstacles to data resource scales has increased year by year, corresponding to the continuous advancement of China’s data opening process. The increase in the scale of open data has brought more information security risks. The degree of obstacles to digital crime and information security awareness has fluctuated downward, while the degree of obstacles to information infrastructure has fluctuated upward. In future digital economy information security management, it is necessary to closely monitor the information security risks posed by digital crimes, while also paying attention to the growing threats to digital economy information security posed by information infrastructure and the scale of data resources, to ensure the sustainable development of the digital economy.

4.4.2. Obstacle Factors in Each Province

The security barriers to the digital economy vary by province, as shown in Table 6. Information Infrastructure (C1) is the top barrier factor for Beijing, Tianjin, Shanghai, and Jiangsu, where the density of information infrastructure as an asset is higher, thereby increasing the potential attack surface. Digital Criminal Behavior (A2) is the primary obstacle factor for Hebei, Shanxi, Inner Mongolia, Liaoning, Jilin, Anhui, Jiangxi, Henan, Hubei, Hunan, Guangxi, Hainan, Chongqing, Sichuan, Yunnan, Shaanxi, Gansu, Ningxia, and Xinjiang, and the encounter rate of digital criminal behavior is relatively high in these provinces, which is the primary factor that brings about information security risk. Information security awareness (A1) is the top obstacle factor for Heilongjiang, which indicates that the citizens of Heilongjiang have low information security awareness, and information security literacy needs to be further improved. Digital resource scale (B2) is the top obstacle factor for Zhejiang, Fujian, Shandong, Guangdong, and Guizhou, and the scale of open data resources in these provinces is large. Therefore, provinces need to carry out targeted risk management and prevention based on their own shortcomings to guarantee the security and sustainable development of the digital economy.

5. Conclusions and Policy Implications

This study establishes a systematic digital economy information security risk assessment indicator system based on information ecology theory. It conducts a quantitative analysis of the digital economy information security risk status of provinces across China from three aspects: spatio–temporal evolution, risk clustering, and risk barrier degree. The research conclusions are as follows: (1) The results of the combined weighting indicate that the quantitative indicators of information infrastructure have the highest weight, indicating that they have the greatest impact on the information security risks of the digital economy. (2) The spatio–temporal evolution pattern shows that the risk values and rankings of the provinces vary to different degrees over time, which mainly depends on the provinces’ own policy measures and practices. The risk level decreases in the order of the southern region, the northern region, and the northwestern region. (3) The clustering results indicate that the largest differences in information technology scores exist between different types of provinces, with information technology being the primary cause of risk disparities. (4) The results of the obstacle analysis indicate that digital criminal activities pose the greatest obstacle to information security in the digital economy. The obstacles posed by the scale of data resources and information infrastructure to information security are on the rise, and the primary obstacle factors vary across provinces.
The following policy implications are proposed: (1) Given that information infrastructure has the greatest impact on the level of information security risks in the digital economy, the government should conduct focused monitoring of its security status during the construction of information infrastructure, assess potential security risks, and improve emergency response mechanisms to address the challenges posed by the sustainable development of the digital economy. (2) Given that information technology is the primary cause of regional risk disparities, governments should guard against the uncertain security risks posed by high levels of digitization, while narrowing the digital divide between regions and promoting a more equitable and sustainable digital economy. (3) Given that digital crimes are the biggest obstacle to information security in the digital economy, the government should focus on combating digital crimes, improving law enforcement capabilities, and strengthening law enforcement to better coordinate the development and security of the digital economy. (4) Given the differences in risk levels and primary obstacles among provinces, the government should adopt a tailored approach and carry out targeted governance work based on the actual risk situation in each province.
This study holds significant implications for addressing the challenges of sustainable development in the digital economy; however, it also has certain limitations. First, due to limitations in data acquisition, the time range of the panel data is relatively short and a little old. In the future, as more relevant research data becomes available, the time range of the study can be expanded to conduct more accurate research. It is also possible to assess and compare the risk of information security in the digital economy in different countries and regions, so as to better promote international cooperation and contribute to sustainable development. Second, the study does not consider the impact of time on key barrier factors. In the future, time attenuation factors can be introduced into the barrier degree model to better align with the dynamic characteristics of the digital economy. Meanwhile, this study focuses on the assessment of historical data, and in the future, research can be conducted on the prediction of information security risks in the digital economy to provide forward-looking recommendations for sustainable development. In addition, this study assesses the information security of the digital economy from the perspective of risk, and in the future, it can be analyzed from the perspective of policy tools to provide a more complete, sustainable path.

Author Contributions

Conceptualization, Z.Z.; methodology, F.L. and Z.Z.; software, F.L.; validation, F.L. and Z.Z.; formal analysis, F.L.; investigation, F.L.; resources, Z.Z.; data curation, F.L.; writing—original draft preparation, F.L.; writing—review and editing, F.L. and Z.Z.; visualization, F.L.; supervision, Z.Z.; project administration, Z.Z. All authors have read and agreed to the published version of the manuscript.

Funding

This research received no external funding.

Institutional Review Board Statement

Not applicable.

Informed Consent Statement

Not applicable.

Data Availability Statement

The data presented in this study is available on request from the corresponding author.

Conflicts of Interest

The authors declare no conflicts of interest.

References

  1. Ding, C.; Liu, C.; Zheng, C.; Li, F. Digital Economy, Technological Innovation and High-Quality Economic Development: Based on Spatial Effect and Mediation Effect. Sustainability 2022, 14, 216. [Google Scholar] [CrossRef]
  2. Xu, S.; Yang, C.Y.; Huang, Z.H.; Failler, P. Interaction between Digital Economy and Environmental Pollution: New Evidence from a Spatial Perspective. Int. J. Environ. Res. Public Health 2022, 19, 5074. [Google Scholar] [CrossRef] [PubMed]
  3. Ren, B.-p.; Zhang, C.-x. Security risk early warning and prevention mechanism construction of Digital economy development in China. J. Guizhou Univ. Financ. Econ. 2022, 1–13. [Google Scholar] [CrossRef]
  4. ISO/IEC 27002:2022; Information Security, Cybersecurity and Privacy Protection—Information Security Controls. International Organization for Standardization/International Electrotechnical Commission: Geneva, Switzerland, 2022.
  5. Facebook’s Worst Outage Ever: Is It Time for Internet Companies to Rethink Their Architecture? Available online: https://mp.weixin.qq.com/s/qkUVPMHCE01JB2GB5_v2mQ (accessed on 21 April 2025).
  6. Abdiraman, A.; Goranin, N.; Balevicius, S.; Nurusheva, A.; Tumasoniene, I. Application of Multicriteria Methods for Improvement of Information Security Metrics. Sustainability 2023, 15, 8114. [Google Scholar] [CrossRef]
  7. Castro, G.D.R.; Fernandez, M.C.G.; Colsa, A.U. Unleashing the convergence amid digitalization and sustainability towards pursuing the Sustainable Development Goals (SDGs): A holistic review. J. Clean. Prod. 2021, 280, 122204. [Google Scholar] [CrossRef]
  8. Premaratna, S.; Padmasiri, H.; Rathnayaka, I.; Indeewari, G.; Arachchi, P.K. A Review of Literature on Sustainable Cities and Urban Ageing: Challenges and Opportunities for Developing Countries. Sri Lanka J. Soc. Sci. Humanit. 2023, 3, 63–70. [Google Scholar] [CrossRef]
  9. Transforming Our World: The 2030 Agenda for Sustainable Development. Available online: https://sdgs.un.org/2030agenda (accessed on 8 May 2025).
  10. Rosario, A.T.; Dias, J.C. The New Digital Economy and Sustainability: Challenges and Opportunities. Sustainability 2023, 15, 10902. [Google Scholar] [CrossRef]
  11. Duggineni, S. Data integrity and risk. Open J. Optim. 2023, 12, 25–33. [Google Scholar] [CrossRef]
  12. Leroy, I.; Zolotaryova, I.; Semenov, S. Impact of Critical Infrastructure Cyber Security on the Sustainable Development of Smart Cities: Insights from Internal Specialists and External Information Security Auditors. Sustainability 2025, 17, 1188. [Google Scholar] [CrossRef]
  13. ISO/IEC 27005:2022; Information Security, Cybersecurityand Privacy Protection—Guidance Onmanaging Information Security Risks. International Organization for Standardization/International Electrotechnical Commission: Geneva, Switzerland, 2022.
  14. Sadowski, J. When data is capital: Datafication, accumulation, and extraction. Big Data Soc. 2019, 6, 2053951718820549. [Google Scholar] [CrossRef]
  15. Evgenevna, F.E.; Anatolevna, P.T.; Nikolaevich, D.M.; Petrovna, R.E.; Aleksandrovich, K.P. Information Security of Russia in the Digital Economy: The Economic and Legal Aspects. J. Adv. Res. Law Econ. 2018, 9, 89. [Google Scholar]
  16. Sopilnyk, L.; Skrynkovskyy, R.; Kovaliv, M.; Zayats, R.; Malashko, O.; Yesimov, S.; Mykytiuk, M. Development of Digital Economy in the Context of Information Security in Ukraine. Path Sci. 2020, 6, 2023–2032. [Google Scholar] [CrossRef]
  17. Aliyev, A.G.; Shahverdiyeva, R.O. Scientific and methodological bases of complex assessment of threats and damage to information systems of the digital economy. Int. J. Inf. Eng. Electron. Bus. 2022, 15, 23. [Google Scholar]
  18. Que, T.; Wang, Z. Global Data Security Governance and Action Strategies for China’s Participation in the Era of Digital Economy. J. Int. Secur. Stud. 2022, 40, 130–154+158. [Google Scholar] [CrossRef]
  19. Sun, Y.; Zhuang, L.; Jia, T.; Cheng, D.; Zhao, X.; Guo, J. A risk assessment method for power internet of things information security based on multi-objective hierarchical optimisation. IET Smart Grid 2025, 8, e12208. [Google Scholar] [CrossRef]
  20. Yang, L.; Zou, K.; Gao, K.; Jiang, Z. A fuzzy DRBFNN-based information security risk assessment method in improving the efficiency of urban development. Math. Biosci. Eng. 2023, 19, 14232–14250. [Google Scholar] [CrossRef]
  21. Xu, W.; Lin, M. Information Security Evaluation of Industrial Control Systems Using Probabilistic Linguistic MCDM Method. CMC Comput. Mater. Contin. 2023, 77, 199–222. [Google Scholar] [CrossRef]
  22. Wang, D.; Lu, Y.; Gan, J. An information security evaluation method based on entropy theory and improved TOPSIS. In Proceedings of the 2017 IEEE Second International Conference on Data Science in Cyberspace (DSC), Shenzhen, China, 26–29 June 2017; IEEE: New York, NY, USA; pp. 595–600. [Google Scholar]
  23. Guo, Z.Y.; Qi, J.H.; Zuo, J.X.; Xie, W.X.; Lu, Y.M.; Tian, H.P.; Cao, R.H. A Security Evaluation Model for Edge Information Systems Based on Index Screening. IEEE Internet Things J. 2024, 11, 21585–21603. [Google Scholar] [CrossRef]
  24. Yang, Y.; Yuan, Q. Information Ecology and Its Application and Prospect in the Field of Information System Research. J. Mod. Inf. 2022, 42, 140–148. [Google Scholar]
  25. Pekkarinen, S.; Hasu, M.; Melkas, H.; Saari, E. Information ecology in digitalising welfare services: A multi-level analysis. Inf. Technol. People 2021, 34, 1697–1720. [Google Scholar] [CrossRef]
  26. Nardi, B.A.; O’Day, V. Information Ecologies: Using Technology with Heart; Mit Press: Cambridge, MA, USA, 1999. [Google Scholar]
  27. Wei, C.; Cai, Y.; Liu, J.; Guo, Y.; Wu, X.; He, X.; Hu, D. Factors influencing user’s health information discernment abilities in online health communities: Based on SEM and fsQCA. Front. Public Health 2024, 12, 1379094. [Google Scholar] [CrossRef] [PubMed]
  28. Yuan, X.; Wang, C. Research on the formation mechanism of information cocoon and individual differences among researchers based on information ecology theory. Front. Psychol. 2022, 13, 1055798. [Google Scholar] [CrossRef] [PubMed]
  29. Hughes-Lartey, K.; Li, M.; Botchey, F.E.; Qin, Z. Human factor, a critical weak point in the information security of an organization’s Internet of things. Heliyon 2021, 7, e06522. [Google Scholar] [CrossRef] [PubMed]
  30. Dolgieva, M.M. Digital crime object. Tomsk State Univ. J. 2022, 253–260. [Google Scholar] [CrossRef]
  31. Caramancion, K.M.; Li, Y.Q.; Dubois, E.; Jung, E.S. The Missing Case of Disinformation from the Cybersecurity Risk Continuum: A Comparative Assessment of Disinformation with Other Cyber Threats. Data 2022, 7, 49. [Google Scholar] [CrossRef]
  32. Yang, P.; Xiong, N.X.; Ren, J.L. Data Security and Privacy Protection for Cloud Storage: A Survey. IEEE Access 2020, 8, 131723–131740. [Google Scholar] [CrossRef]
  33. Zhu, L.; Ma, Z.; Huang, H.; Yan, M. Research on cybersecurity risk prevention and control of new infrastructure. In Proceedings of the 2021 International Conference on Computer Network Security and Software Engineering (CNSSE 2021), Zhuhai, China, 26–28 February 2021; p. 012034. [Google Scholar]
  34. Meleshko, Y.V. Business models digitalization of enterprises belarusian industrial complex: Directions, risks and tools. Econ. Sci. Today 2021, 61–74. Available online: https://cyberleninka.ru/article/n/tsifrovizatsiya-biznes-modeley-predpriyatiy-belorusskogo-promyshlennogo-kompleksa-napravleniya-riski-i-instrumenty (accessed on 8 May 2025). [CrossRef]
  35. Salayma, M. Risk and threat mitigation techniques in internet of things (IoT) environments: A survey. Front. Internet Things 2024, 2, 1306018. [Google Scholar] [CrossRef]
  36. Fu, M.; Tantithamthavorn, C.; Le, T.; Kume, Y.; Nguyen, V.; Phung, D.; Grundy, J. AIBugHunter: A Practical tool for predicting, classifying and repairing software vulnerabilities. Empir. Softw. Eng. 2024, 29, 4. [Google Scholar] [CrossRef]
  37. Naicker, V.; Mafaiti, M. The establishment of collaboration in managing information security through multisourcing. Comput. Secur. 2019, 80, 224–237. [Google Scholar] [CrossRef]
  38. Chen, B.; Liu, Y. Promotion and Advancement of Data Security Governance in China. Electronics 2024, 13, 1905. [Google Scholar] [CrossRef]
  39. He, X. Digital Economy, Business Environment and Foreign Trade Competitiveness. Front. Humanit. Soc. Sci. 2024, 4, 85–98. [Google Scholar] [CrossRef]
  40. Cheung, A.S.; Chen, Y. From datafication to data state: Making sense of China’s social credit system and its implications. Law Soc. Inq. 2022, 47, 1137–1171. [Google Scholar] [CrossRef]
  41. Bu, L.; Zhang, J. Quantitative Evaluation of Digital Economy Policy Based on PMC Index Model. Stat. Decis. 2023, 39, 22–27. [Google Scholar] [CrossRef]
  42. Tian, Z.; Jiang, C.C.; Yue, G.Y. Analysis of Digital Security Governance under the Objectives of Digital Ecology: A Three-Party Evolutionary Game Approach. Complexity 2024, 2024, 8849477. [Google Scholar] [CrossRef]
  43. Albayrak, E.; Bağcı, H. Modelling the effects of personal factors on information security awareness. J. Inf. Sci. 2025, 51, 20–30. [Google Scholar] [CrossRef]
  44. Jie, C.; Yanjie, S.; Liang-hai, L. A Study on the Pathways for Improving the Efficiency of China’s Digital Economy Based on the fsQCA Method. Mod. Manag. Sci. 2024, 161–170. [Google Scholar]
  45. Zeng, G.H.; Wu, M.M.; Yuan, X.X. Digital economy and industrial agglomeration. Econ. Anal. Policy 2024, 84, 475–498. [Google Scholar] [CrossRef]
  46. Fang, X.B.; Liu, M.T. How does the digital transformation drive digital technology innovation of enterprises? Evidence from enterprise’s digital patents. Technol. Forecast. Soc. Change 2024, 204, 123428. [Google Scholar] [CrossRef]
  47. Gulishengmu, A.; Yang, G.; Tian, L.J.; Pan, Y.; Huang, Z.; Xu, X.G.; Gao, Y.L.; Li, Y. Analysis of Water Resource Carrying Capacity and Obstacle Factors Based on GRA-TOPSIS Evaluation Method in Manas River Basin. Water 2023, 15, 236. [Google Scholar] [CrossRef]
  48. Xu, D.Y.; Abbas, S.; Rafique, K.; Ali, N. The race to net-zero emissions: Can green technological innovation and environmental regulation be the potential pathway to net-zero emissions? Technol. Soc. 2023, 75, 102364. [Google Scholar] [CrossRef]
  49. Fu, L.; Lei, Y.L.; Zhu, L.; Lv, J.F. An evaluation and design method for Ming-style furniture integrating Kansei engineering with particle swarm optimization-support vector regression. Adv. Eng. Inform. 2024, 62, 102822. [Google Scholar] [CrossRef]
  50. Leng, Y.J.; Zhang, H. Comprehensive evaluation of renewable energy development level based on game theory and TOPSIS. Comput. Ind. Eng. 2023, 175, 108873. [Google Scholar] [CrossRef]
  51. Gheorghe, G.; Tudorache, P.; Rosca, I.M. The Contribution of Green Marketing in the Development of a Sustainable Destination through Advanced Clustering Methods. Sustainability 2023, 15, 13691. [Google Scholar] [CrossRef]
  52. Cui, X.L.; Shen, Z.; Li, Z.H.; Wu, J. Spatiotemporal evolutions and driving factors of green development performance of cities in the Yangtze River Economic Belt. Ecol. Inform. 2021, 66, 101476. [Google Scholar] [CrossRef]
  53. Bonai, F.; Zhonghua, S. Digital Risk Governance: Research Context, Theoretical Framework, and Future Outlook. J. Manag. World 2024, 40, 208–239. [Google Scholar]
  54. Tang, X. Measurement on the Chinese Digital Economic Development Level and Regional Heterogeneity. Jianghan Trib. 2025, 28–37. [Google Scholar] [CrossRef]
  55. Tang, L.; Lu, B.; Tian, T. Spatial Correlation Network and Regional Differences for the Development of Digital Economy in China. Entropy 2021, 23, 1575. [Google Scholar] [CrossRef]
  56. Amankwah-Amoah, J.; Khan, Z.; Wood, G.; Knight, G. COVID-19 and digitalization: The great acceleration. J. Bus. Res. 2021, 136, 602–611. [Google Scholar] [CrossRef]
Figure 1. Digital economy information security risk assessment indicator framework.
Sustainability 17 06428 g001
Figure 2. Risk values for different provinces in different years.
Sustainability 17 06428 g002
Figure 3. (a) Shanghai primary indicator risk values over time; (b) Zhejiang primary indicator risk values over time; (c) Guizhou primary indicator risk values over time.
Sustainability 17 06428 g003
Figure 4. (a) Jiangsu primary indicator risk values over time; (b) Jiangxi primary indicator risk values over time; (c) Hunan primary indicator risk values over time.
Sustainability 17 06428 g004
Figure 5. (a) China’s digital economy information security spatial pattern in 2019; (b) China’s digital economy information security spatial pattern in 2020; (c) China’s digital economy information security spatial pattern in 2021.
Sustainability 17 06428 g005
Figure 6. Ward’s method results.
Sustainability 17 06428 g006
Figure 7. Secondary Indicator Obstacle degree values from 2019 to 2021.
Sustainability 17 06428 g007
Table 1. Digital economy information security risk assessment indicator system.
Primary IndicatorsSecondary IndicatorsQuantitative IndicatorsData SourcesIndicator Attributes
Information personnel AInformation security awareness A1Implementation rate of personal cybersecurity measures A11Survey report on Chinese netizens’ satisfaction with cybersecurity Negative
The proportion of unsafe online behavior A12Positive
Digital crime A2Incidence rate of online fraud crimes A21Survey report on Chinese netizens’ satisfaction with cybersecurityPositive
Incidence of personal information infringement A22Positive
Information personnel ADigital crime A2Network intrusion encounter rate A23Survey report on Chinese netizens’ satisfaction with cybersecurityPositive
Network attack encounter rate A24Positive
Information BFalse information B1Traffic fraud encounter rate B11Survey report on Chinese netizens’ satisfaction with cybersecurityPositive
Data resource scale B2Data resource index B21China’s big data regional development level assessment white paper Positive
Information security services B3Information security revenue B31China statistical yearbook Negative
Information technology CInformation infrastructure C1The ratio of optical cable line length to provincial area C11China statistical yearbook Positive
The ratio of mobile phone base stations to provincial area C12Positive
Ratio of internet access ports to provincial area C13Positive
Digital innovation capabilities C2Number of digital economy patent authorizations C21Chinese research data services platformNegative
Safety protection capabilities C3Digital security capabilities C31Report on the innovative development of China’s big dataNegative
Information environment DSocial credit system D1Number of social credit system policies D11Peking University Law LibraryNegative
Digital economy system D2Number of digital economy policies D21Peking University Law LibraryNegative
Level of digital rule of law D3Digital rule of law index D31Report on the innovative development of China’s big dataNegative
Information security promotion level D4Fraud prevention awareness campaign implementation rate D41Survey report on Chinese netizens’ satisfaction with cybersecurityNegative
Survey report on Chinese netizens’ satisfaction with cybersecurity can be accessed at https://www.iscn.org.cn/ (accessed on 4 July 2025).
Table 2. Weights of evaluation indicators.
Quantitative IndicatorsCRITIC WeightEntropy WeightCombined Weight
A110.06340.04300.0462
A120.06140.03580.0398
A210.05750.04680.0485
A220.05500.02630.0308
A230.05520.02390.0288
A240.06590.03250.0377
B110.06110.02860.0336
B210.06990.12210.1140
B310.04800.00990.0159
C110.04170.17620.1552
C120.03960.13580.1208
C130.03980.18900.1657
C210.04700.01120.0168
C310.06440.01860.0258
D110.05010.01110.0172
D210.05740.01300.0199
D310.05440.02940.0333
D410.06800.04690.0502
Table 3. Risk value and risk ranking.
Province2019Ranking2020Ranking2021Ranking
Beijing0.395030.478630.43512
Tianjin0.363960.515320.41003
Hebei0.2977210.3020160.324313
Shanxi0.3062190.2924190.272325
Inner Mongolia0.2925220.2850230.238428
Liaoning0.3207140.3035150.301718
Jilin0.2909240.2904220.295019
Heilongjiang0.3177150.2765250.287323
Shanghai0.729210.788810.81271
Jiangsu0.378740.3191120.314216
Zhejiang0.3229130.358150.38635
Anhui0.345190.2920200.323614
Fujian0.3049200.3065140.333612
Jiangxi0.3375100.3256100.282324
Shandong0.375250.376840.37966
Henan0.2917230.2953180.294421
Hubei0.2756260.336970.294720
Hunan0.352380.2913210.288322
Guangdong0.402420.334480.337611
Guangxi0.3162160.329690.36178
Hainan0.361970.3256100.36169
Chongqing0.3269120.3139130.36747
Sichuan0.3326110.3207110.305217
Guizhou0.3135180.350560.39714
Yunnan0.2827250.2987170.271526
Shaanxi0.3141170.2836240.343810
Gansu0.2684270.2448270.251727
Ningxia0.2532280.2305280.319715
Xinjiang0.2446290.2747260.229129
Table 4. Mean risk values for different types of provinces.
TypeProvinceMeanMean of AMean of BMean of CMean of D
IInner Mongolia, Jilin, Hebei, Liaoning, Shanxi, Heilongjiang, Yunnan, Gansu, Xinjiang, Guangxi, Ningxia, Jiangxi, Henan, Anhui, Hubei, Chongqing, Hunan, Shaanxi, Hainan 0.29980.10750.05050.06120.0806
IITianjin, Jiangsu, Beijing, Fujian, Sichuan, Guizhou, Shandong, Guangdong, Zhejiang0.36470.10520.10160.10440.0535
IIIShanghai0.77680.10330.11980.46780.0859
Table 5. Average obstacle degree values for secondary indicators.
A2C1A1B2D4
21.46%12.96%11.52%10.00%7.12%
Table 6. Annual obstacle degree values for secondary indicators from 2019 to 2021.
ProvinceYearIndex Ranking
12345
Beijing2019C1(42.97%)D4(12.05%)A1(10.46%)B2(8.27%)A2(6.32%)
2020C1(35.09%)A2(16.62%)B2(14.85%)A1(13.99%)D4(6.05%)
2021C1(38.12%)B2(19.97%)A1(11.07%)A2(10.79%)D4(5.48%)
Tianjin2019C1(35.89%)A2(13.71%)A1(11.43%)B2(7.61%)D2(5.47%)
2020C1(25.84%)A2(24.49%)B2(13.76%)A1(13.55%)C3(4.64%)
2021C1(32.08%)B2(14.05%)A1(13.49%)A2(12.91%)C3(5.93%)
Hebei2019D4(15.75%)A1(14.49%)A2(13.49%)C1(11.58%)D3(8.19%)
2020A2(19.72%)A1(17.11%)D4(11.80%)C1(11.28%)C3(8.39%)
2021A2(21.45%)A1(14.78%)C1(10.52%)D3(8.14%)C3(7.78%)
Shanxi2019A2(30.20%)A1(13.27%)D3(8.46%)D4(8.02%)C3(7.92%)
2020A2(23.14%)A1(14.03%)D4(11.22%)C3(8.73%)D3(8.28%)
2021A2(27.73%)D3(11.76%)A1(10.40%)C3(9.42%)C1(8.65%)
Inner Mongolia2019A2(23.74%)A1(13.52%)D4(13.07%)C3(8.82%)D3(8.69%)
2020A1(18.76%)A2(16.41%)D4(16.02%)C3(8.88%)B1(8.55%)
2021A2(29.77%)C3(10.73%)A1(9.83%)D3(8.86%)D2(7.91%)
Liaoning2019A2(19.22%)A1(16.37%)D4(13.91%)C1(9.98%)B1(7.58%)
2020A2(16.97%)D4(16.54%)A1(12.90%)C1(10.27%)C3(8.39%)
2021A2(23.80%)A1(17.81%)C1(10.16%)C3(8.39%)D3(7.00%)
Jilin2019A2(18.36%)D4(17.08%)A1(13.48%)D3(8.78%)C3(8.22%)
2020A2(18.38%)A1(16.92%)D4(16.04%)C3(8.71%)B1(6.87%)
2021A2(30.85%)A1(14.43%)C3(8.56%)D4(7.43%)D2(6.66%)
Heilongjiang2019A2(21.46%)A1(13.44%)D4(12.59%)D3(9.68%)B2(9.05%)
2020A1(20.24%)A2(17.85%)D4(11.80%)D3(9.55%)C3(9.04%)
2021A1(20.84%)A2(20.69%)D4(10.01%)C3(8.70%)D3(7.90%)
Shanghai2019C1(60.57%)A1(7.99%)B2(5.39%)D4(5.09%)A2(5.03%)
2020C1(56.01%)B2(11.80%)A2(7.18%)A1(5.97%)D4(3.46%)
2021C1(54.35%)B2(12.41%)A2(8.08%)D4(6.18%)A1(5.60%)
Jiangsu2019C1(26.93%)A2(22.04%)B2(14.85%)A1(8.36%)D4(5.61%)
2020C1(31.68%)A2(22.46%)B2(11.97%)C3(7.06%)A1(6.76%)
2021C1(32.32%)A2(25.22%)A1(9.87%)B2(7.65%)C3(7.21%)
Zhejiang2019C1(29.29%)A2(17.22%)B2(14.28%)A1(11.05%)B1(7.12%)
2020B2(31.83%)C1(25.54%)A2(12.90%)C3(5.96%)A1(5.93%)
2021B2(29.51%)C1(23.71%)A2(12.71%)A1(7.82%)B1(6.43%)
Anhui2019A2(22.25%)A1(13.53%)C1(11.87%)B2(11.22%)D4(8.11%)
2020A2(18.43%)A1(14.21%)C1(13.64%)D4(9.22%)C3(8.40%)
2021A2(27.01%)C1(12.69%)A1(8.53%)D4(7.82%)C3(7.49%)
Fujian2019A2(24.22%)B2(14.28%)A1(10.93%)C1(9.08%)B1(8.56%)
2020B2(24.70%)C1(12.39%)A2(11.73%)A1(10.20%)C3(7.98%)
2021B2(23.40%)A2(15.02%)A1(13.56%)C1(11.57%)B1(7.96%)
Jiangxi2019A1(18.43%)A2(18.23%)D4(10.78%)C1(7.83%)B1(7.60%)
2020B2(16.72%)A2(15.28%)A1(13.02%)C1(8.35%)C3(7.72%)
2021A2(20.10%)B2(15.30%)C1(9.88%)B1(9.74%)C3(8.88%)
Shandong2019B2(28.05%)C1(15.93%)A2(15.56%)A1(7.45%)D4(7.04%)
2020B2(27.66%)C1(14.97%)A2(14.18%)D4(8.68%)C3(6.16%)
2021B2(29.66%)A2(17.26%)C1(14.78%)D4(6.55%)A1(6.40%)
Henan2019A2(27.44%)C1(13.62%)A1(10.42%)B2(8.10%)D3(7.14%)
2020A2(15.85%)B2(15.20%)C1(13.16%)A1(12.44%)D3(8.89%)
2021B2(16.54%)A2(16.37%)C1(13.96%)A1(13.70%)C3(8.14%)
Hubei2019A2(23.58%)A1(11.62%)C1(9.71%)D4(8.88%)D2(6.80%)
2020A2(23.46%)B2(12.43%)D4(9.60%)A1(8.91%)C1(7.93%)
2021A2(18.11%)D4(11.68%)A1(10.75%)C1(9.59%)C3(7.64%)
Hunan2019A2(25.53%)A1(15.50%)D4(11.12%)D3(7.55%)C1(7.11%)
2020A2(24.69%)A1(12.48%)C1(8.62%)C3(8.35%)D3(7.98%)
2021A2(21.83%)A1(8.95%)C1(8.95%)C3(8.20%)D3(8.07%)
Guangdong2019B2(28.33%)A2(23.03%)C1(16.41%)A1(8.61%)D4(5.05%)
2020B2(25.92%)A2(22.39%)C1(19.43%)A1(10.85%)C3(5.01%)
2021B2(26.80%)A2(22.96%)C1(19.74%)A1(10.48%)C3(4.46%)
Guangxi2019A2(32.64%)A1(12.38%)D3(9.64%)B1(8.57%)D4(8.18%)
2020A2(21.49%)B2(18.30%)A1(8.61%)D3(8.56%)C3(7.72%)
2021A2(33.35%)B2(17.68%)A1(9.19%)C3(7.00%)C1(5.89%)
Hainan2019A2(28.50%)D4(10.70%)A1(10.04%)C1(8.61%)B2(7.74%)
2020A2(15.96%)B2(15.00%)D4(11.81%)C1(9.60%)C3(7.85%)
2021C1(26.56%)A2(13.36%)B2(9.64%)D4(8.39%)C3(6.99%)
Chongqing2019A2(25.18%)C1(13.66%)D4(11.86%)A1(11.77%)B1(8.15%)
2020A2(26.49%)C1(14.05%)A1(9.67%)C3(7.96%)D4(7.96%)
2021A2(26.01%)B2(15.46%)C1(12.39%)A1(8.22%)C3(6.80%)
Sichuan2019A2(24.42%)A1(14.31%)B2(13.37%)D4(9.90%)B1(7.58%)
2020B2(23.30%)A2(15.92%)A1(12.32%)C3(7.56%)D3(6.53%)
2021A2(20.04%)B2(19.33%)A1(9.65%)B1(9.40%)C3(8.00%)
Guizhou2019B2(20.37%)A1(16.90%)A2(15.15%)B1(8.79%)D4(8.44%)
2020B2(24.32%)A1(20.59%)A2(15.34%)C3(7.15%)C1(5.23%)
2021A2(30.34%)B2(18.41%)A1(13.61%)C3(6.29%)B1(6.11%)
Yunnan2019A2(42.53%)D3(7.82%)A1(7.58%)C3(7.19%)D2(6.83%)
2020A2(30.70%)A1(10.70%)D4(9.65%)D3(9.28%)C3(8.43%)
2021A2(27.75%)A1(14.69%)D3(10.01%)C3(9.25%)B1(7.16%)
Shananxi2019A2(21.28%)D4(15.98%)A1(11.61%)B1(7.84%)D3(6.65%)
2020A2(18.02%)D4(14.65%)A1(12.45%)B1(9.42%)C3(8.94%)
2021A2(30.26%)B1(9.77%)D4(9.65%)C3(7.34%)D3(7.30%)
Gansu2019A2(34.42%)A1(10.14%)C3(8.51%)D3(8.50%)B1(7.69%)
2020A2(30.05%)D3(10.91%)C3(10.48%)B1(7.88%)D2(7.84%)
2021A2(28.75%)C3(10.20%)B2(9.26%)A1(8.59%)D3(7.26%)
Ningxia2019A2(33.51%)B2(12.94%)D3(12.54%)D2(7.63%)C2(6.62%)
2020A1(16.14%)B1(12.57%)D3(12.31%)C3(11.19%)A2(9.33%)
2021A2(25.72%)A1(16.54%)B2(12.97%)C3(8.07%)D3(8.06%)
Xinjiang2019A2(31.53%)D3(13.61%)A1(12.15%)D2(8.14%)B1(7.00%)
2020A2(38.02%)B1(12.23%)D3(12.12%)C3(9.12%)D2(6.99%)
2021A2(25.18%)A1(16.45%)D3(14.53%)C3(11.02%)D2(8.46%)
Disclaimer/Publisher’s Note: The statements, opinions and data contained in all publications are solely those of the individual author(s) and contributor(s) and not of MDPI and/or the editor(s). MDPI and/or the editor(s) disclaim responsibility for any injury to people or property resulting from any ideas, methods, instructions or products referred to in the content.

