2.1. Raw Materials
Slate stone cutting sludge (SSCS), used as the primary aluminosilicate source for the geopolymer formulation, was supplied by the companies Perforaciones Noroeste (Oviedo, Spain) and Pizarras Ortegal (Ortigueira, Spain). This waste is generated during mining and processing operations in the extractive industry of natural non-carbonated dark grey tectonic compression slate with a slightly rough texture and inclusions of very small and dispersed metallic minerals, which is accumulated in settling ponds. Its composition consists mainly of the water used in the cutting process and fine slate particles in suspension. As a secondary precursor, grog or chamotte (CH), provided by Cerámica San Francisco (Bailén, Spain) from ceramic bricks that did not comply with the technical regulations for their application in construction, was used. As an alkaline activator, a mixture was prepared in varying proportions of olive stone bottom ash (OSBA) provided by Garzón Green Energy (Bailén, Spain) from a kiln fed with olive stones for heat generation, and sodium silicate (Na2SiO3) (29.20% SiO2, 8.90% Na2SO3, 61.90% H2O) (Panreac, Barcelona, Spain).
Elemental analysis using the Truspec Micro (LECO Corporation, St. Joseph, MI, USA) was conducted to quantify the content of carbon (C), nitrogen (N), and hydrogen (H). The results presented in
Table 1 show that SSCS, OSBA, and CH contained low carbonate content, which favors the geopolymerization reaction. A high carbonate concentration leads to a reduction in alkalinity, which hinders the complete dissolution of the precursors [
47]. This limitation leads to the formation of incomplete geopolymeric networks that negatively affect the compressive strength and chemical characteristics of the geopolymer.
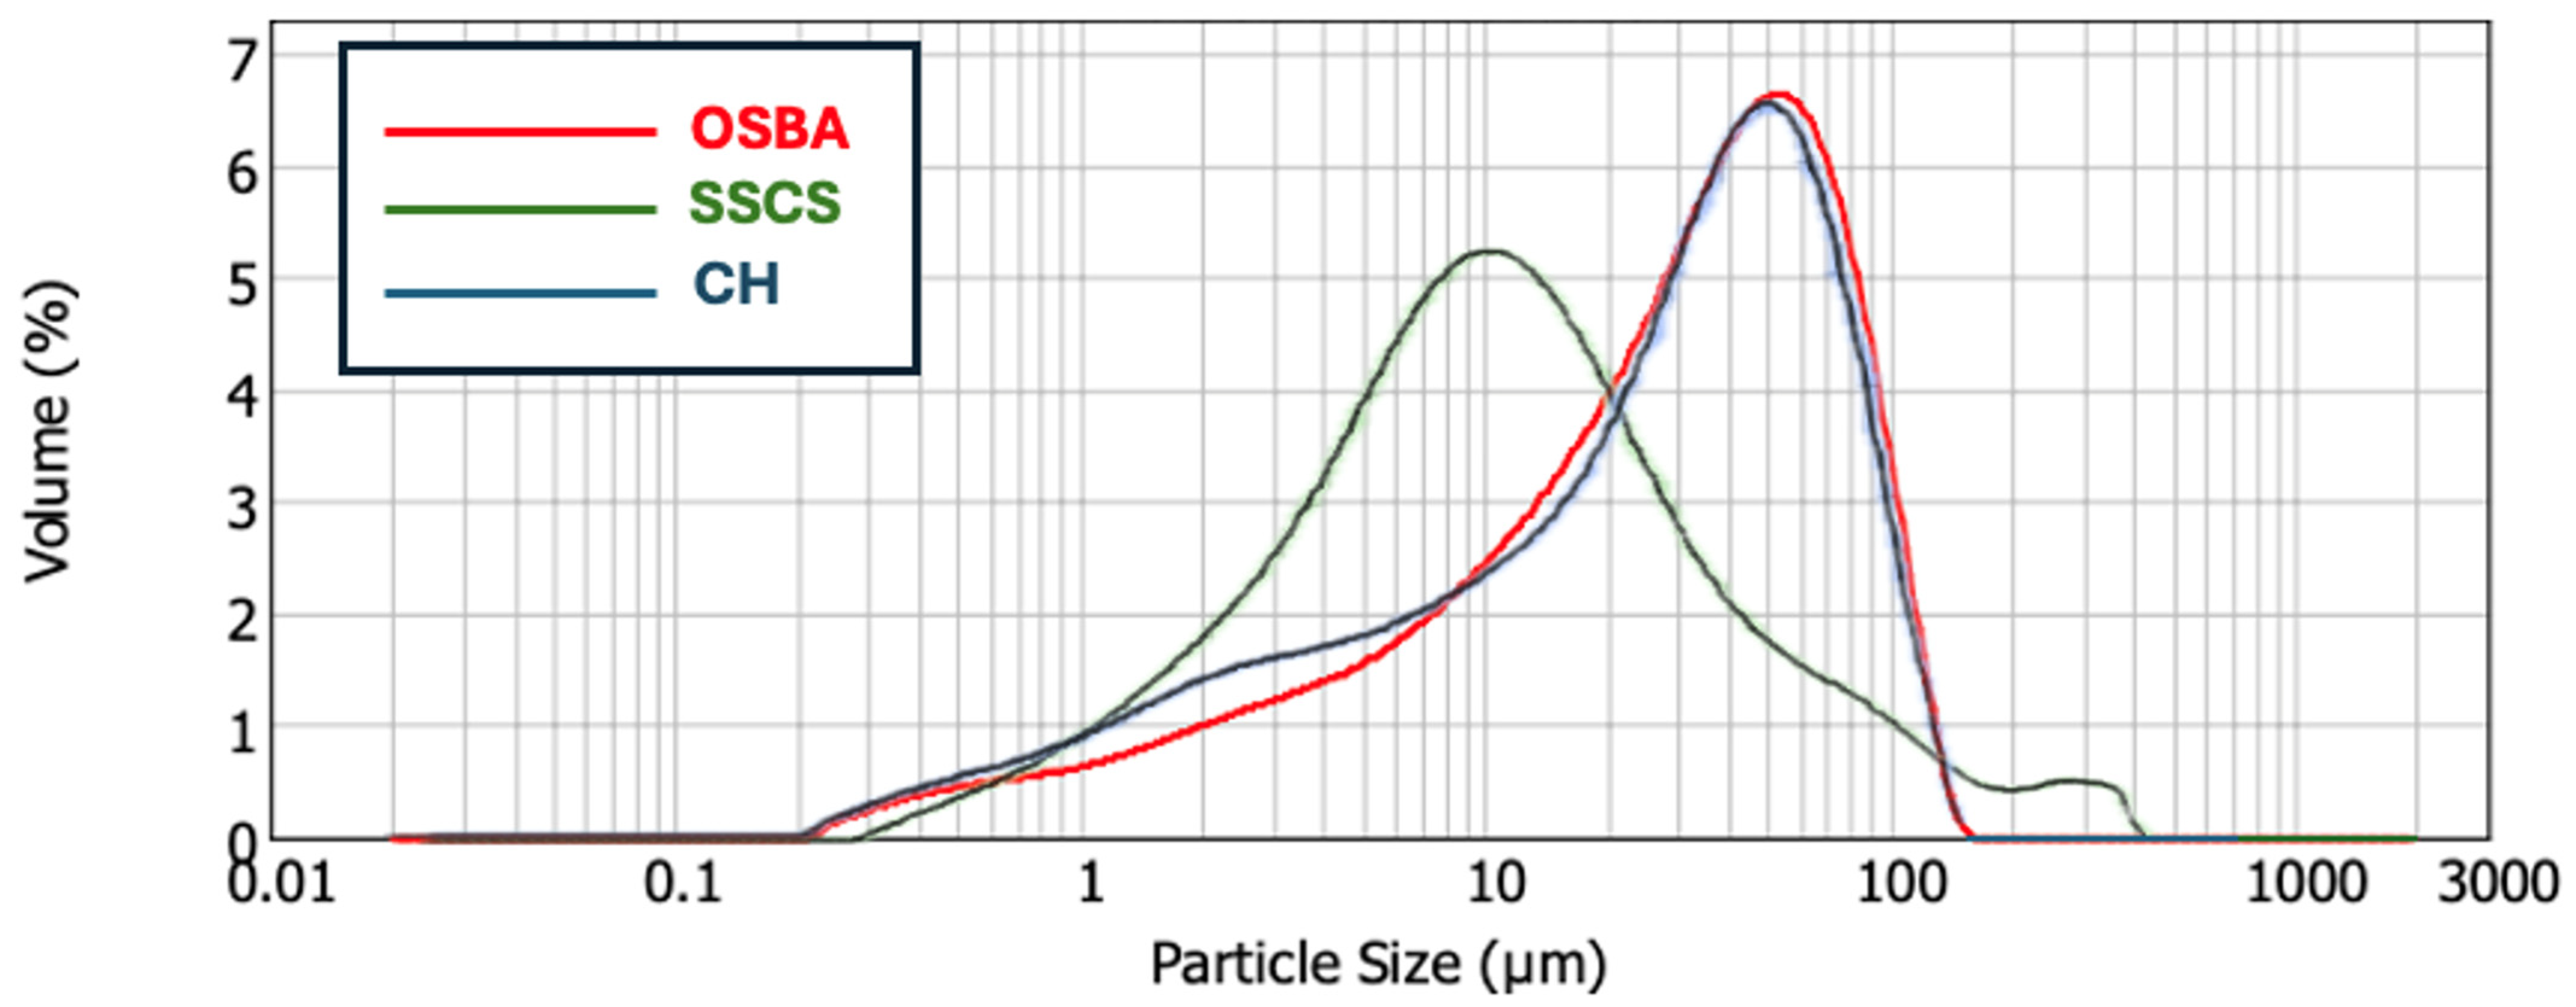
The granulometric of the precursor materials (SSCS and CH) and the alkaline solution (OSBA) were obtained with the Malvern Mastersizer 2000 equipment (Malvern Panalytical, Westborough, MA, USA). Since the granulometric influences the reaction of the precursors with the alkaline solution, the distribution of particles was reduced to a size below 100 µm to achieve compatibility of the mixture components [
48]. The granulometric distribution of SSCS is influenced by the machining technique employed to produce it, showing a median distribution (D
50) of 10.266 µm and a specific surface area of 1.31 m
2/g. In this study, the OSBA was processed by grinding in a Retsch PM200 planetary mill (RETSCH GmbH, Haan, Germany) and then sieved to obtain particles smaller than 400 µm. Prior to this, the OSBA was calcined at 950 °C for one hour to eliminate any residual organic material and enhance its reactivity [
49]. After calcination, the OSBA was ground and sieved to 300 µm to minimize particle size, lower the specific surface area, and enhance its reactivity with Na
2SiO
3 [
50]. This waste material is rich in alkaline oxides, mainly K
2O, which promotes the formation of ionic species in an alkaline environment. These species facilitate the solution of partially crystalline or amorphous phases found in aluminosilicate precursors (SSCS and CH), allowing the liberation of Si and Al monomers. These monomers participate in polycondensation reactions that create a three-dimensional aluminosilicate network characteristic of geopolymer gel. The measured D50 and specific surface area for OSBA were 30.053 µm and 0.972 m
2/g, respectively. Similarly, CH fragments underwent the same physical treatment, resulting in a D90 below 81.556 µm and a specific surface area of 1.11 m
2/g.
Figure 1 displays the particle size distributions of SSCS, OSBA, and CH.
The reactivity of geopolymer precursors is strongly influenced by parameters such as the degree of crystalline order and the chemical composition of the precursor–activator system, as well as by the density (
Table 2). Materials with lower densities tend to exhibit a greater specific surface area, which is linked to a less compact structural arrangement. This favors dissolution kinetics in alkaline media, promoting the release of the ionic species of the aluminosilicates (Si
4+ and Al
3+), fundamental in gel polymerization [
51]. The density of SSCS (2.45 kg/m
3) is related to the high fines content, as corroborated in
Figure 1. CH showed a similar density (2.50 kg/m
3) due to the compact structure of the material. The density of OSBA was higher (2.71 Kg/m
3), related to the presence of glassy phases and partially molten structures as a consequence of the heat treatment at high temperatures, which produces denser particles [
52].
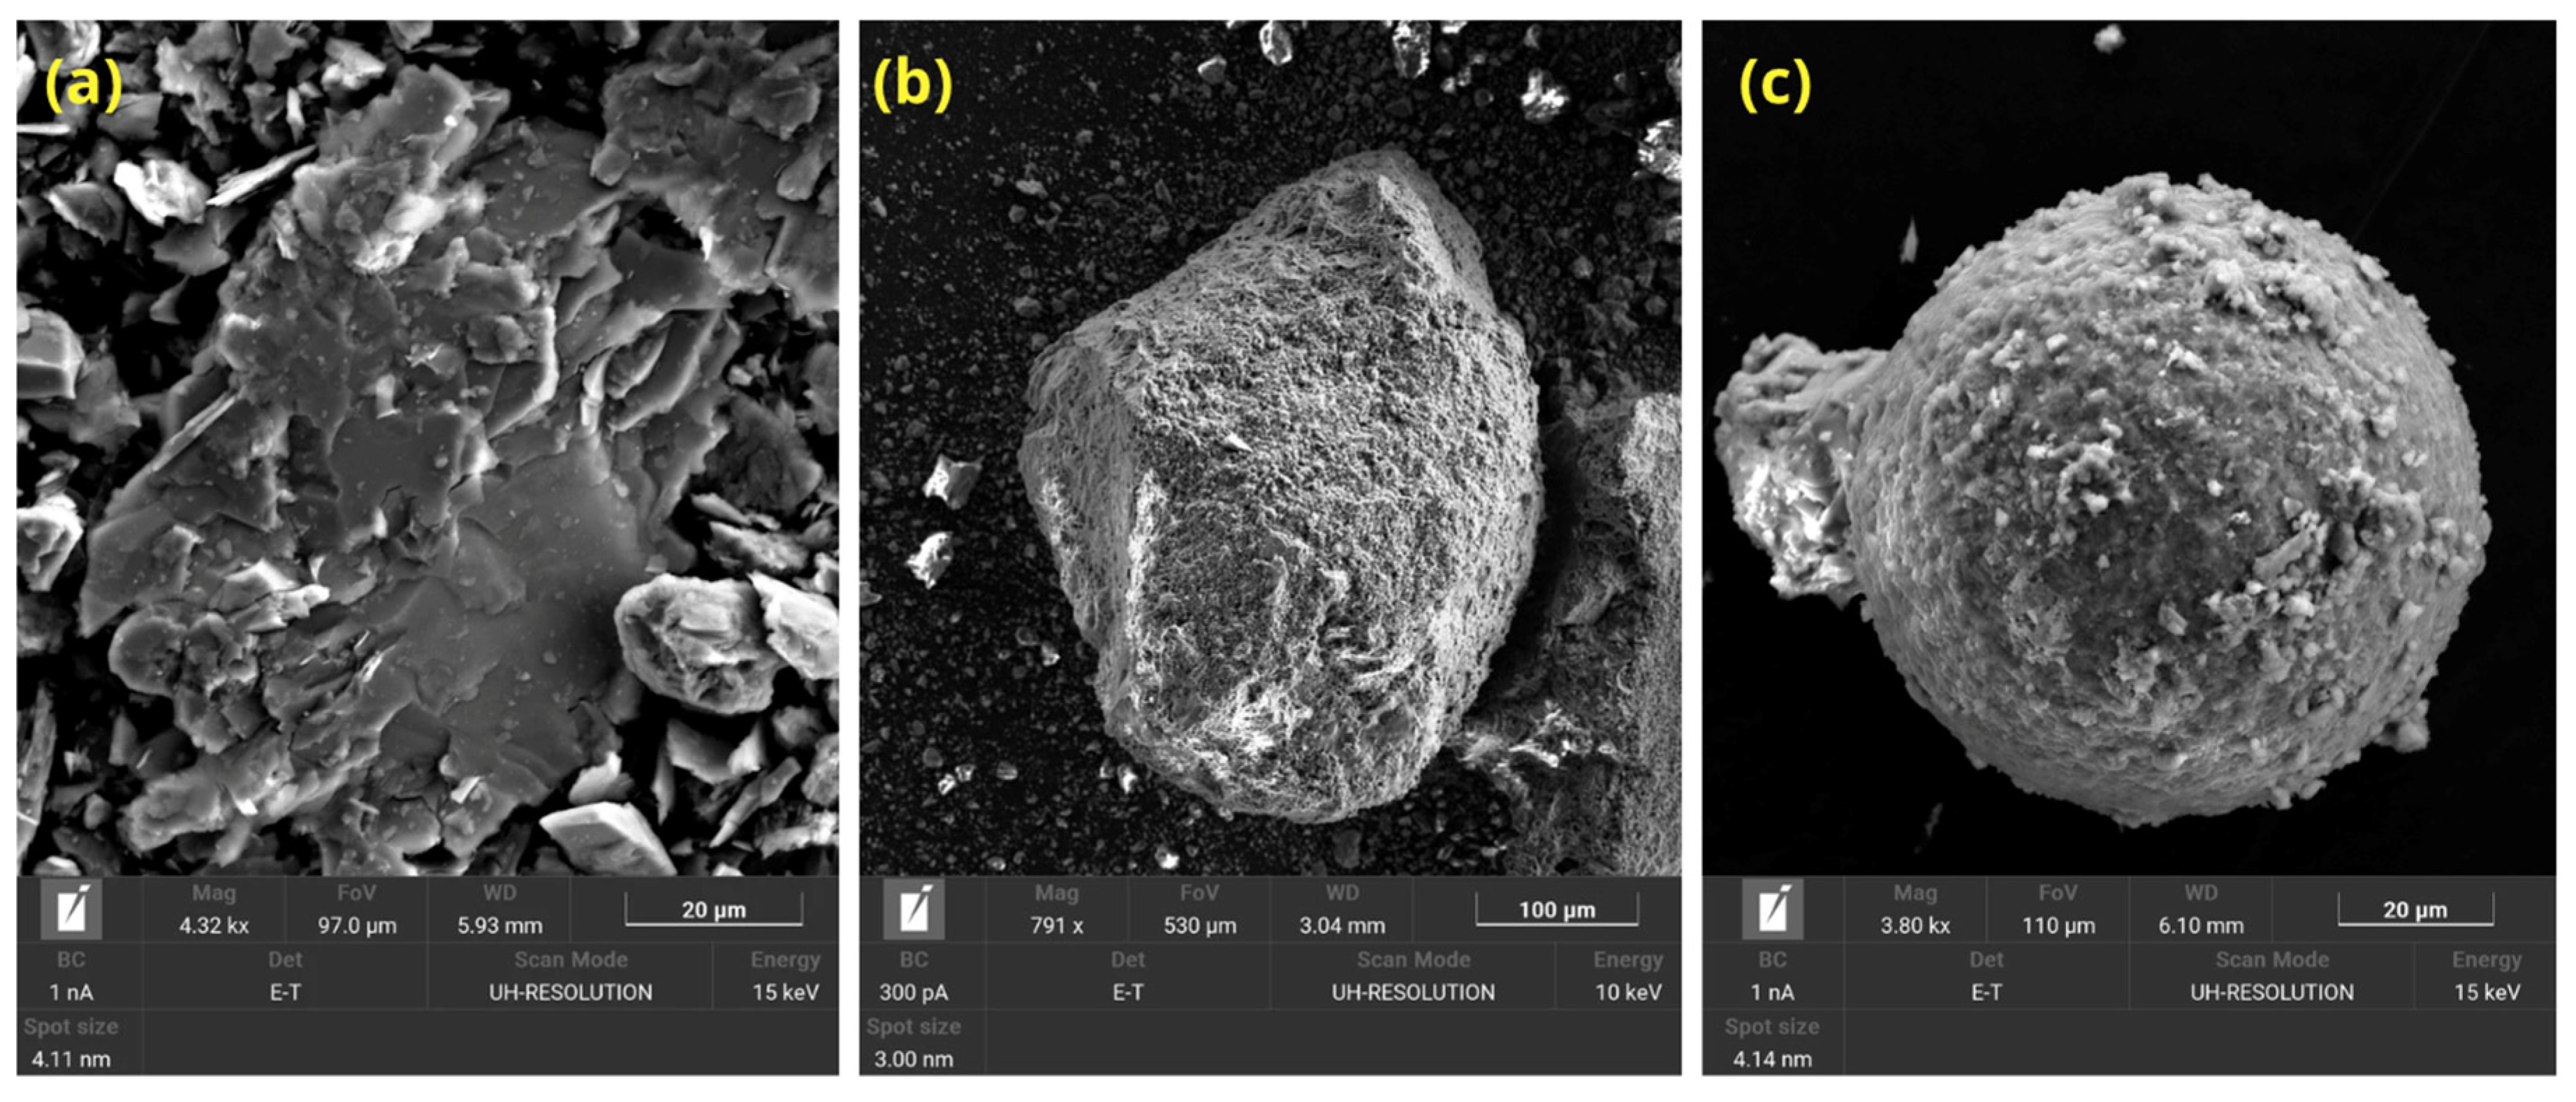
The morphology of the particles influences the reactivity of the precursor–activator systems and the development of the microstructure of the final material. On the other hand, morphology also influences the behavior of the particles during the forming of the specimens.
Figure 2 shows the SEM images of the three materials used: (a) SSCS, (b) CH, and (c) OSBA.
The SEM image of SSCS showed a lamellar and flaky morphology, characteristic of the phyllosilicate-rich minerals presents in the shale. This morphology favors good dispersion in the matrix but may hinder mechanical compaction because of their tendency to align parallel to each other, generating zones of weakness [
53]. CH showed an irregular particle structure. Its rough surface also favors chemical adhesion with geopolymer gels during reaction [
54]. OSBA is formed by particles with predominantly spherical shape and porous surface. These spheres present a morphology characteristic of high temperature biomass combustion processes [
55].
The chemical composition of the raw materials, obtained using X-ray fluorescence spectrometry (XRF) with a Bruker Pioner S4 Explorer equipment (Bruker AXS GmbH, Karlsruhe, Germany), revealed that both SSCS and CH possessed compositions appropriate for serving as precursors in geopolymerization. In particular, these materials presented high contents of silicon (SiO
2) and aluminum (Al
2O
3) oxides, reaching values of 65.68% and 13.77% in the case of SSCS, and 55.61% and 17.60% in CH, respectively. The SiO
2/Al
2O
3 molar ratios obtained (4.76 for SSCS and 3.16 for CH) were within the optimal range (1–5) to favor the aluminosilicate gel formation required for the formation of a stable geopolymeric matrix [
56].
On the other hand, OSBA presented a composition rich in alkali oxides, with an elevated concentration of K
2O (27.50%) and CaO (34.20%). This richness in basic elements makes it an effective material as an alkaline solution, promoting the solution of the precursors and facilitating the generation of N-A-S-H and C-A-S-H types of gels, which are fundamental for the development of solid three-dimensional networks characteristic of geopolymeric materials [
57].
Table 3 lists the detailed chemical composition values of SSCS, CH, and OSBA.
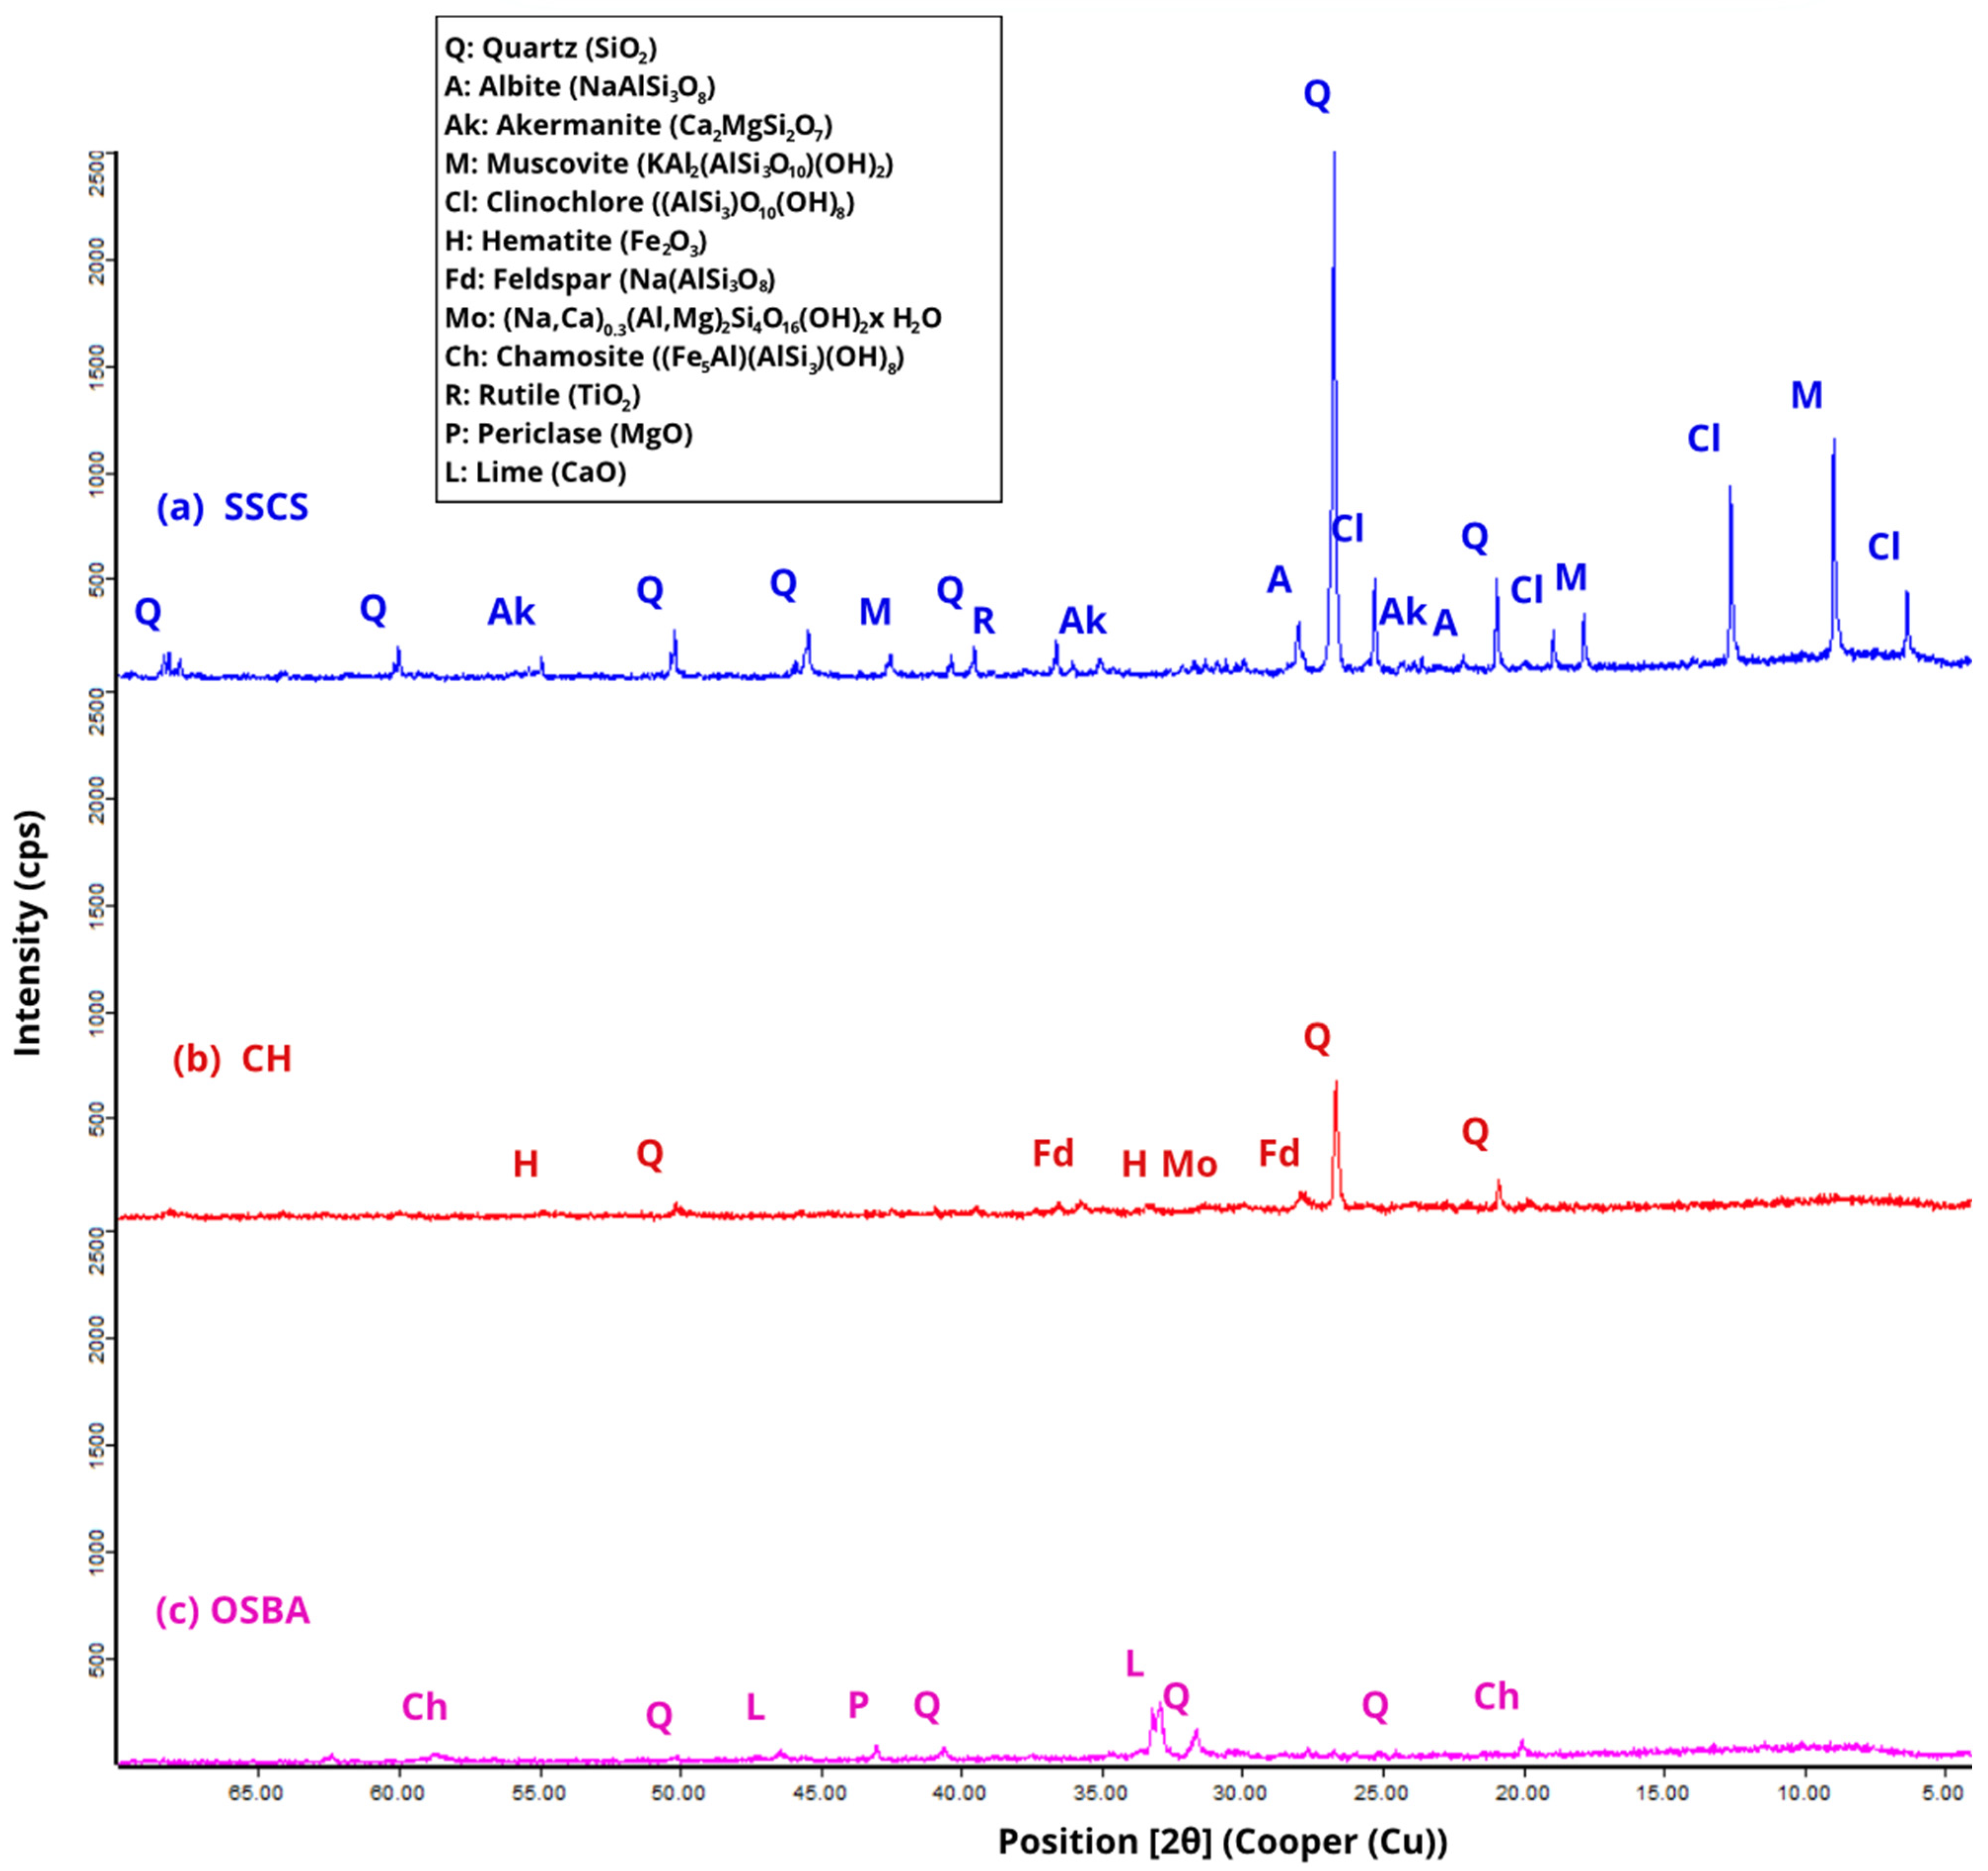
X-ray diffraction (XRD) analyses of the raw materials SSCS, OSBA, and CH were obtained with a PANalytical X’Pert Pro diffractometer (Malvern Panalytical) (see
Figure 3), scanning over an angular range from 4° to 70° (2θ) with a size of 0.0168°. The instrument operated at 45 kV and 40 mA, while the samples were rotated at 10 rpm throughout the test. The results reveal a complex and heterogeneous mineralogy, in which crystalline phases associated with the previously determined chemical composition predominate.
In the case of SSCS, the diffractograms reveal a predominant presence of silicon dioxide (SiO2), mainly as quartz (Q) and muscovite (M) (KAl2(AlSi3O10)(OH)2). Additionally, phases containing iron (Fe) and magnesium (Mg) were detected, including clinochlore (Cl) ((AlSi3)O10(OH)8) and chamosite (Ch) ((Fe5Al)(AlSi3)(OH)8), along with minor amounts of titanium dioxide (TiO2) in the form of rutile (R).
Regarding CH, diffractograms reveal a mineralogy dominated by silica- and alumina-rich phases, mainly as quartz (Q), similar to SSCS. In addition, hematite (H) was detected as an Fe2O3-bearing phase, as well as akermanite (Ak) (Ca2MgSiO7), which contributes to the mineralogical complexity of the material and may influence its behavior during the geopolymerization reaction.
OSBA presented a mineralogy dominated by carbonate phases and alkaline oxides, with the presence of free lime (silt, L) (CaO), together with minor amounts of quartz (Q) and periclase (P) (MgO). This component is consistent with its residual nature as a by-product of biomass combustion [
58].
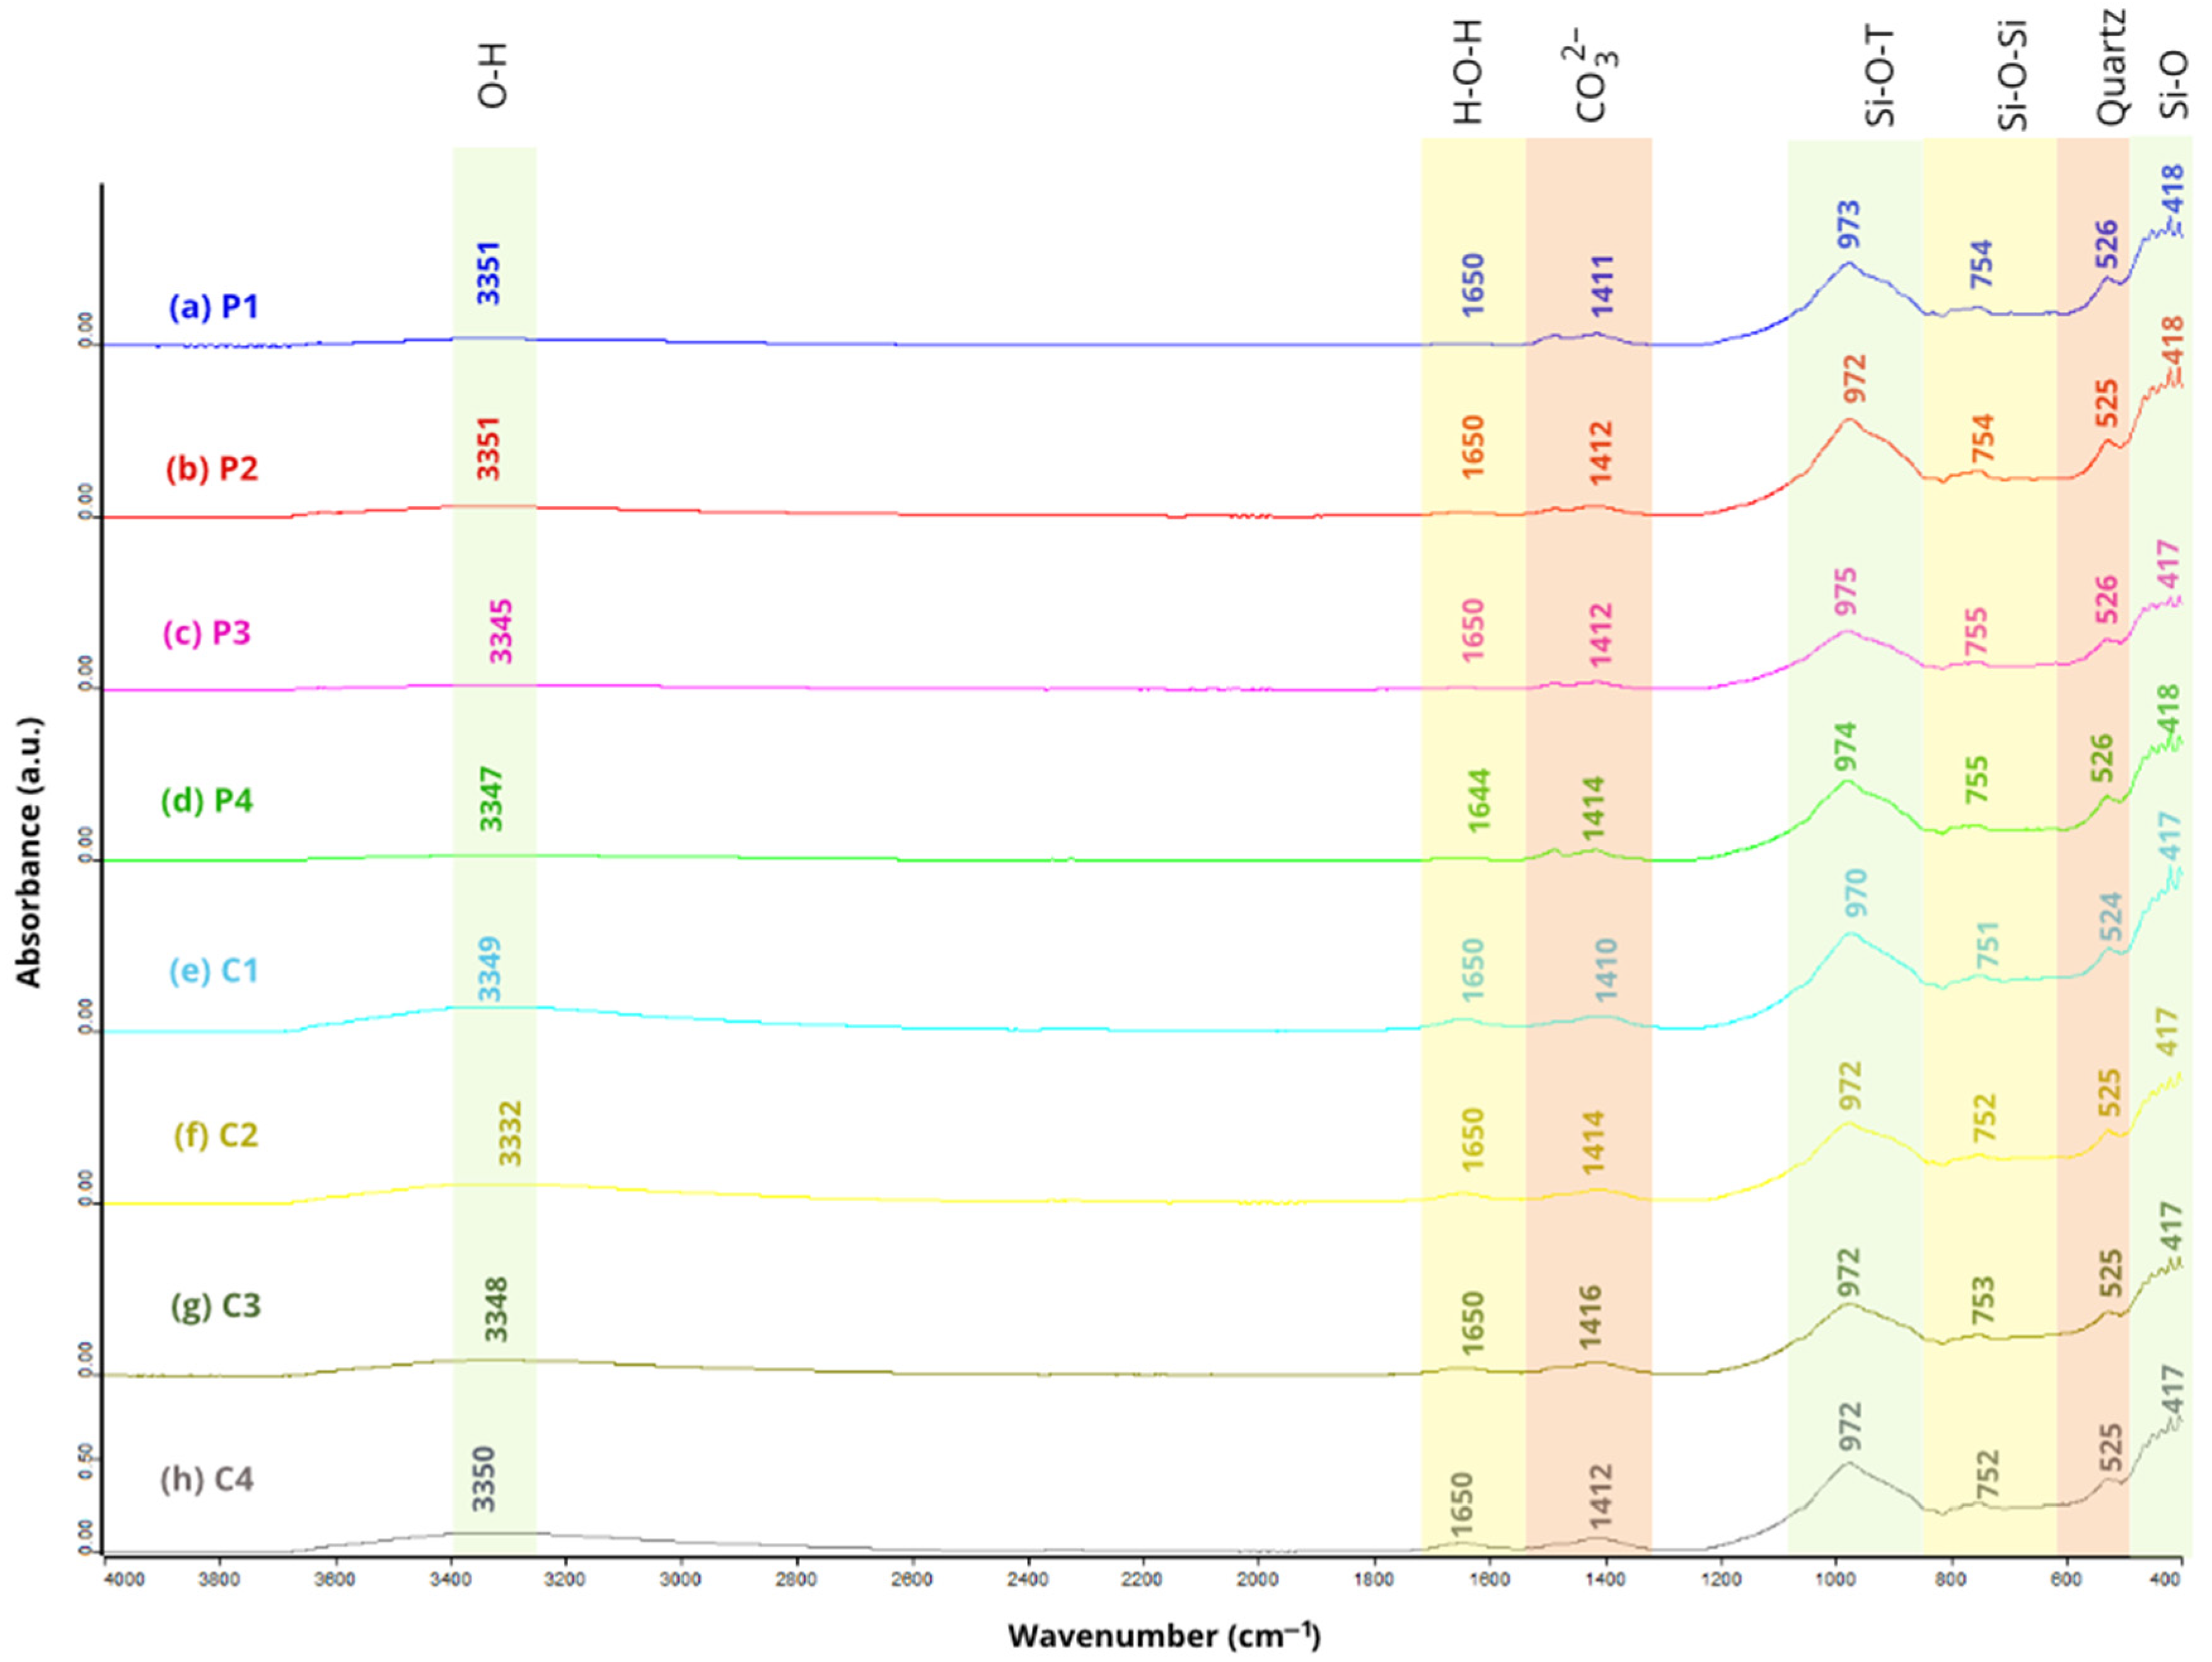
The bands groups in SSCS, CH, and OSBA were obtained using Fourier Transform Infrared Spectroscopy (FTIR) with a Jasco Analytical 6800FV spectrophotometer (JASCO Corporation, Tokyo, Japan). Spectra were determined in the range of 4000 to 400 cm
−1 (
Figure 4), enabling the identification of characteristic chemical bonds and functional groups for each material.
Both SSCS and OSBA displayed broad absorption bands within the 3626-2983 cm
−1 range, which corresponded to the O–H stretching vibrations, indicative of physically adsorbed water on the surface of the particles [
59]. Additionally, a distinct band observed between 1455 and 1416 cm
−1 was linked with the C–O vibrational asymmetric stretching, suggesting the presence of carbonate phases [
57].
In the FTIR spectra of SSCS and CH, bands appeared between 976 and 972 cm
−1, related to Si–O–T vibrational asymmetric stretching (T=Si or Al), a feature typical of silica-rich materials and reflected in the chemical composition determined by XRF (
Table 3) [
60,
61]. For OSBA, the absorption peak detected at 885 cm
−1 was linked to C–O bond vibrations in carbonate groups, likely resulting from surface carbonation caused by exposure to atmospheric CO
2 or secondary reactions [
61].
In the 800-700 cm
−1 region, bands characteristic of bending vibrations from symmetric Si–O–Si stretching were clearly defined in SSCS and CH samples [
60,
62]. Meanwhile, absorption features between 700 and 600 cm
−1 were associated with vibrations attributed to the existence of quartz in all three raw materials, aligning with the mineralogical data obtained through XRD analysis (
Figure 3) [
21,
63]. Finally, bands within the 523-418 cm
−1 range were associated with bending vibrations of Si–O bonds, representing the silicate tetrahedra found within the material matrices [
60].
Table 4 shows the summary of the characteristic spectral bands identified for each material and their corresponding vibrational attribution.
2.2. Mix Design and Methodology
The formulation of the geopolymers was based on the adaptation of a previously validated experimental design [
46]. The liquid/solid (L/S) and Na
2SiO
3/OSBA ratios were selected considering the porosity, morphology and specific surface of the precursor materials (SSCS and CH), factors that directly influence the water and activator demand to ensure adequate dispersion and interaction between the components. Thus, these proportions made it possible to obtain mixtures with good workability and optimum mechanical properties, minimizing undesirable phenomena such as efflorescence or excessive porosity. However, in order to optimize rheological conditions and curing time during casting, the liquid/solid (L/S) ratio was reduced. During the experimental phase, eight series of blends were developed: four corresponding to geopolymers formed by pressing (series P1, P2, P3, and P4) and four by casting (series C1, C2, C3, and C4). Each mixture was composed using varying proportions of SSCS, CH, OSBA, Na
2SiO
3, and distilled water (W
d).
The L/S ratios varied significantly depending on the forming method. In pressed geopolymers, the values ranged from 0.37 to 0.39, while in casting ones they ranged from 0.53 to 0.57. Similarly, the proportion of Na
2SiO
3 to OSBA remained in the range of 2.2 to 3.9. The amount of distilled water added was adjusted incrementally with increasing precursor and activator content, in order to maintain an adequate rheology of the system. This adjustment is caused by the porosity and specific surface characteristics of the solids used, factors that increase the water demand to achieve a homogeneous dispersion and facilitate the geopolymerization reaction [
57]. It should be noted that a common L/S ratio was not used for both forming methods, as each technique has different rheological requirements: the casting process needs more fluid mixtures to fill the molds efficiently, while pressing allows denser mixtures that allow adequate consolidation under pressure. For this reason, it was not feasible to maintain a constant L/S ratio between the two methods without compromising the feasibility of processing.
Table 5 shows the detailed proportions of the raw materials, as well as the Na
2SiO
3/OSBA, liquid/solid ratios, and the pH values obtained for each mixture. On the other hand,
Table 6 presents the Si/Al, K/Si, Na/Si, and Ca/Si molar proportions, fundamental parameters to understand the evolution of the microstructure and the formation of the geopolymeric matrix in both forming modes.
The alkaline activator was formulated from OSBA previously calcined at 950 °C, as described above, combined with Na2SiO3 and Wd, in varying proportions according to the experimental design. The preparation procedure consisted of the initial dissolution of OSBA in Wd, using a magnetic stirrer (model 690-1, Nahita, Auxilab S.L., Beriáin, Spain) for 10 min. Subsequently, Na2SiO3 was added in a controlled manner by dropwise addition, and stirring was maintained for an additional 10 min to ensure adequate homogenization of the activating solution.
The solid precursors (SSCS and CH) were mechanically homogenized in a planetary mixer (Proeti model, Proetisa S.A., Madrid, Spain) for 5 min. After that, the alkaline solution was slowly added on top of the precursor mixture, prolonging the stirring for 10 min until a uniform geopolymeric mass free of dry aggregates was obtained.
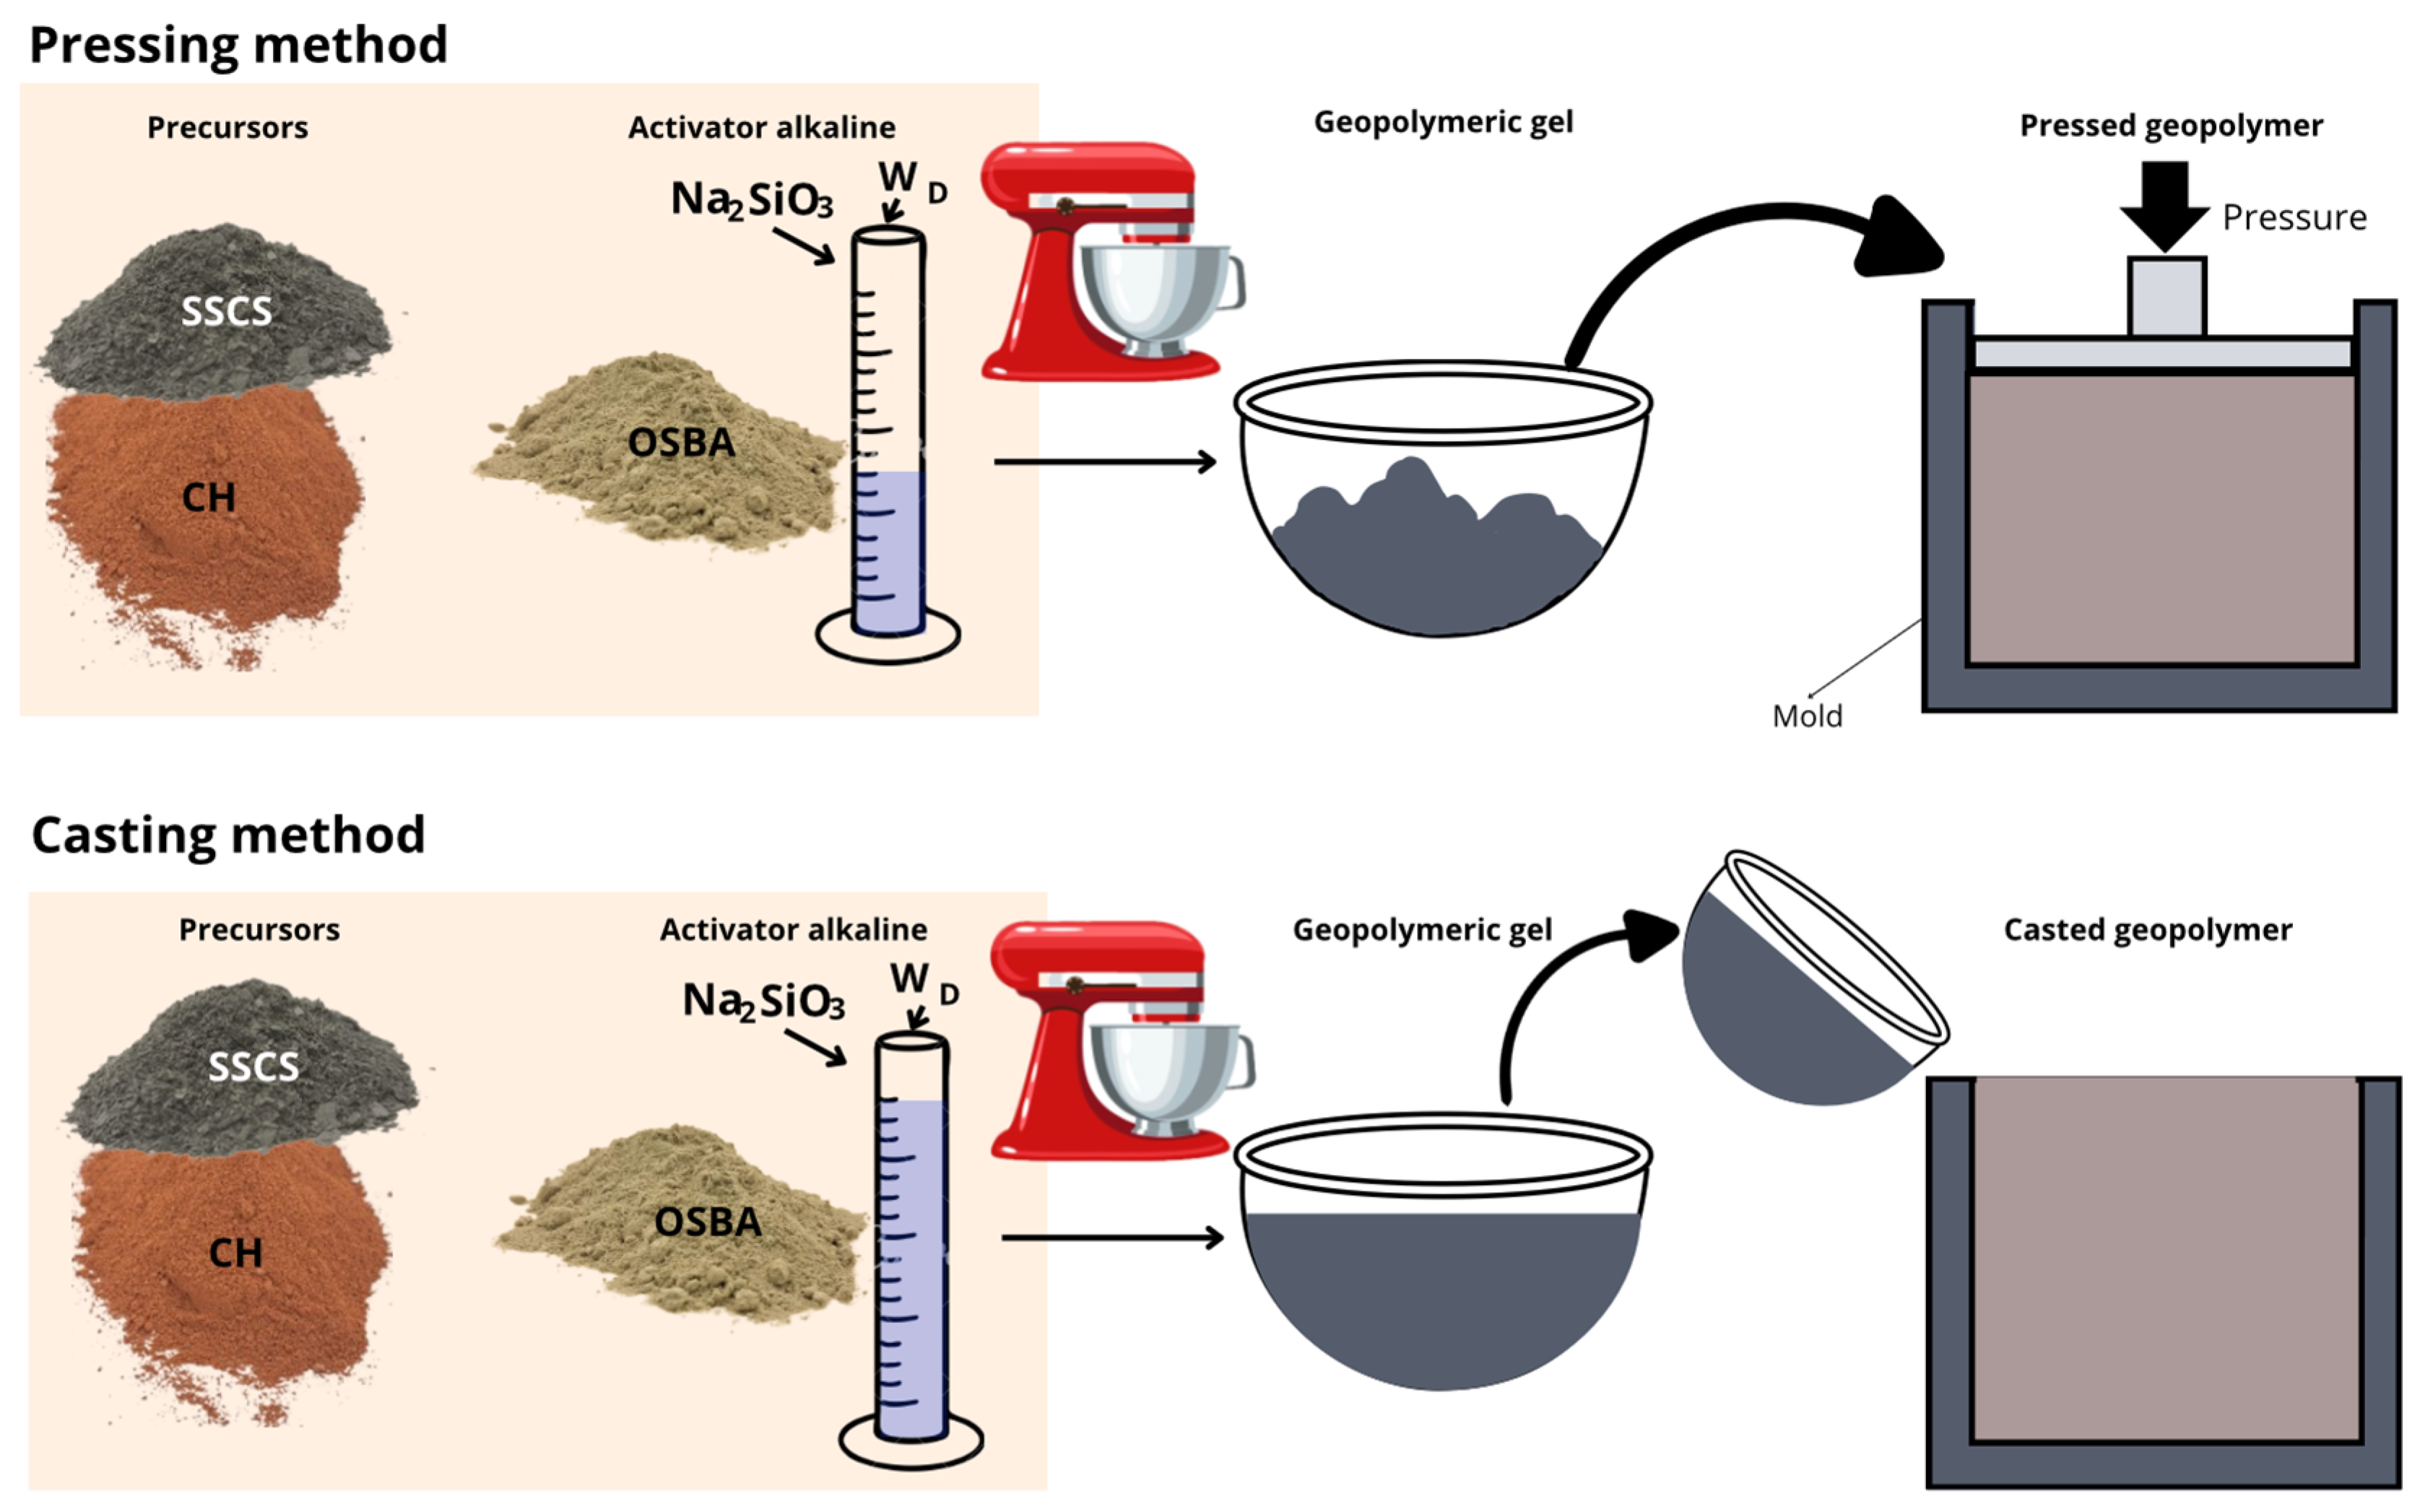
The consolidation of the geopolymeric material was carried out by two different methodologies: uniaxial press-molding and casting.
In the pressing method, the geopolymer paste was placed into a steel mold measuring 60 × 30 × 15 mm and compressed under a uniaxial pressure of 15 MPa for 10 s to densify the matrix and minimize initial porosity. The samples were demolded immediately after pressing and then cured at room temperature (21 ± 5 °C) for 28 days.
As for the casting method, the geopolymer mortar was casted into silicone molds with cubic geometry (35 × 35 × 35 mm). To minimize the formation of air occlusions and to favor a homogeneous distribution of the material, the molds were vibrated for 20 s on a vibrating table. The samples were demolded after 7 days of initial curing and then kept at room temperature (21 ± 5 °C) until 28 days of total curing were completed. For both methods, 7 specimens per family were produced.
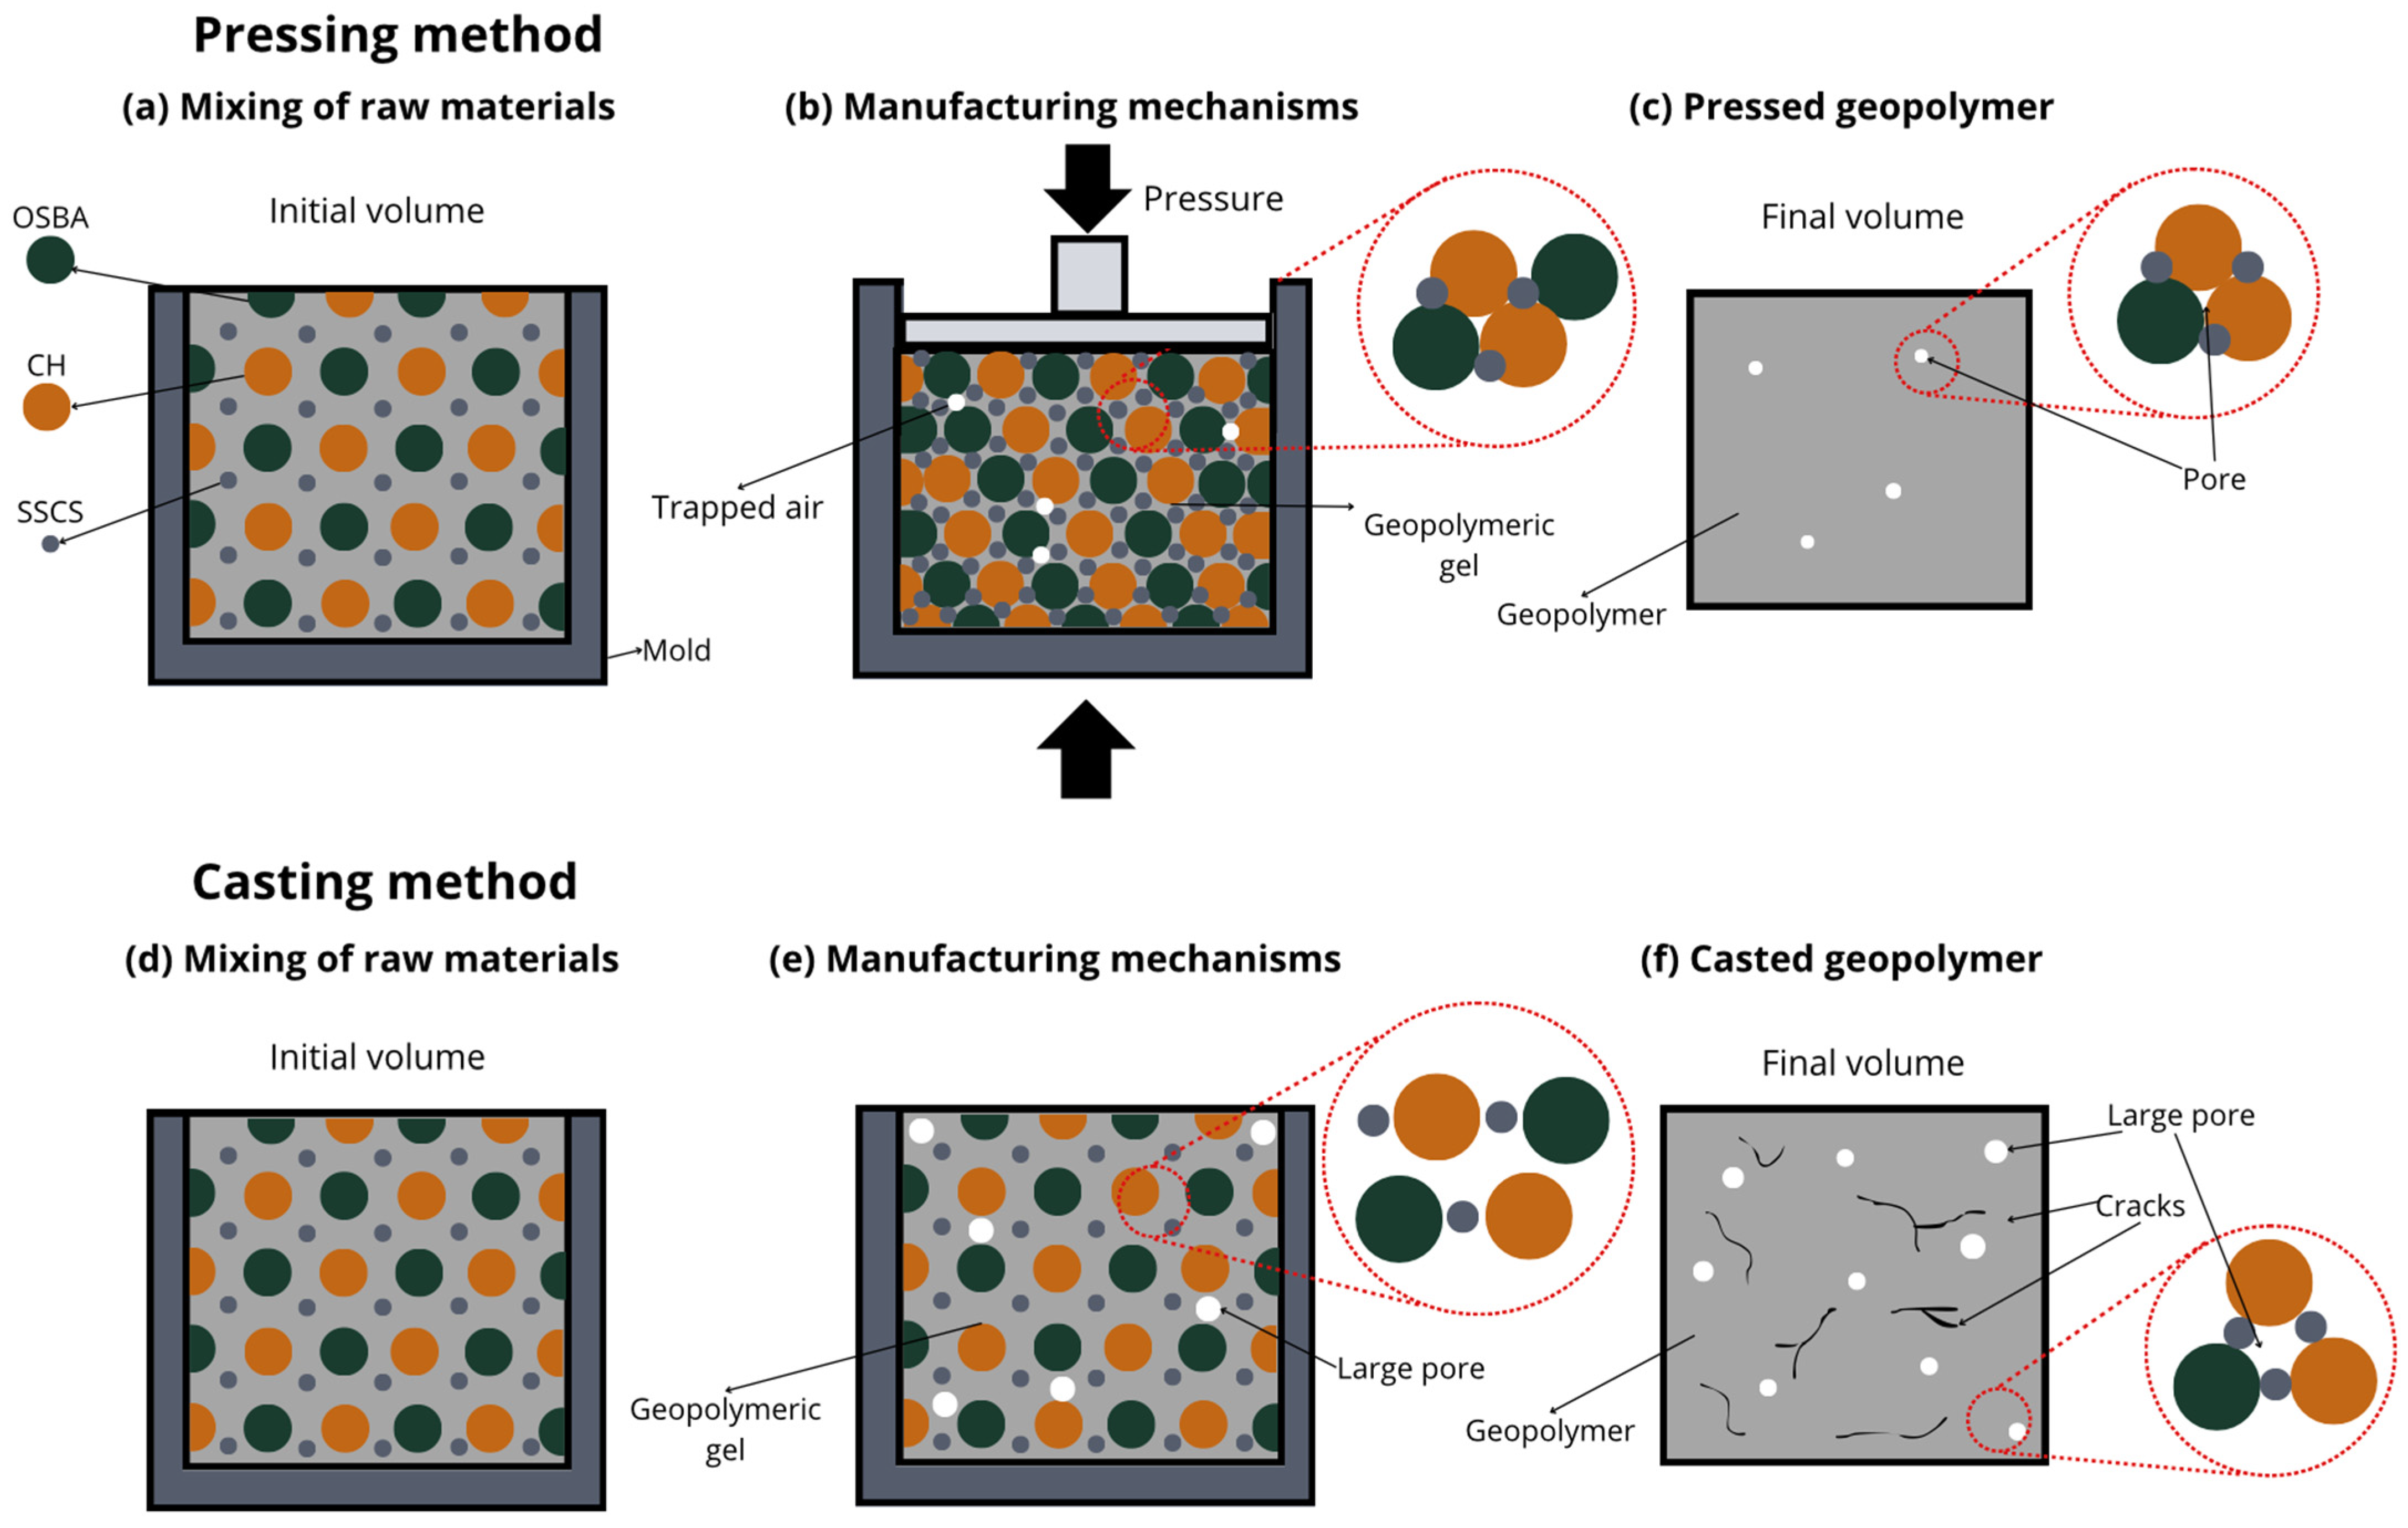
Figure 5 shows schematically the methodology followed for the preparation and forming of the geopolymers.
Figure 6 presents the microstructure evolution mechanisms of the geopolymers prepared by the two methodologies. The ease of handling the geopolymer mixture was not a key factor in the press-forming technique, as having too much liquid phase might cause the material to spill out of the mold during compaction. For this reason, a semi-dry consistency mix was used, which is more suitable for uniaxial pressing. During the pressing process, the application of pressure generated a progressive compaction of the mass, accompanied by a slight loss of pressure due to internal redistribution of particles. To counteract this effect and ensure adequate densification, it was necessary to keep the pressure constant for 10 s.
This consolidation process facilitated the reduction of porosity, promoting closer contact between the solid particles and improving the precursors’ contact with the alkaline solution. The high applied pressure favored the initial dissolution of the reactive phases, increasing the liberation of ionic species as Si
4+ and Al
3+ [
36], which are crucial for the forming of three-dimensional aluminosilicate networks characteristic of geopolymer gels. In addition, the moderate proportion of activators in the mixture prevented cracking phenomena related to premature evaporation of water during curing, improving the structural integrity of the gels.
In the forming process by casting the geopolymer mortar, the formability of the mixtures was increased by increasing the L/S ratio to ensure adequate flowability and to allow for the complete filling of the molds. To this end, the alkaline activator content of the C mixes was increased. However, excess alkaline activator can cause the formation of micro-cracks caused by the fast evaporation of free water during the setting and curing stages. This loss of water generates internal stresses that compromise the integrity of the hardened matrix. In addition, the absence of external pressure during casting-in-mold forming results in weaker packing of solid particles, which limits the proximity between the precursors and the alkaline activator. This mechanism decreases the efficiency of the initial dissolution and consequently results in a lower degree of geopolymeric conversion. Consequently, a higher proportion of unreacted particles and a more porous microstructure appear, which negatively affects the density, mechanical strength, and durability of the material compared to the properties obtained in press-formed geopolymers.
Both pressing and casting geopolymers were tested under the standards and equipment listed in
Table 7 to evaluate their properties.
The test plan was divided into physical, chemical, mechanical, and microscopic characterization. The physical characterization of the geopolymer mortar consisted of tests to determine the mass loss and linear shrinkage (UNE-EN 772-16 [
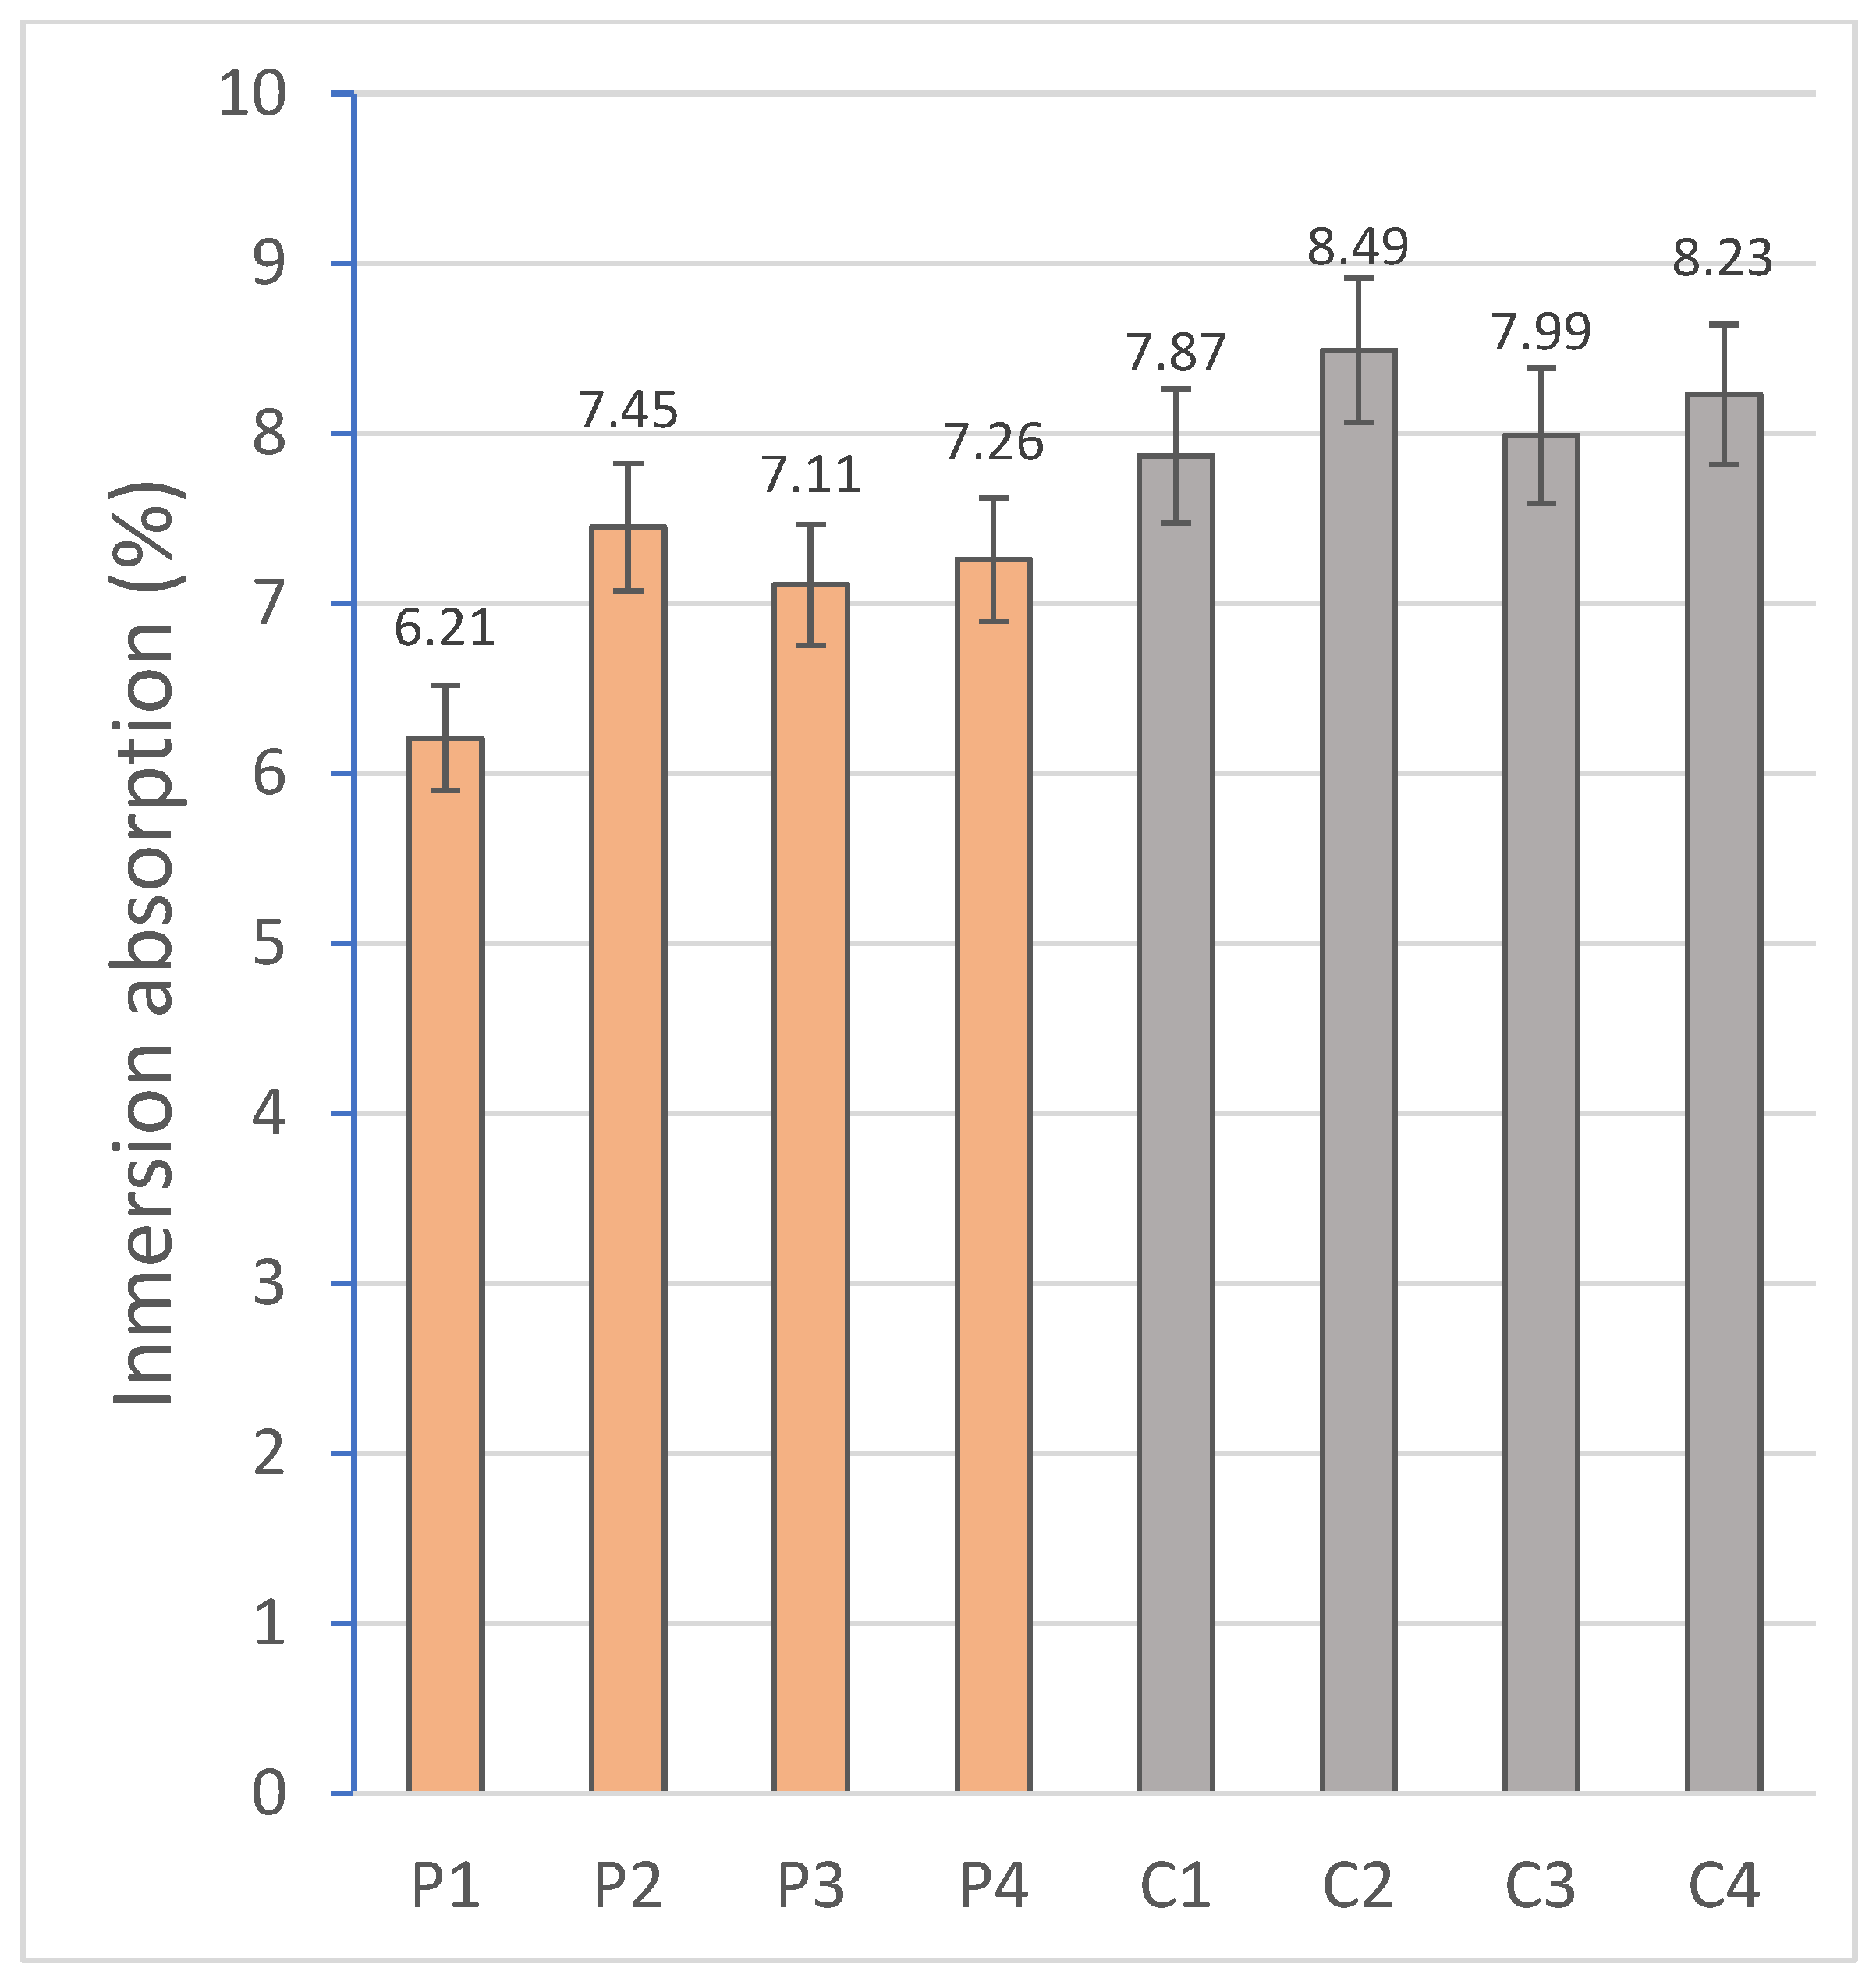
64]) experienced during curing of the specimens, percentage of water absorbed by capillary action (UNE-EN 772-11 [
65]) and immersion (UNE-EN 772-21 [
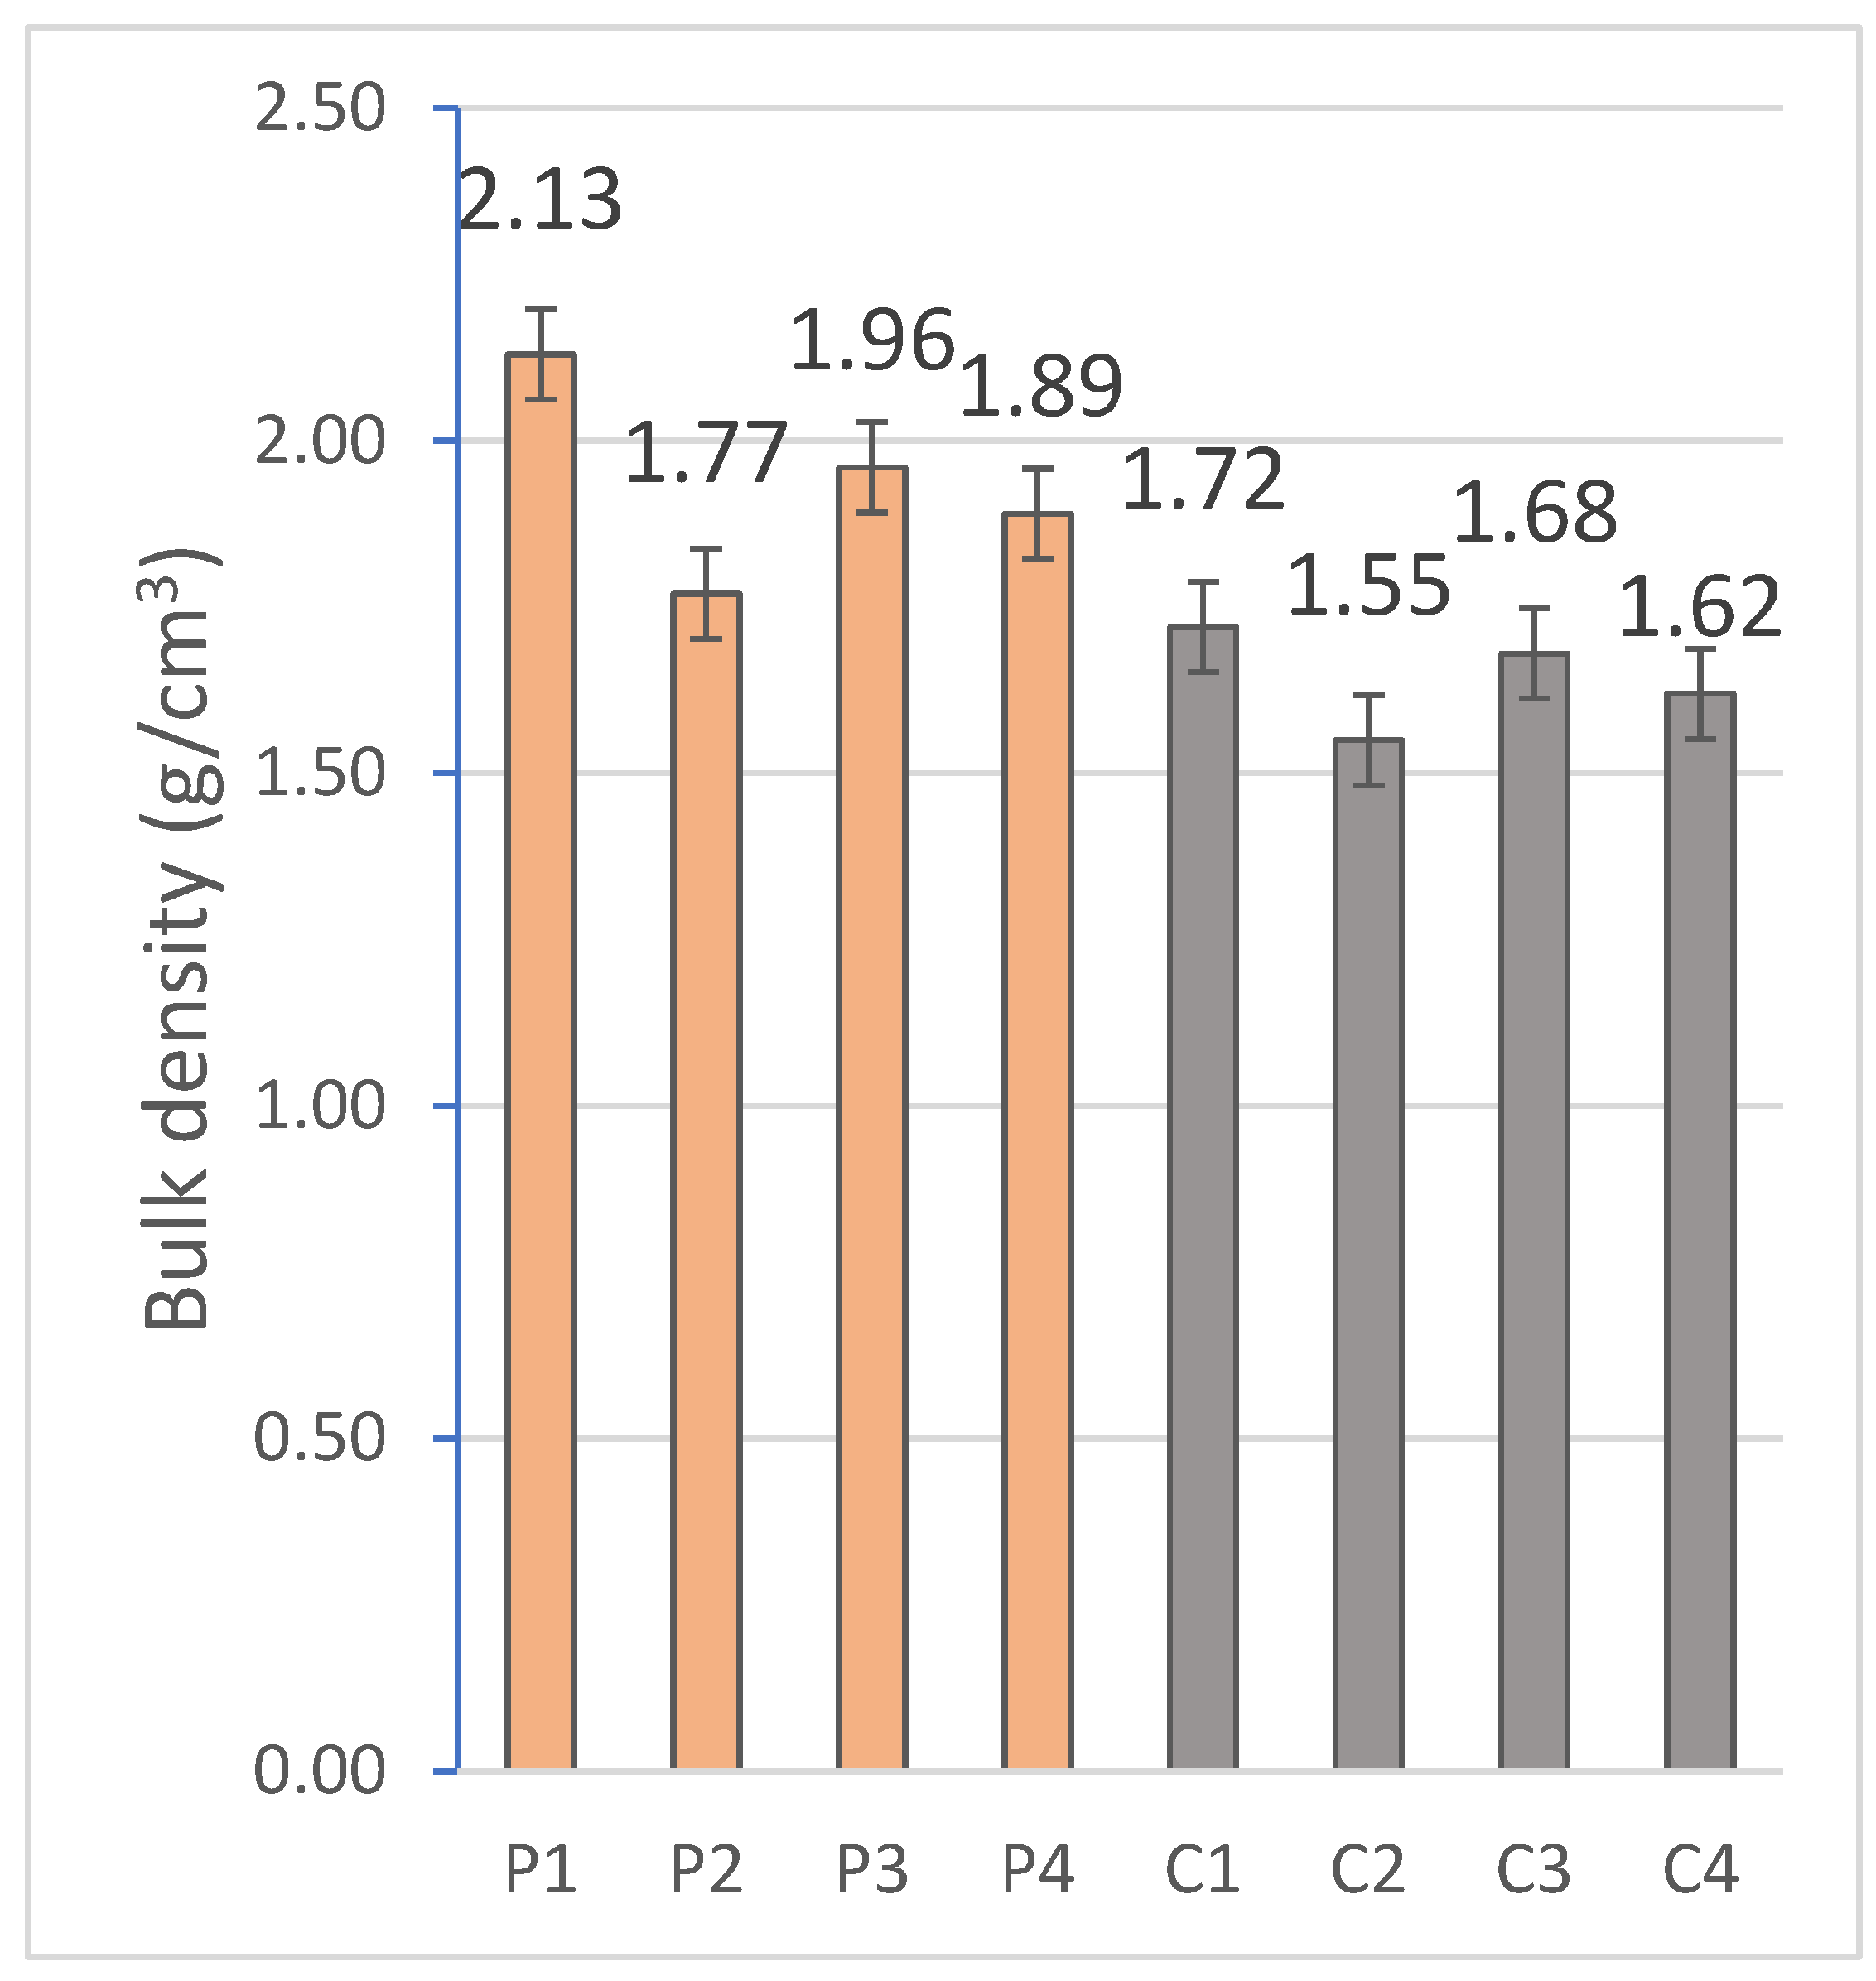
66]), bulk density (UNE-EN 772-4 [
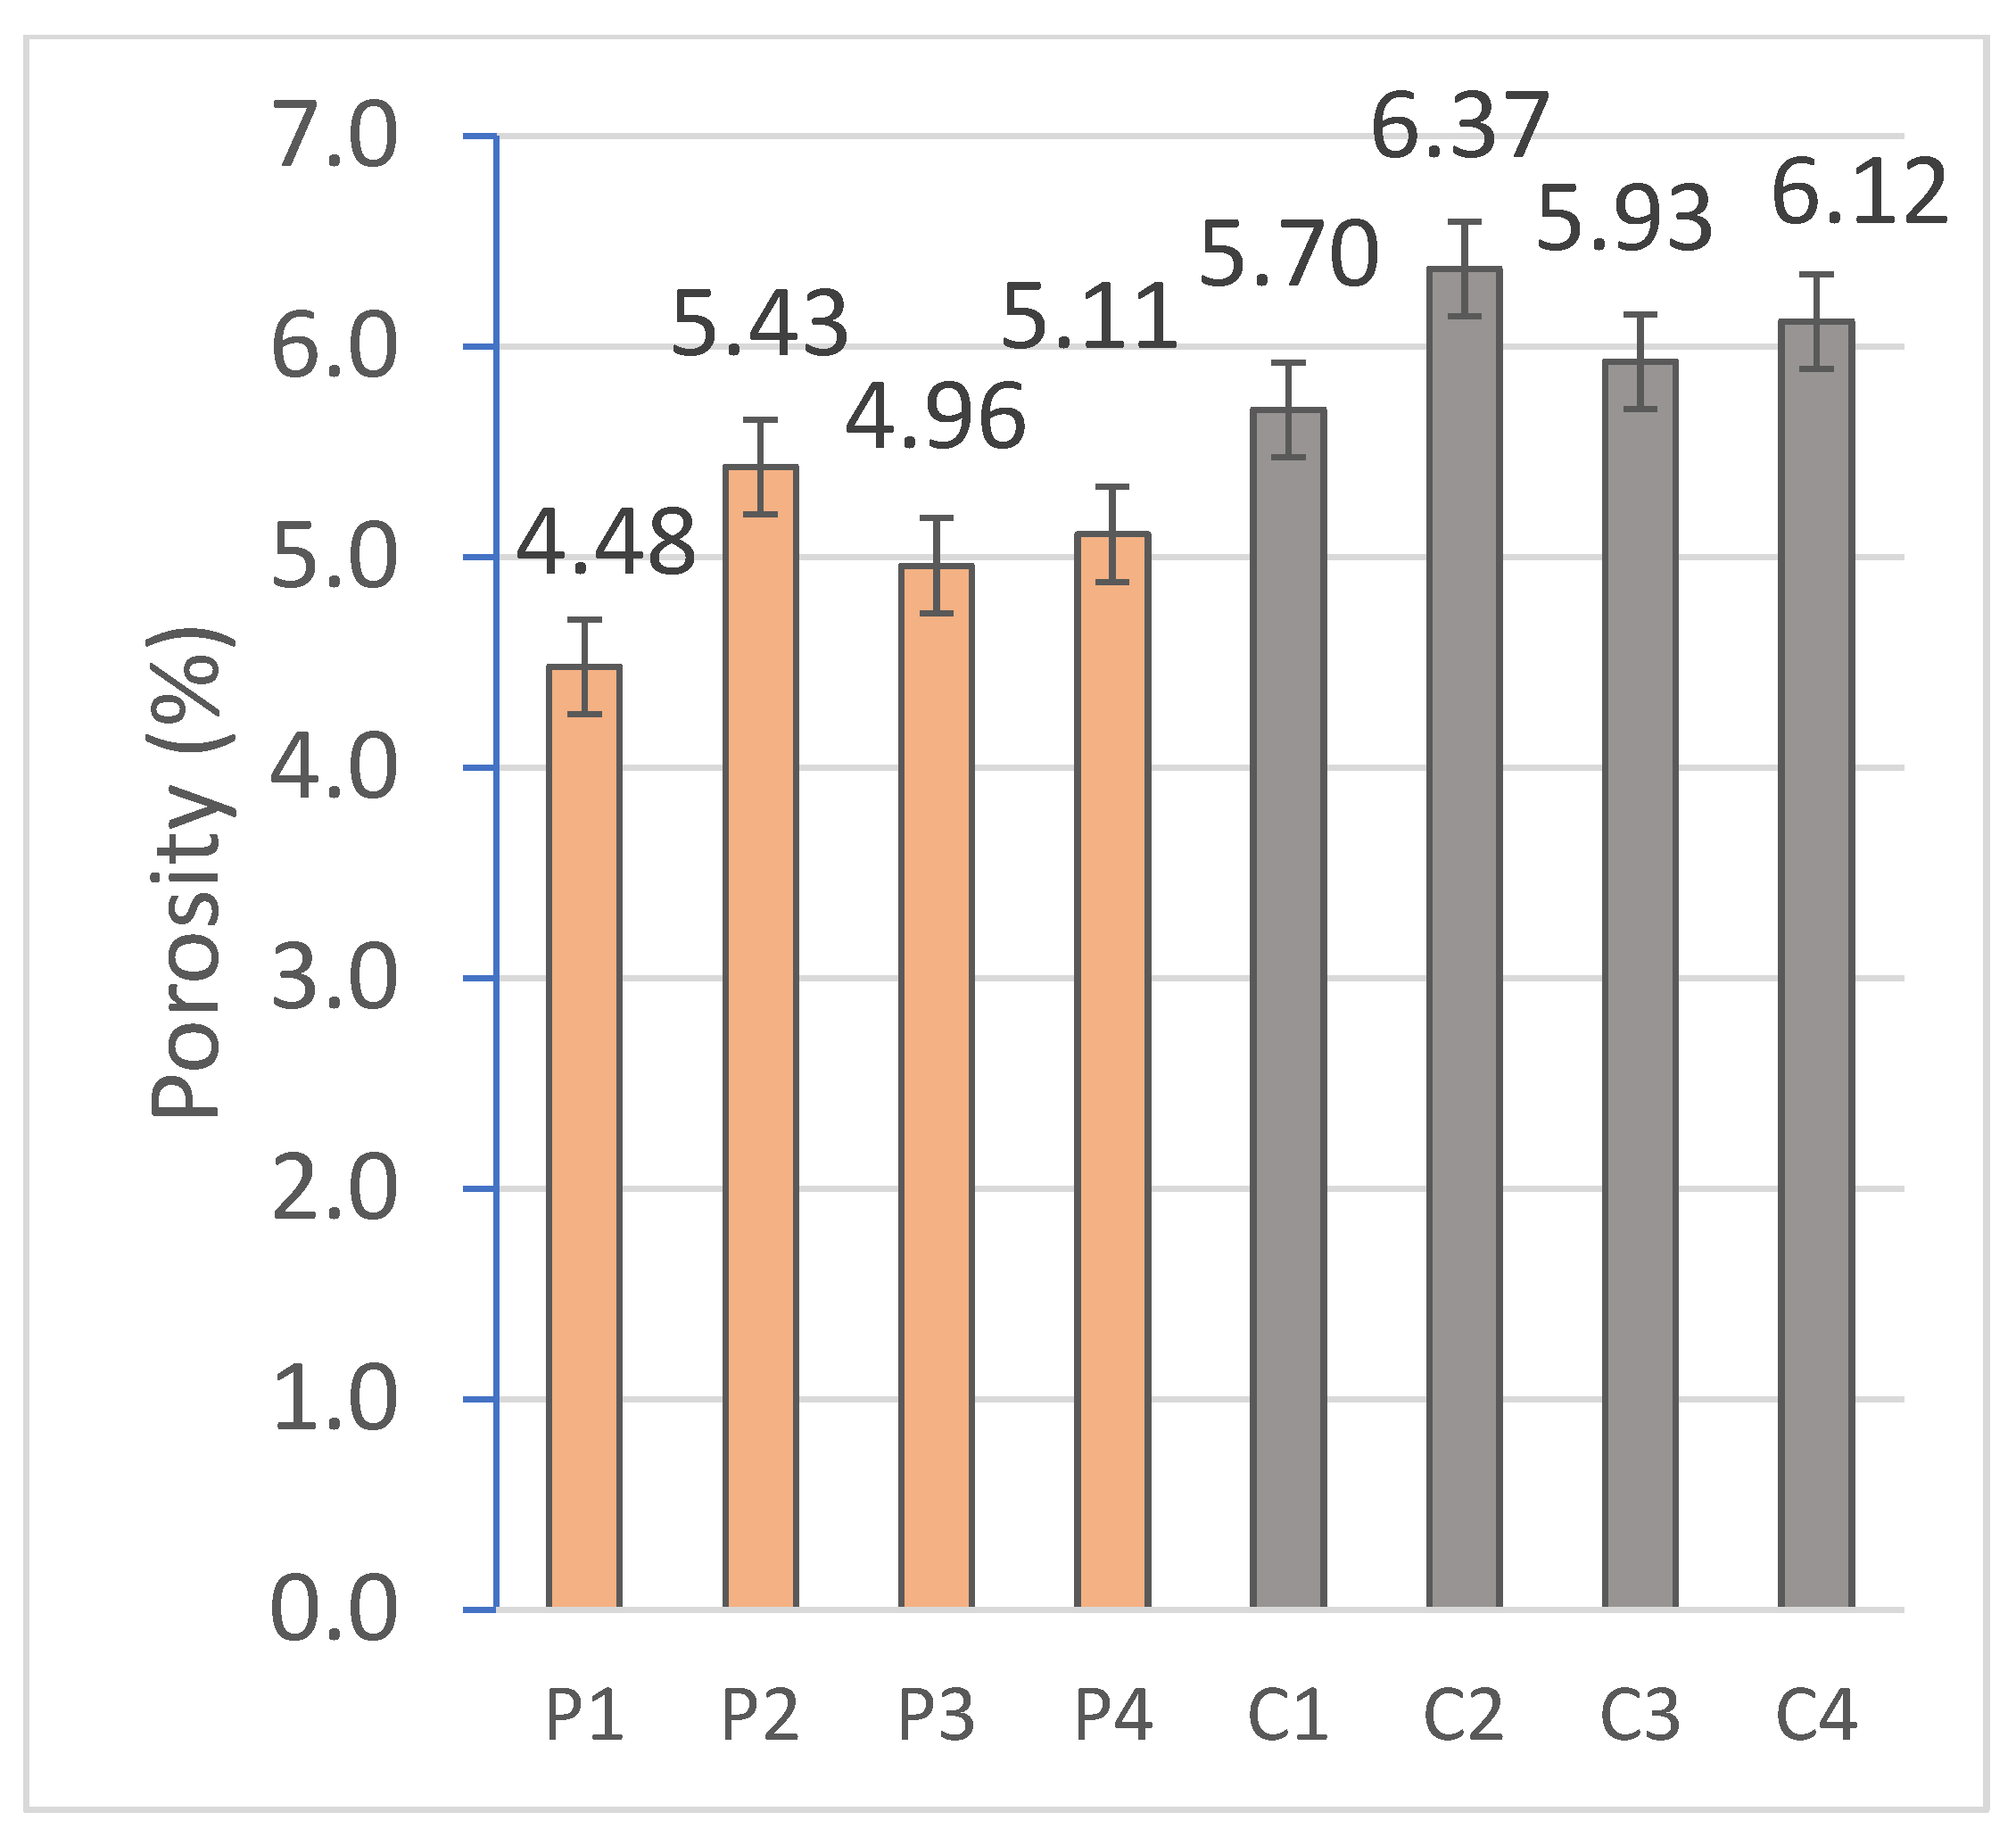
68]), porosity (UNE-EN 772-4 [
68]), thermal conductivity (UNE-EN 12667: 2002 [
70]) and evaluations of the condition of the specimens after freeze–thaw episodes (UNE-EN 15304 [
69]), and efflorescence produced in the presence of moisture (UNE 136029 [
72]). Fire resistance was studied under the UNE-ES 13238:2011 [
73] and UNE-EN ISO 11925-2 [
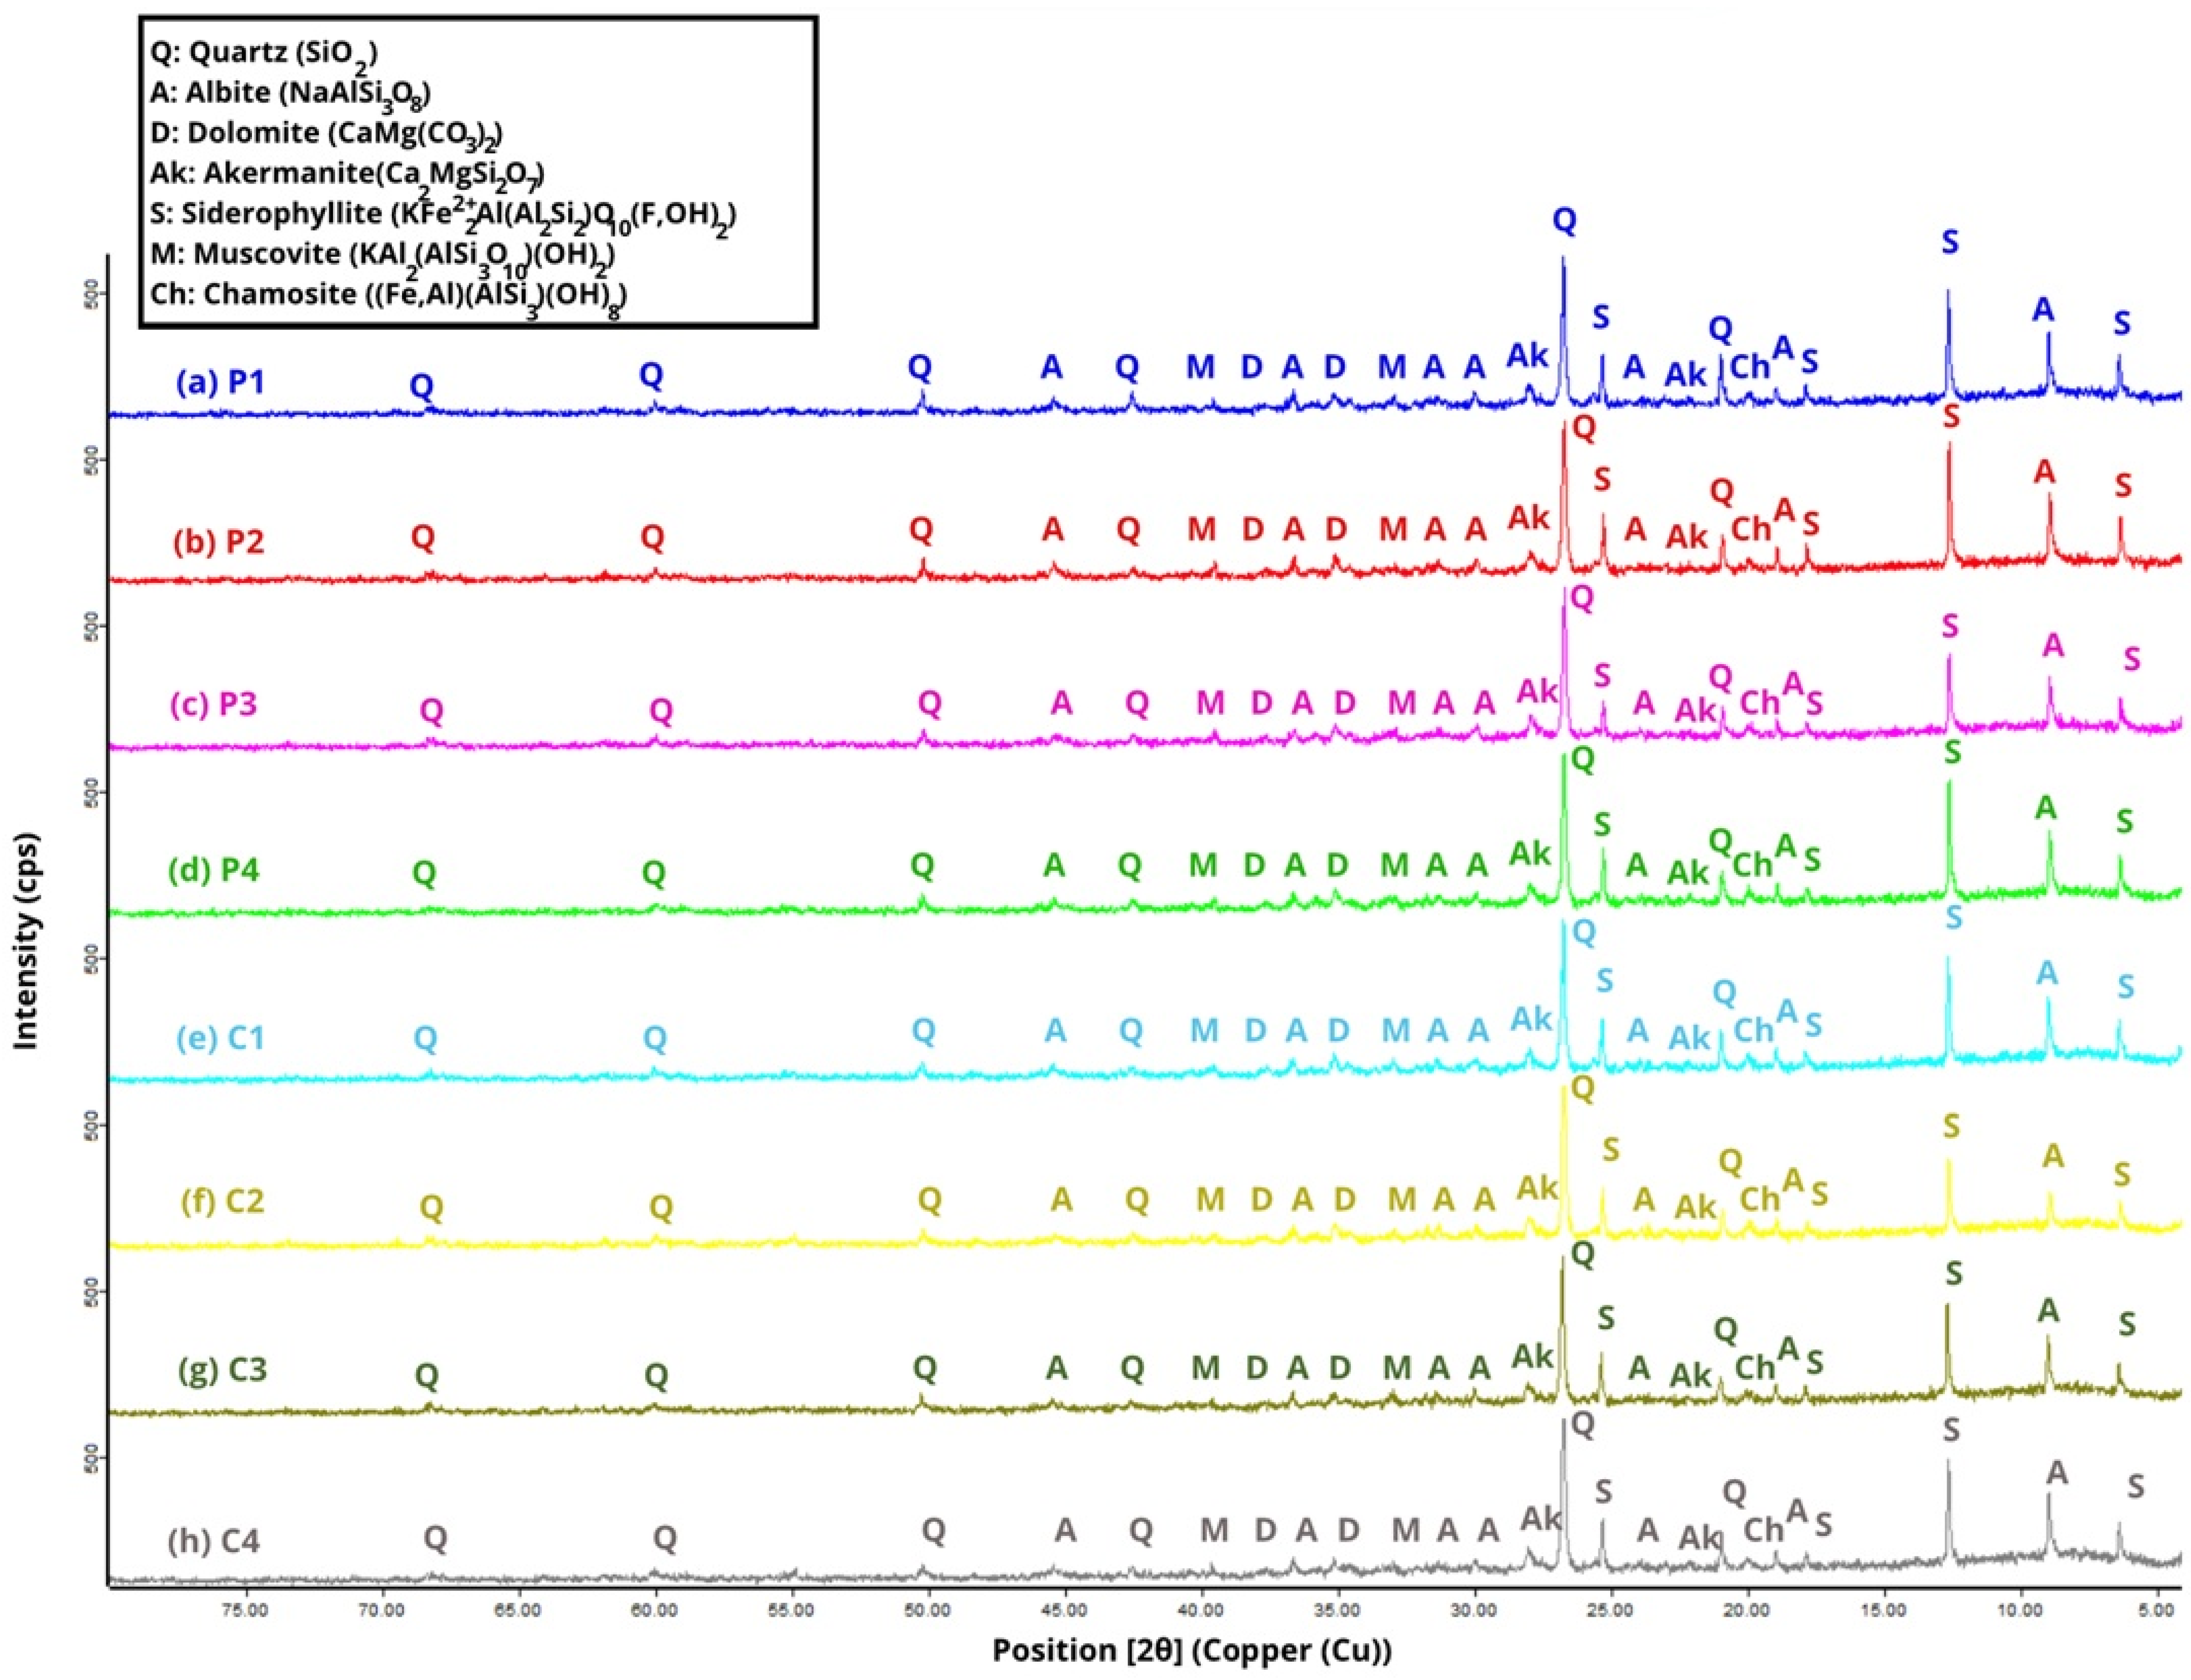
74] standards. The chemical characterization focused on FTIR and XRD analysis of the geopolymer mortar, while the mechanical characterization consisted of the identification of compressive strength (UNE-EN 772-1:2001+A1:2016 [
71]). Finally, the microscopic characterization focused on a microstructural analysis by microscopy.
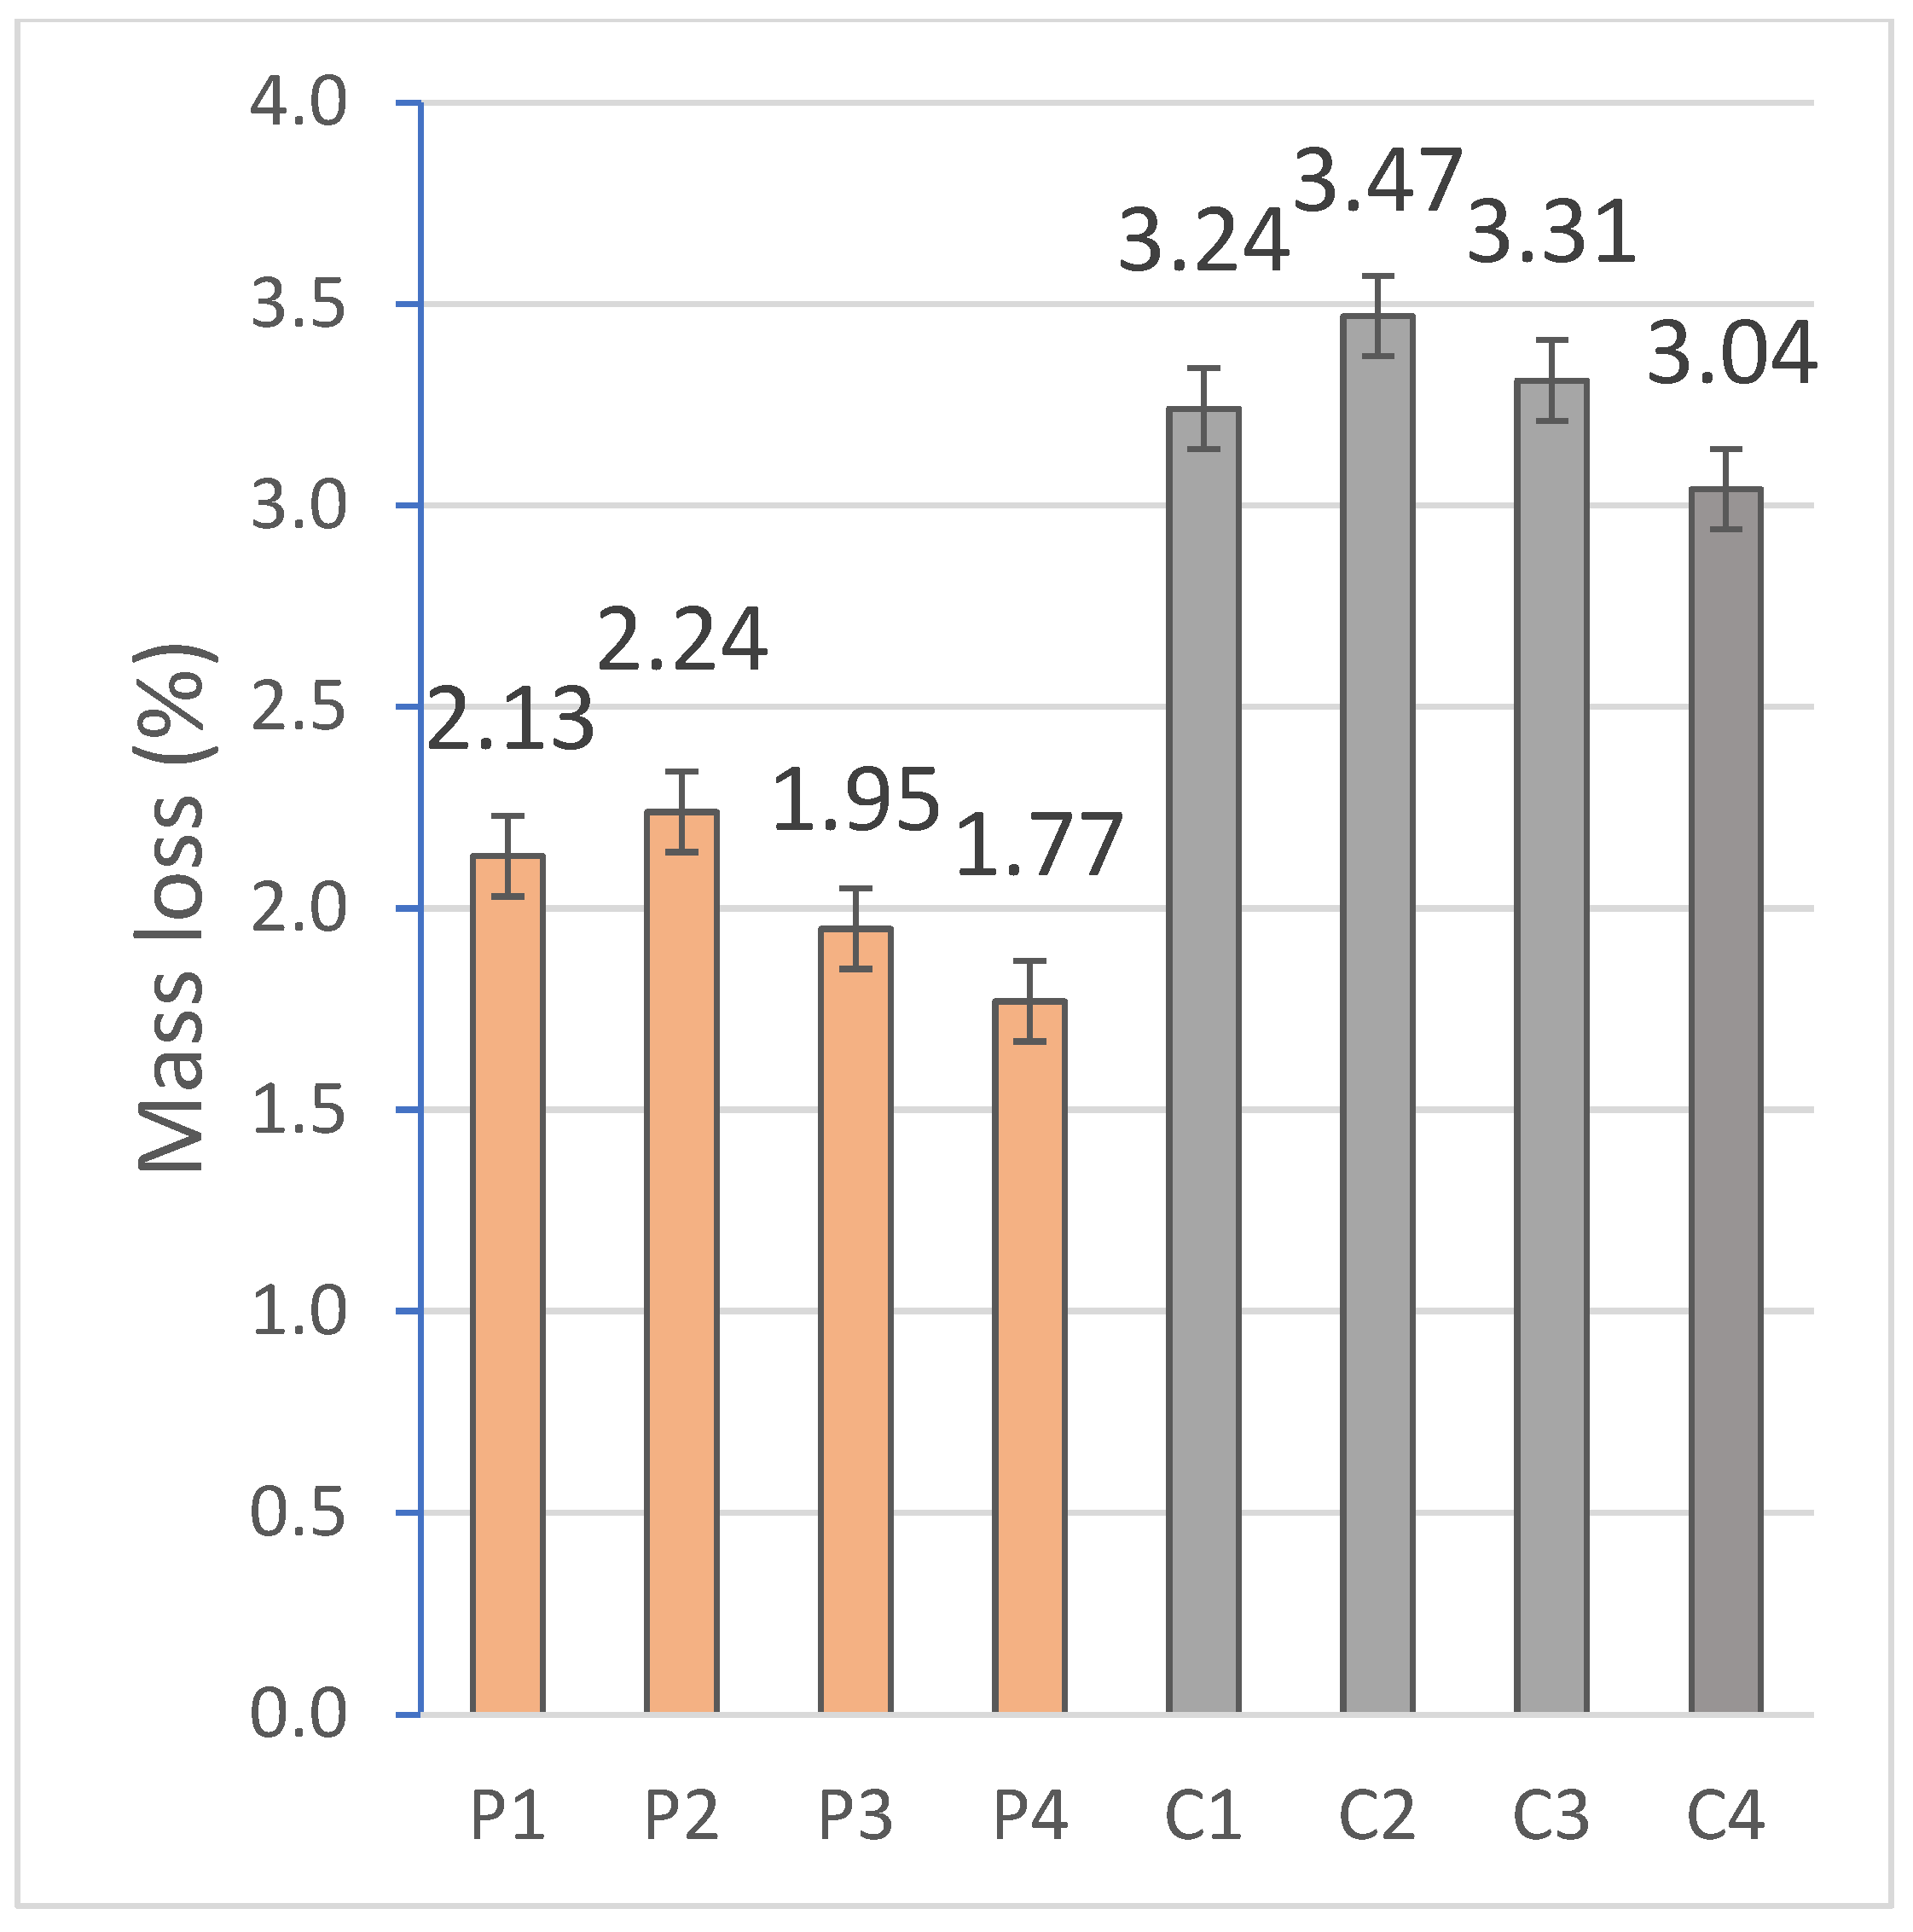
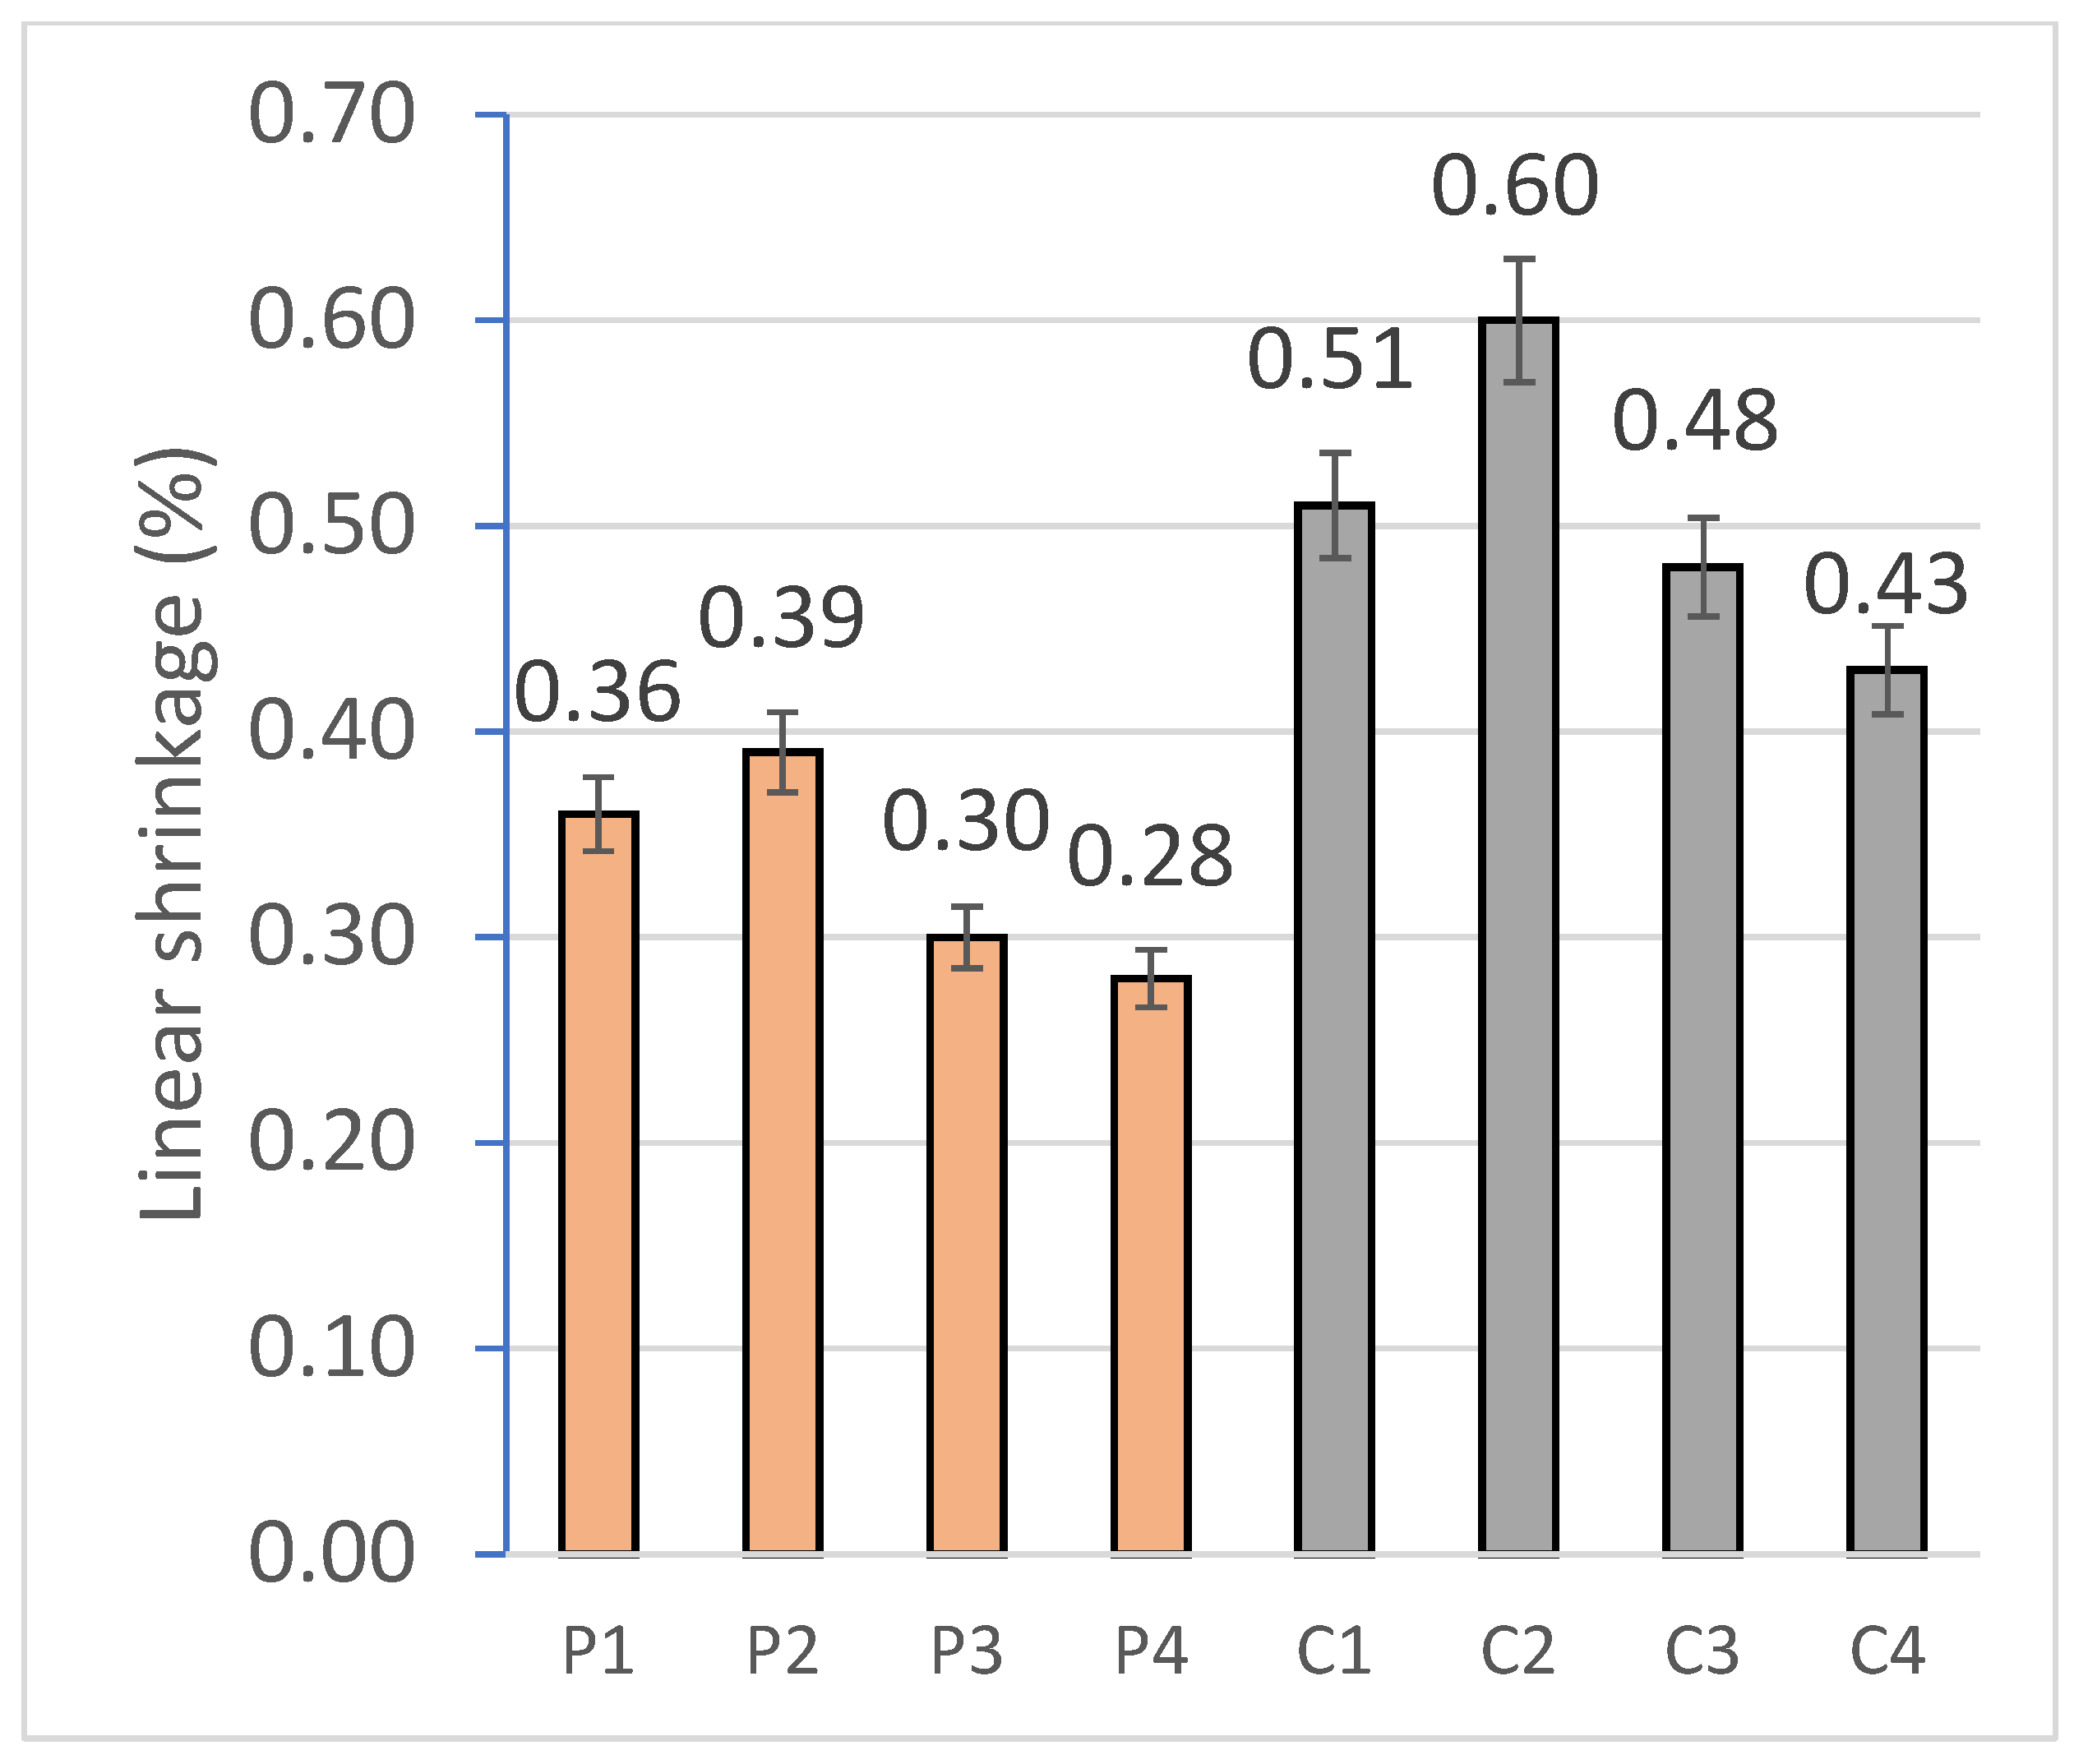
2.2.1. Mass Loss and Linear Shrinkage
For the physical characterization of the geopolymer, 6 specimens per family were tested. The mass variation observed in the specimens is mainly related with the loss of free water after the curing process [
75]. The mass loss was quantified on the RB-30KG Cobos scale by the difference between the beginning and ending weight of the specimens, and the dimensional variation was carried out, using a digital caliper, from the difference between the longitudinal measurements before and after curing under controlled conditions.
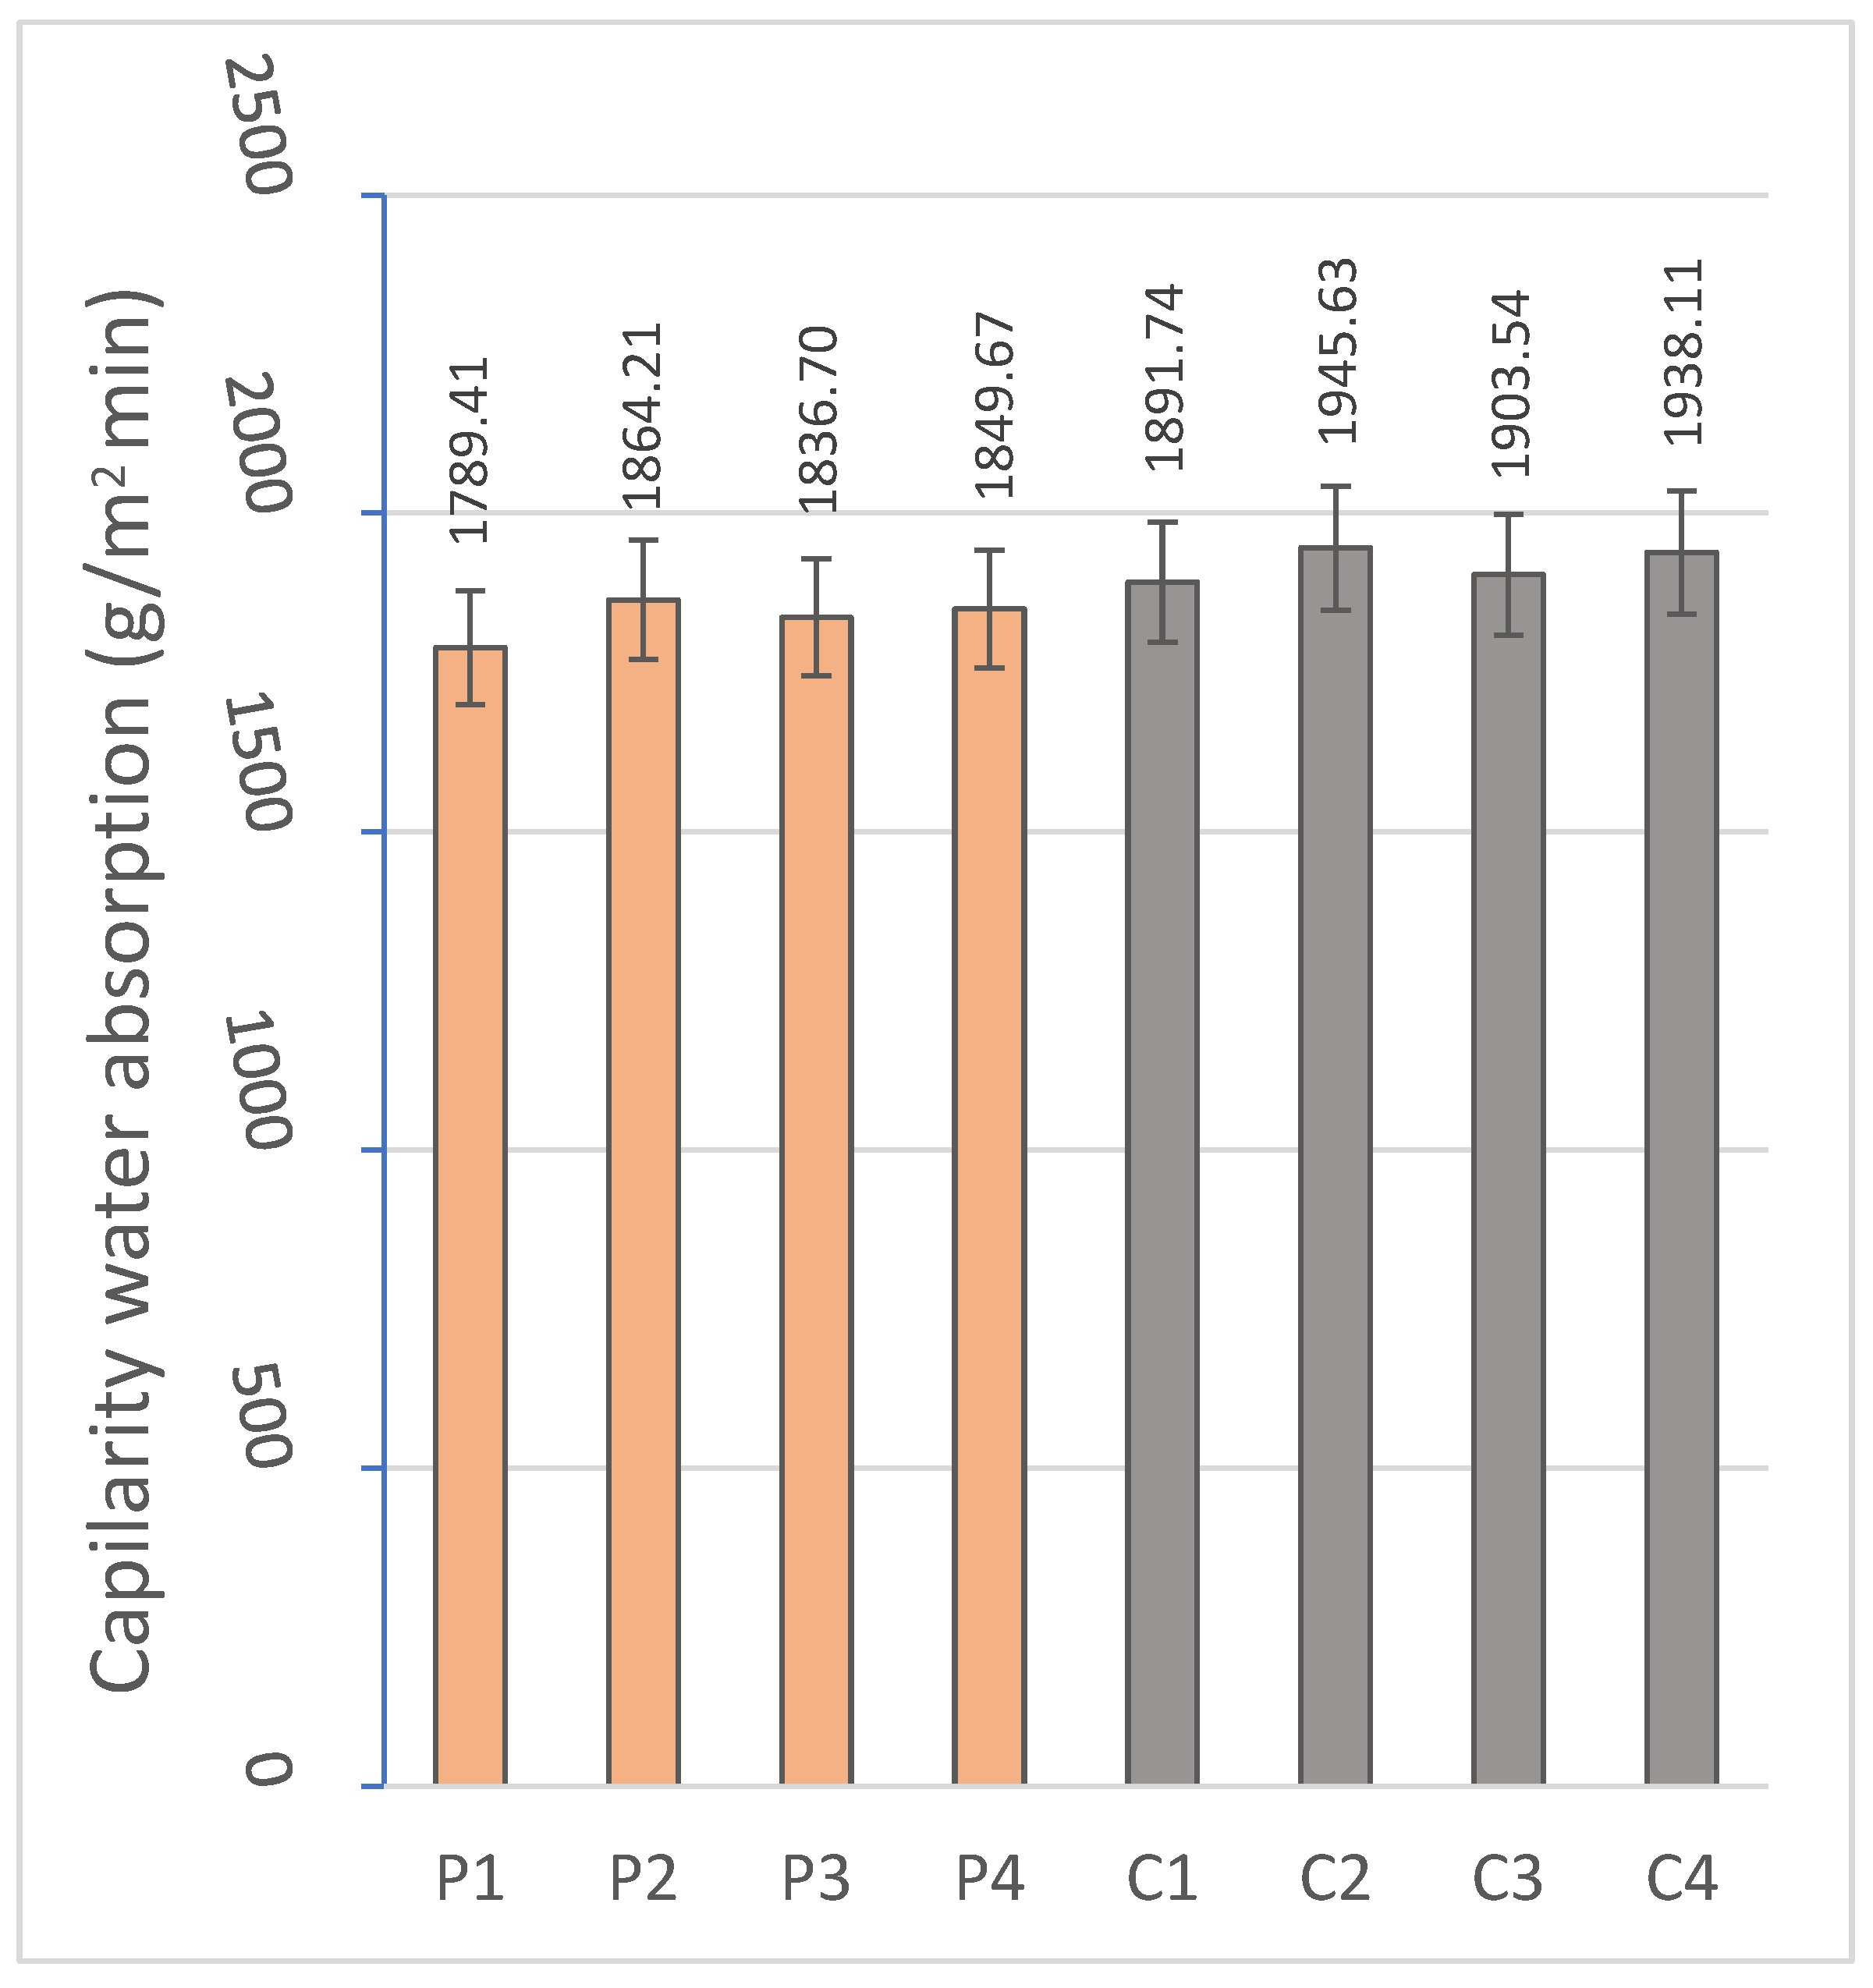
2.2.2. Capillary and Immersion Water Absorption, Bulk Density, Open and Closed Porosity
The hygroscopic behavior of the materials was evaluated by means of water absorption tests by capillarity and total immersion. For this purpose, the RB-30KG Cobos precision balance (resolution 0.001 g) was used, and measurements were taken after specific periods of exposure to water in a thermostatic bath, following the standardized methodologies indicated in
Table 7.
Capillary absorption provides critical information on the performance of the material in environments exposed to intermittent humidity or variable climatic conditions. On the other hand, the identification of the immersion absorption makes it possible to evaluate the maximum degree of water saturation achievable by the material. Both parameters are influenced by the microstructural properties of the material [
76].
Finally, the open porosity and density of the material were obtained by the hydrostatic method, based on the submerged mass and the mass saturated in water, which allows an accurate estimation of the accessible porosity and the density at the real volume of the system.
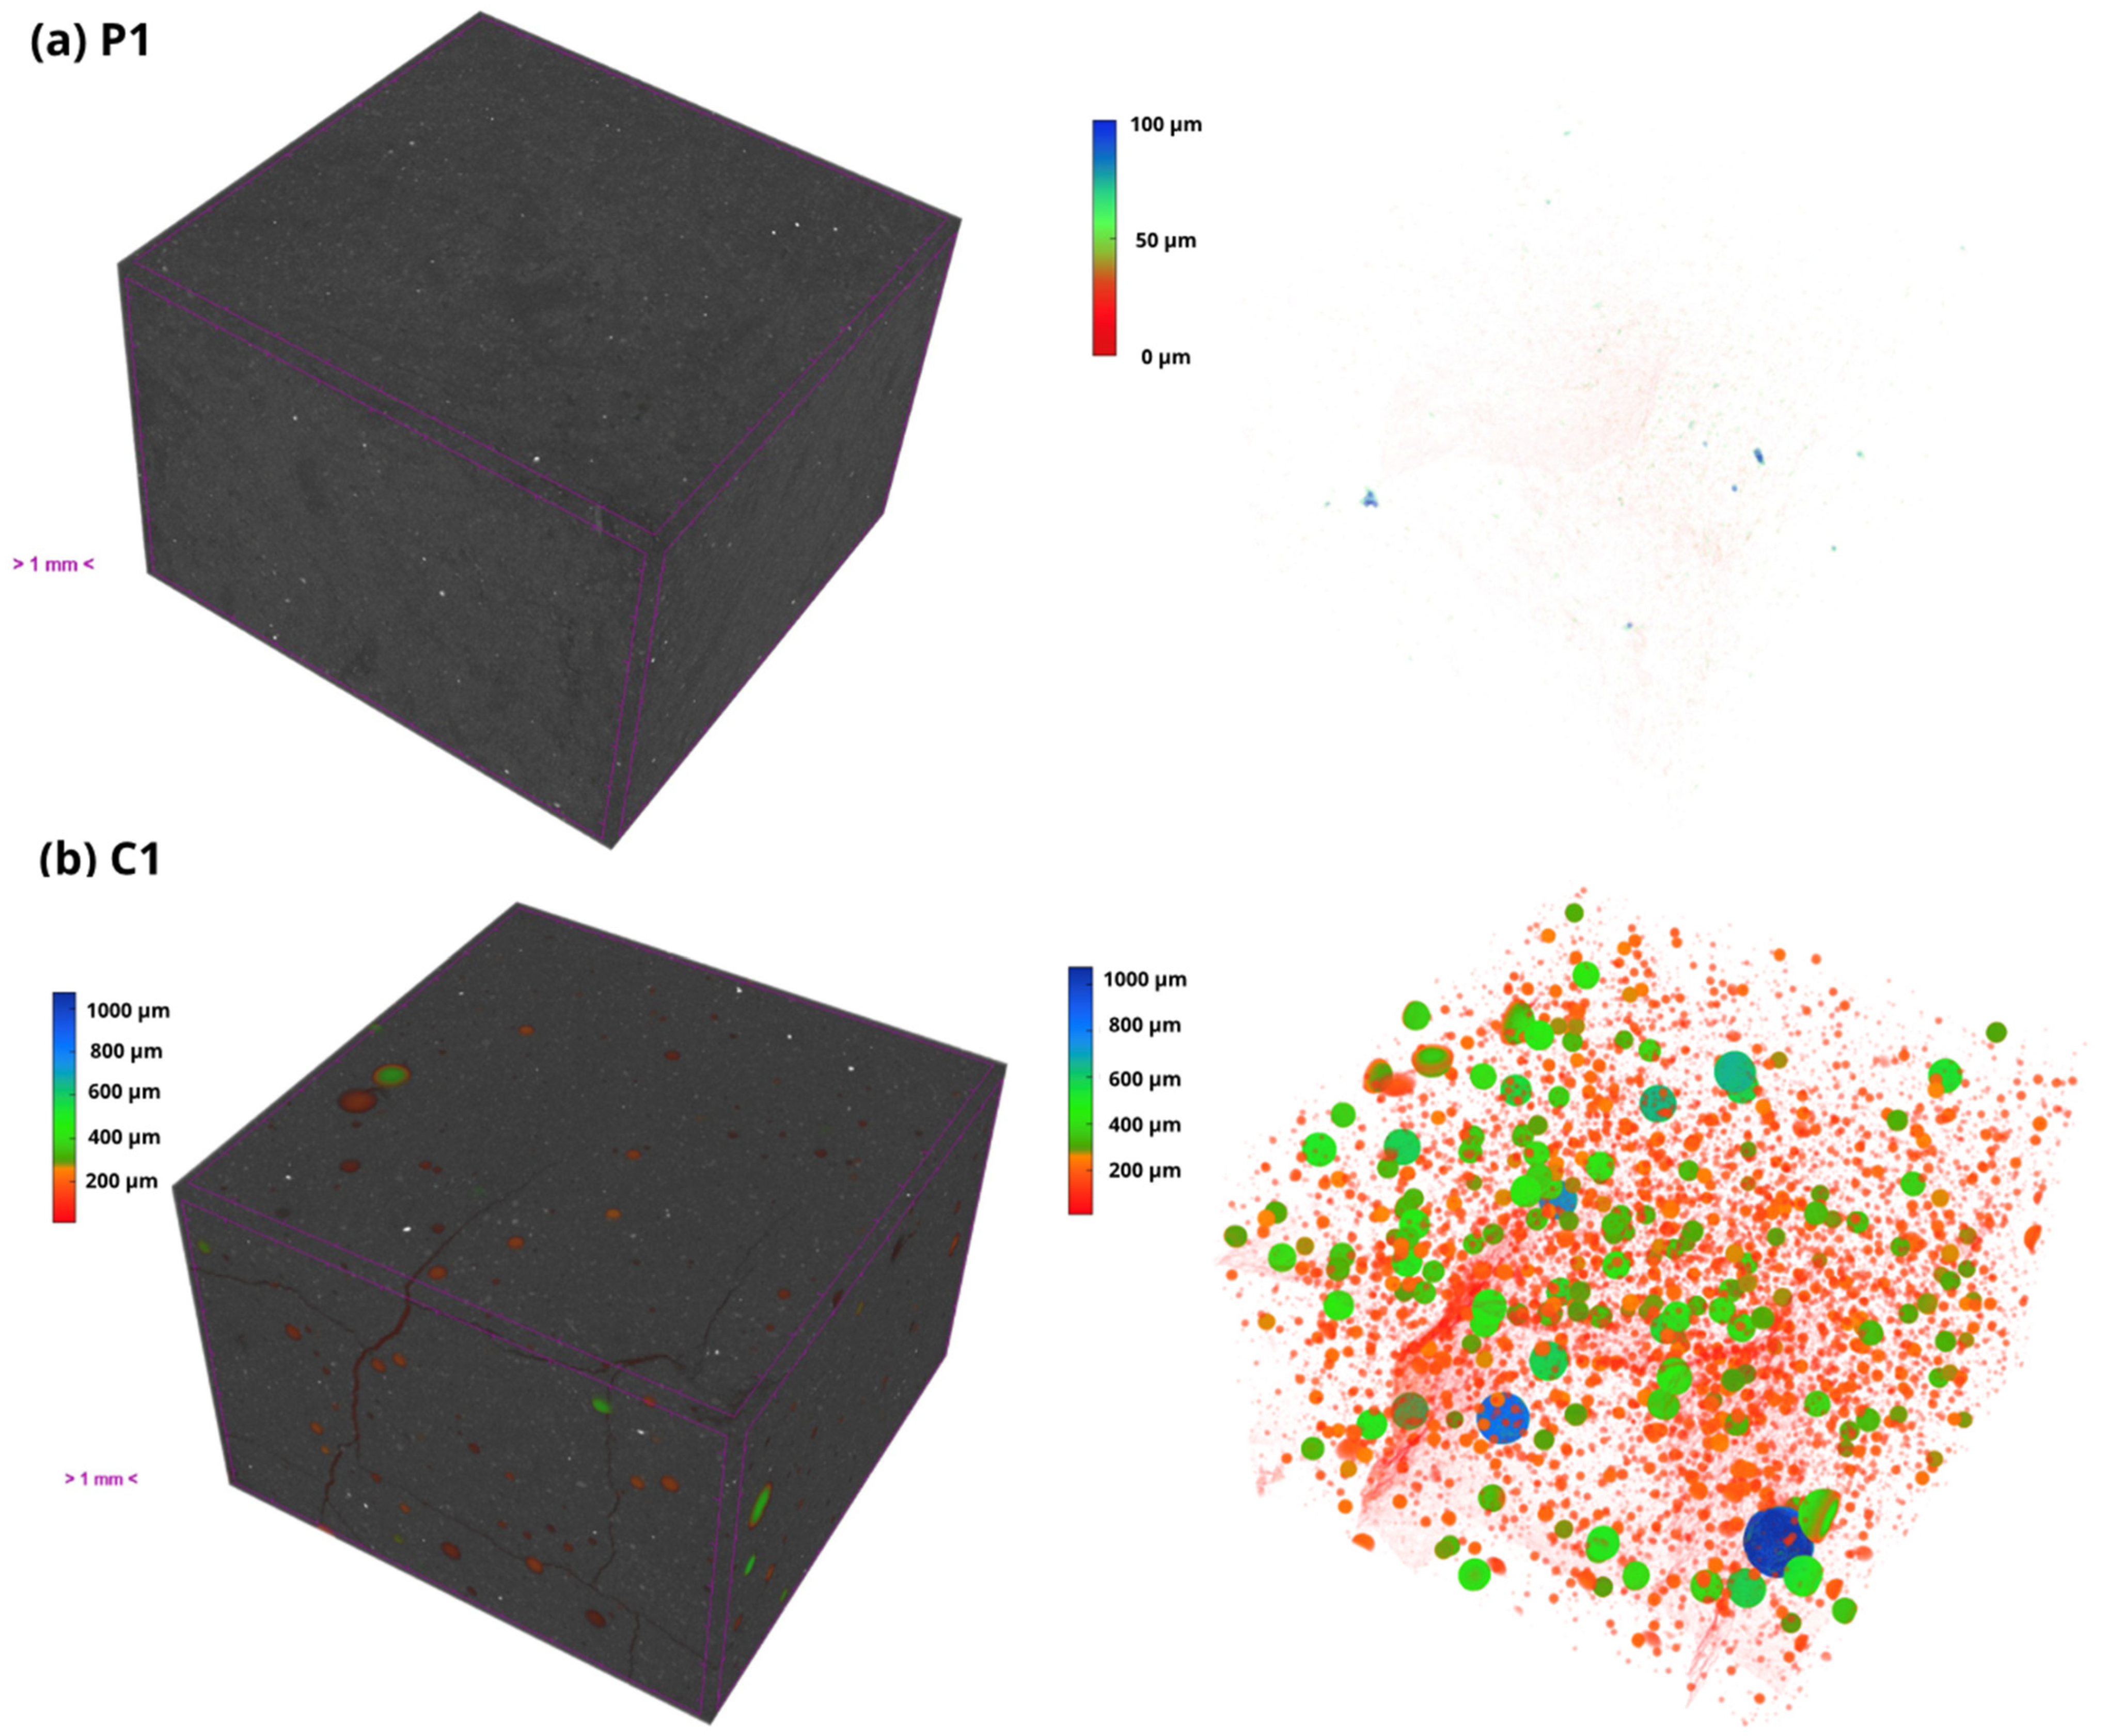
On the other hand, the closed porosity was determined by tomography on Bruker’s Skyscan 2214 equipment (Bruker AXS GmbH) with a voxel size of 5.6 μm. The exposure time was 1.3 s; the rotation size was 0.4°, and the number of projections taken was 901.
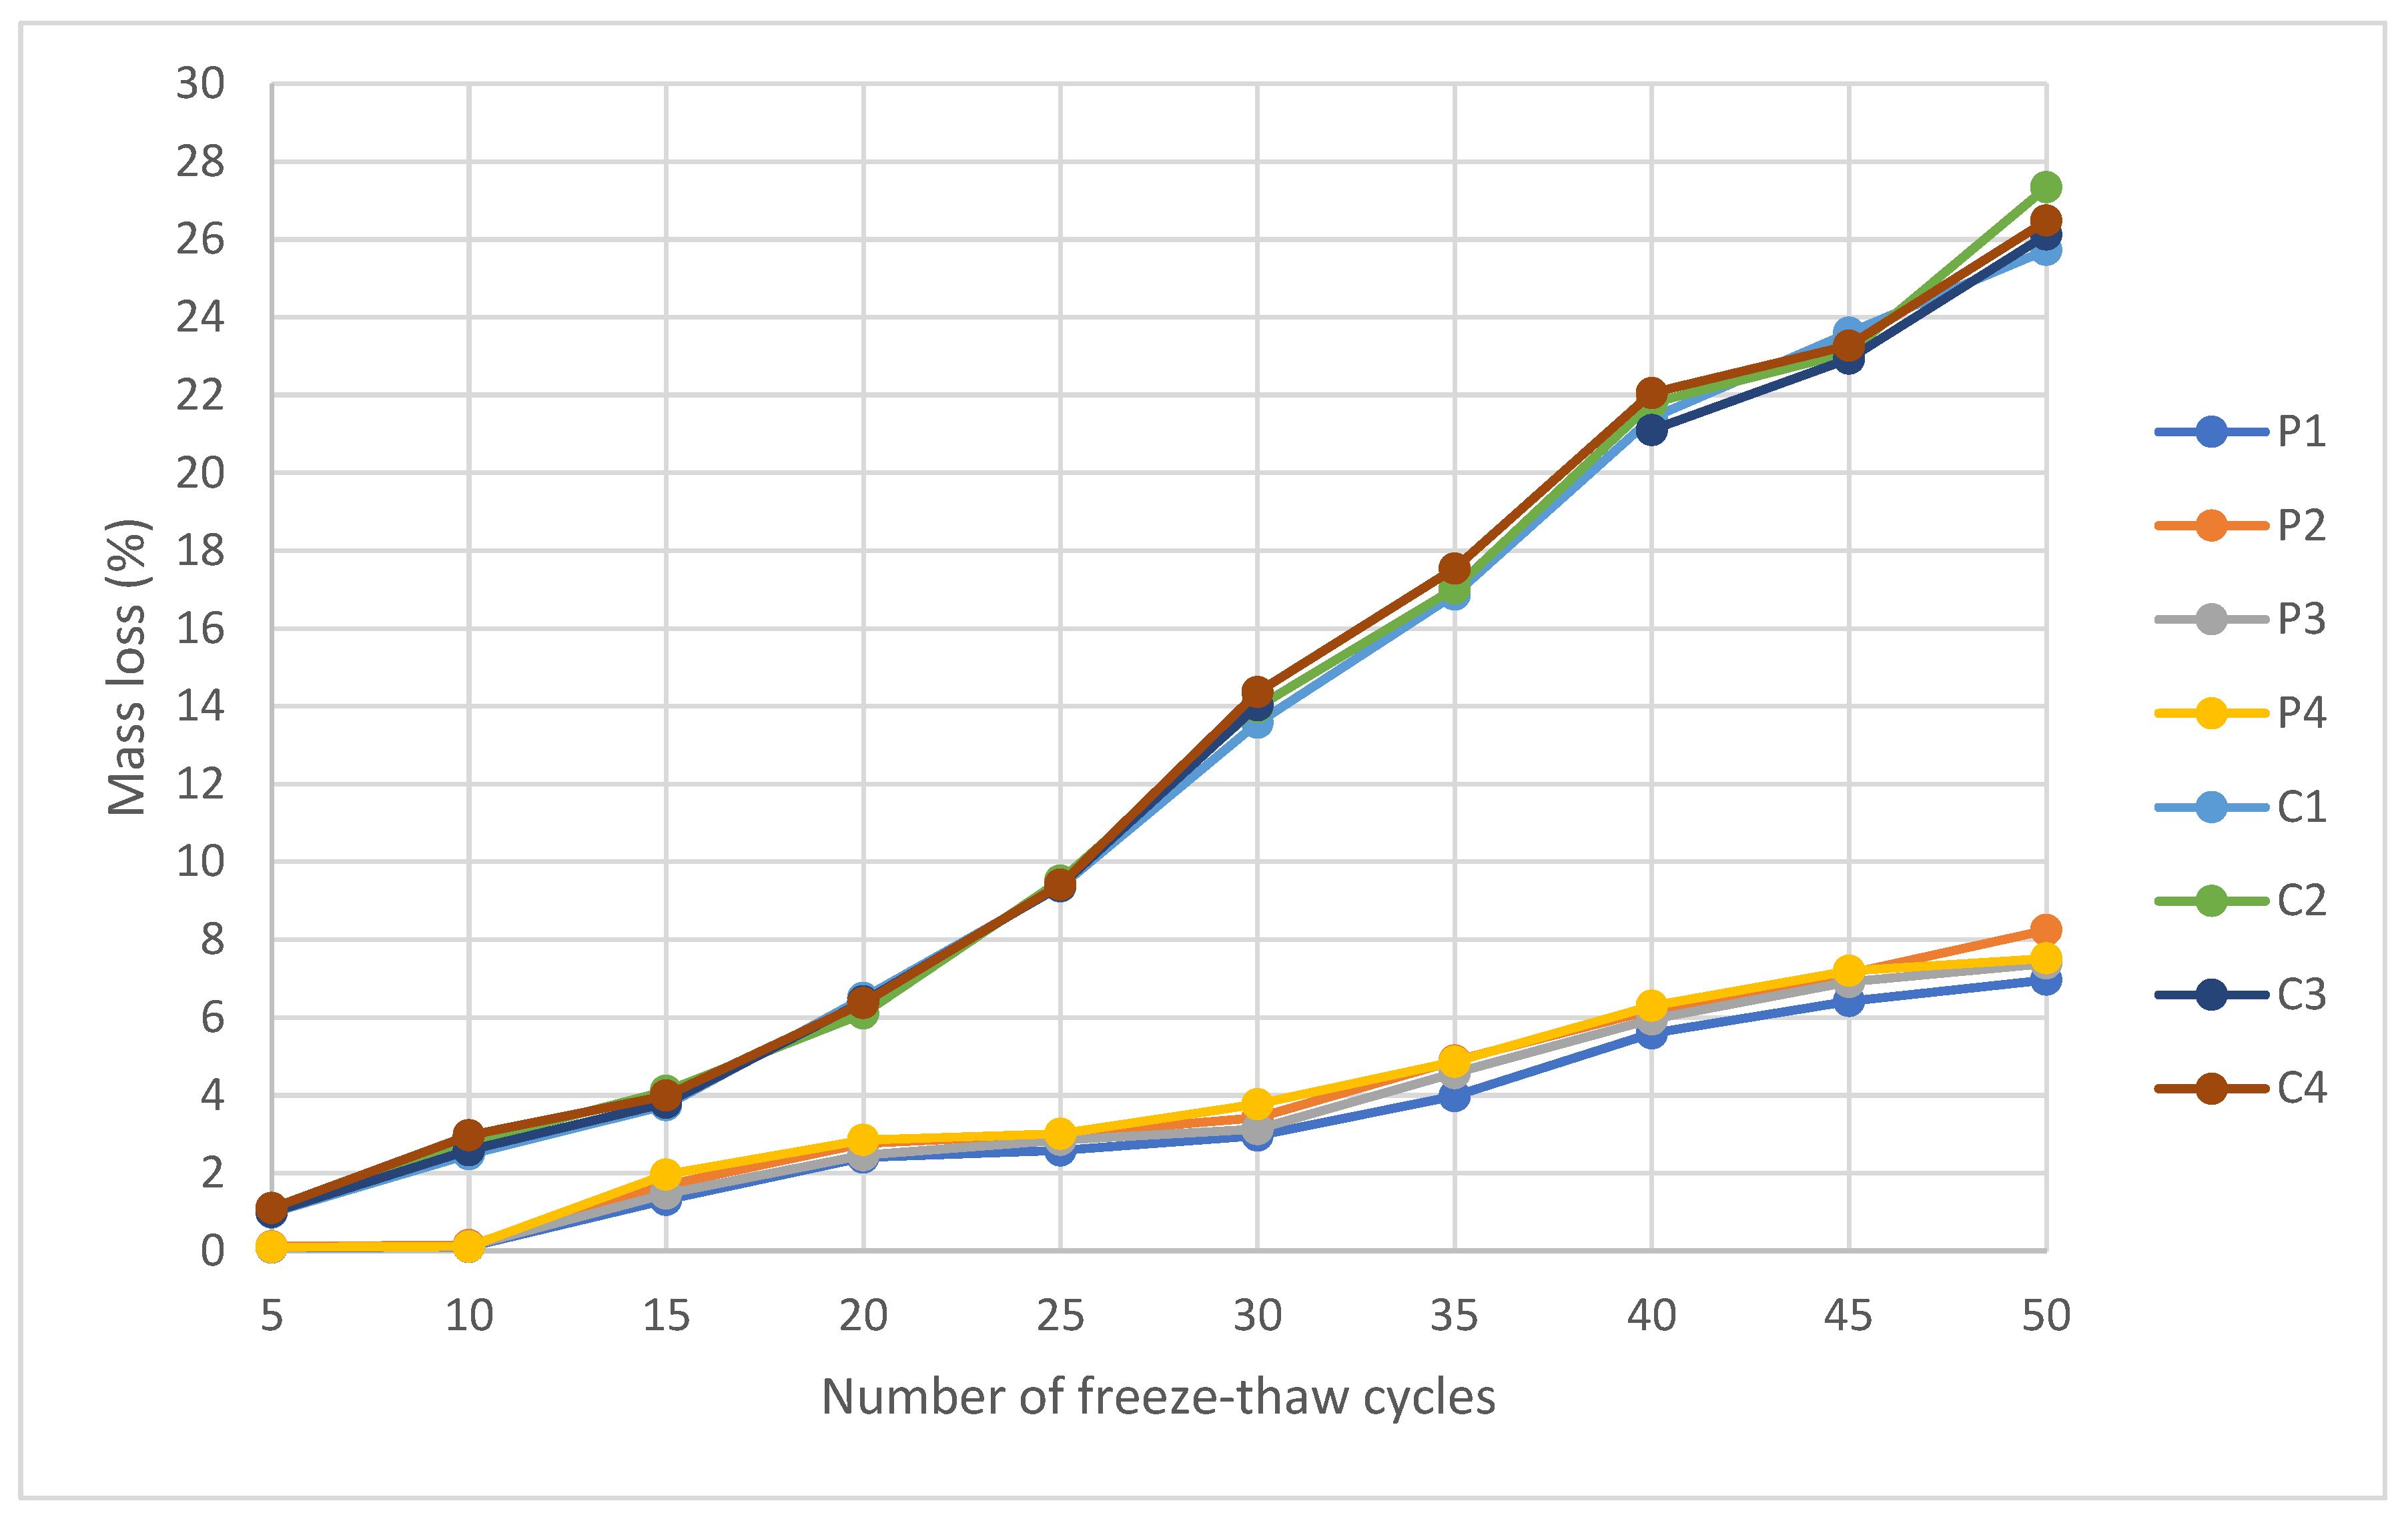
2.2.3. Freeze–Thaw Cycles
To evaluate the mechanical strength and durability of geopolymeric materials against external climatic conditions, an accelerated test of resistance to damage by freeze–thaw thermal cycles was carried out. For this purpose, a specimen from each of the conformed families was used and tested under the UNE-EN 15304 standard [
69] performing a total of 50 freeze–thaw cycles. This experimental protocol allows the identification of possible microstructural degradation mechanisms. During freezing, the water retained in the pores undergoes an increase in volume, generating internal pressures that can induce cracking, the loss of structural integrity, and a decrease in mechanical properties [
77].
The procedure consisted of subjecting the samples to 50 consecutive freeze–thaw cycles. Each cycle included a freezing phase at a controlled temperature of −15 ± 2 °C during 8 h, followed by a thawing stage in a climatic chamber at 20 ± 2 °C and 95% relative humidity for another 8 h. The specimens were placed on a grid to allow uniform air circulation and simulate real exposure conditions.
Figure 7 shows the freeze–thaw mechanism of geopolymers formed by pressing and casting the geopolymer mortar.
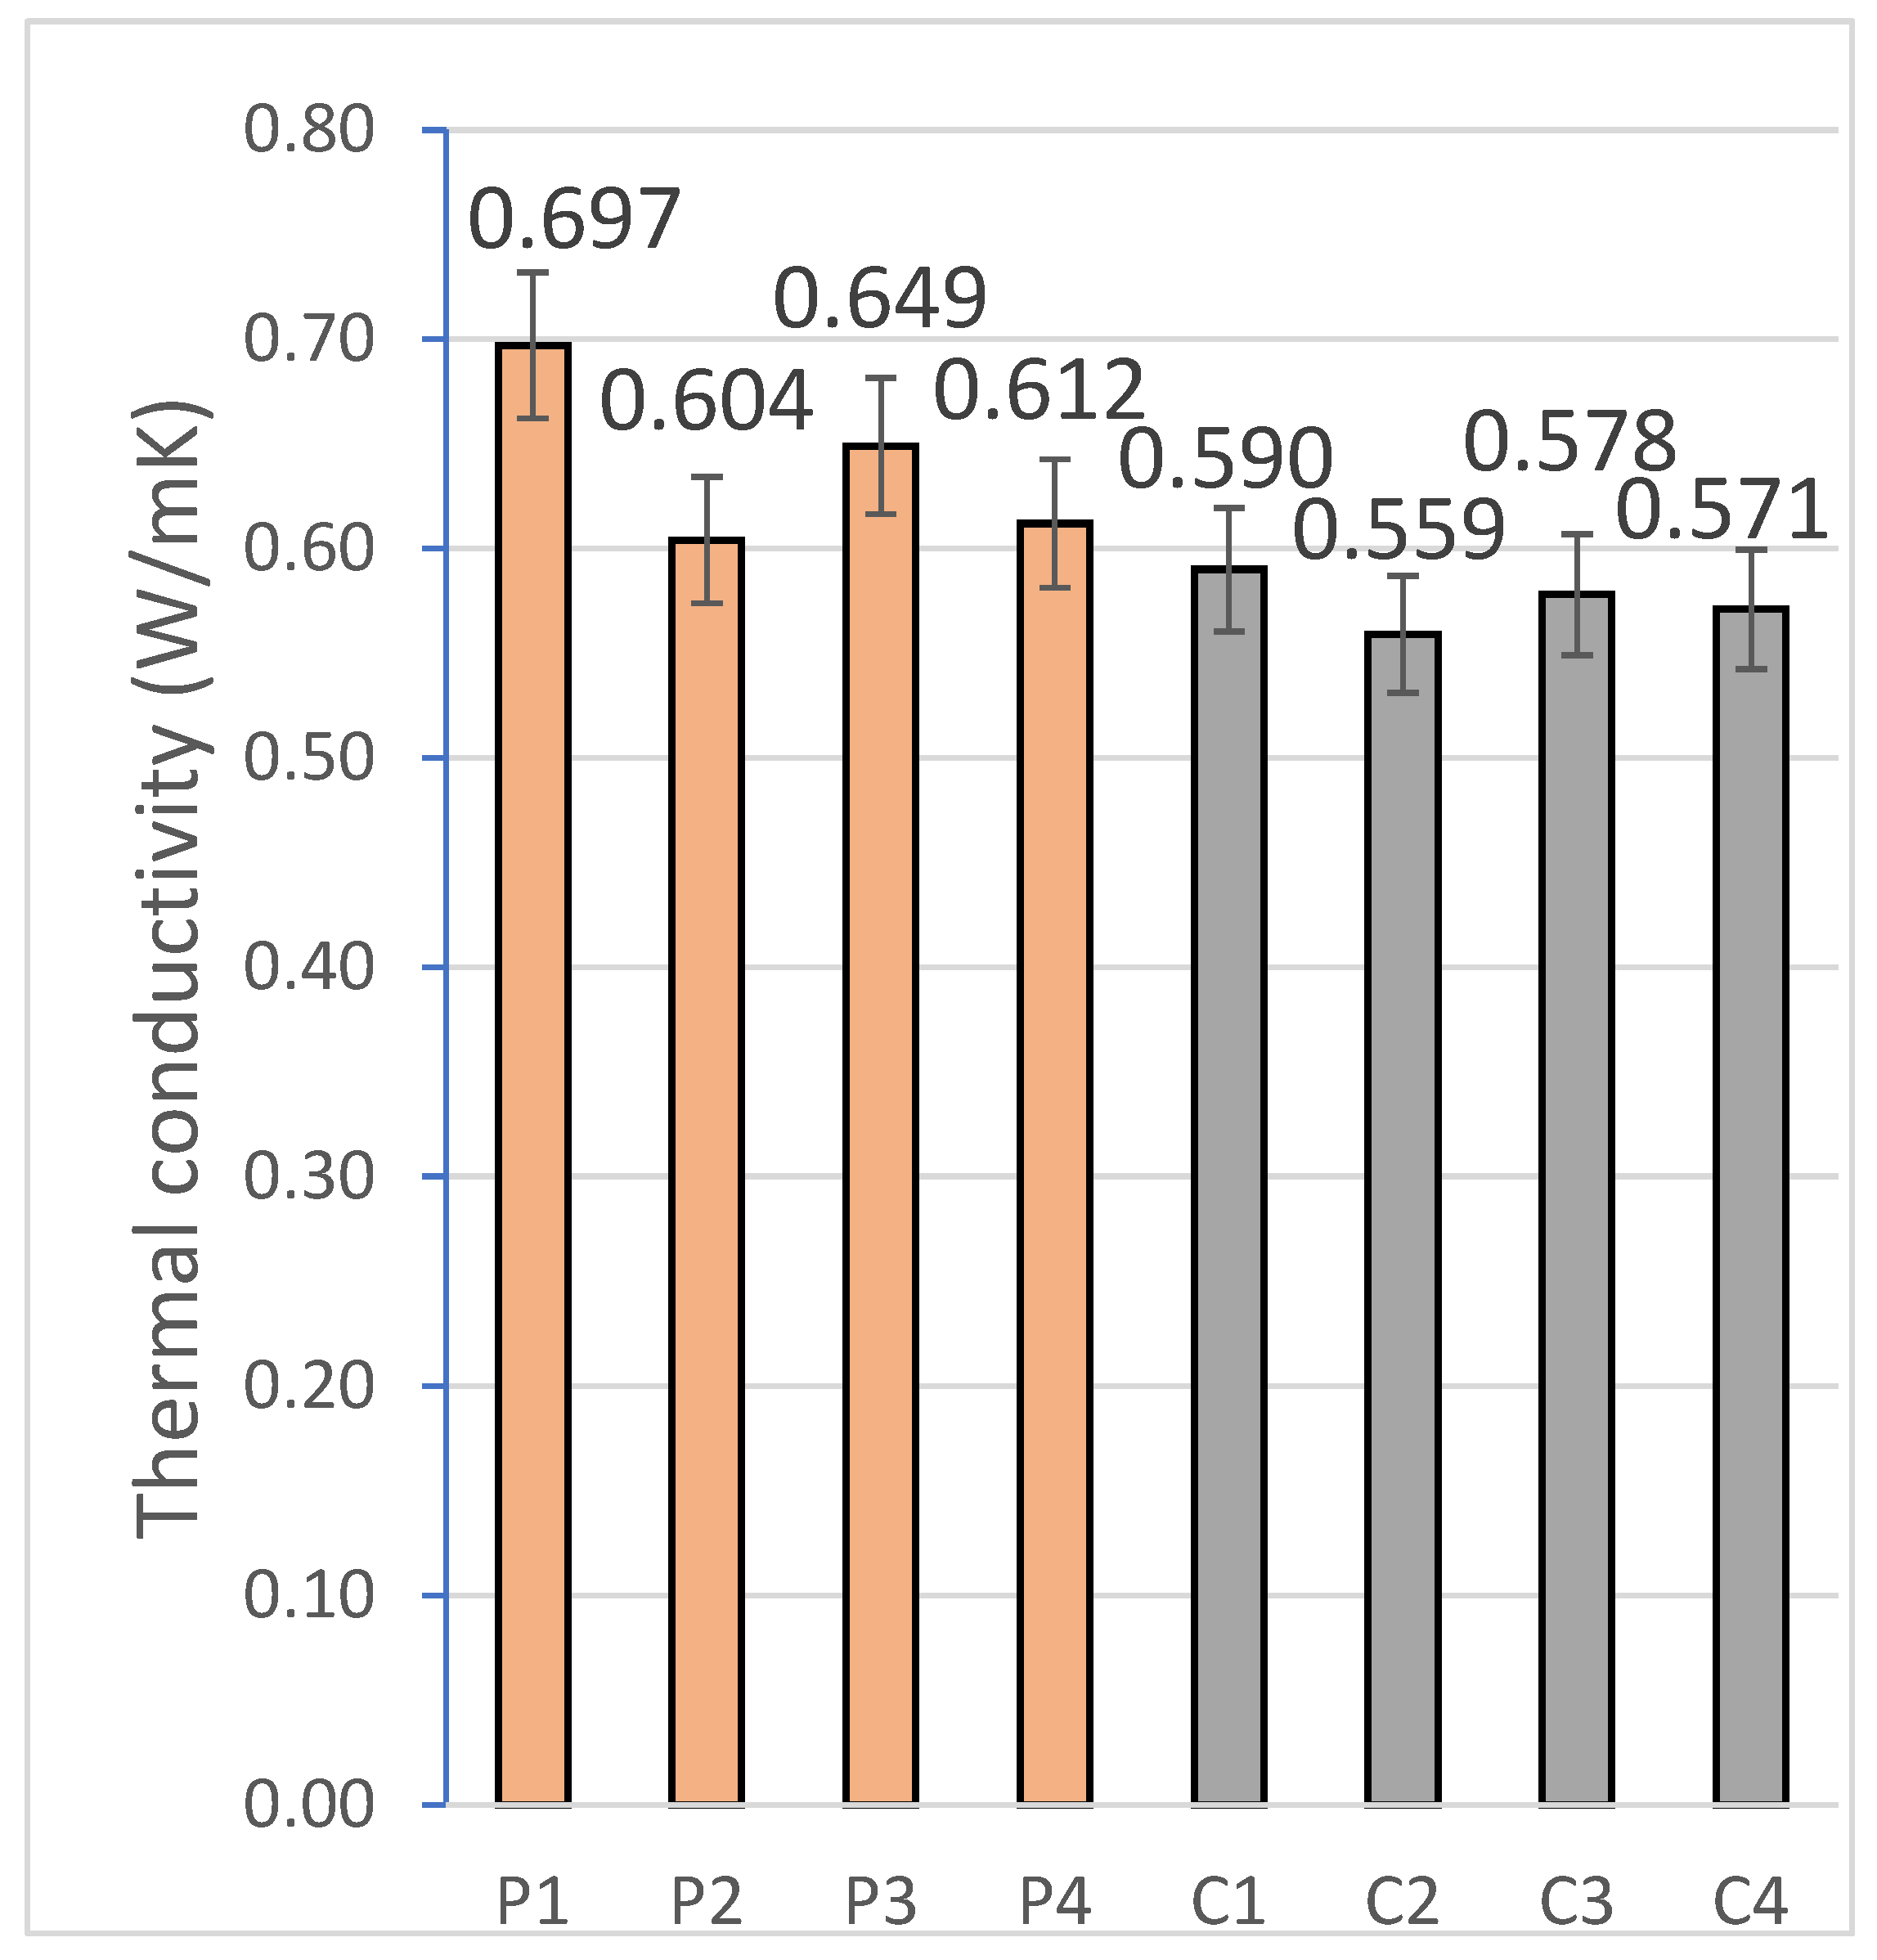
2.2.4. Thermal Conductivity
The thermal conductivity of the geopolymeric materials was realized by the standardized procedure UNE-EN 12667:2002 [
70] using a heat flow meter. For this purpose, 3 specimens from each of the families were tested to ensure structural homogeneity.
The specimens were each individually analyzed on the Netzsch HFM 446 Lambda Eco-Line device (NETZSCH-Gerätebau GmbH, Selb, Germany). This device employs dual heat flow transducers placed between two isothermal plates to generate a controlled temperature gradient across the specimen thickness. During the test, the top of the device was automatically adjusted to ensure uniform contact with the specimen surface, minimizing thermal interface resistances.
Prior to measurement, the system was calibrated using standard materials with certified thermal conductivities, to ensure traceability and accuracy of the results obtained. The thermal conductivity (λ) was determined from the stabilized heat flow and the imposed thermal gradient, allowing to evaluate the insulating capacity of each geopolymer formulation.
2.2.5. Fire Resistance and Thermal Stability
The fire resistance test was developed to evaluate the thermal behavior and physicochemical stability of the geopolymer mortar under extreme conditions of direct exposure to flame. The experimental methodology was designed in accordance with UNE-EN 13238:2011 [
73] and UNE-EN ISO 11925-2 [
74].
For this purpose, a specimen was selected from each of the formulations developed, which were subjected to a flame generated by a standard Bunsen burner. The orientation of the specimen during the test was 45° with respect to the burner axis, ensuring a uniform exposure of the surface to the flame front. Each specimen was subjected to a continuous exposure for 15 s, keeping the test conditions controlled in terms of the gas flow rate and the distance between the flame and the surface.
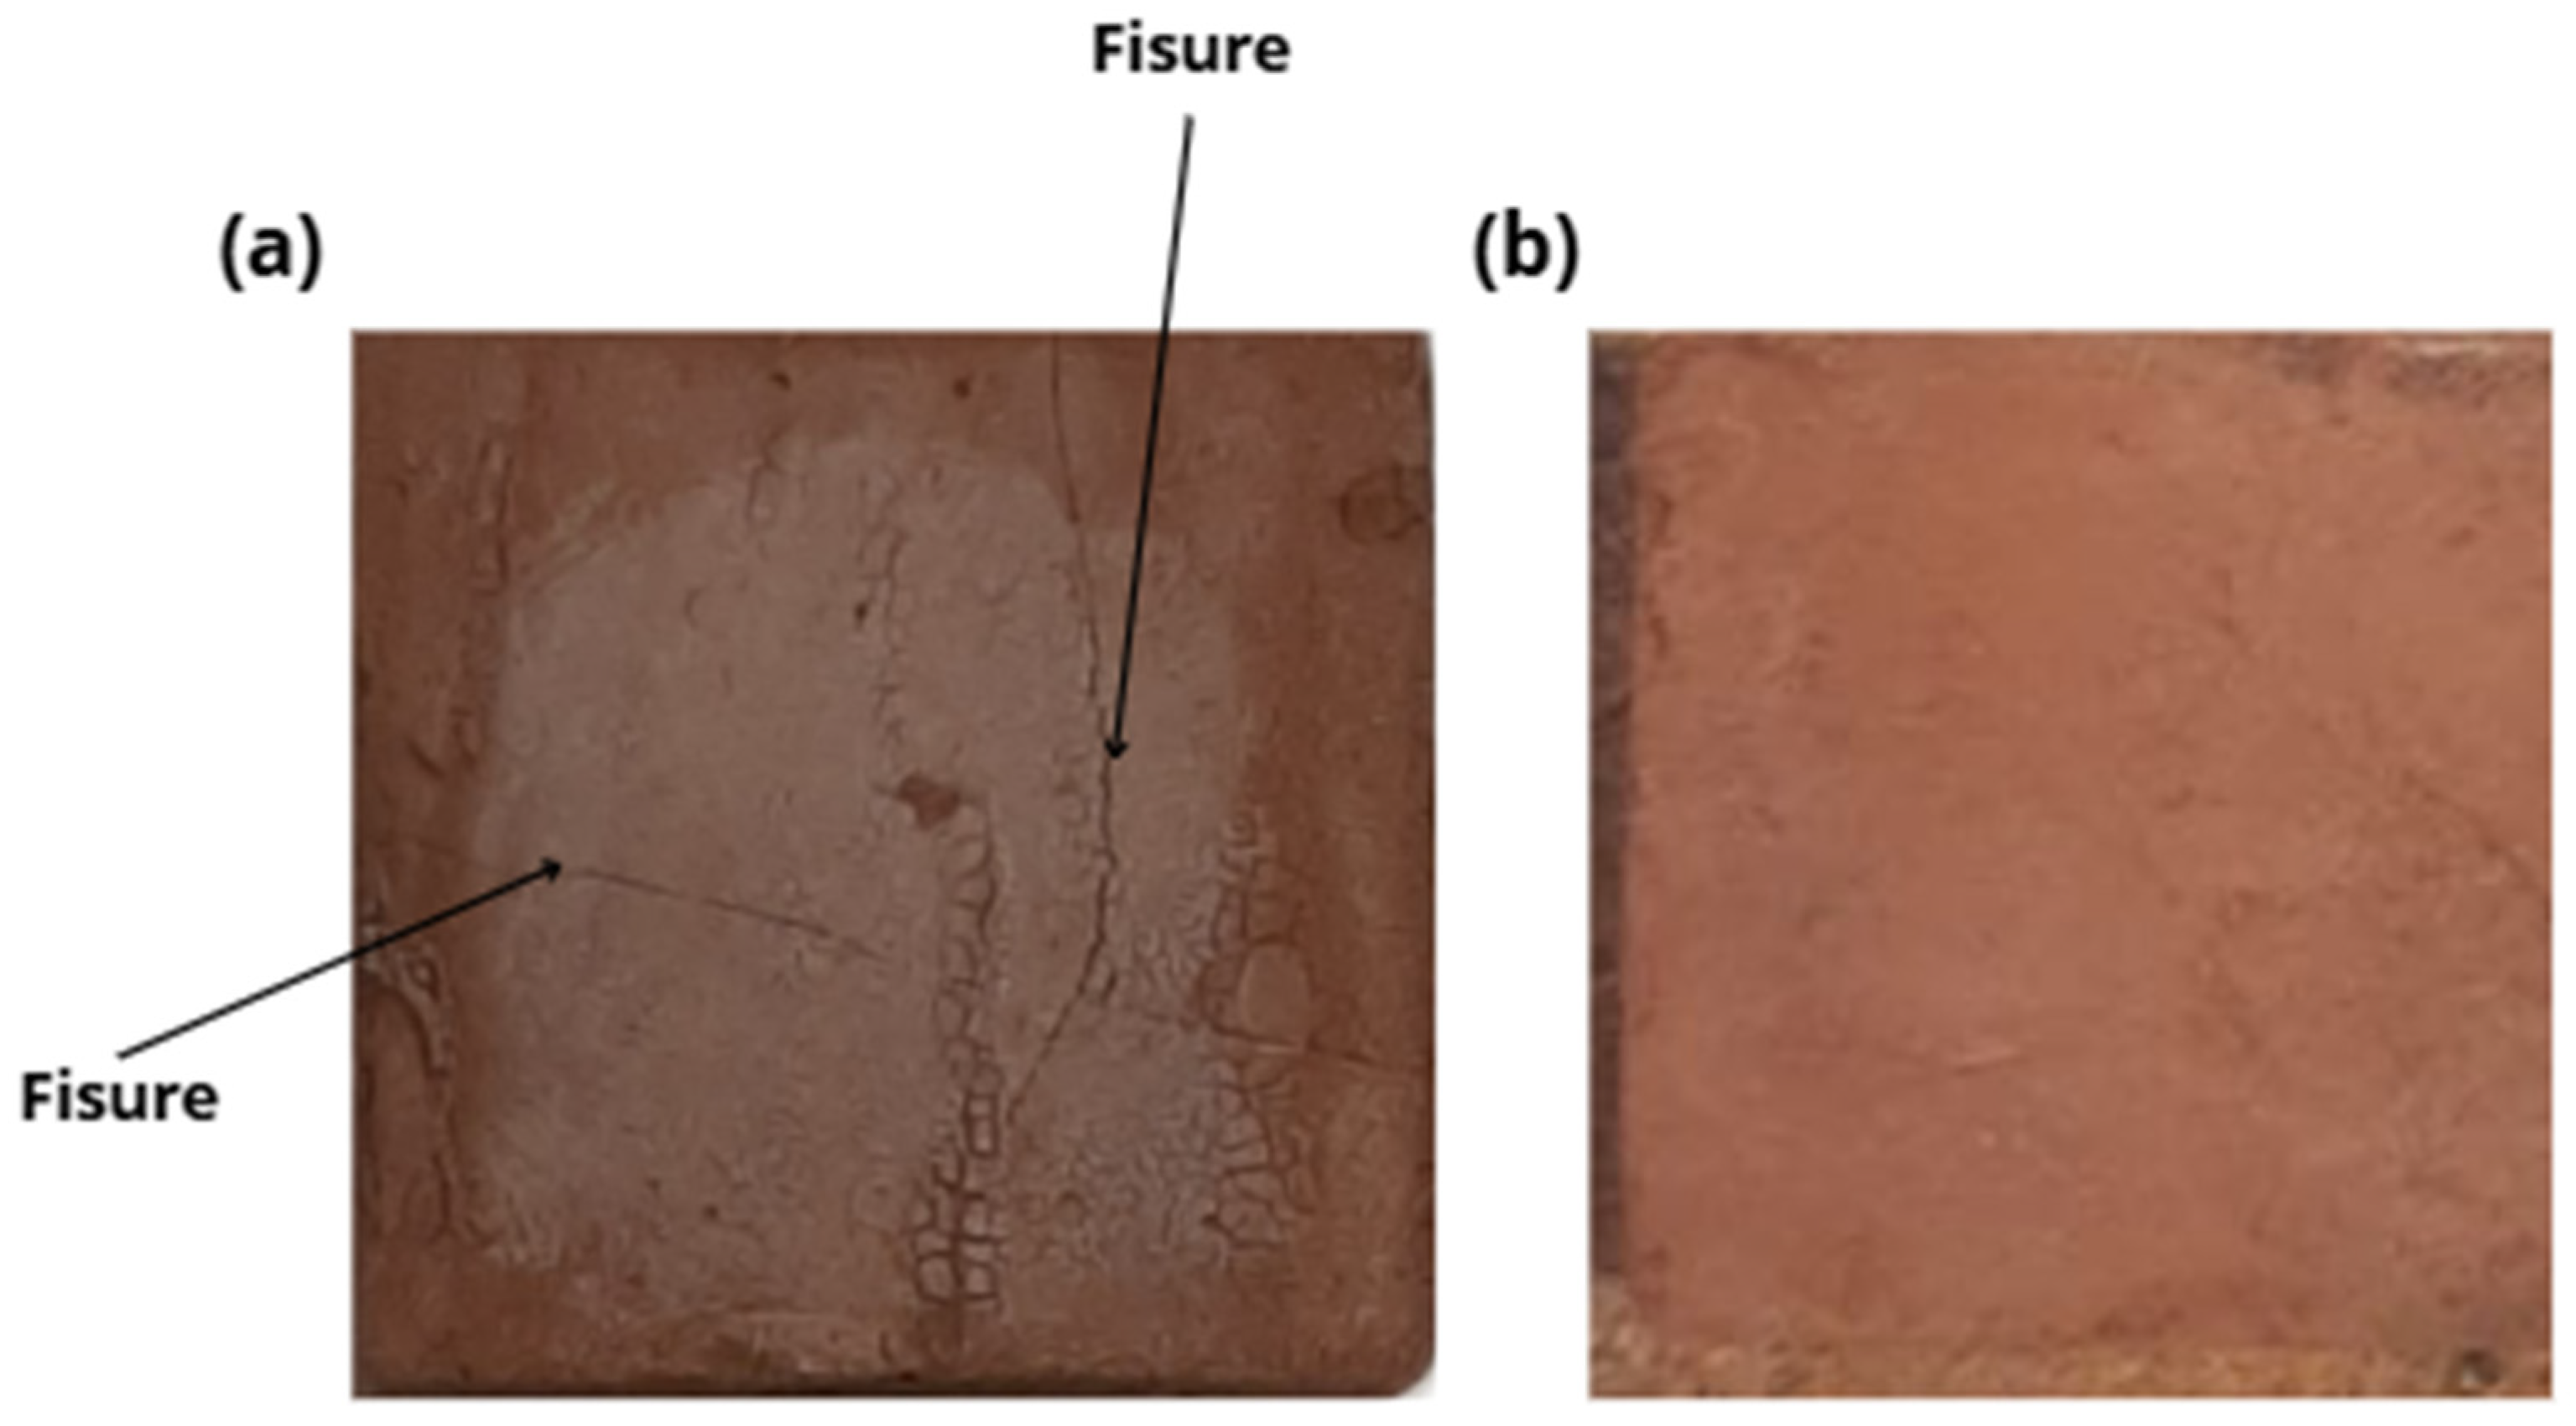
At the end of the exposure, a detailed visual inspection of the affected surface was carried out. The evaluation focused on the analysis of physical behavior after exposure, recording parameters such as the presence and extent of thermal cracking, surface carbonization, material detachment, and bubble formation due to internal decomposition or partial structural collapse.
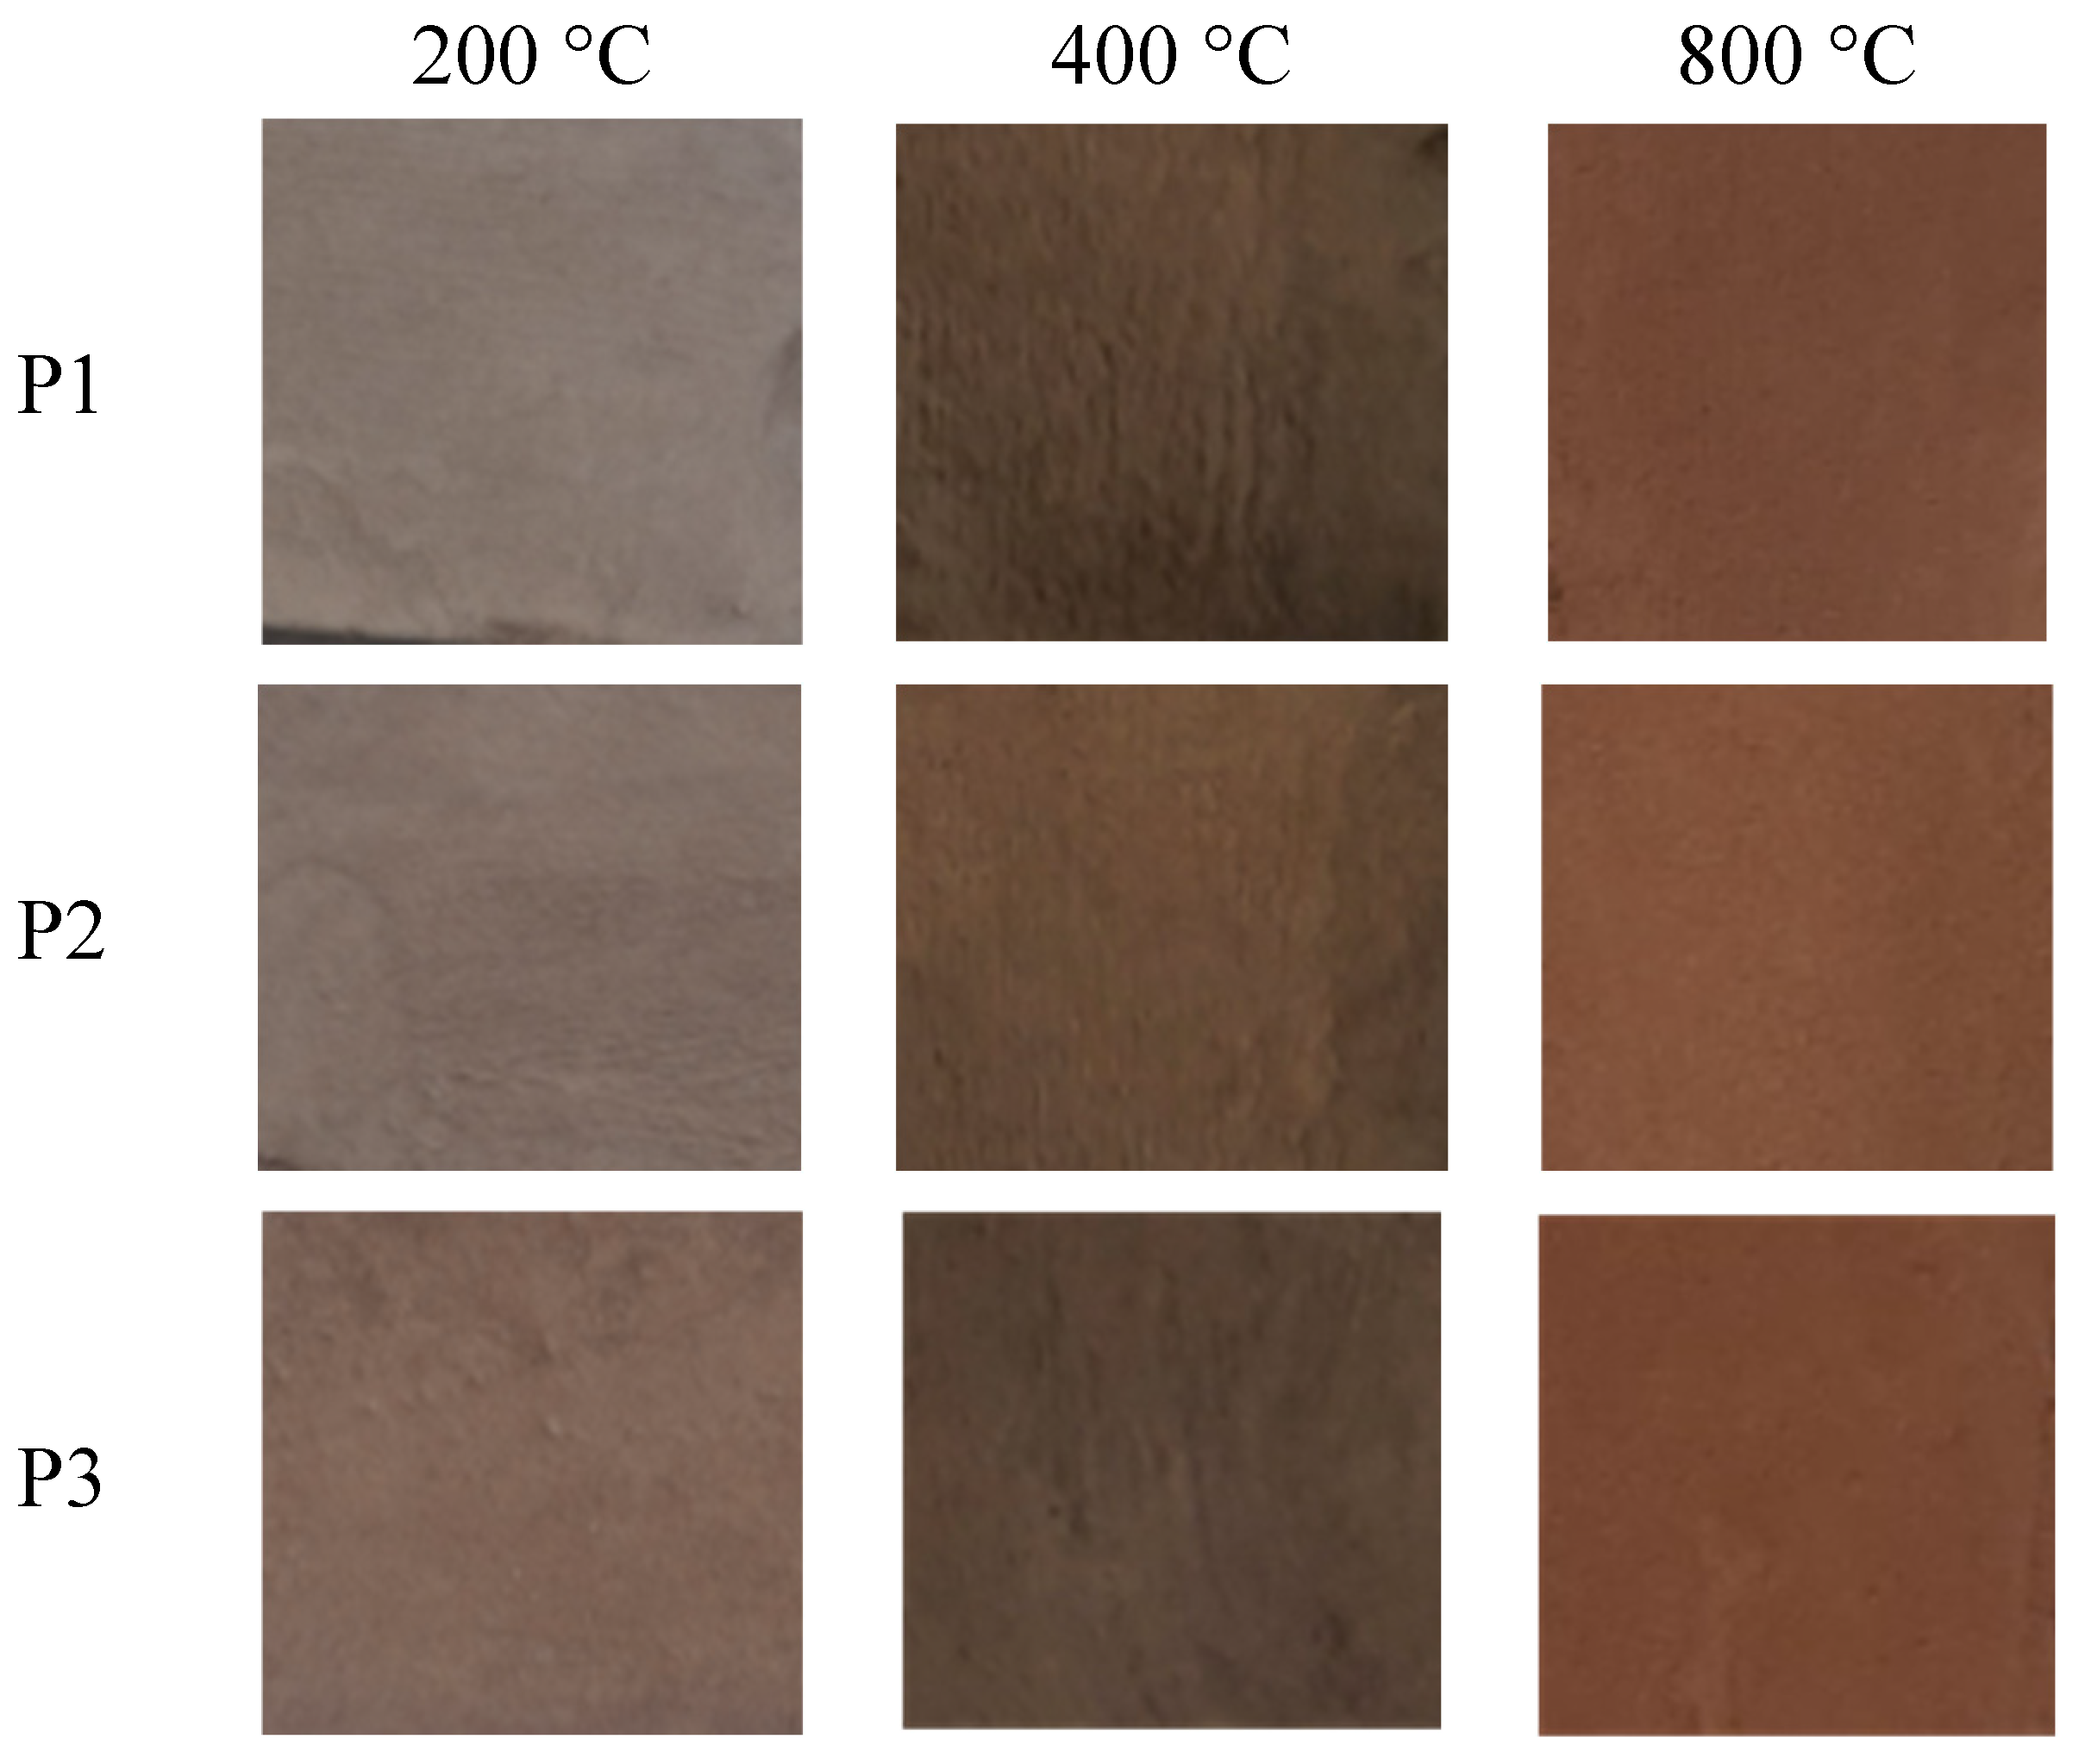
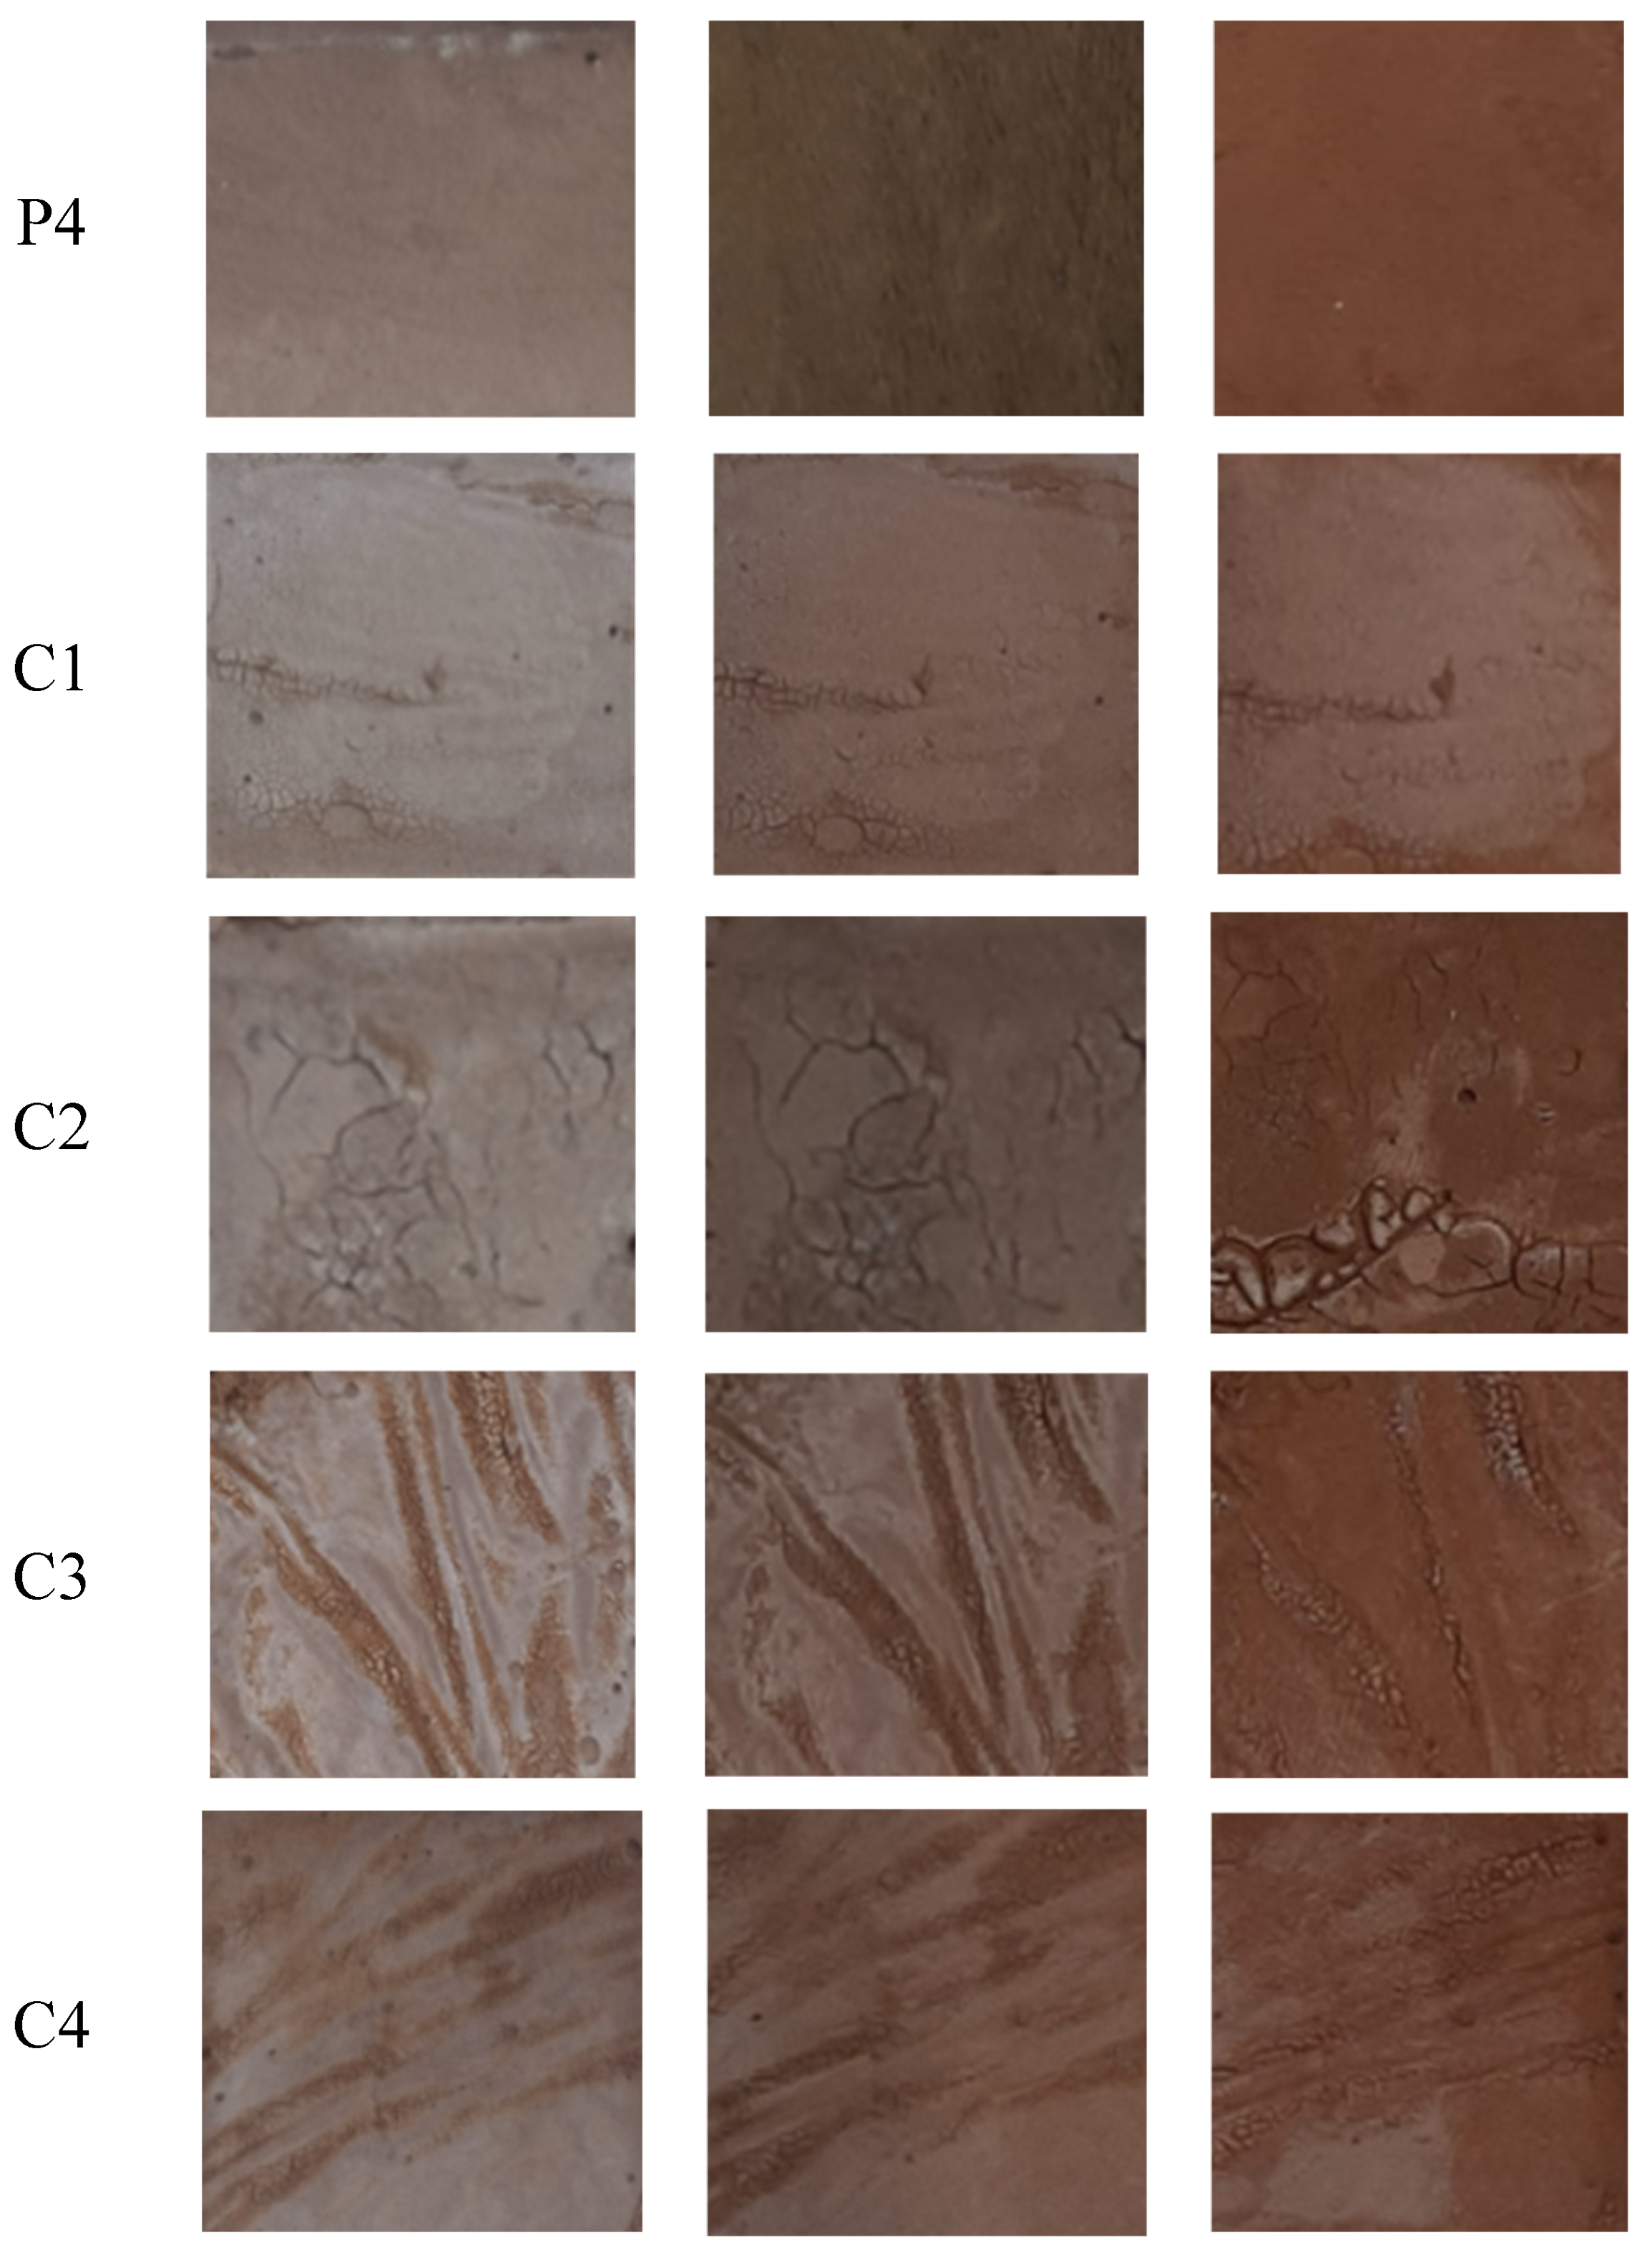
In addition, the specimens were tested to a thermal stability test. To achieve this objective, the specimens were exposed to thermal exposure at 200, 400, and 800 °C during 2 h, with a controlled heating rate of 10 °C/min. After the exposure time, the specimens were cooled by natural convection to room temperature.
2.2.6. Efflorescence
The specimens were subjected to a standardized procedure (UNE 136029 [
72]) of exposure in a humid environment in order to evaluate the tendency to the formation of salt efflorescence, a phenomenon that can compromise both the aesthetics and durability of cementitious and geopolymeric materials. The methodology employed was based on controlled conditions that simulate an environment conducive to the transport and deposition of soluble salts to the surface of the material.
The test was performed in a humidity-controlled climatic chamber, maintaining a relative humidity of 70 ± 5% and a constant temperature of 20 ± 5 °C, under conditions of zero convection to avoid disturbances in capillary transport. The specimens were placed in a vertical position on a tray with a sheet of distilled water, ensuring an immersion of 2.5 cm. This partial contact with the water allowed the capillary rise of ionic solutions, favoring the conditions for the development of efflorescence in the area exposed to the air.
The exposure period under these conditions was 7 days. After this time, the samples were removed from the water and placed on a dry surface at controlled room temperature (21 ± 5 °C) for 24 h, to allow surface drying and facilitate crystallization of the migrated salts. Subsequently, the specimens were stored in a desiccator for 24 h.
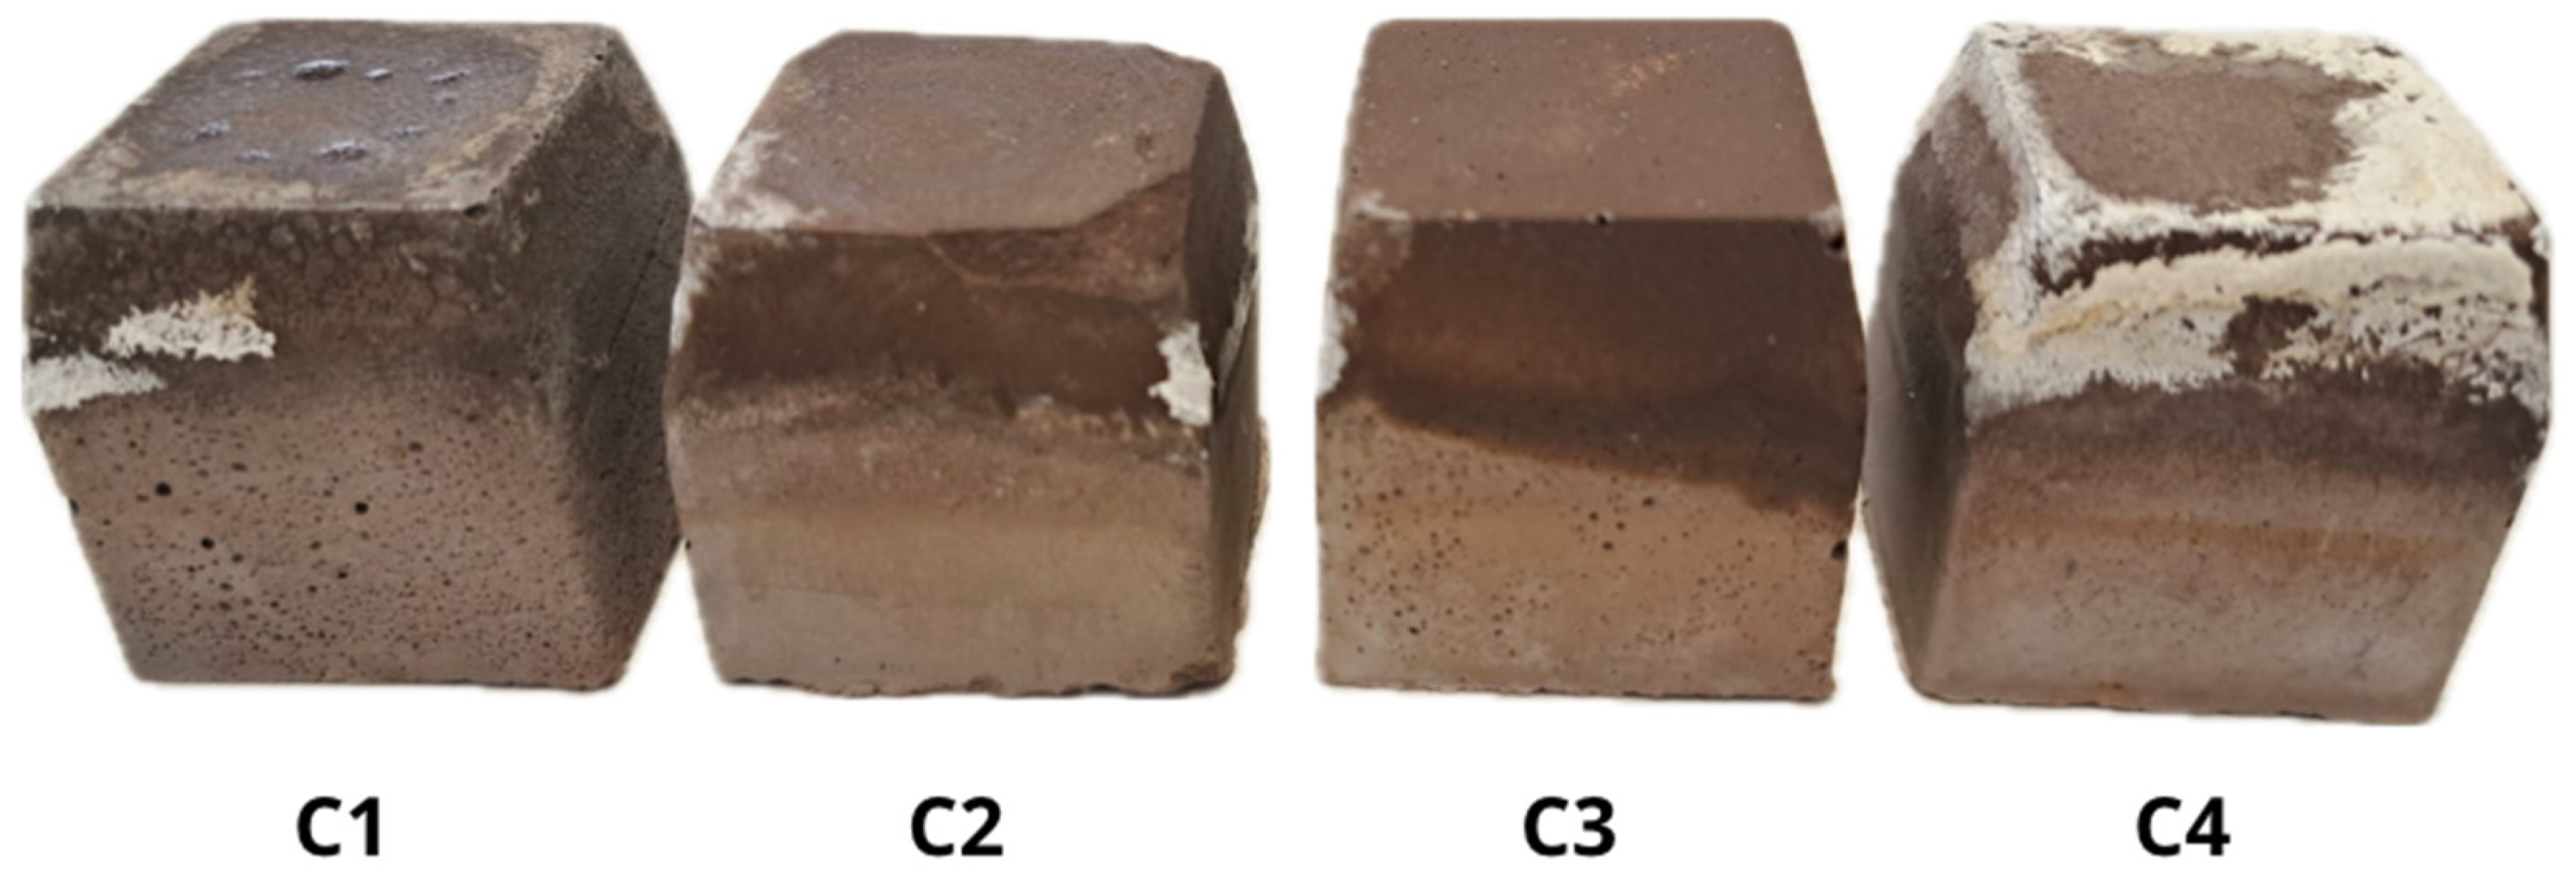
The evaluation of efflorescence was carried out by visual inspection of the surface of the specimens tested and mineralogical analysis by XRD of the specimens affected by the efflorescence phenomenon.
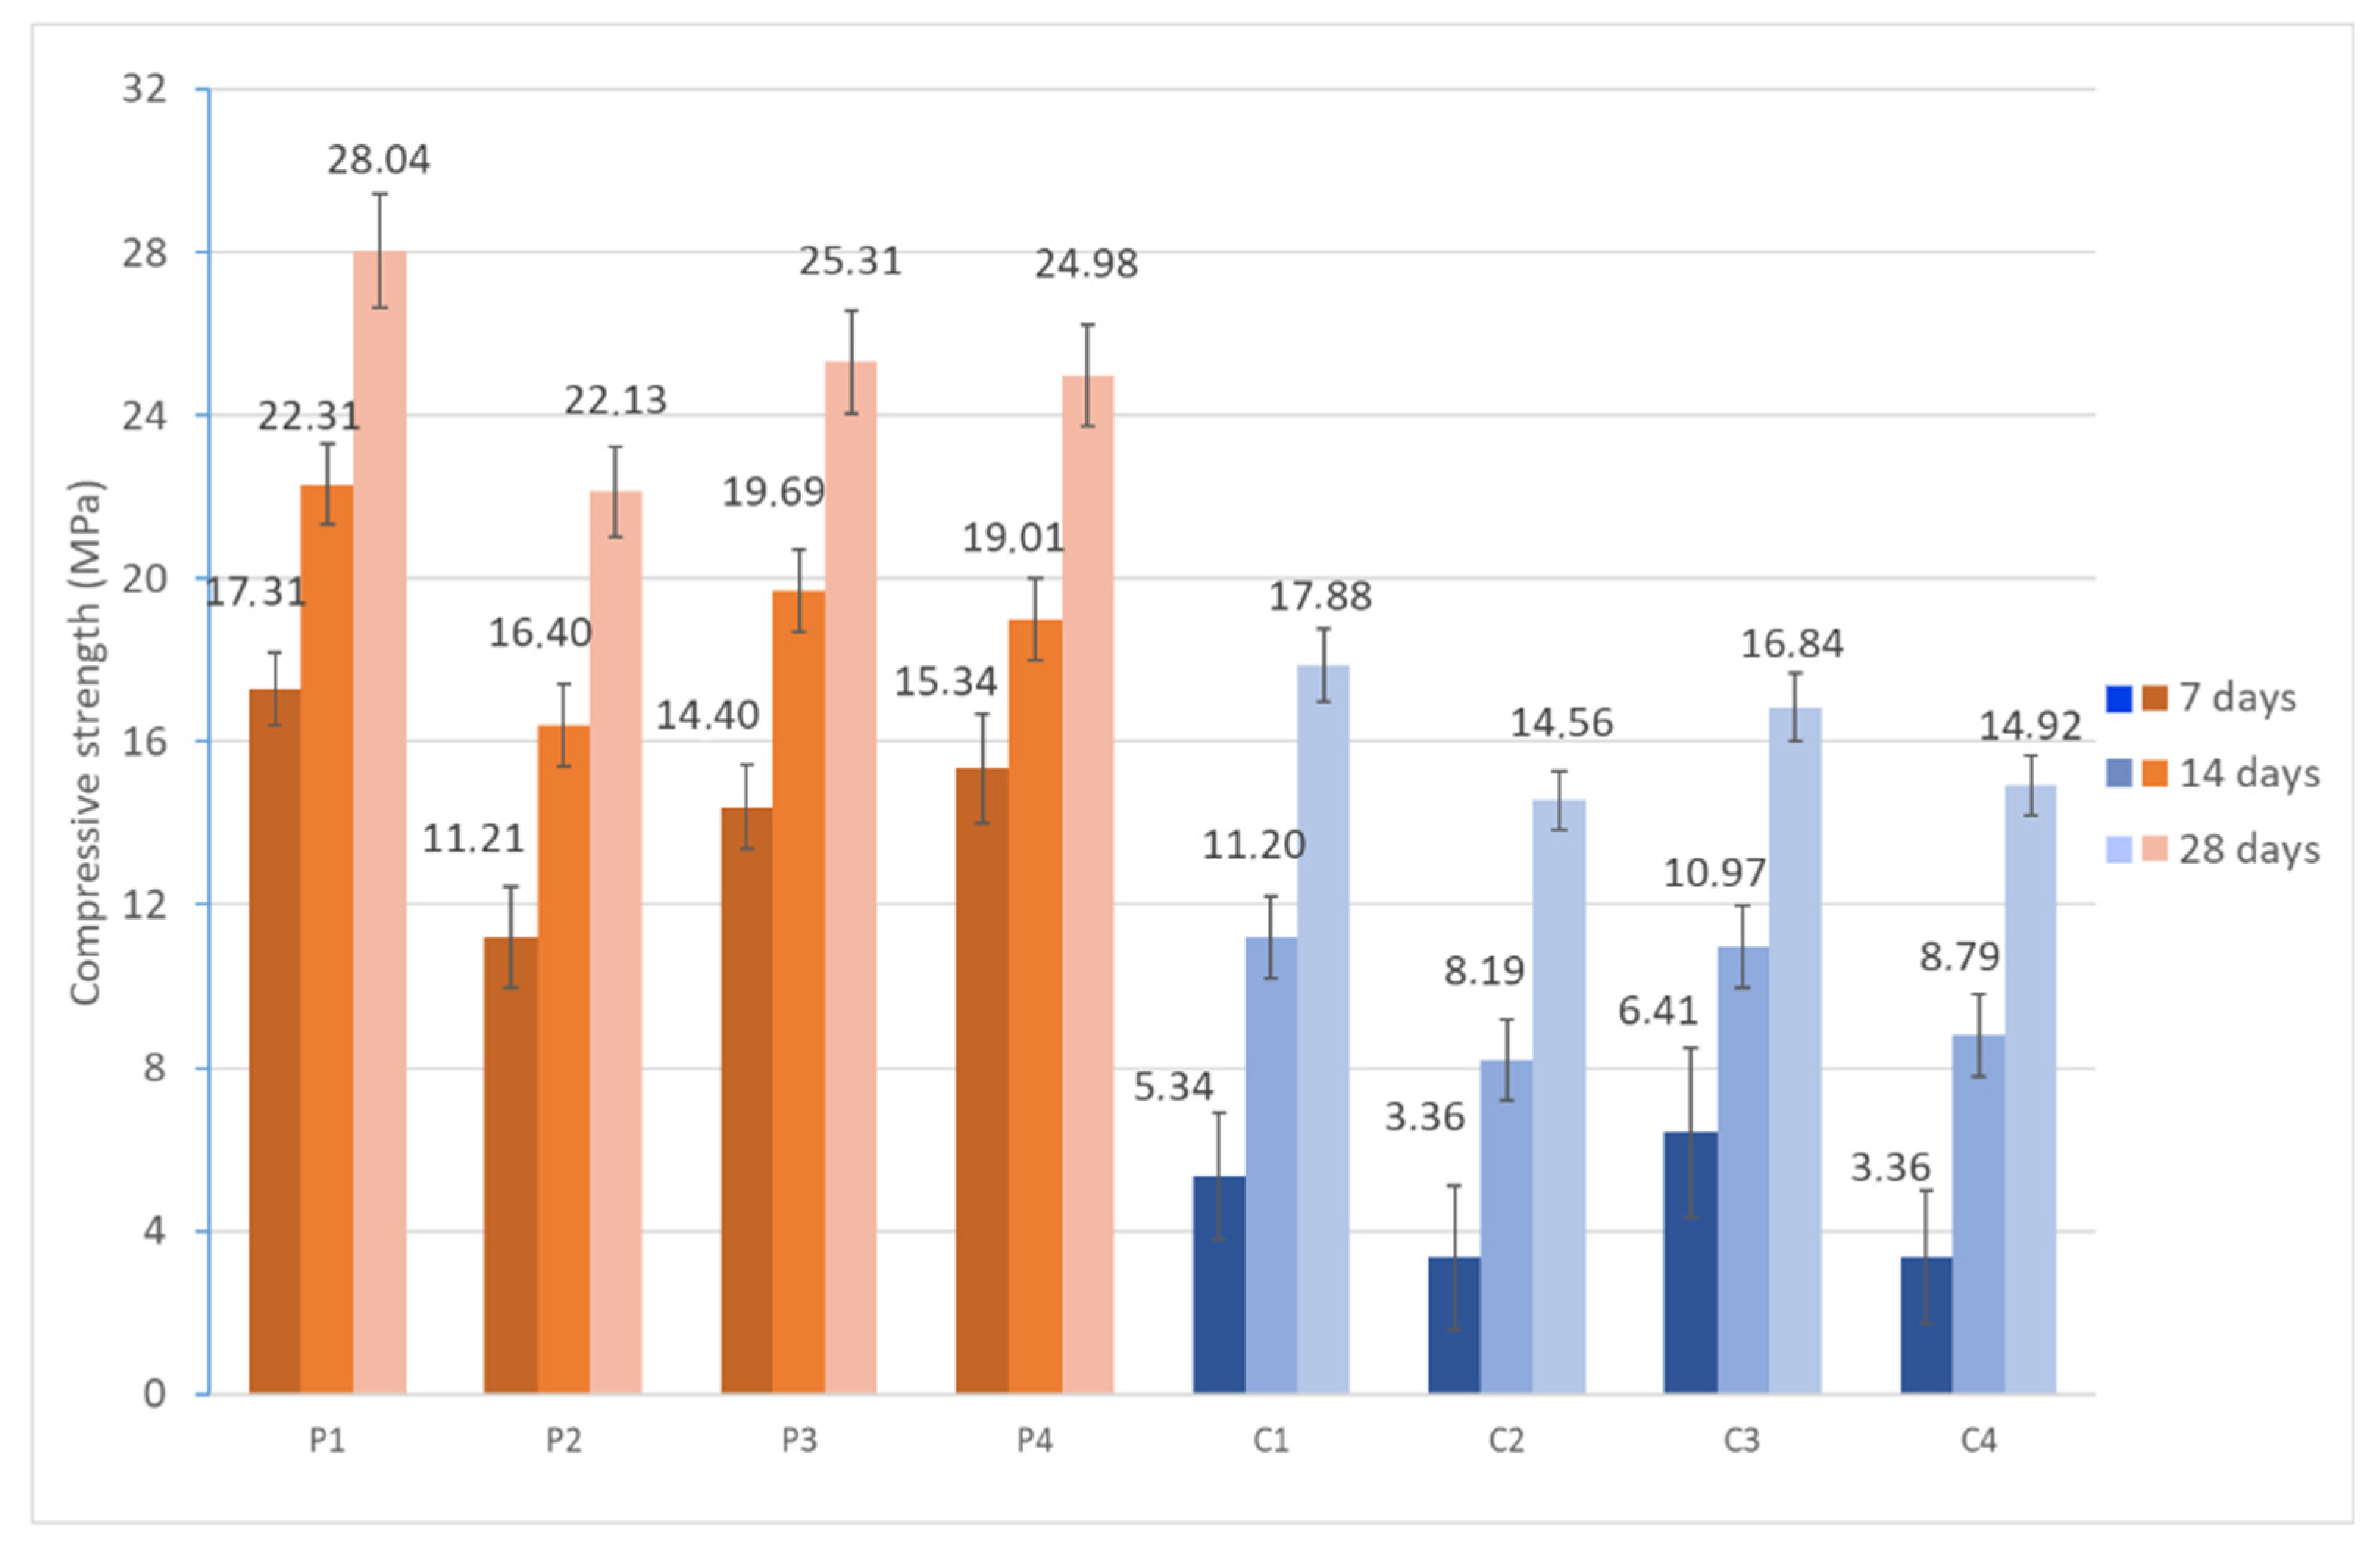
2.2.7. Compressive Strength
The compressive strength of geopolymeric materials was determined by standardized mechanical tests. The tests were evaluated using a Shimadzu AG-300KNX universal testing machine (Shimadzu) (UNE-EN 772-1:2001+A1:2016 [
71]). The specimens were submitted to axial compression at 7, 14, and 28 days of curing, in order to study the evolution of the mechanical characteristics along the geopolymerization process. During the test, an increasing load was applied at a constant strain rate, according to the parameters established in the standard, recording the maximum stress supported before the structural collapse of the specimen.


 ,
, 


