1. Introduction
Inspired by the United Nation Climate Change accord and the OECD analysis
Global Material Resources Outlook to 2060: Economic Drivers and Environmental Consequences [
1], we explore the relationship between population and economic growth, as antecedent conditions, and their impact on energy consumption and carbon emissions, as consequences. Global economic growth has been linked to an increased use of material resources, particularly in the energy sector. However, with fossil fuels and coal as the current commonly used sources of energy and as known high contributors of carbon dioxide emissions, the present scenario is both ultimately dangerous and unsustainable. Given UN DESA 2024 projections of global population exceeding 10 billion by the 2080s, and then declining somewhat to 10.2 billion by 2100 [
2], countries would be anticipated to increase their consumption of fossil fuels and coal, in turn increasing carbon emissions and imperiling the planet [
3]. Due to the escalation in energy emissions, nations can benefit from transitioning from an extractive energy past to a low carbon, renewable energy future.
We focus on representative oil-producing nations with adequate energy consumption and associated data—Brazil, Canada, China, India, Indonesia, South Africa, and the US—categorized according to their OECD (Canada and the US) or BRICS (Brazil, China, India, Indonesia, and South Africa) status [
4,
5,
6]. Russia is omitted due to limited data availability on commitment to or implementation of a transition to low-carbon energy. Remaining heavily dependent on fossil fuel production and exports, Russia has made limited progress toward low-carbon energy and has evidenced considerable structural resistance to carbon pricing and renewable energy expansion [
7]. Indonesia, while not yet officially a member of BRICS, has been raised as a potential candidate due to its large economy, regional influence, and alignment with BRICS development goals and is therefore included. Indonesia has repeatedly demonstrated strategic climate commitments, including a national low-carbon development agenda, green energy transition plans, and net-zero pledges. Moreover, the inclusion of Indonesia in the G20 and its formal invitation in 2023 to join BRICS+ further strengthen its relevance as a BRICS-related example in our analysis of pathways to decarbonization [
8].
In overview, the OECD group represents developed countries with advanced economies, while the BRICS group reflects developing economies trending upward on performance and energy use indicators [
9]. The US and Canada are broadly representative of OECD and advanced economies with high per capita energy consumption, technologically advanced infrastructure, and major oil production and export capacity. OECD comparative data reports on the US, Canada, and other OECD countries provide background on energy consumption, oil production, and climate policy in advanced economies, affirming the US and Canada as strong exemplars for advanced, resource-rich nations [
10]. Similarly, World Bank studies indicate that BRICS countries plus Indonesia—excluding Russia—are representative of large, diverse emerging markets with varying degrees of fossil fuel dependency, rising energy demand, and active participation in global climate negotiations, making them excellent examples of transitional economies balancing growth with decarbonization [
11].
Our study examines patterns of population growth, economic development, energy consumption, and carbon emissions across the two groups consisting of the selected OECD and BRICS countries, excluding Russia due to insufficient data and adding Indonesia due to the economic and energy production alignment. Focusing on the major coal and fossil fuel producers in each group, we analyze how energy production converges with demographic trends, economic growth, energy consumption, and CO2 emissions. Drawing on World Bank data, we use standardized indicators of per capita metrics for energy consumption (kg per fuel) and carbon emissions (metric tons) to inform our analysis. We assess correlations between GDP growth and CO2 emissions, comparing patterns both within and between the OECD and BRICS groups, and contextualize these findings amidst salient historic events. Using machine learning forecasting models, we project future trends in energy consumption and emissions and estimate the energy requirements for transitioning from the current common use of fossil fuels and coal to low-carbon alternatives including various forms of renewable and nuclear energy. Based on our findings and existing research, we propose a roadmap for using renewable and nuclear energy sources for implementing a more profound decarbonization strategy.
3. Methodology
In our study, we employ a multifaceted investigative design to predict energy usage and CO
2 emissions in the designated OECD and BRICS nations. Our methodology integrates exploratory data analysis (EDA) using correlations with autoregressive integrated moving average (ARIMA) predictive modeling. ARIMA forecasting derives from equations modeling autocorrelations in time-series data and has not typically been considered part of machine learning. Unlike machine learning methods, which can learn patterns automatically from the data, ARIMA requires manual parameter assumptions. Nevertheless, in manifestation of convergence in practice, ARIMA and machine learning are both considered to be forms of predictive modeling that can be applied together in ensemble forecasting. We address this ensemble option further in expanding on our findings in the
Section 4 and in exploring future research directions in
Section 6. We also subsequently consider more advanced machine learning and deep learning modeling.
Our models are trained on data from 1960 to 1997, tested on out-of-sample data from 1997 to 2024, and then used to forecast sustainability indicators through 2060. While more recent data beyond 2019 may be available in partial form, these datasets have not been consistently validated across all variables and countries in our analysis. Incorporating these incomplete or post-pandemic data points could introduce structural breaks or distort the underlying patterns, particularly given the unprecedented nature of the COVID-19 turmoil. To preserve model integrity and ensure reliable trend forecasting, we limited our dataset to the most complete and internally consistent period currently available—up through 2019—prior to the onset of pandemic-related anomalies deriving from unexpected global health and policy changes, accelerated technological momentum, and turbulence-induced market shifts.
The following sections detail the steps involved in our approach, highlighting the rationale behind each phase.
3.1. Data Collection
The first step in our methodology involved the collection of relevant data from reputable sources, primarily the World Bank. We focused on key indicators that reflect population dynamics, economic growth, energy consumption, and carbon emissions. The selected features included the following:
Population Growth and Background Factors: Fertility rate, mortality rate, life expectancy, and the aging proportion of the population.
Economic Indicators: Annual GDP growth percentage, which serves as a proxy for economic activity and development.
Energy Consumption: Measured in kilograms of fuel per capita, providing insight into the energy demands of each country.
Carbon Emissions: Expressed in metric tons per capita, indicating the environmental impact of energy consumption patterns.
Our selected predictors—GDP growth, population growth, CO
2 emissions, and energy consumption per capita—are grounded in the energy–economy–environment (3E) frameworks [
13,
17,
23,
24], emphasizing the structural interdependence between macroeconomic activity and environmental impact. These frameworks conceptualize economic growth and energy use as mutually reinforcing, while recognizing that both exert pressure on environmental systems through emissions and resource depletion. By integrating these dimensions, the 3E model enhances assessments of sustainable development options and policy trade-offs.
We initially collected population measures—fertility rate, mortality rate, life expectancy, and the percentage of the aging population—as part of the preliminary data evaluation in assessing demographic trends across countries. We determined that our main analytical emphasis was on GDP growth, per capita energy consumption, and CO
2 emissions, which are directly correlated with the 3E frameworks. The population indicators, while collected, were not used as primary predictors in the modeling or forecasting stages, as exploratory data analysis revealed no statistically significant or consistent correlation between these demographic variables and per capita energy or emissions trends in the selected countries. Instead, we followed earlier research (e.g., Alam et al., 2016; Kais & Sami, 2016) [
12,
13] that suggested nonlinear or indirect relationships between population growth and emissions, justifying the use of aggregate population growth trends as background context rather than modeling fertility, mortality, or aging population directly. This decision reflects our deliberate focus on the variables most directly tied to low-carbon transition pathways while acknowledging the importance of demographic configurations as part of the broader context.
Further elaborating on our energy consumption variable, we note that we include fuel use per capita as a proxy for the energy intensity and distributional footprint of fossil fuel consumption at the individual level, which is central to understanding decarbonization challenges in emerging economies [
12,
24,
25]. This indicator captures behavioral and infrastructural patterns not transparent in aggregate totals but that have been widely used in previous modeling efforts to gauge the momentum toward energy transition goals.
3.2. Data Preparation and Exploratory Data Analysis
Following collection of the data, we performed a thorough cleaning and preprocessing to ensure accuracy and consistency. This phase included handling missing values, normalizing data ranges, and transforming variables where necessary to facilitate analysis. After the preparation phase, we conducted our EDA to begin to uncover patterns and relationships in the data. EDA is a critical step that allows researchers to visualize data distributions, identify trends, and detect anomalies. We used correlations and visualizations including heatmaps to begin to understand the relationships among GDP growth, energy consumption, and CO2 emissions.
To examine the association between economic growth and carbon emissions, our EDA correlation analysis concentrated on comparisons of the OECD and BRICS countries. This analysis involved calculating the strength of association between annual GDP growth per capita and CO2 emissions per capita to identify variations in energy–emission dynamics across different economic groupings. Our categorization of countries helped us to assess whether patterns of economic expansion are systematically linked to carbon output, thereby informing the modeling of energy demand and emission trajectories under varying levels of economic development.
To further quantify the relationships identified during EDA, we subsequently performed a more detailed correlation analysis. This step involved calculating correlation coefficients to assess the strength and direction of relationships between variables. Any disparities, as reported in our results, would suggest that different factors may influence emissions in different countries, warranting further investigation into national energy policies and consumption patterns.
3.3. Predicting Energy Usage and CO2 Emissions
The cornerstone of our predictive methodology is the ARIMA model, a widely recognized time-series forecasting technique. We applied ARIMA as a technique particularly effective for analyzing and predicting future values based on historical data patterns. It combines three key components:
Autoregressive (AR): This component captures the relationship between an observation and a number of lagged observations (previous time points).
Integrated (I): This part involves differencing the data to make it stationary, which is essential for accurate forecasting.
Moving Average (MA): This component models the relationship between an observation and a residual error from a moving average model applied to lagged observations.
The application of the ARIMA model involved several steps:
Model Specification: We began by determining the appropriate orders (p, d, q)—the degree of differencing (d), the autoregressive order (p), and the moving average (q) order—for the ARIMA model. This step also involved visually and quantitatively analyzing the autocorrelation function (ACF) and partial autocorrelation function (PACF) plots to identify the optimal parameters.
We began our time-series modeling by assessing the stationarity of each series. In the case of stationarity, which is the preferred case, the statistical properties such as mean and variance remain constant over time. The augmented Dickey–Fuller (ADF) test [
26,
27] enabled us to assess the presence of a unit root, a characteristic of a time series where the value at each time point is highly dependent on its previous value, causing the series to exhibit a random walk with no return to a long-term mean. In essence, given the existence of a unit root, the expectation of any variable is its last value. In that scenario the time series is non-stationary, meaning that its mean, variance, or autocorrelation structure changes over time, making it harder to model or predict using standard statistical methods without first transforming by differencing.
If a series was found to be non-stationary, we applied differencing (the “d” parameter in ARIMA) to transform it into a stationary series.
Once stationarity was achieved—meaning constant statistical properties are in force—we determined the appropriate values for the autoregressive (AR) order (p) and the moving average (MA) order (q). This process involves inspecting the ACF and PACF plots. The ACF measures the correlation between current and lagged values of the series, while the PACF isolates the correlation at each lag after accounting for the effects of shorter lags. Visually, according to the Box–Jenkins methodology [
28], a PACF plot with a sharp cutoff and an ACF with a gradual decline suggests an AR model, whereas the reverse indicates an MA model.
Model Fitting: Once we had established the parameters, we fitted the ARIMA model to the historical data for each selected country, with model coefficients determined using maximum likelihood estimation (MLE). To complement the ACF and PACF graphical diagnostics, we also used the Akaike Information Criterion (AIC) and the Bayesian Information Criterion (BIC) to compare model alternatives. These AIC and BIC criteria balance model fit and complexity to optimize goodness-of-fit and selection of the most parsimonious ARIMA model best capturing the temporal characteristics and underlying patterns in the data.
Forecasting: With the fitted model, we proceeded to generate forecasts for future energy consumption and CO2 emissions. These forecasts serve as forward-looking scenarios crucial for understanding potential evolvements and informing policy decisions.
Validation: To ensure the robustness of our forecasts, we employed a rolling-origin cross-validation approach, beginning by splitting the dataset into training and testing subsets. We tested the predictive accuracy of the model using performance metrics such as mean absolute error (MAE) and root-mean-squared error (RMSE) to provide quantitative assurance of the forecasting performance.
Having described our modeling and validation procedures, we now turn to a presentation of the empirical results, which reveal deeper patterns and predictions regarding projected energy consumption and CO2 emissions in the selected two groups of nations.
4. Results
4.1. Exploratory Analysis of Annual GDP Growth, Energy Use (Kg of Oil per Capita), and CO2 Emissions per Capita
Exploratory Data Analysis: We examined the basic interrelationships among energy consumption, GDP growth, and CO2 emissions across the seven countries under study. Our EDA discerned critical differences in the correlations in different countries.
GDP Growth, Energy Consumption, and CO2 Emissions: In the OECD countries, we observed a low correlation, suggesting that economic growth correlates with increased energy consumption but not necessarily with proportional increases in carbon emissions. In contrast, BRICS countries exhibited a generally strong correlation, indicating that economic expansion in these nations overall corresponds to both increased energy consumption and emissions. For both India and China, the correlations among energy use, CO2 emissions, and GDP growth are remarkably proportionate, with positive correlations observed across all three indicators, distinct from the more heterogeneous patterns in the other BRICS and OECD economies. These distinctions are crucial for understanding the differing energy dynamics in developed and emerging economies.
Energy Consumption and CO2 Emissions: To further visualize this bivariate association, we used heatmaps, a prevalent method in data analysis and machine learning for revealing the strength and direction of correlations between variables. As shown in
Figure 3, patterns emerged across multiple countries. For instance, we observed a generally strong positive correlation between energy use per capita and CO
2 emissions per capita, a finding consistent with the determinations of Hoy et al. (2023) [
29] and Destek et al. (2020) [
17], although with variations by country. More specifically we found that in the US, energy consumption and CO
2 emissions are highly correlated (r = 0.92), while in Canada the correlation is markedly weaker (r = 0.16), suggesting the influence of divergent energy policies, technologies, or sectoral compositions. Among the BRICS countries, the correlation between energy consumption and CO
2 emissions is uniformly strong.
GDP Growth and CO2 Emissions: In contrast to the overall strong energy consumption–CO
2 emissions connection, we found the bivariate relationship between annual GDP growth per capita and CO
2 emissions per capita to be relatively weak. This result supports the conclusions of Shahbaz, Destek, Dong, and Jiao (2021) [
16], who discovered the CO
2 emissions–GDP growth association to be distinctly nonlinear and in the form of inverse U-shaped, N-shaped, or M-shaped curves, depending on national economic and developmental contexts. These varying curvilinear trajectories help explain the observed inconsistencies in the strength and direction of CO
2 emissions and GDP growth correlations across countries. The heatmaps also indicate a very low correlation between GDP growth and CO
2 emissions in OECD countries, particularly Canada and the US.
4.2. ARIMA Forecasting Results
In this section, we present the predictions of energy consumption and CO
2 emissions using ARIMA.
Figure 4 and
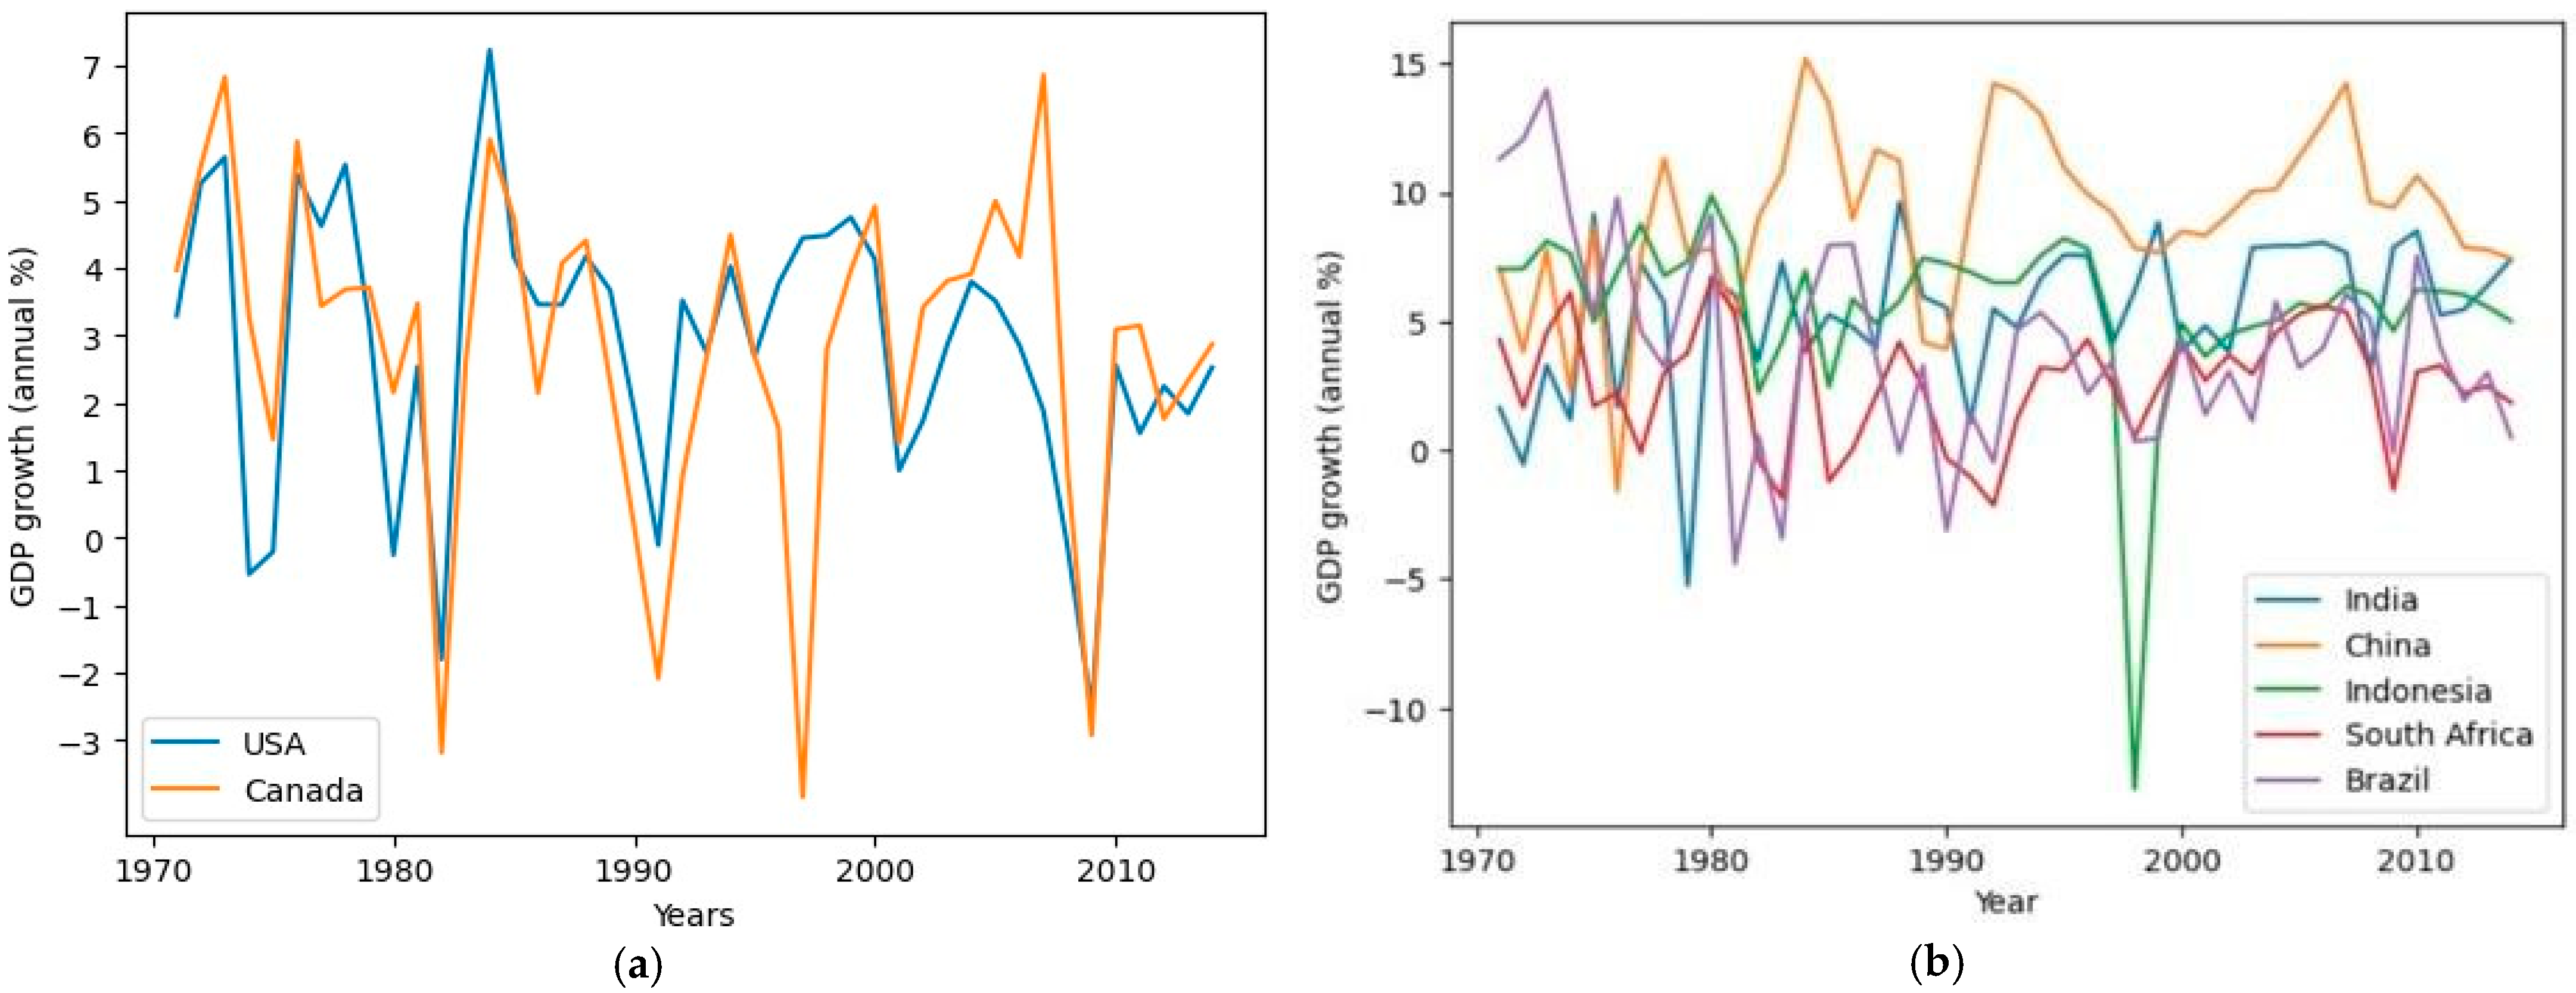
Figure 5 display the predicted energy usage per capita for the US and Canada decreasing along with the carbon emissions per capita. This forecast is consistent with the historical trends for these countries shown in
Figure 2a,b, suggesting that the energy usage per capita for the two countries, along with carbon emissions per capita, will indeed continue to decline to a sustainable threshold.
Similarly, for the selected BRICS countries (
Figure 6,
Figure 7,
Figure 8,
Figure 9 and
Figure 10), the projected trend is consistent with the historical trend presented in
Figure 2c,d. South Africa remains an exception, having both the highest energy usage per capita as well as CO
2 emissions per capita due to its overall concentration in energy-intensive mining industries.
The results obtained from our ARIMA-based forecasting provide valuable insights into the future trajectories of energy consumption and CO2 emissions in both OECD and BRICS countries. For instance, our forecasts indicated that while developed countries like the US and Canada are likely to continue their trend of decreasing per capita energy usage and CO2 emissions, emerging economies such as India and China may experience remarkable increases in both indicators as they pursue rapid economic growth. These findings collectively underscore the urgent need for policy-driven clean energy investments and the transition to renewable energy sources, as addressed in our discussion.
4.3. Patterns of Convergence and Divergence in Consumption and Emissions
When examining energy consumption per capita, the trends for China and Brazil appear to converge, which is consistent with their comparable trajectories of economic development, both having experienced significant growth during a similar period [
24]. Indonesia and India follow, exhibiting the lowest levels of per capita energy consumption, measured in kg of oil equivalent. In terms of CO
2 emissions per capita, South Africa, as noted, registers the highest levels, followed by China and then Brazil. India and Indonesia show comparable emissions trends, converging at approximately one metric ton per capita. Comparing our results with the OECD report on energy consumption and CO
2 emissions [
1], we detected a key discrepancy. While OECD countries are projected to reduce energy consumption over time, BRICS countries are expected to see an increase. We attribute this difference to the faster transition to renewable energy in developed nations [
30]. Shafiee and Topal predicted in 2008 that oil, gas, and coal would be fully depleted within 35, 107, and 37 years, respectively [
25]. However, recent policy shifts and technological advances have likely delayed this timeline [
3,
29], reinforcing the ongoing transition from fossil fuels.
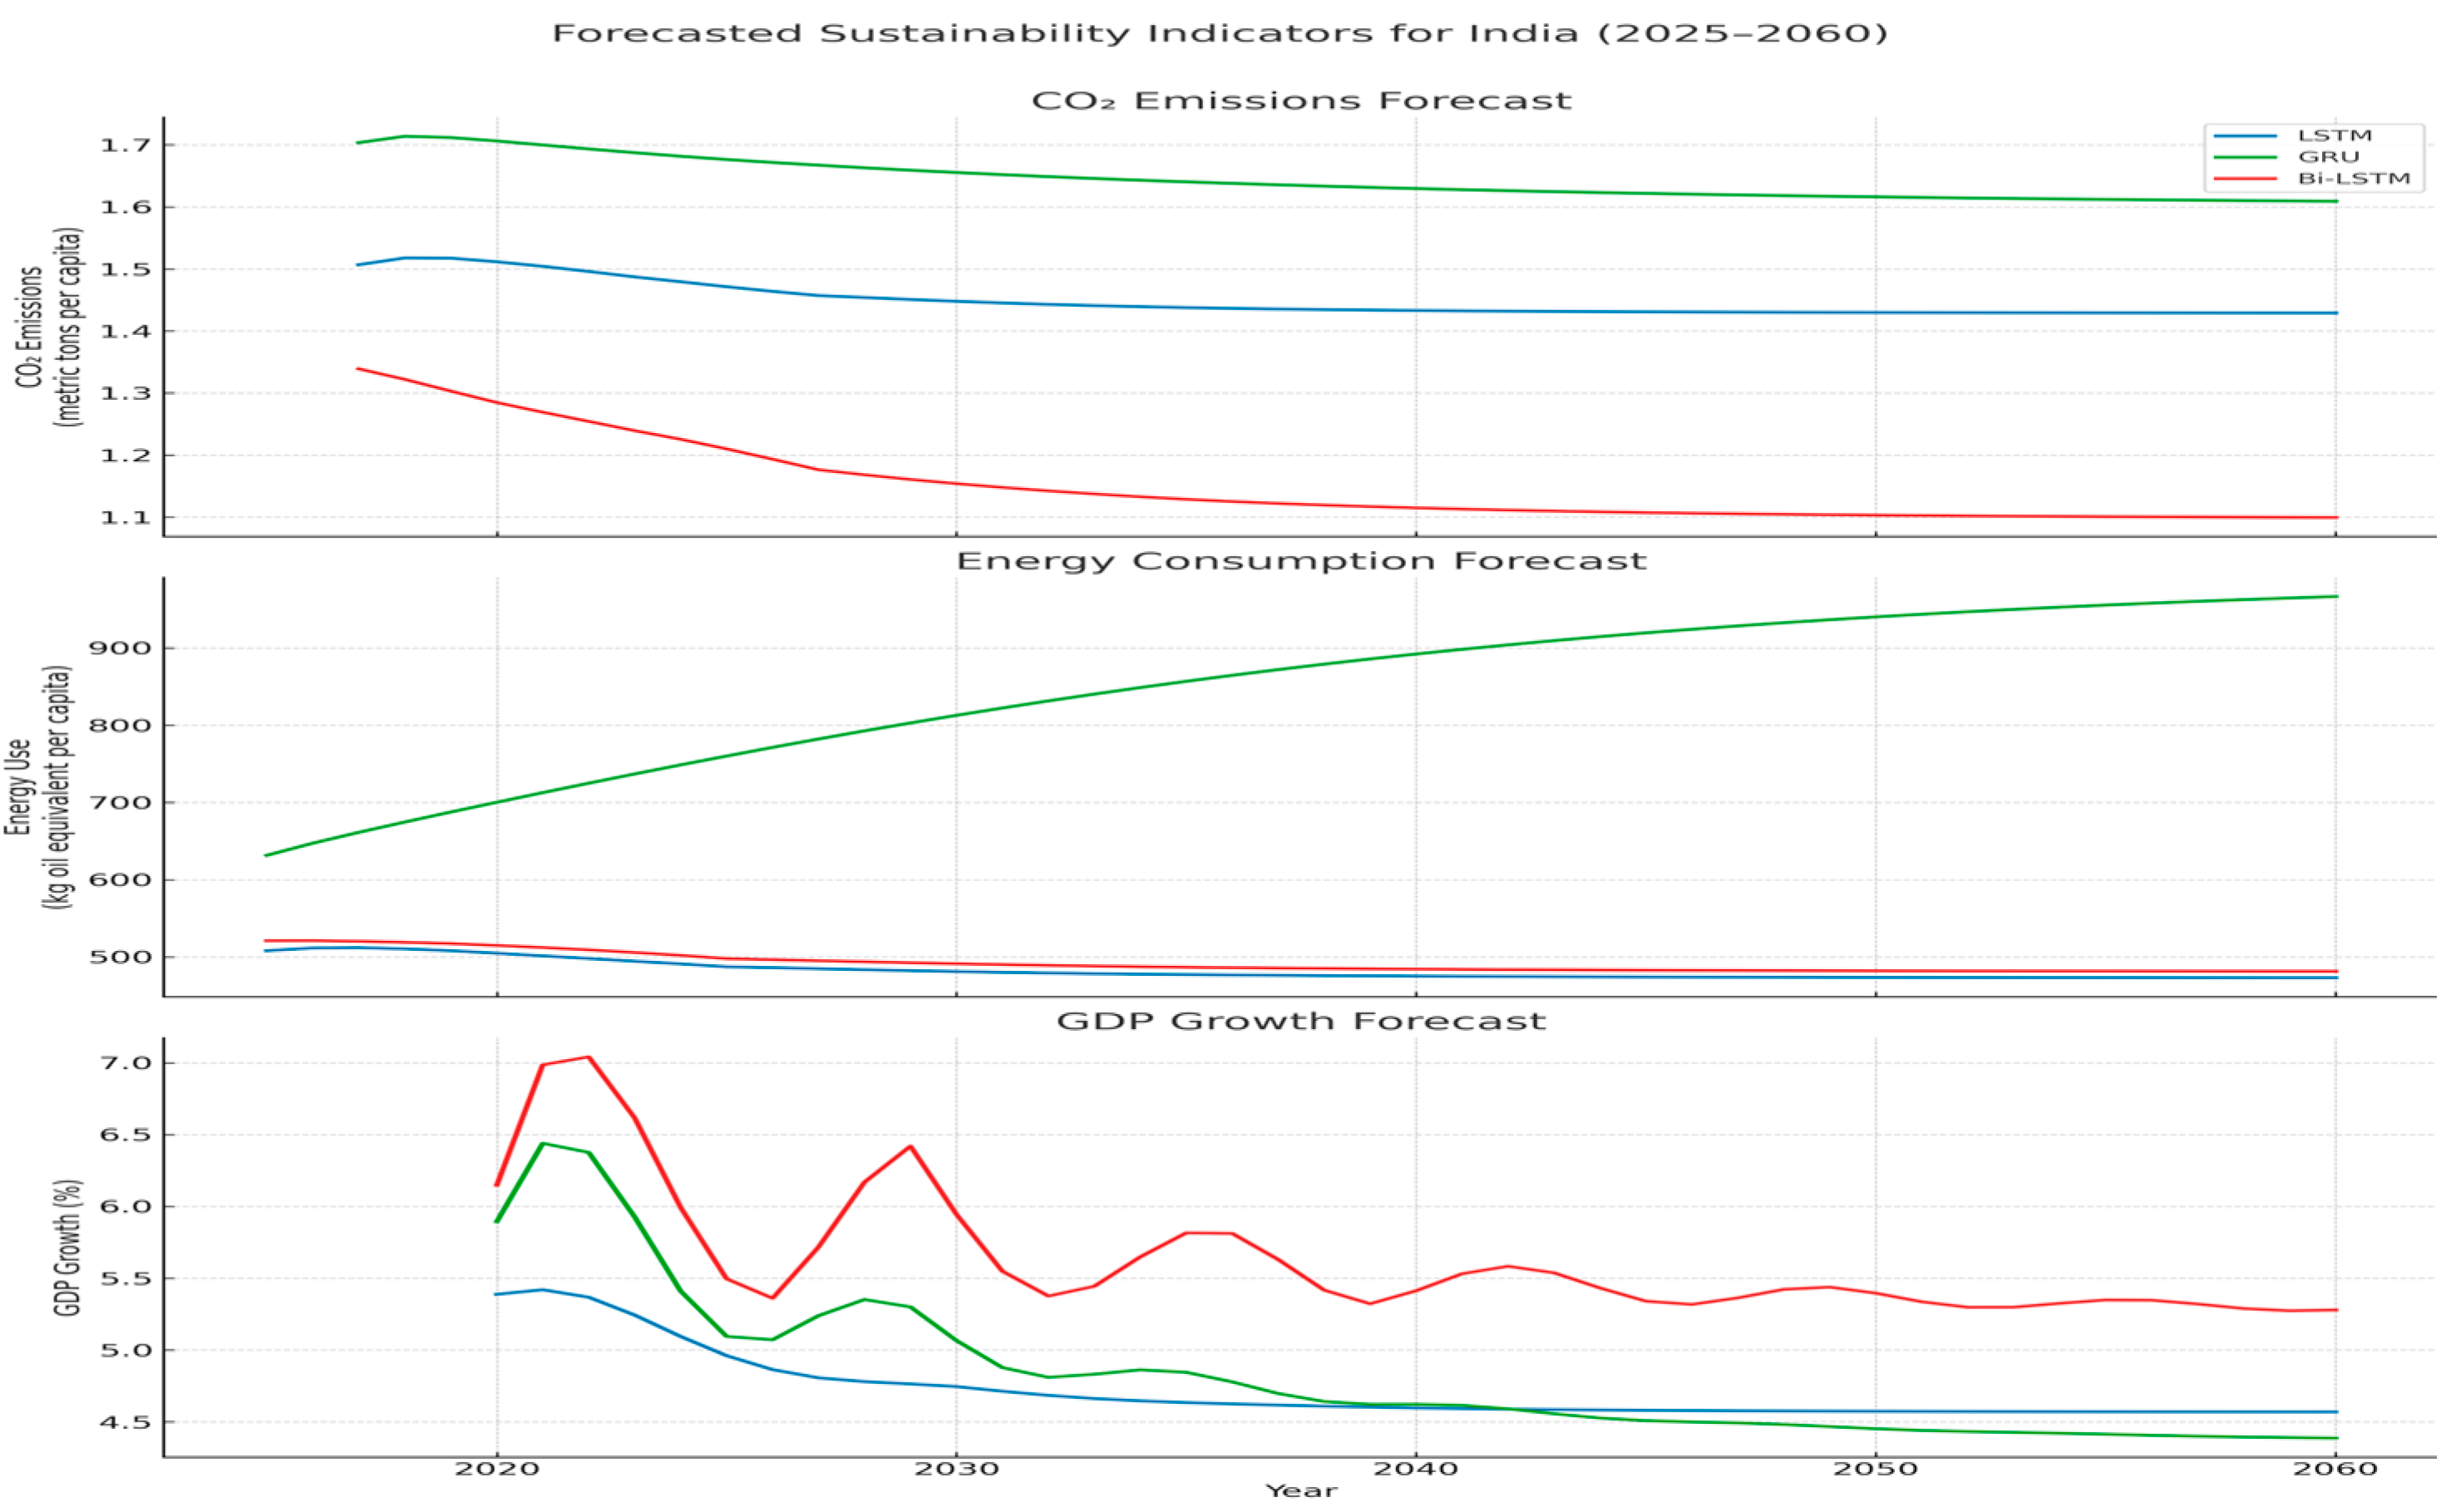
We also note that while our models generated forecasts based on consistent historical trends from the World Bank harmonized indicators, certain projections—particularly for India—revealed notable limitations. One such instance occurs in
Figure 6, where the model predicts a sharp decline in energy usage per capita in India, reaching a level by 2030 that falls below the 1980 value. This result is inconsistent with observed developmental trajectories and likely reflects the absence of more recent data beyond 2015 as well as limitations in the model in accounting for current policy shifts or structural changes in energy systems. This situation illustrates a key constraint of long-horizon forecasting: extrapolations from incomplete data may yield results that diverge from plausible empirical baselines. We therefore underscore the importance moving forward of triangulating our ARIMA forecasts with up-to-date national datasets [
31], which are not currently accessible to us but will prospectively be available to future researchers. Scenario-based policy models and more advanced machine learning, specifically, neural network models, can also improve the robustness of projections.
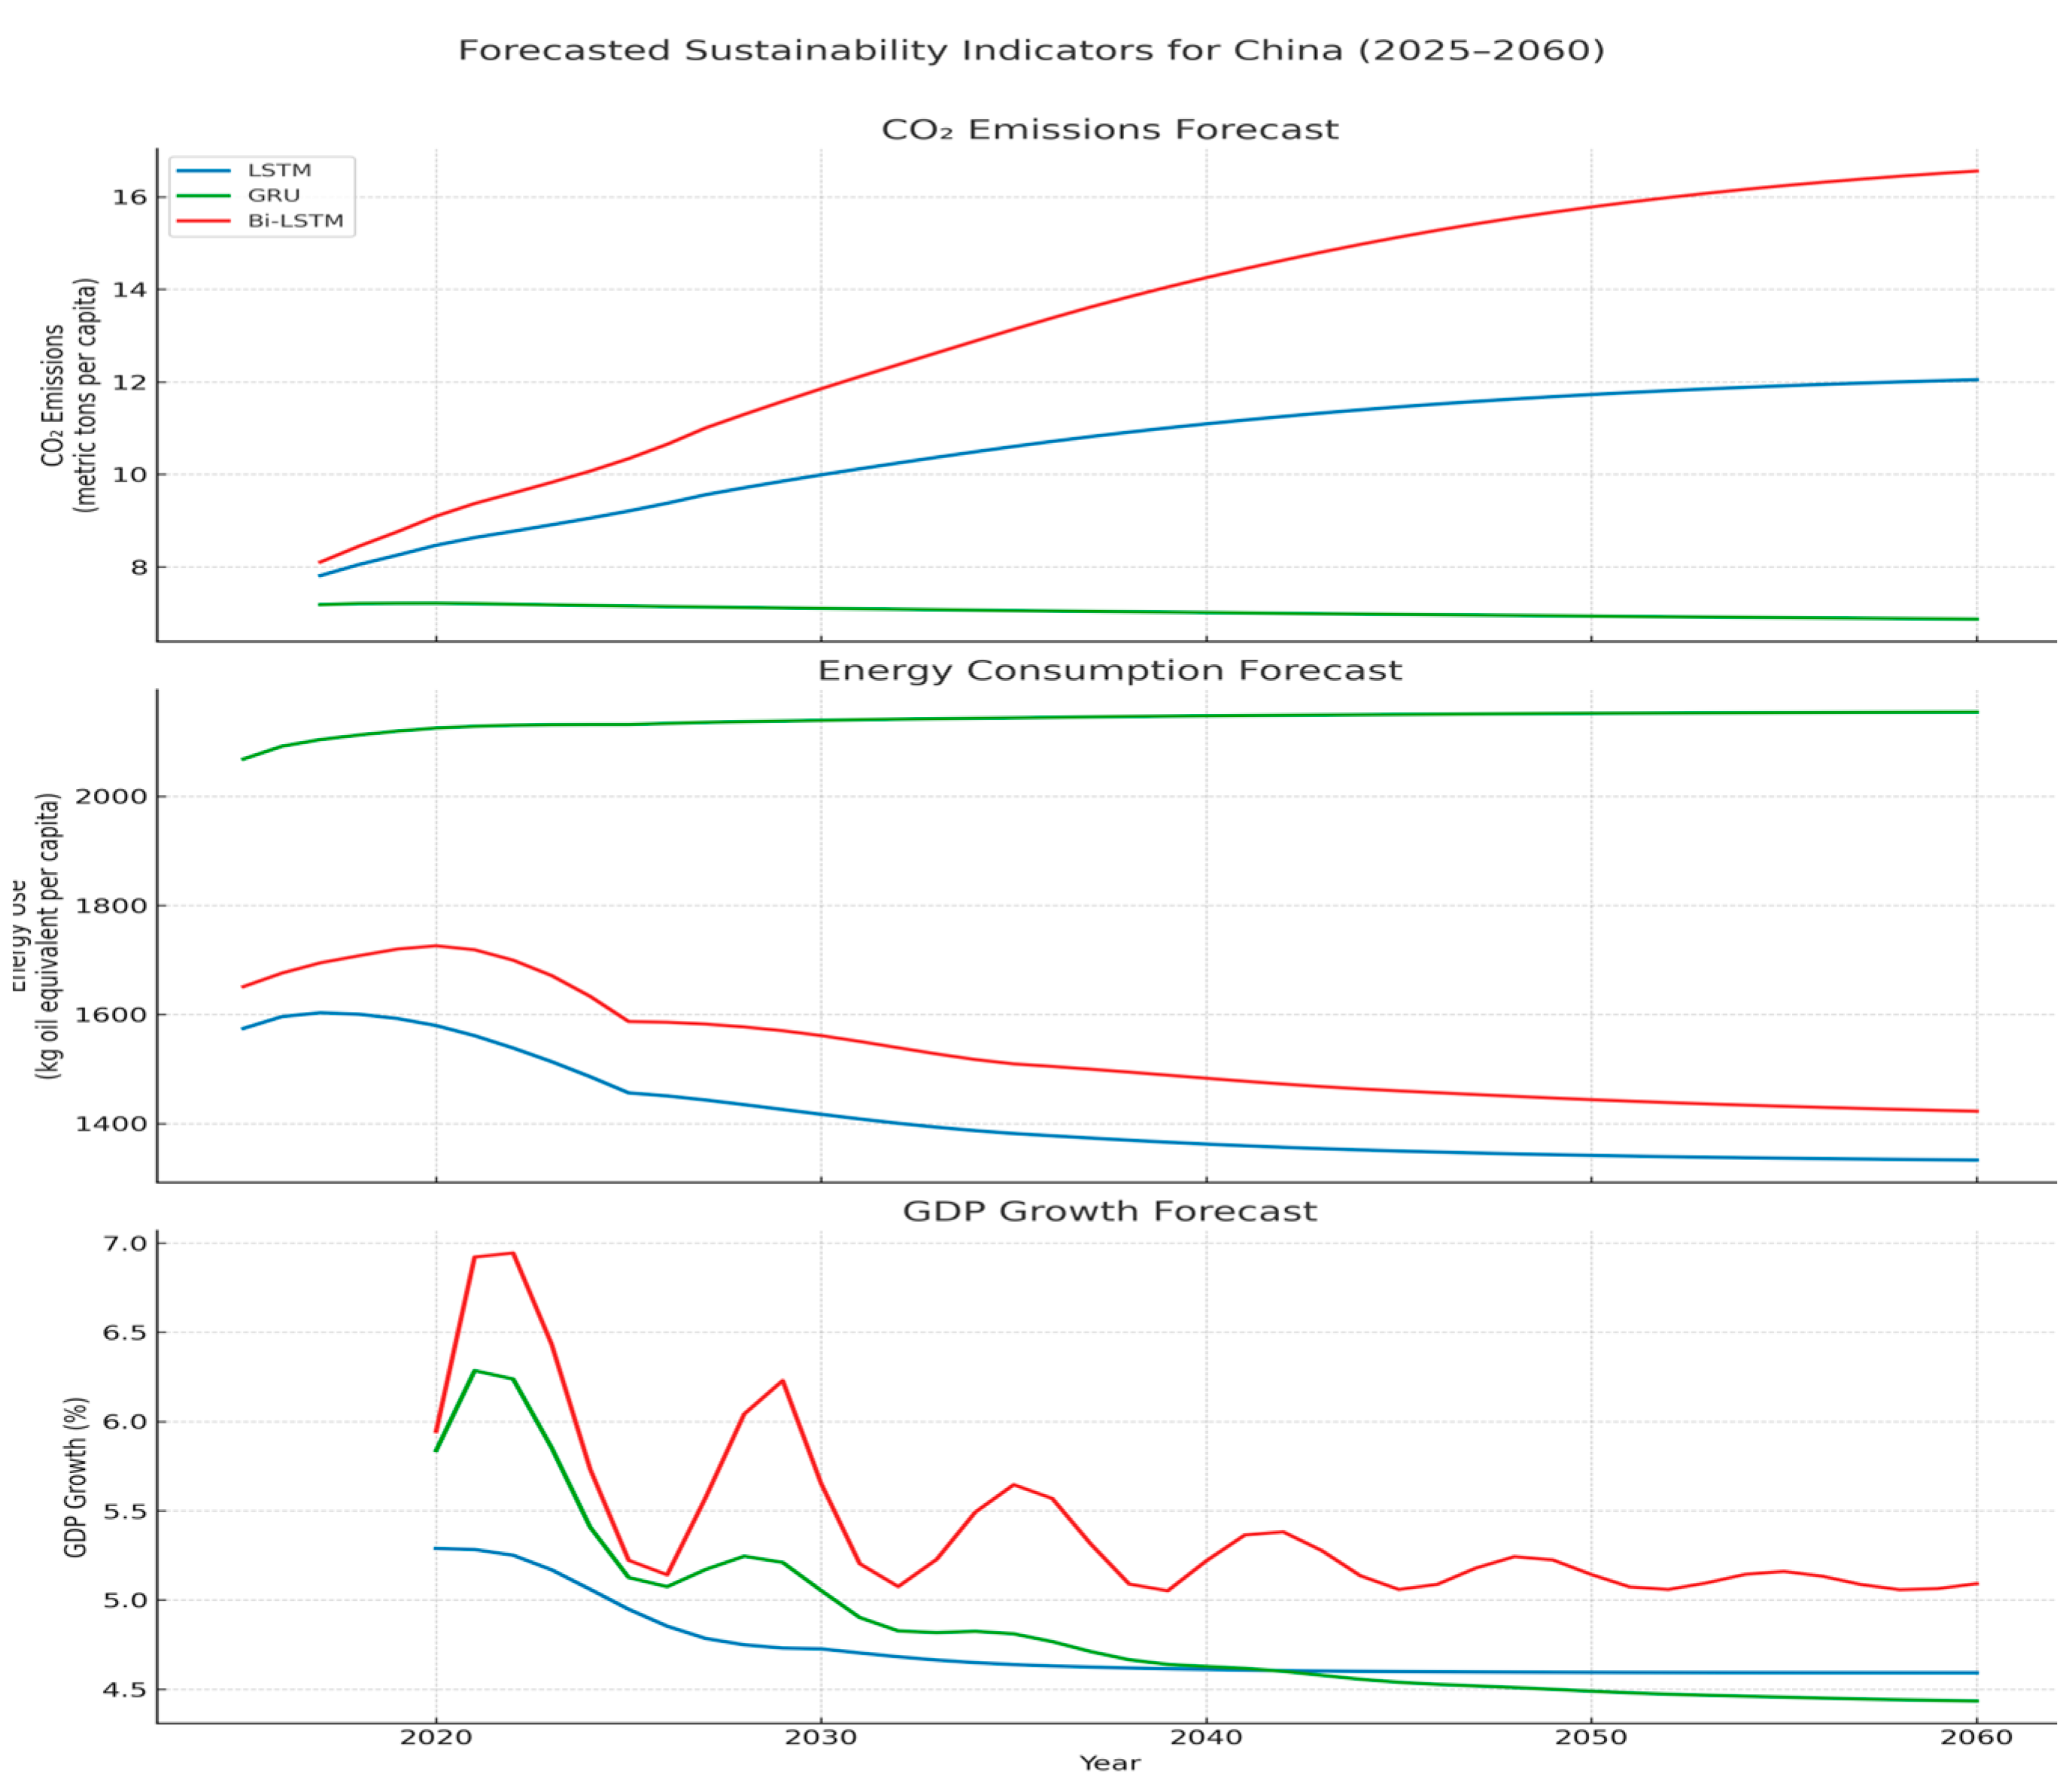
4.4. Deep Learning Forecasting Results
Using deep learning forecasting revealed deviations from our initial forecasts. To refine the earlier predictions, we applied three advanced machine learning methods—long short-term memory (LSTM), gated recurrent unit (GRU), and bidirectional LSTM (Bi-LSTM)—for forecasting annual CO2 emissions, energy usage, and GDP growth in Brazil, Canada, China, India, Indonesia, South Africa, and the US through 2060. LSTM, GRU, and Bi-LSTM are recurrent neural networks belonging to deep learning and are also considered part of the broader arena of machine learning, specifically designed to model sequential data and capture temporal dependencies in time series. GRU provides a more streamlined alternative to LSTM by using fewer gates and parameters, which makes it computationally more efficient while still capable of effectively modeling long-term dependencies. Bi-LSTM extends the standard LSTM model by processing input sequences in both forward and backward directions, retaining context from both past and future time steps for improved sequence prediction. The design- and architecture-specific robustness checks of our LSTM, GRU, and Bi-LSTM models support the reliability of our projections based on our focus on pre-COVID-19 national datasets (
Figure 11,
Figure 12,
Figure 13,
Figure 14 and
Figure 15).
We began by cross-checking our datasets with data and trend analyses from the OECD (2024) and UN DESA (2024) reports [
2,
32]. While our model was initially trained on harmonized historical indicators from the World Bank, these supplementary sources verified continuity in key variables such as energy use, GDP growth, and emissions trajectories beyond 2015.
The comparative analysis of LSTM, GRU, and Bi-LSTM neural network forecasts across major emerging and advanced economies reveals both the promise and limitations of machine learning in modeling long-term energy transitions. While the LSTM models tend to smooth volatility and suggest stabilization in emissions and energy use—especially for Brazil and the US—the GRU and Bi-LSTM models often predict dramatic shifts, including implausible GDP surges or collapses in energy consumption. These inconsistencies highlight the sensitivity of long-range forecasts to model architecture and the limited availability of high-frequency, contextualized data. Notably, the relative agreement among models for China and India suggests that in some contexts, deep learning can detect credible trajectories of decoupling economic growth from CO2 emissions. However, the divergence across models for countries like Brazil and South Africa underscores the need for caution. Together, these results from emerging and advanced economies illustrate both the potential of neural network forecasting for informing low-carbon development strategies and the eventual need for further data and policy expertise beyond the scope of the present study and indicative of future research.
Computationally, these findings demonstrate the complementary value of traditional time-series forecasting (ARIMA) and leading-edge deep learning models (LSTM, GRU, Bi-LSTM) in projecting long-term energy consumption and CO2 emissions. While ARIMA offered interpretable, historically grounded projections with strong performance in OECD countries, our neural network analyses discerned important model-specific strengths and limitations. For example, the LSTM model effectively smoothed out volatility and provided stable forecasts, particularly for the US and Brazil. In contrast, the GRU and Bi-LSTM models produced more dynamic trajectories, sometimes predicting sharp inflection points in emissions or energy use, highlighting their sensitivity to sparse or outdated training data. Notably, there was relatively high model agreement for China and India, where economic and emissions trends are more consistently documented, suggesting the potential of neural networks to capture credible decoupling phenomena when trained on robust datasets. Collectively, these findings suggest that ensemble approaches integrating ARIMA for trend extraction with neural networks for residual learning may offer a more balanced and accurate forecasting strategy, particularly when paired with expanded datasets and higher frequency of data collection.
Substantively, our forecasts project that energy consumption and CO2 emissions will continue to decline in advanced economies like the US and Canada while rising in emerging markets such as India and China, mirroring industrial trajectories and accentuating uneven progress toward sustainability. These projections reinforce the need for targeted policies—such as carbon pricing, renewable energy subsidies, AI-enabled smart grids, and cross-sectoral investment incentives—to accelerate the decarbonization of energy systems, particularly in growth-intensive economies.
4.5. Training Error Comparisons Across Models
Recognizing that uncertain future phenomena may affect longer-range forecasting, we use training error comparisons for our ARIMA, LSTM, GRU, and Bi-LSTM models to evaluate baseline model fit and learning behavior under consistent conditions. As noted, we constrained our dataset to end in 2019, just before the onset of COVID-19, to maintain temporal consistency and avoid the extreme volatility and data anomalies introduced by the pandemic. This decision ensured that we trained and tested our models on data reflecting stable economic and environmental circumstances rather than crisis-driven fluctuations. Given the scope and goals of the study—developing long-term sustainability forecasts for CO
2 emissions, energy consumption, and GDP growth across emerging and developed nations—we focused on MAPE training error comparisons across our LSTM, GRU, and Bi-LSTM models to assess baseline learning performance and model fit under controlled historical conditions (
Table 1).
While forecasting errors provide a better measure of real-world generalizability, our long-range projections (2025–2060) inherently lack observed ground truth data beyond 2024, limiting the availability of traditional out-of-sample validation. Training errors are more readily available than forecasting errors because training errors are computed on historical data already observed and used in model fitting, whereas forecasting errors require future or out-of-sample data that may be incomplete, inconsistent, or not yet validated. Therefore, training error comparisons offer an informative reference point to understand the capability of each model for capturing temporal dependencies in the multivariate time-series analysis conducted prior to forecasting. Our approach allowed us to systematically evaluate the internal learning performance of each model while acknowledging that long-horizon predictive accuracy, particularly under post-pandemic uncertainty, may deviate due to unmodeled external shocks.
We prepared the data and obtained training errors as follows: using a MinMaxScaler, we normalized the historical time-series data and then restructured it into sequential patterns through a sliding window, where each input sequence of 10 time steps predicted the next value. The MinMaxScaler is a data preprocessing technique that transforms features by scaling them to a fixed range—typically [0, 1]—based on the minimum and maximum values in the dataset. Three recurrent neural network variants—LSTM, GRU, and Bi-LSTM—were implemented, each with a 2-layer architecture, 50 hidden units per layer, and dropout regularization to mitigate overfitting. The models were trained under supervised learning with the dataset split chronologically, reserving the final 10 points for validation and using backpropagation through time with mean-squared error (MSE) loss and the gradient-based Adam optimizer.
Distinct mechanisms captured temporal dependencies in each model: LSTM based on forget, input, and output gates; GRU based on reset and update gates; and Bi-LSTM based on processing sequences in both forward and backward directions. For forecasting, we applied an autoregressive strategy beginning with the last known 10-value sequence to predict the next time step, iteratively appending new predictions, and removing the oldest values to form subsequent input windows. This loop generated long-range forecasts, which we inverse-transformed to the original scale with the awareness that uncertainty increases as errors compound over time. We additionally implemented cross-model ensemble averaging to reduce individual model bias. We initially evaluated model performance using MSE, mean absolute error (MAE), root-mean-squared error (RMSE), and mean absolute percentage error (MAPE) for absolute, relative, and scale-specific errors.
Table 1 reports training error comparisons only for the LSTM, GRU, and Bi-LSTM models to focus on advanced deep learning methods best suited for capturing nonlinear dynamics in emerging economies. The training error comparisons exclude the US and Canada to spotlight the modeling challenges unique to high-growth, structurally variable contexts. We used MAPE as the key metric to enable scale-independent, intuitive cross-country comparisons of relative error magnitude.
The comparative analysis reveals significant variations in the model performance metrics across different countries and sustainability indicators. GDP growth prediction presents the greatest challenge, with MAPE values ranging from 20% to over 150%, indicating the inherent volatility of economic growth patterns. This volatility likely stems from the compound interplay of political, economic, and external factors influencing GDP fluctuations. Energy usage and CO2 emissions show more predictable patterns, with most models having MAPE values below 20%, suggesting these energy use and carbon emissions follow more stable temporal trends that neural networks can effectively capture.
Country-specific performance varies considerably. South Africa shows exceptional predictability for CO2 emissions (MAPE as low as 2.95%), while Brazil exhibits extreme difficulty in GDP prediction (over 100% MAPE). The GRU model stands as the most consistent performer with the lowest average MAPE (20.54%) across all scenarios, likely due to its simplified gating mechanism that prevents overfitting while maintaining sufficient complexity. Interestingly, no single model dominates across all scenarios, suggesting that optimal model selection depends heavily on the specific country–sustainability indicator combination, emphasizing the importance of empirical testing rather than theoretical assumptions in forecasting applications.
5. Discussion
Our initial combination of exploratory data analysis, correlation assessments, and ARIMA-based forecasting proved to be an effective preliminary means of predicting energy usage and CO2 emissions. This early approach enhanced our understanding of the complex interrelationships of population growth, economic development, and energy consumption and emissions and pointed the way to additional analyses to run. These analyses provided further insights toward a global momentum for devising guidelines and taking actions for promoting sustainability.
Deep learning techniques offered a step beyond ARIMA-based linear forecasting. LSTM networks more effectively captured the complex nonlinear interdependencies among population growth, energy consumption, economic expansion, and carbon emissions. The GRU variant also modeled long-term temporal patterns, drawing on multivariate time-series data common in comparative international environmental studies. More recent methods such as temporal convolutional networks (TCNs) and attention-based architectures such as temporal fusion transformers (TFTs) can even further enhance predictive accuracy and interpretability by capturing both short- and long-range dependencies. Ensemble or hybrid approaches that combine ARIMA for trend extraction with deep learning and recurrent neural network models such as LSTM, GRU, TCN, or TFT for residual learning can further distinguish divergent demand and usage pathways between OECD and BRICS economies. In the present study, we selected LSTM, GRU, and Bi-LSTM because they represented foundational and widely validated sequential modeling architectures. These methods balanced computational efficiency and interpretability for forecasting long-term sustainability trends in diverse national contexts.
The limited number of data points due to the annual nature of World Bank data hindered model accuracy. This issue highlights the need for more frequent data collection to enhance forecasting precision. Future research should focus not only on refining predictive models but also on improving data collection methodologies to capture real-time trends more effectively. A practical goal is that by better understanding projected trends, policymakers can better strategize to mitigate the environmental impacts of energy consumption—that is, lowering carbon emissions while maintaining economic strength.
While the ARIMA model offers robustness for time-series forecasting, integrating alternative approaches, such as those we performed already with designated neural networks (e.g., LSTM, GRU, and Bi-LSTM) and propose with additional neural networks (e.g., TCN or TFT) or with decision tree-based models (e.g., random forests or XGBoost), can enhance our capacity to capture nonlinearities and complex interactions among GDP, energy use, and CO2 emissions. Decision trees can be particularly useful when there is further data on contributing factors to the prediction of energy usage and carbon emissions per capita. Moreover, incorporating scenario analyses would allow us to simulate the impact of varying policy interventions or technological adoption rates. These enhancements would offer more practicable perspectives for decision makers seeking deeper insights into potential pathways toward a low-carbon future and evaluating trade-offs between economic growth and sustainability goals.
For instance, nuclear energy, due to its high “clean” energy production, is a conceivable alternative to replace nonrenewable energy sources. Thurner, Mittermeier, and Küchenhoff (2017) suggested that it would take approximately 55–65 months to build a medium-sized nuclear plant producing 106,962 MW [
33]. Nuclear technology can enable the same amount of energy in less time and at lower investment cost compared with the nonrenewable energy sources.
Future analyses can also draw on further machine learning modeling and AI computational techniques to understand how to optimize energy consumption based on pledged carbon emission targets [
34,
35]. We would not consider these pledged targets to be linked to annual GDP growth per capita because we earlier found that GDP growth has a very weak correlation with CO
2 emissions per capita. However, we did find that energy consumption and CO
2 emissions are more strongly linked, depending on national context and energy production levels.
Recent studies have proposed even more advanced AI-based methodologies for optimizing renewable energy systems and carbon emissions forecasting. Mysore (2024) recommends the application of fuzzy logic algorithms and neural networks to enhance the efficiency of renewable energy utilization and grid management [
36]. Fuzzy logic is a computational approach that handles uncertainty and imprecision by allowing variables to take on a continuum of truth values between 0 and 1, making it particularly well suited for modeling complex, nonlinear relationships in energy systems where inputs and outputs often are not strictly binary. These models can accurately forecast grid load, identify system faults, predict energy output, and support automation and cybersecurity in the energy infrastructure. Relatedly, Luo, Zhuo, Liu, and Xu (2024 introduce an even more complex ensemble method, the Multi-Universe Quantum Harmony Search Algorithm Dynamic Fuzzy System Ensemble, which aims to improve carbon emissions prediction by integrating dynamic fuzzy logic with renewable energy source data [
37]. Dynamic fuzzy logic extends traditional fuzzy systems by enabling rule sets and membership functions to evolve in response to real-time data, making it especially effective in environments with continuously changing conditions, such as renewable energy networks. These approaches highlight the growing potential of AI to support more resilient, responsive, and low-carbon energy systems.
Alternatively, we can continue to use—or complementarily use—simpler and more explainable forecasting models such as the ARIMA that we have implemented in this study. The benefits of the more easily explainable models are for energy producers and policymakers to more quickly understand the impact of various inputs into the prediction of energy usage and carbon emissions per capita. Through this information, stakeholders can manipulate conditions to push the prediction trends of energy usage and carbon emission in the desired direction. However, using simple models means that stakeholders are foregoing accuracy for explainability.
While machine learning methods in general and deep learning methods in particular are capable of modeling long-range dependencies, their long-term forecasting depends on the quality, granularity, and stability of the available data, and they can be sensitive to overfitting or concept drift when projecting far into the future or depending on changing underlying distributions. When carefully applied, these models facilitate a more nuanced futurecasting with data-informed scenarios anticipating divergent sustainability trajectories and energy transitions for different national and regional contexts in the drive to a low-carbon future.
A roadmap of specific policy recommendations and strategic priorities for clean energy investment would highlight actions such as targeted subsidies for renewable infrastructure, support for grid modernization, and incentives for private-sector adoption of clean technologies. In addition to broad investment in renewable energy infrastructure, further specific policy proposals include implementing carbon pricing mechanisms (such as cap-and-trade or carbon taxes) to internalize environmental costs and offering time-bound tax credits for companies that adopt energy-efficient technologies or achieve verifiable emissions reductions. Governments could also support public–private partnerships to fund AI-enabled smart grid systems and incentivize data-sharing platforms that improve transparency and coordination across energy producers and consumers. AI and machine learning also have an increasingly important role to play in improving energy forecasting accuracy and supporting real-time carbon management—for example, through adaptive demand–response systems, predictive maintenance for energy infrastructure, and AI-driven carbon-tracking tools. These policy suggestions and implications, as well as supportive analytic recommendations, reinforce the applied value of our findings and also point to promising avenues for future interdisciplinary research. A low-carbon future can thrive at the intersection of data science, energy policy, and sustainable development.
In essence, the transition from fossil fuels to renewable energy must happen. Arutyunov and Lisichkin (2017) determined that present trajectories predict that by 2035, energy usage from oil, coal, and natural gas will be equal, with 85% of usage by 2050 still based on fossil fuels [
30]. As a counterpoint, our analyses suggest that with the use of machine learning and AI modeling, managers, policymakers, and stakeholders can successfully transition to cleaner, more sustainable, low-carbon sources for most of our global energy usage.
6. Conclusions
This study set out to explore how population growth and economic development are related to energy consumption and CO
2 emissions in selected OECD and BRICS nations, with a focus on both futurecasting and supporting the global transition to low-carbon energy. As demonstrated through our time-series analysis, advanced modeling, and engagement with the literature, there exist multiple computational approaches for forecasting energy consumption to better match future energy usage with carbon mitigation goals [
17,
29]. While the uncertainty of future developments, including levels of population increase and outside investment [
6,
38], inherently limits the precision of such forecasts, the global imperative to transition to sustainable energy systems necessitates the application of leading-edge algorithms and analytic technologies to address the projected consequences of climate change and ozone depletion.
Drawing on World Bank harmonized indicators and applying both ARIMA and deep learning analysis, we uncovered important divergences in energy emissions between advanced and emerging economies. Specifically, our analyses revealed a strong association between energy use per capita and CO
2 emissions but a much weaker and often nonlinear association between GDP growth and emissions—findings that align with the previous literature [
16,
17,
29]. These distinctions underscore the need for country-specific strategies rather than one-size-fits-all models for decarbonization.
Implications for future research include integrating more recent national-level datasets as they become available, triangulating model outputs with scenario-based policy simulations, and expanding the country set to incorporate additional transitional economies. Moreover, extending model architectures to include attention-based models such as Temporal Fusion Transformers (TFTs) and incorporating decision-tree-based algorithms (e.g., XGBoost) may further refine predictive power and improve interpretability.
To improve the precision and relevance of predictions, we emphasize the need for incorporating several critical types of data currently underutilized in time-series forecasting: (1) national and provincial data on renewable energy adoption rates (e.g., solar, wind, hydroelectric); (2) updated metrics on nuclear energy production and deployment timelines; (3) policy implementation indicators, such as enforcement dates and regional coverage of carbon pricing or renewable portfolio standards; and (4) sector-specific consumption and emissions data, including disaggregated usage by industrial, transportation, and residential sectors. These variables are key to capturing the transitions underway in energy systems and to training models capable of detecting policy-driven inflection points.
Our study provides a framework for transitioning from fossil fuels to nuclear energy or other sustainable sources as lower-carbon alternatives. Future research can further substantiate our findings by integrating data on extant and anticipated levels of renewable energy production and comparing these with predicted energy consumption. Additionally, quantifying the extent to which the substitution of fossil fuels with renewable energy sources reduces carbon emissions would further support policy and investment strategies aimed at balancing energy security, population growth, and economic development [
16]. Collaboration among data scientists, energy policy analysts, and sustainability experts will be essential for designing adaptive systems capable of supporting secure and sustainable energy transitions at scale.
A deeper understanding of the interplay of national demographic trends, economic development, and historical energy usage—encompassing fossil fuel and extractive energy consumption and production, renewable energy deployment, and carbon emissions—will enhance the predictive accuracy of future energy scenarios. Increasingly sophisticated machine learning techniques, including neural networks, ensemble models, and other AI-driven approaches, will further develop these lines of research and refine and strengthen initiatives for a global paradigm shift toward low-carbon, sustainable energy systems. In sum, our findings highlight the critical role of both analytic precision and institutional coordination in advancing a global clean energy transition. While fossil fuels currently dominate global energy use, the integration of machine learning, AI forecasting, and intensive policy action can facilitate a proactive transference toward sustainable and low-carbon alternatives, ensuring that economic growth and environmental responsibility need not remain in conflict.


 ,
, 


