_Su.png)
Experimental Study on the Performance of Sustainable Epoxy Resin-Modified Concrete Under Coupled Salt Corrosion and Freeze–Thaw Cycles

Abstract
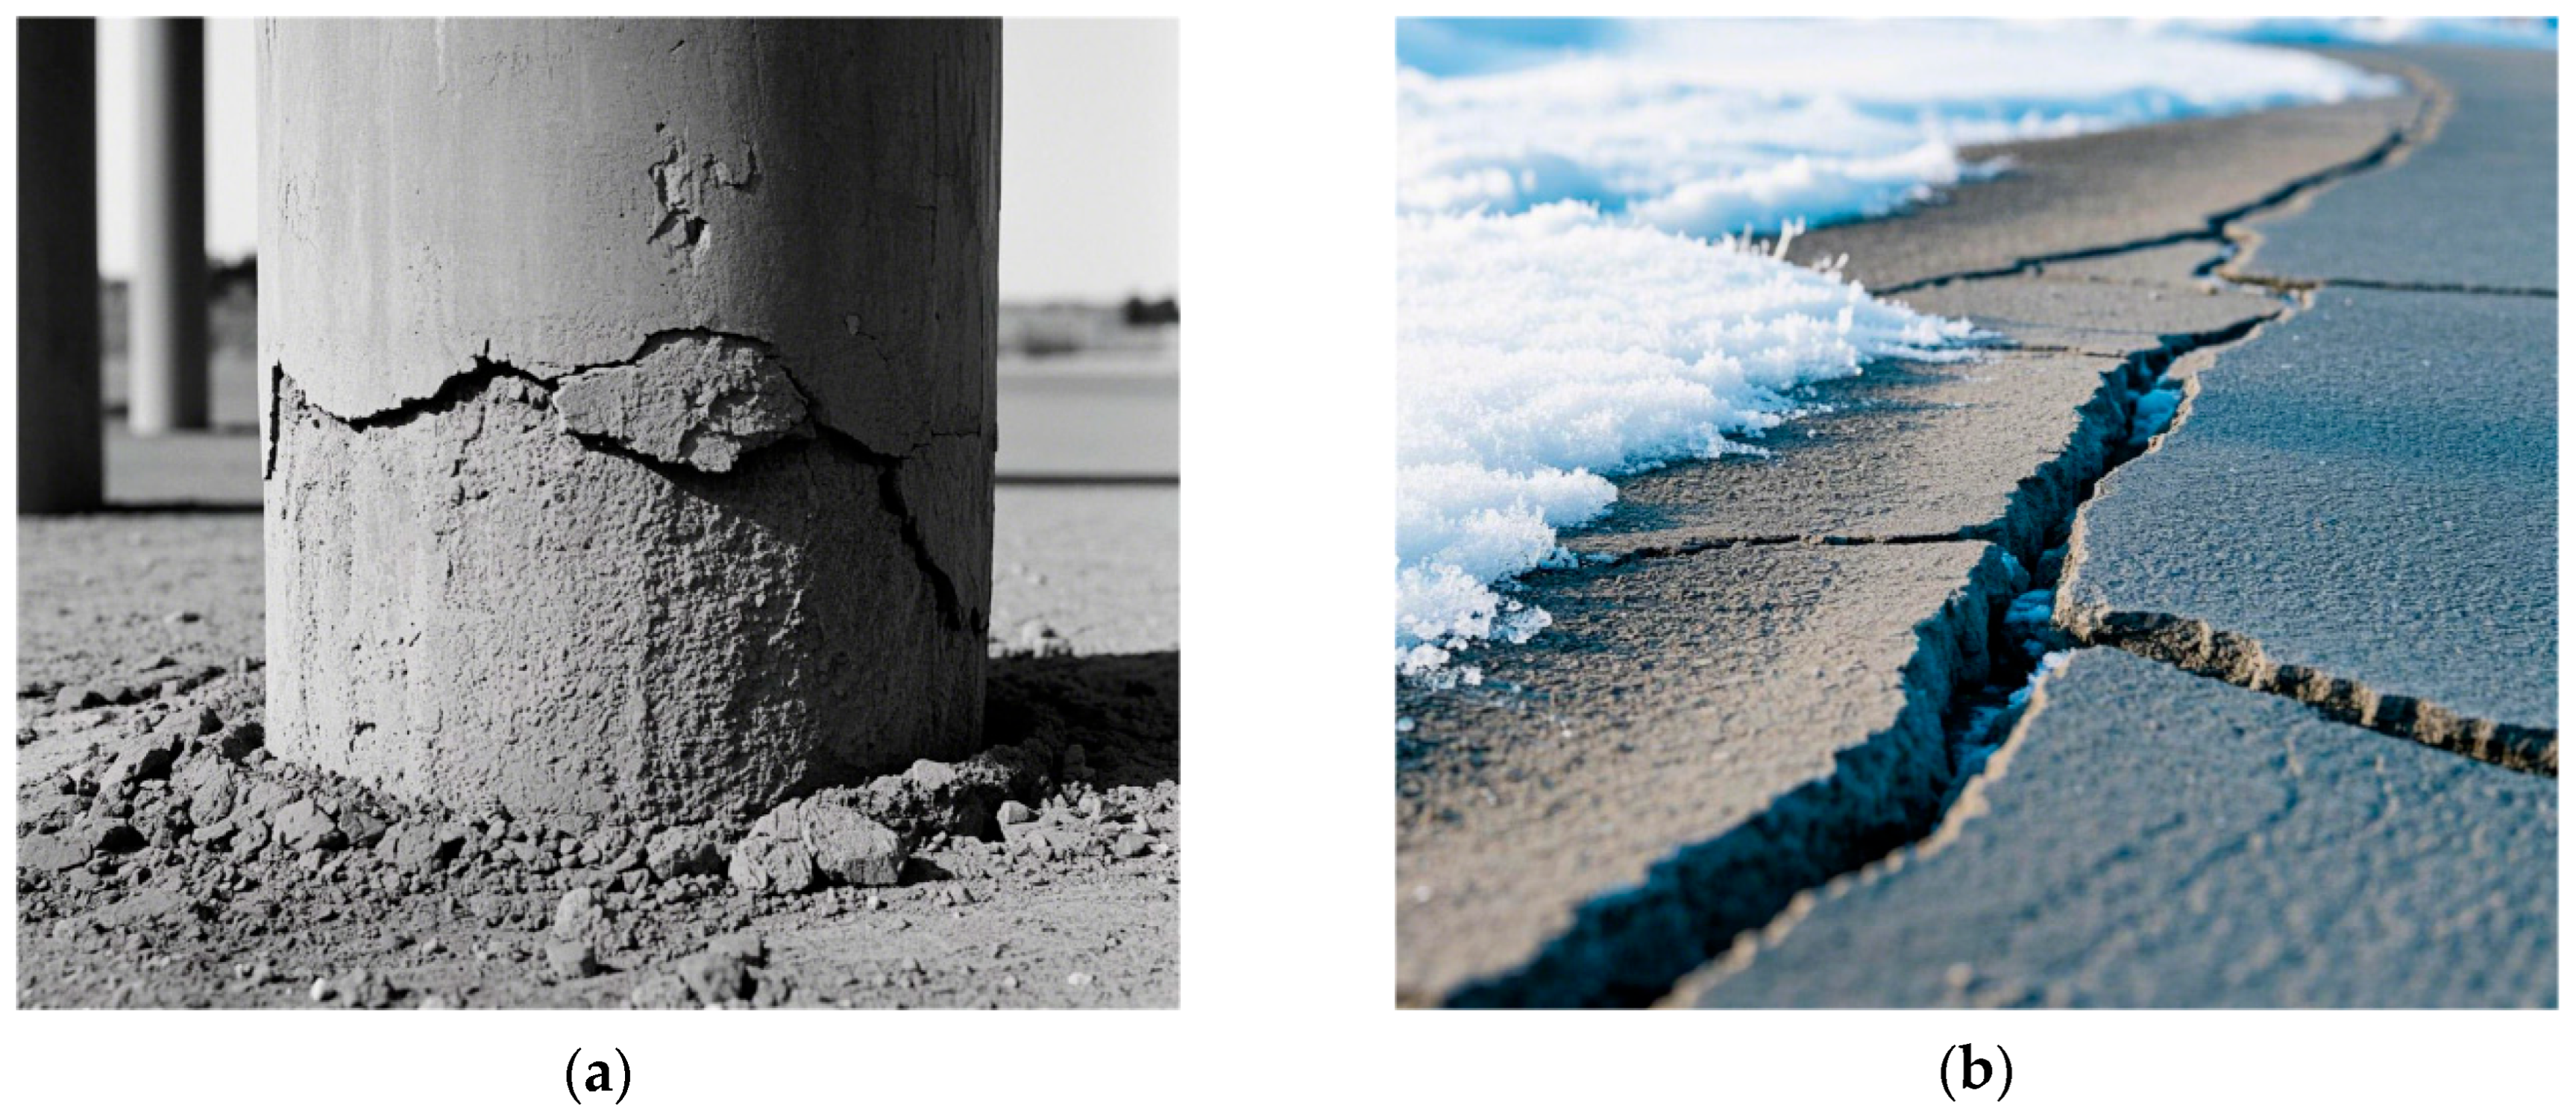
1. Introduction
2. Specimen Fabrication
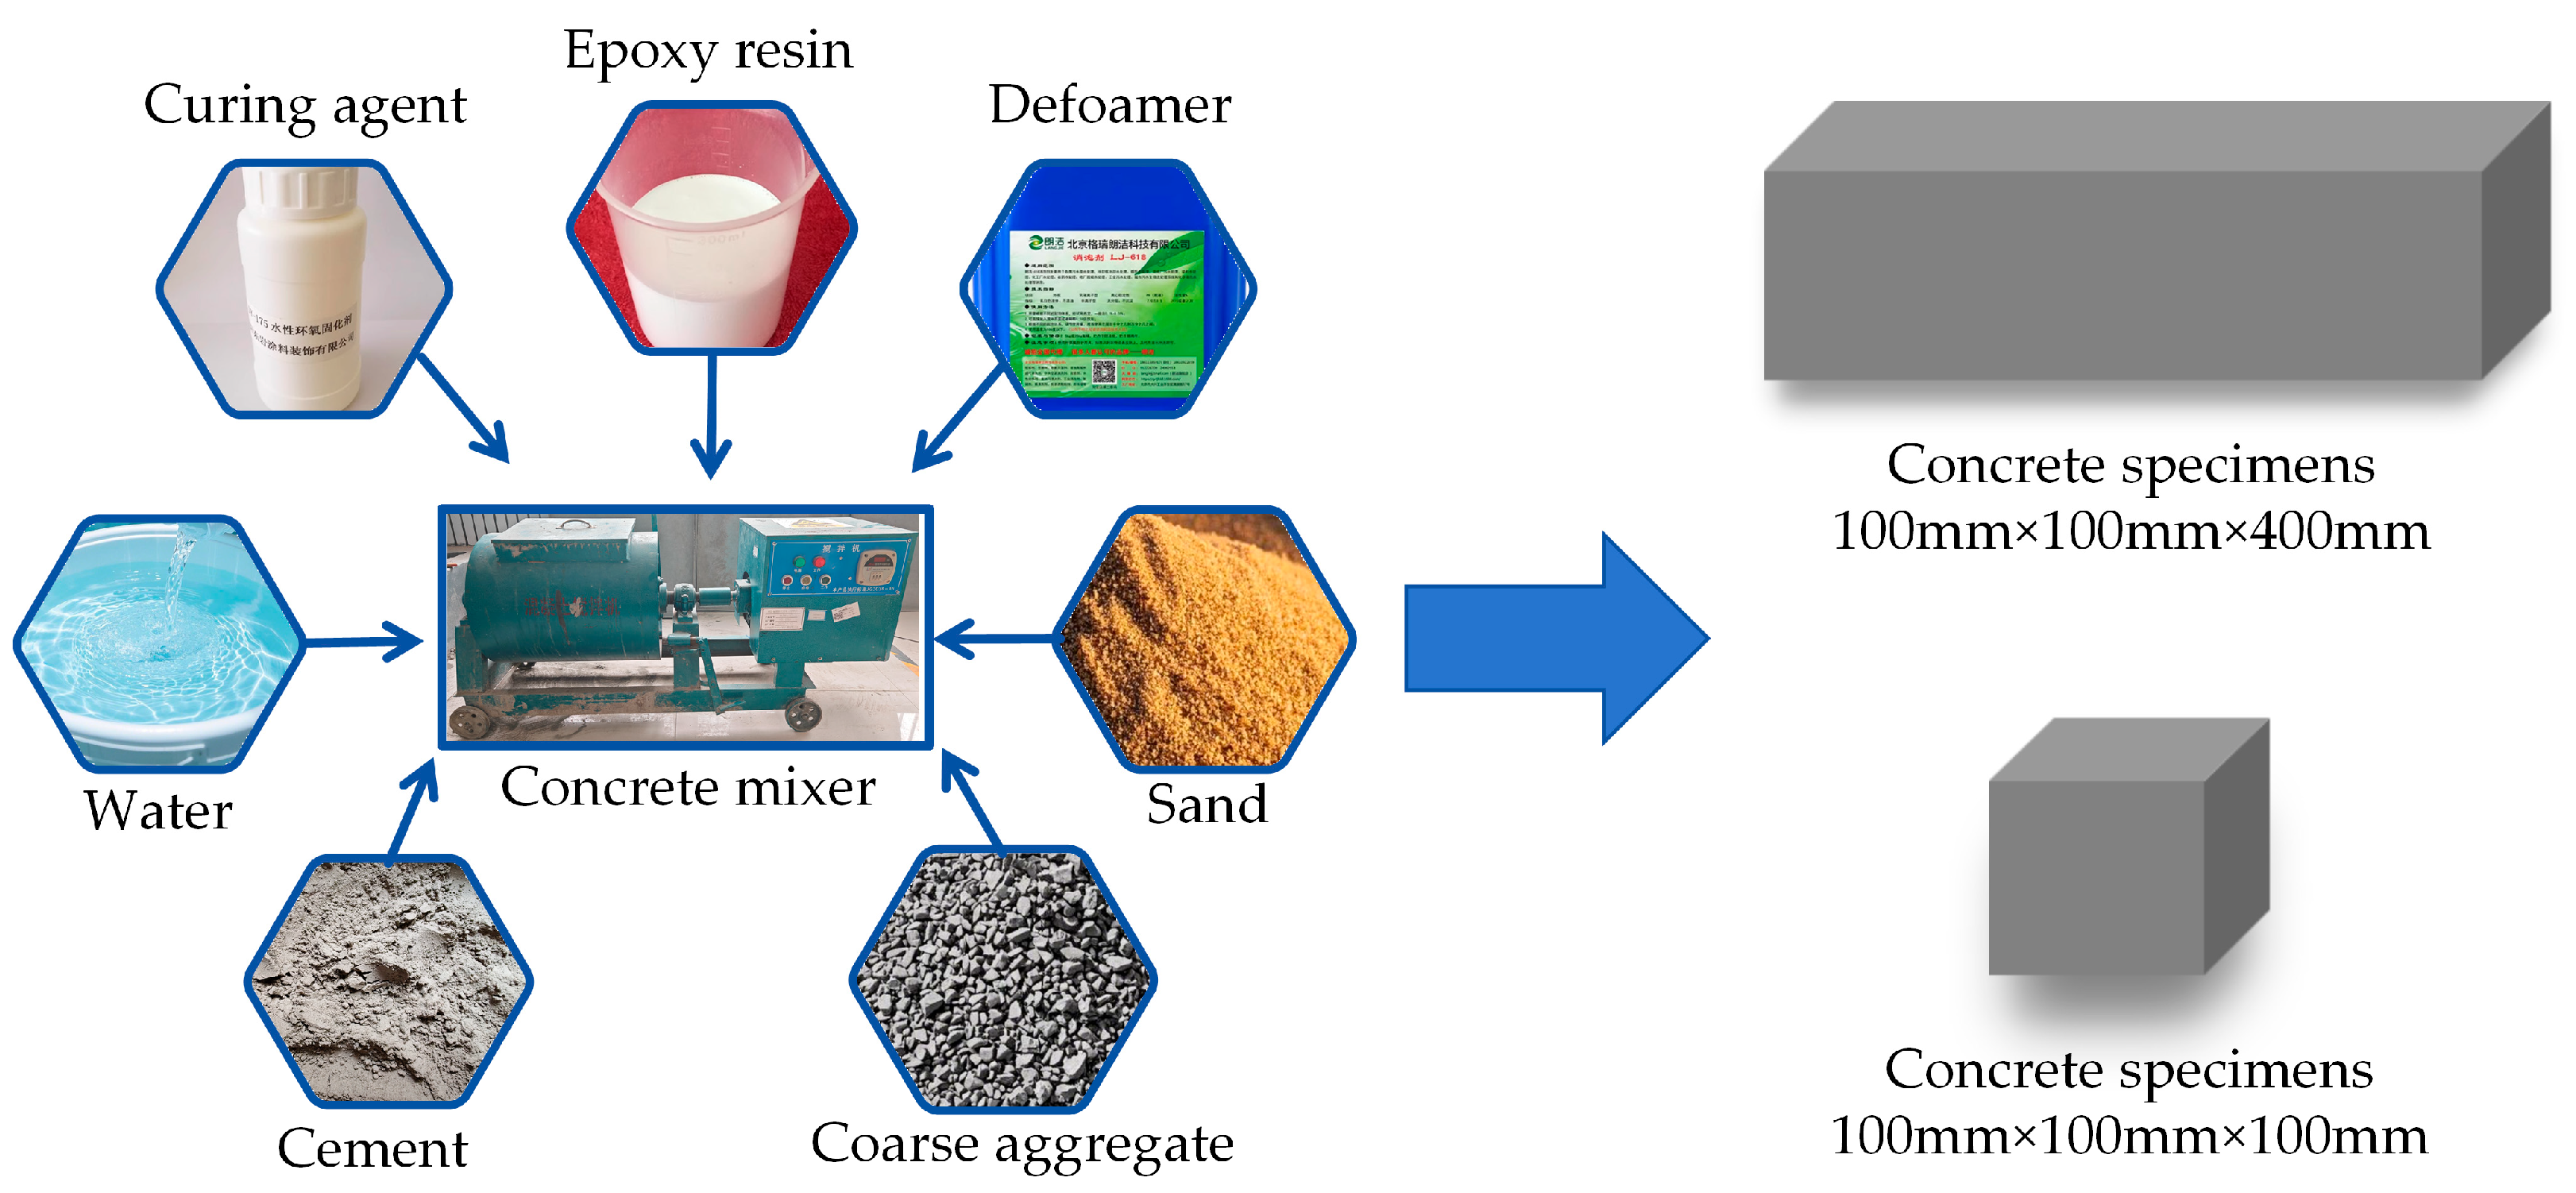
2.1. Experimental Materials
2.2. Mix Proportion of Specimens
3. Test Plan
3.1. Composite Salt Solution Immersion Test
3.1.1. Selection of Evaluation Indicators
3.1.2. Experimental Design
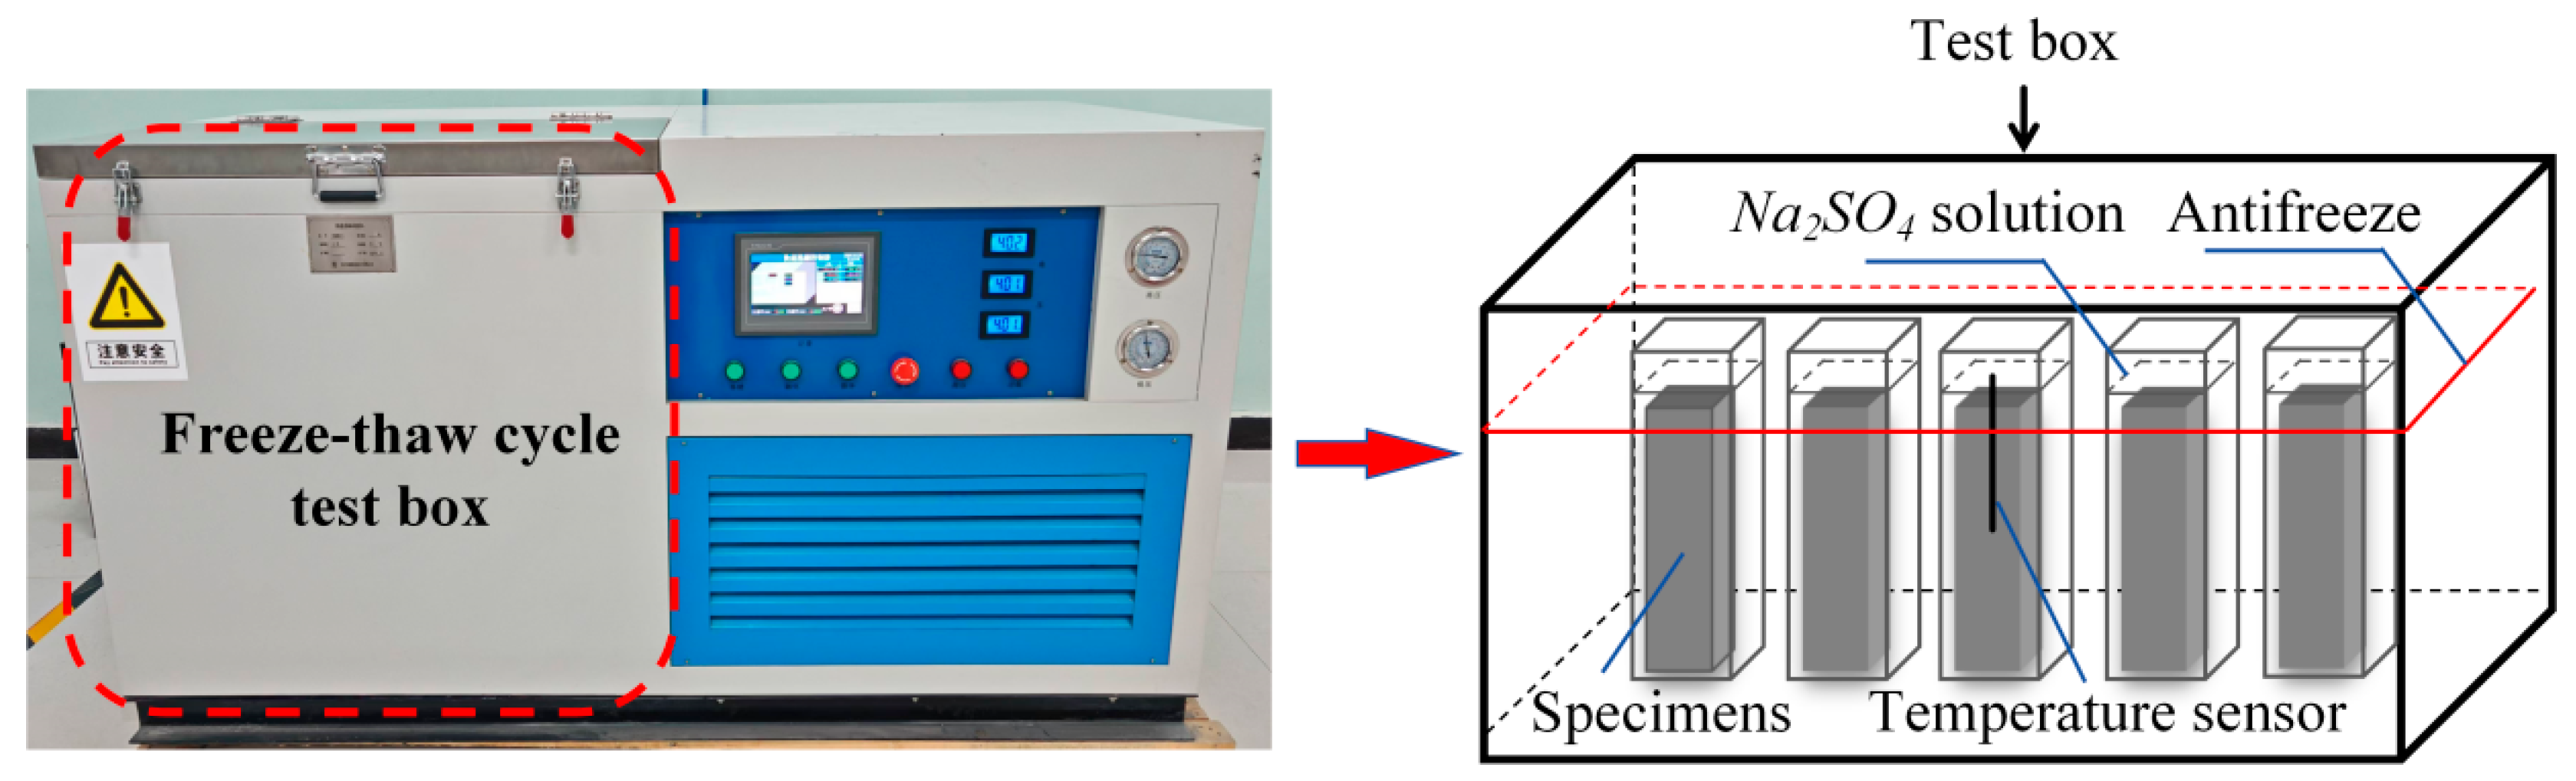
3.2. Salt Erosion and Freeze–Thaw Coupling Test
3.2.1. Selection of Evaluation Indicators
3.2.2. Experimental Method
4. Experimental Results and Analysis
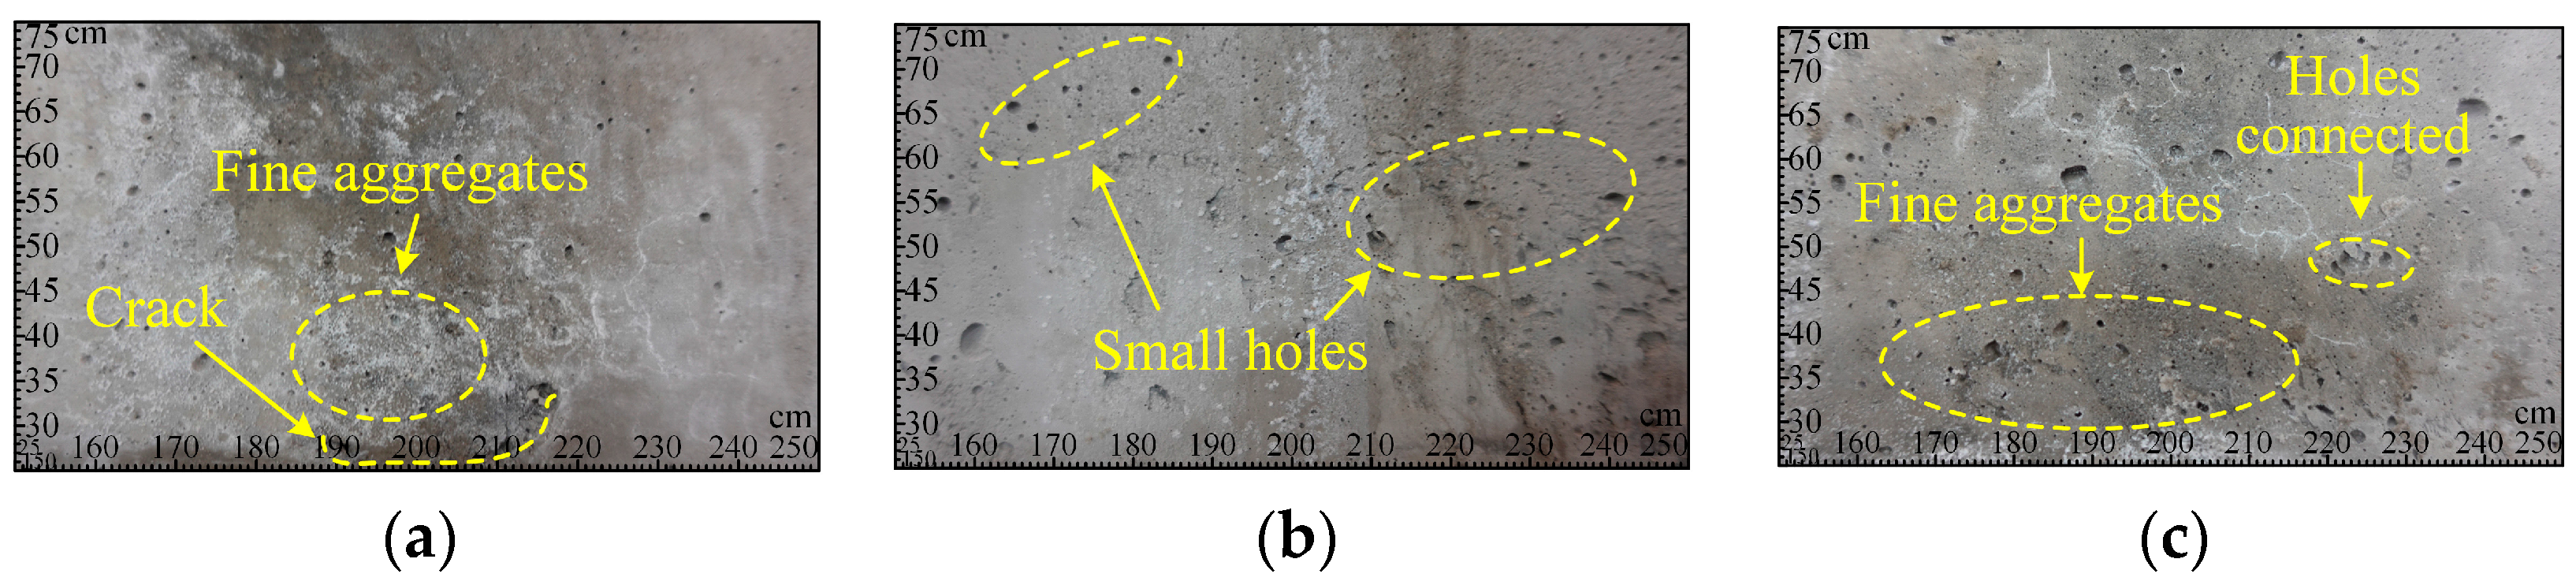
4.1. Analysis of Surface Damage
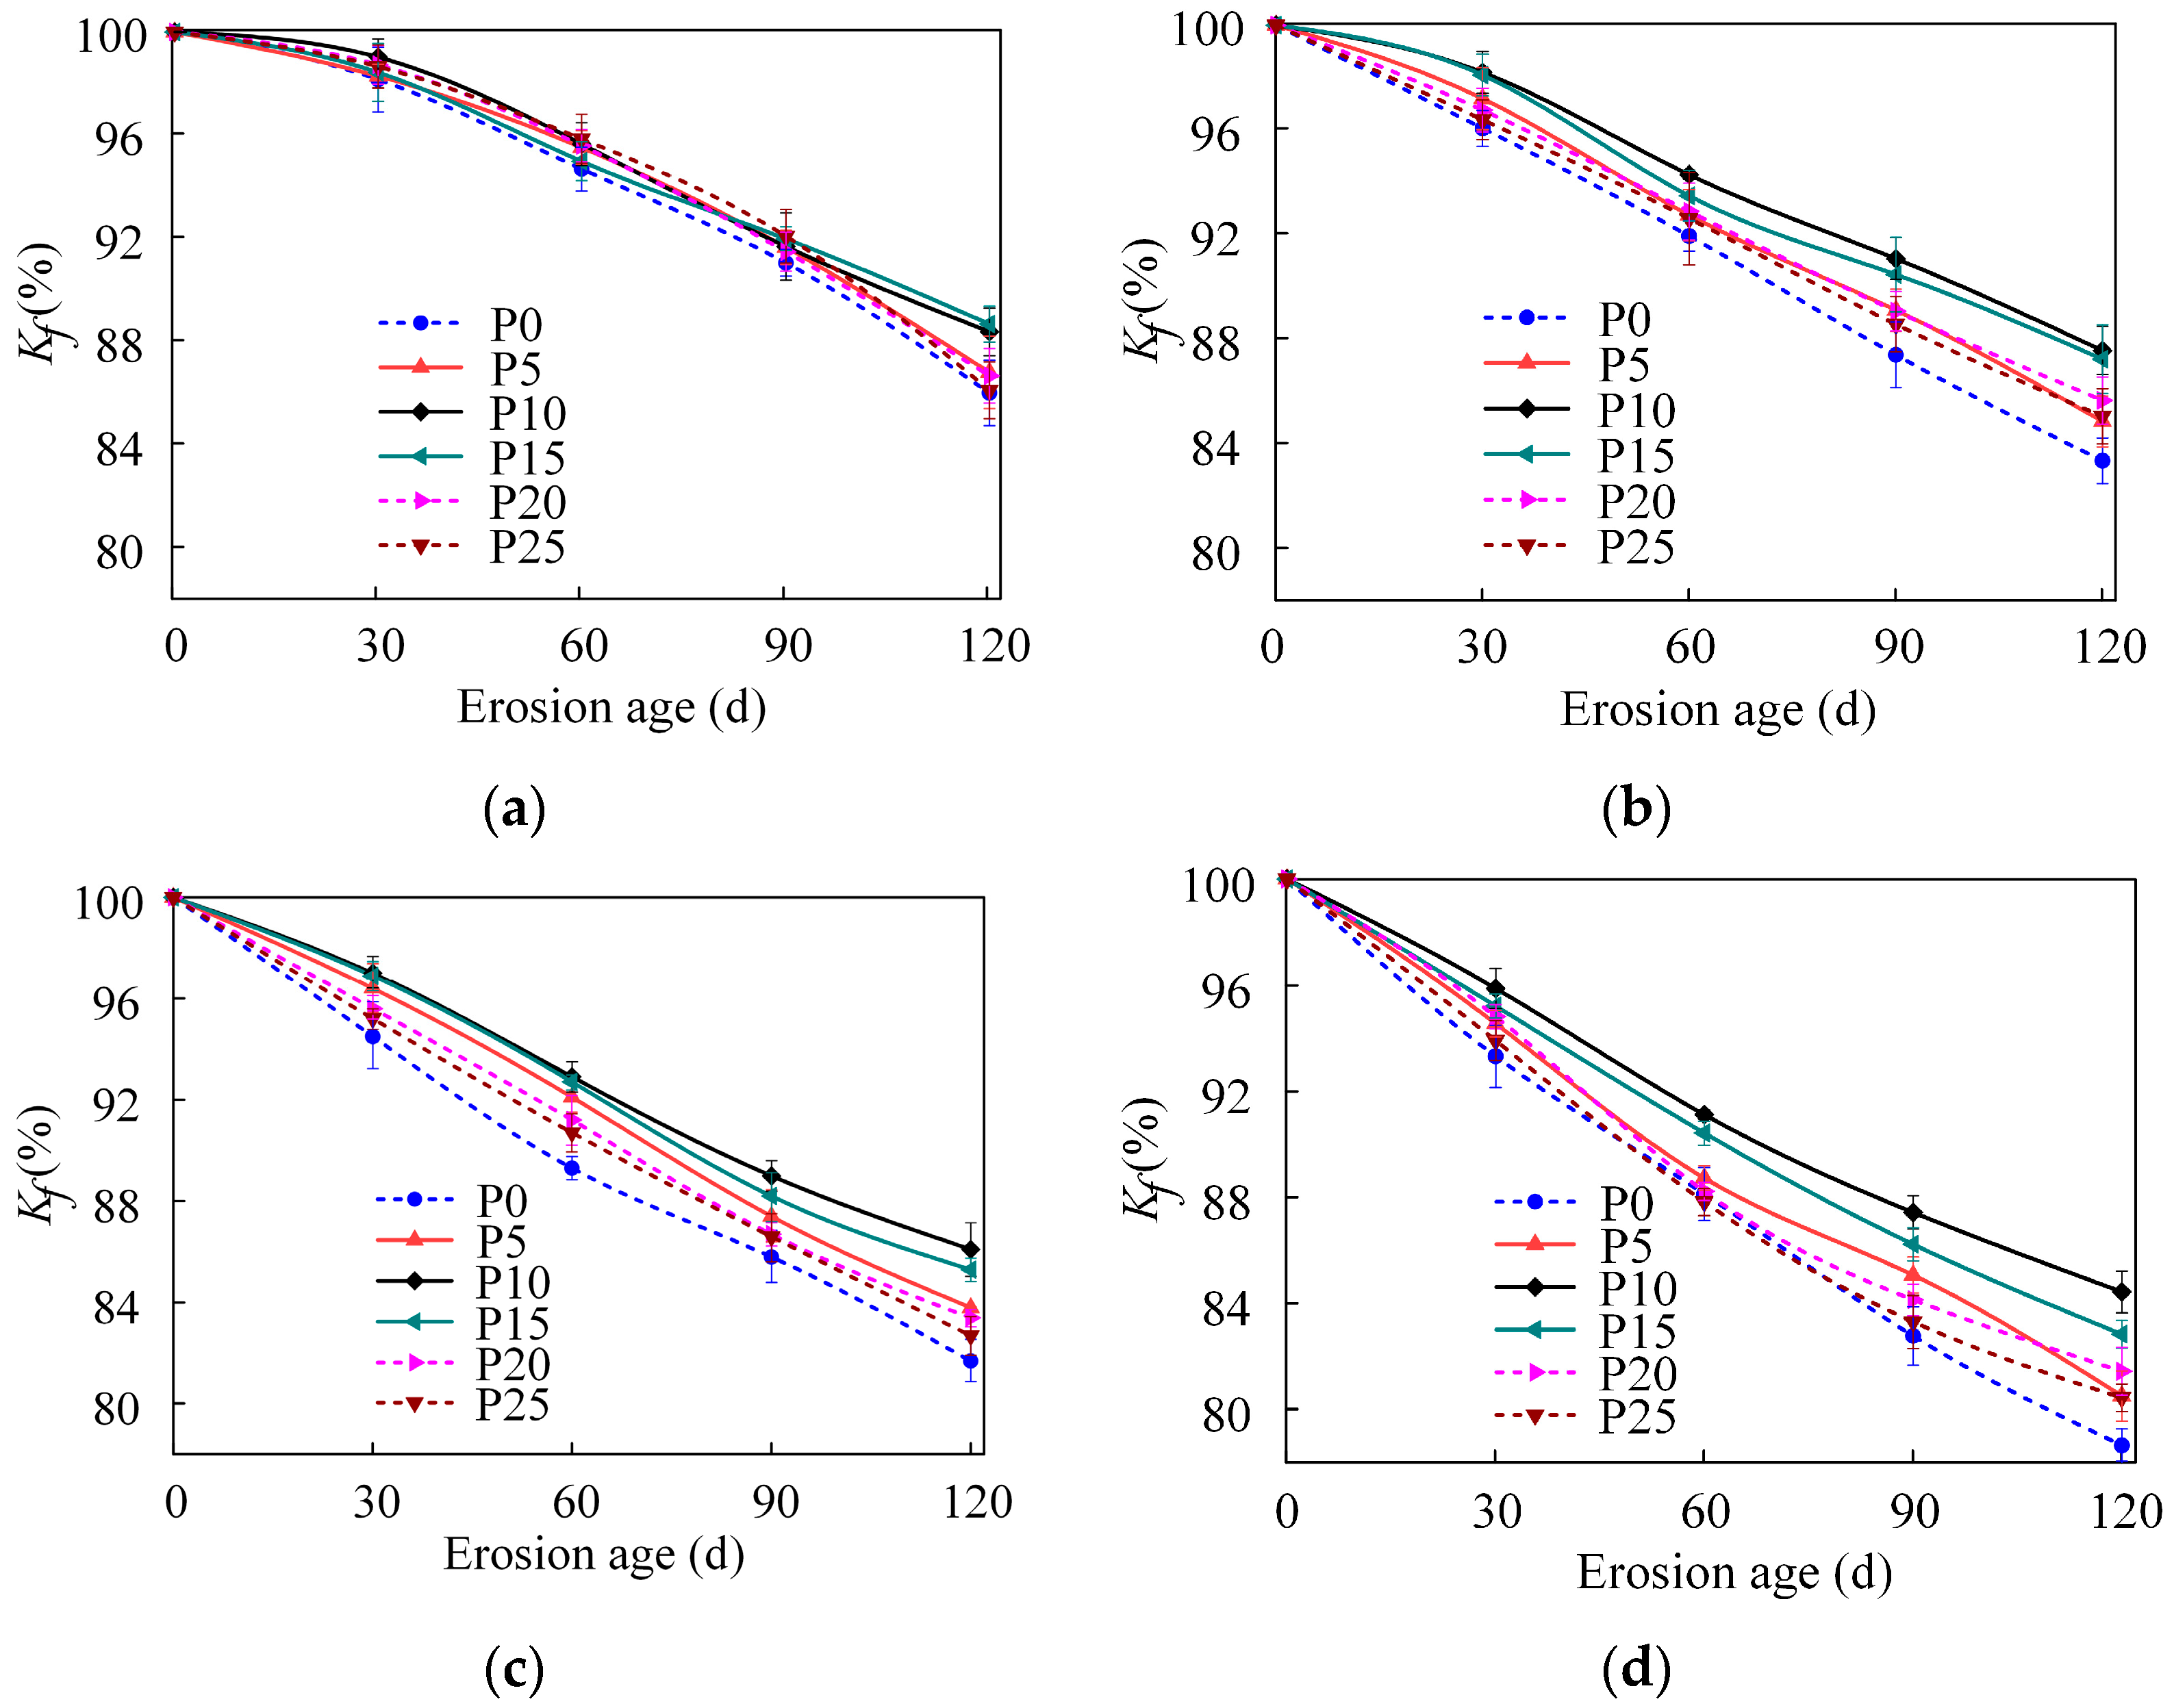
4.2. Variation of Compressive Strength Corrosion Coefficients
4.3. Variation of Relative Mass
4.4. Variation of Relative Dynamic Elastic Modulus
4.5. Mass Loss Analysis
4.6. Analysis of Dynamic Elastic Modulus Loss
4.7. Analysis of Flexural Strength Loss
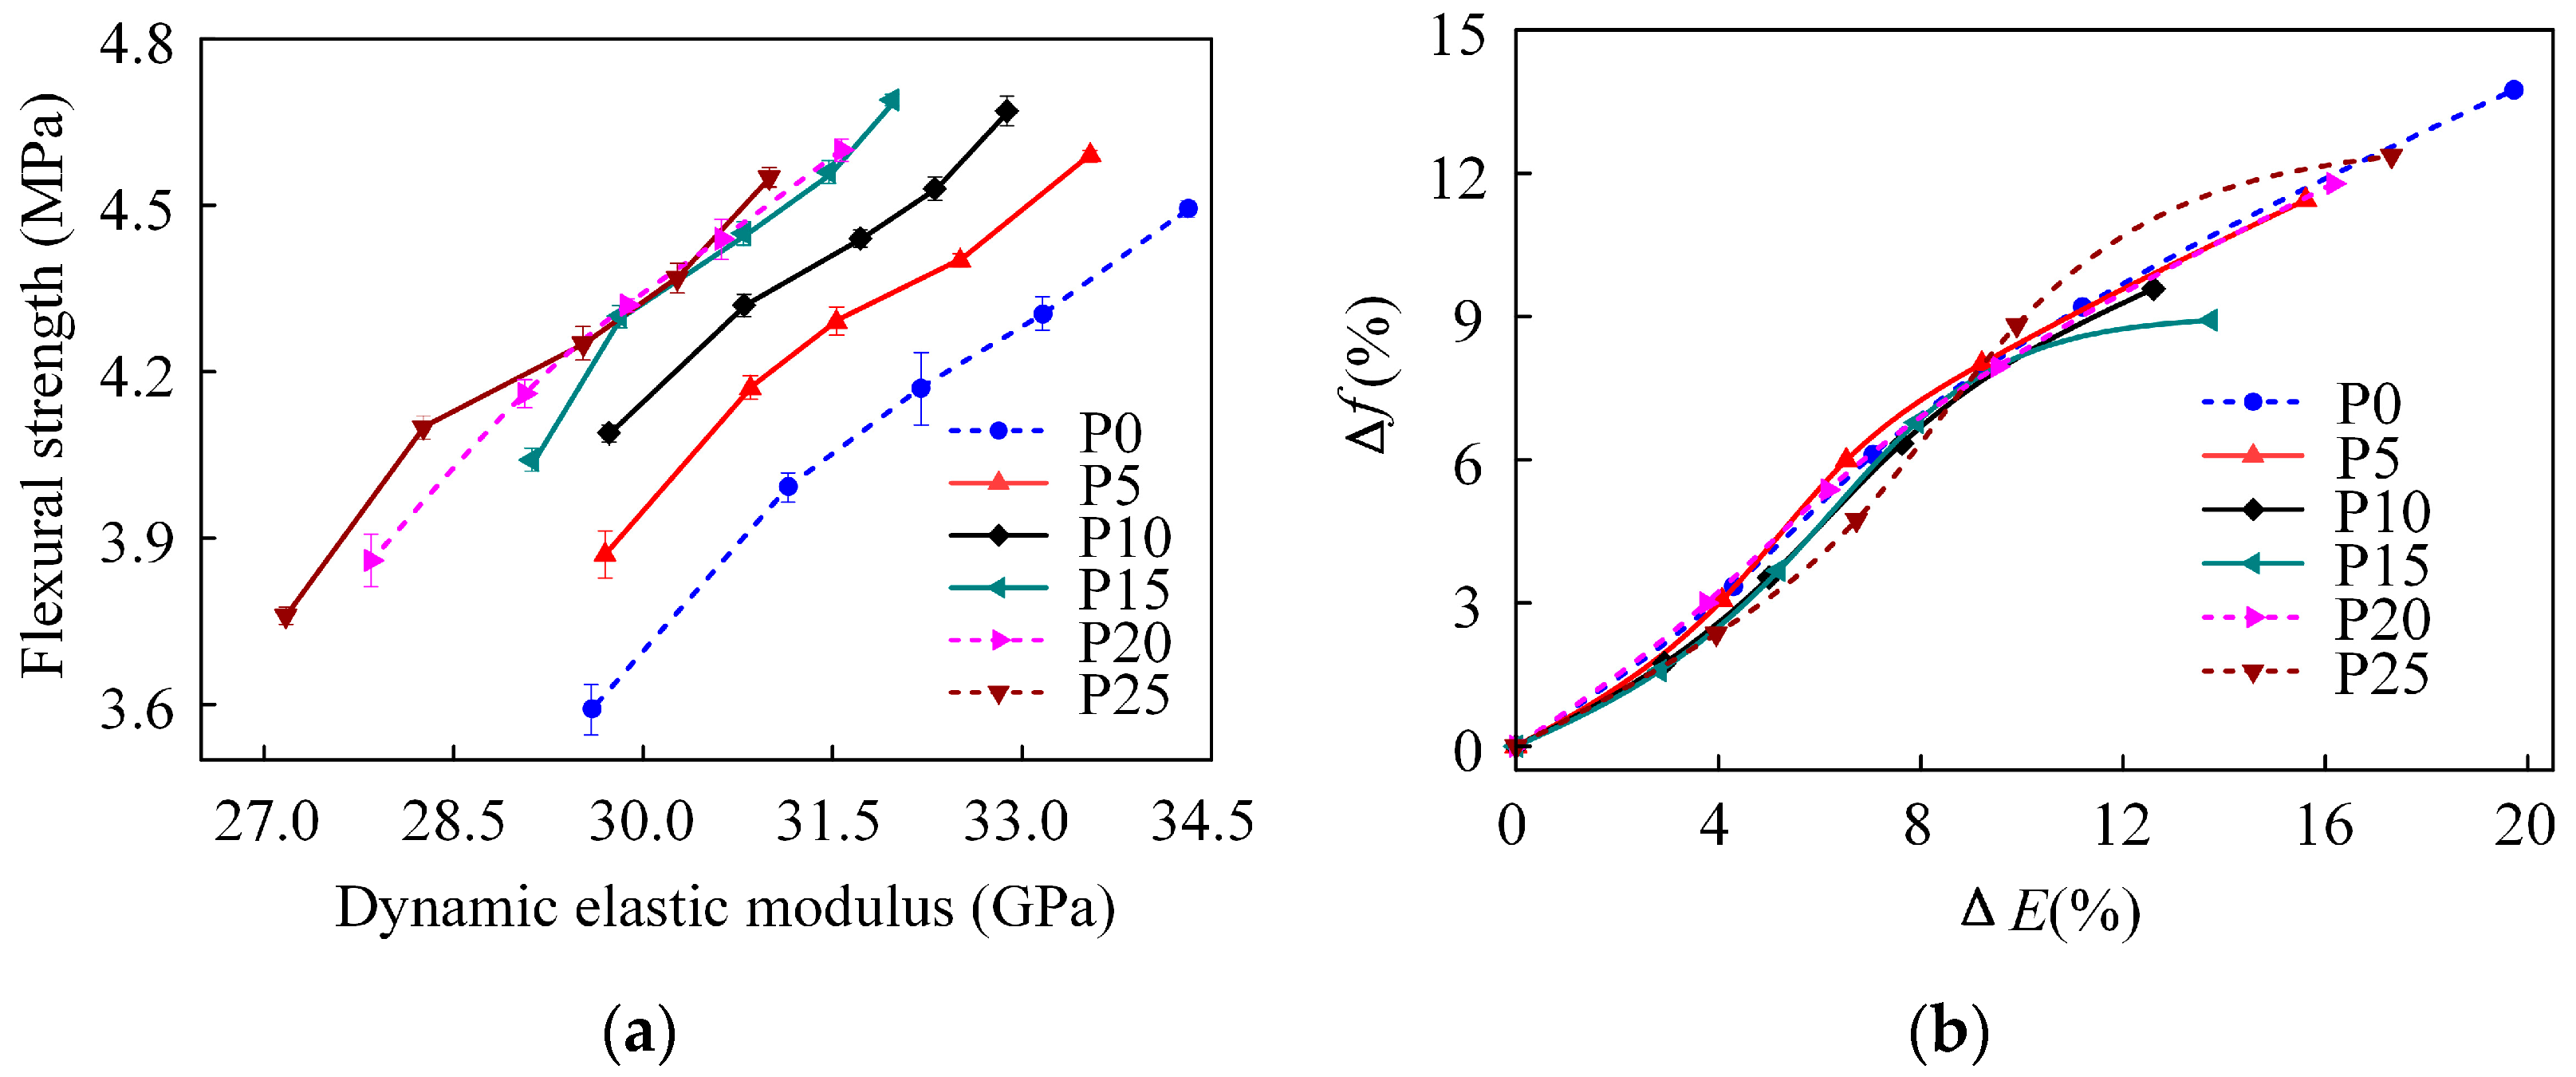
4.8. Relationship Between Flexural Strength and Dynamic Elastic Modulus
5. SEM Analysis
6. Conclusions
- (1)
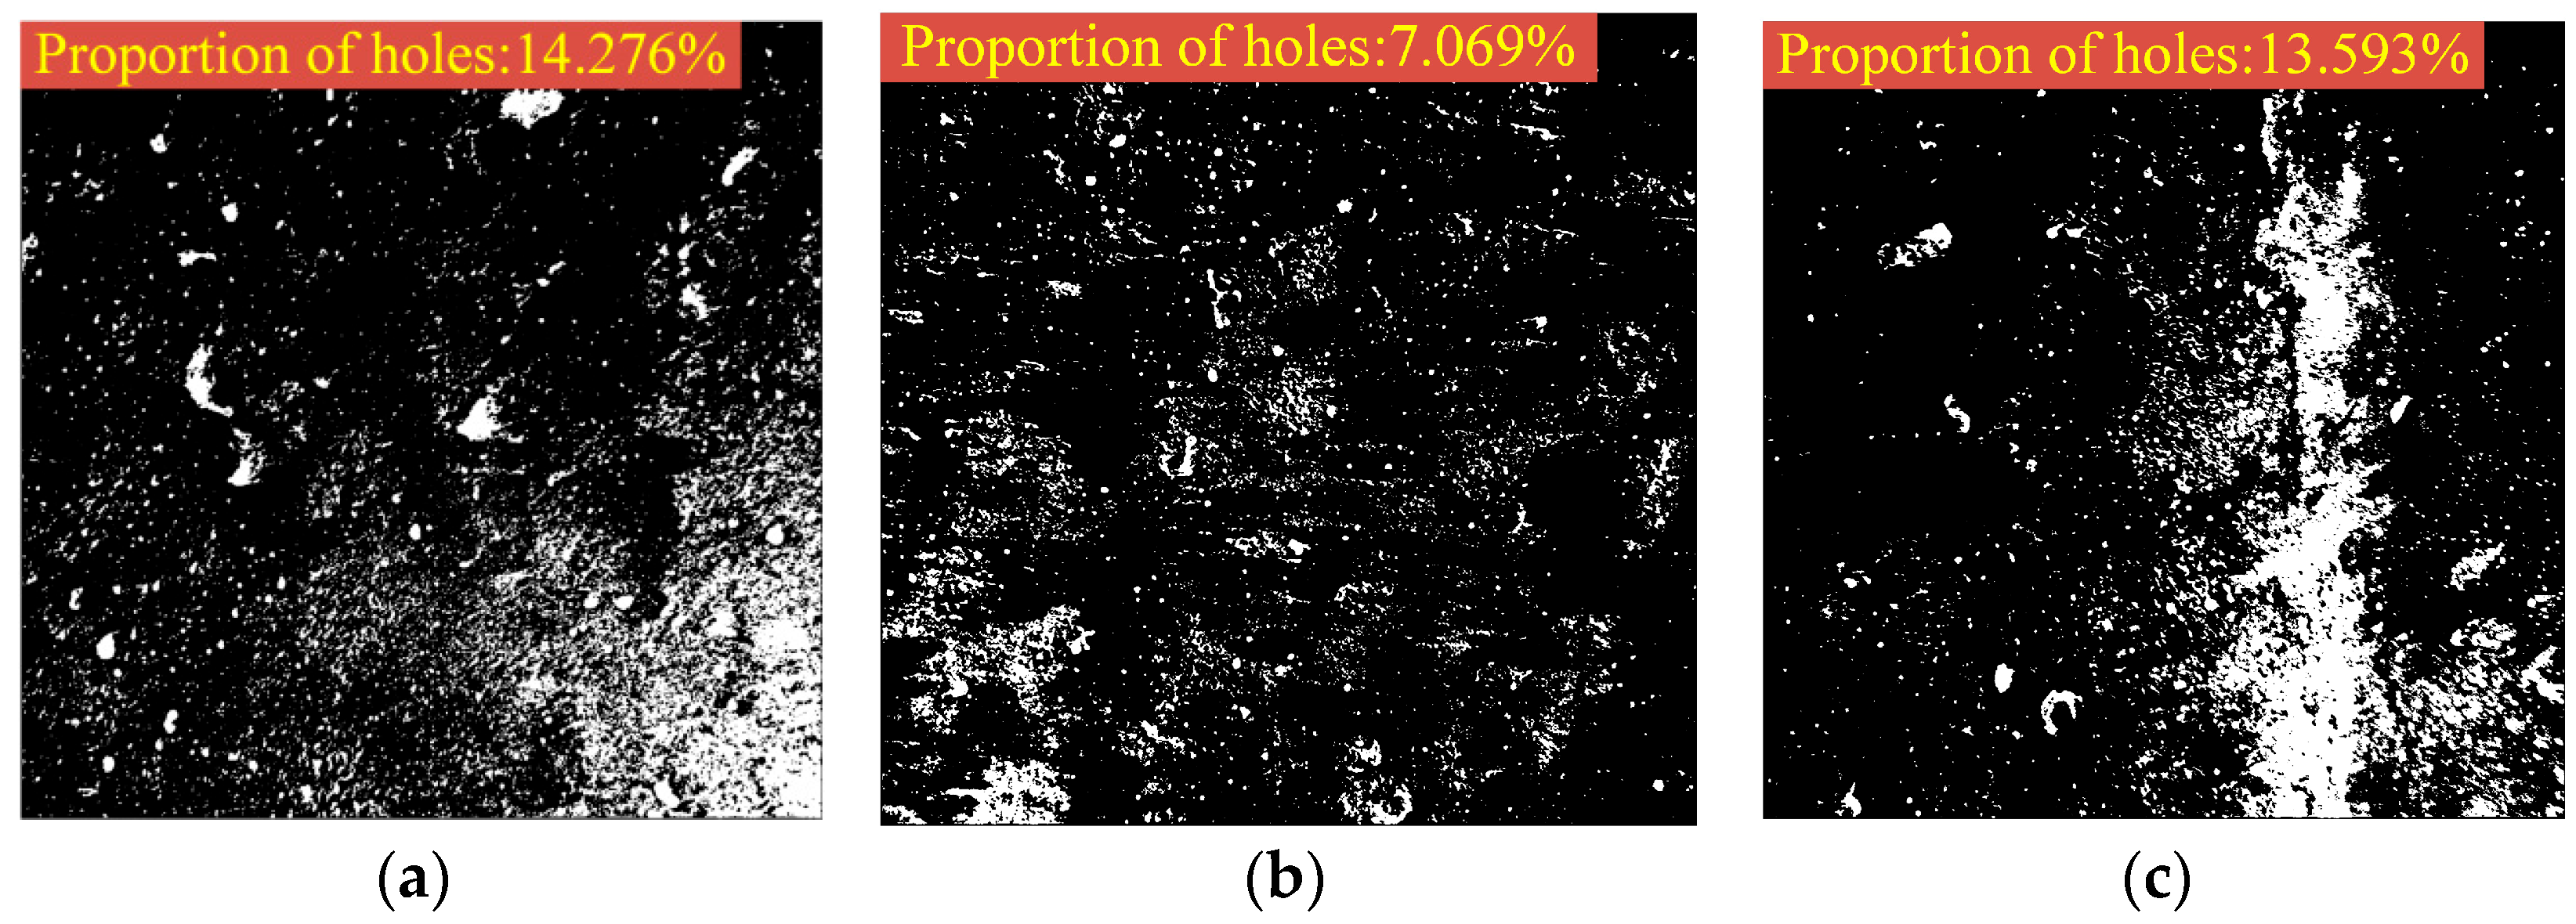
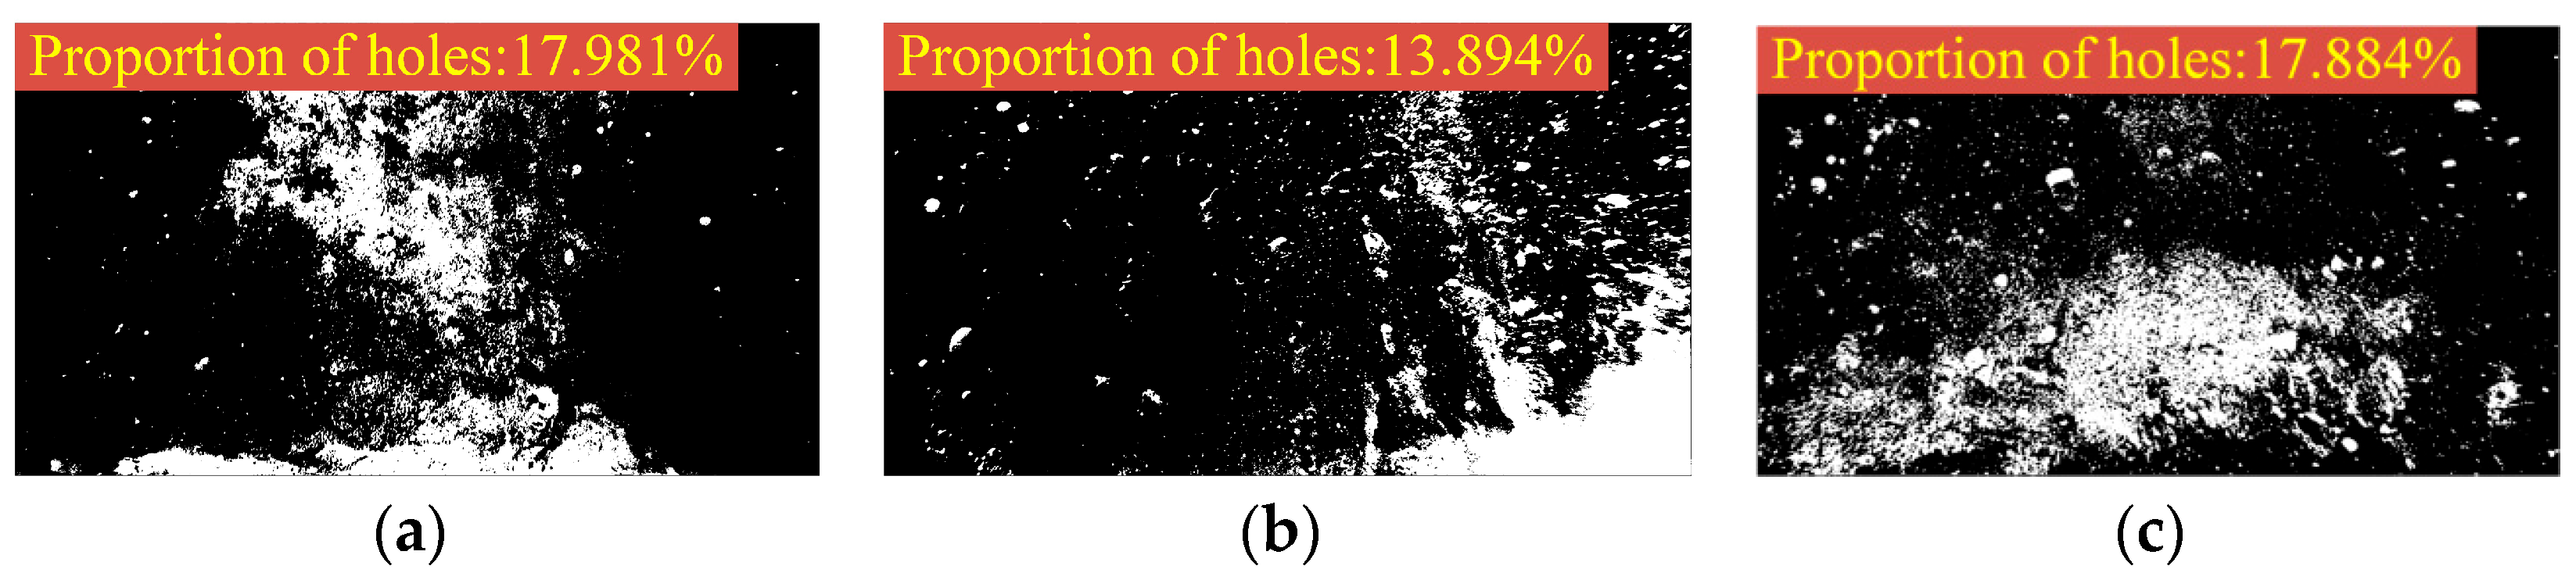
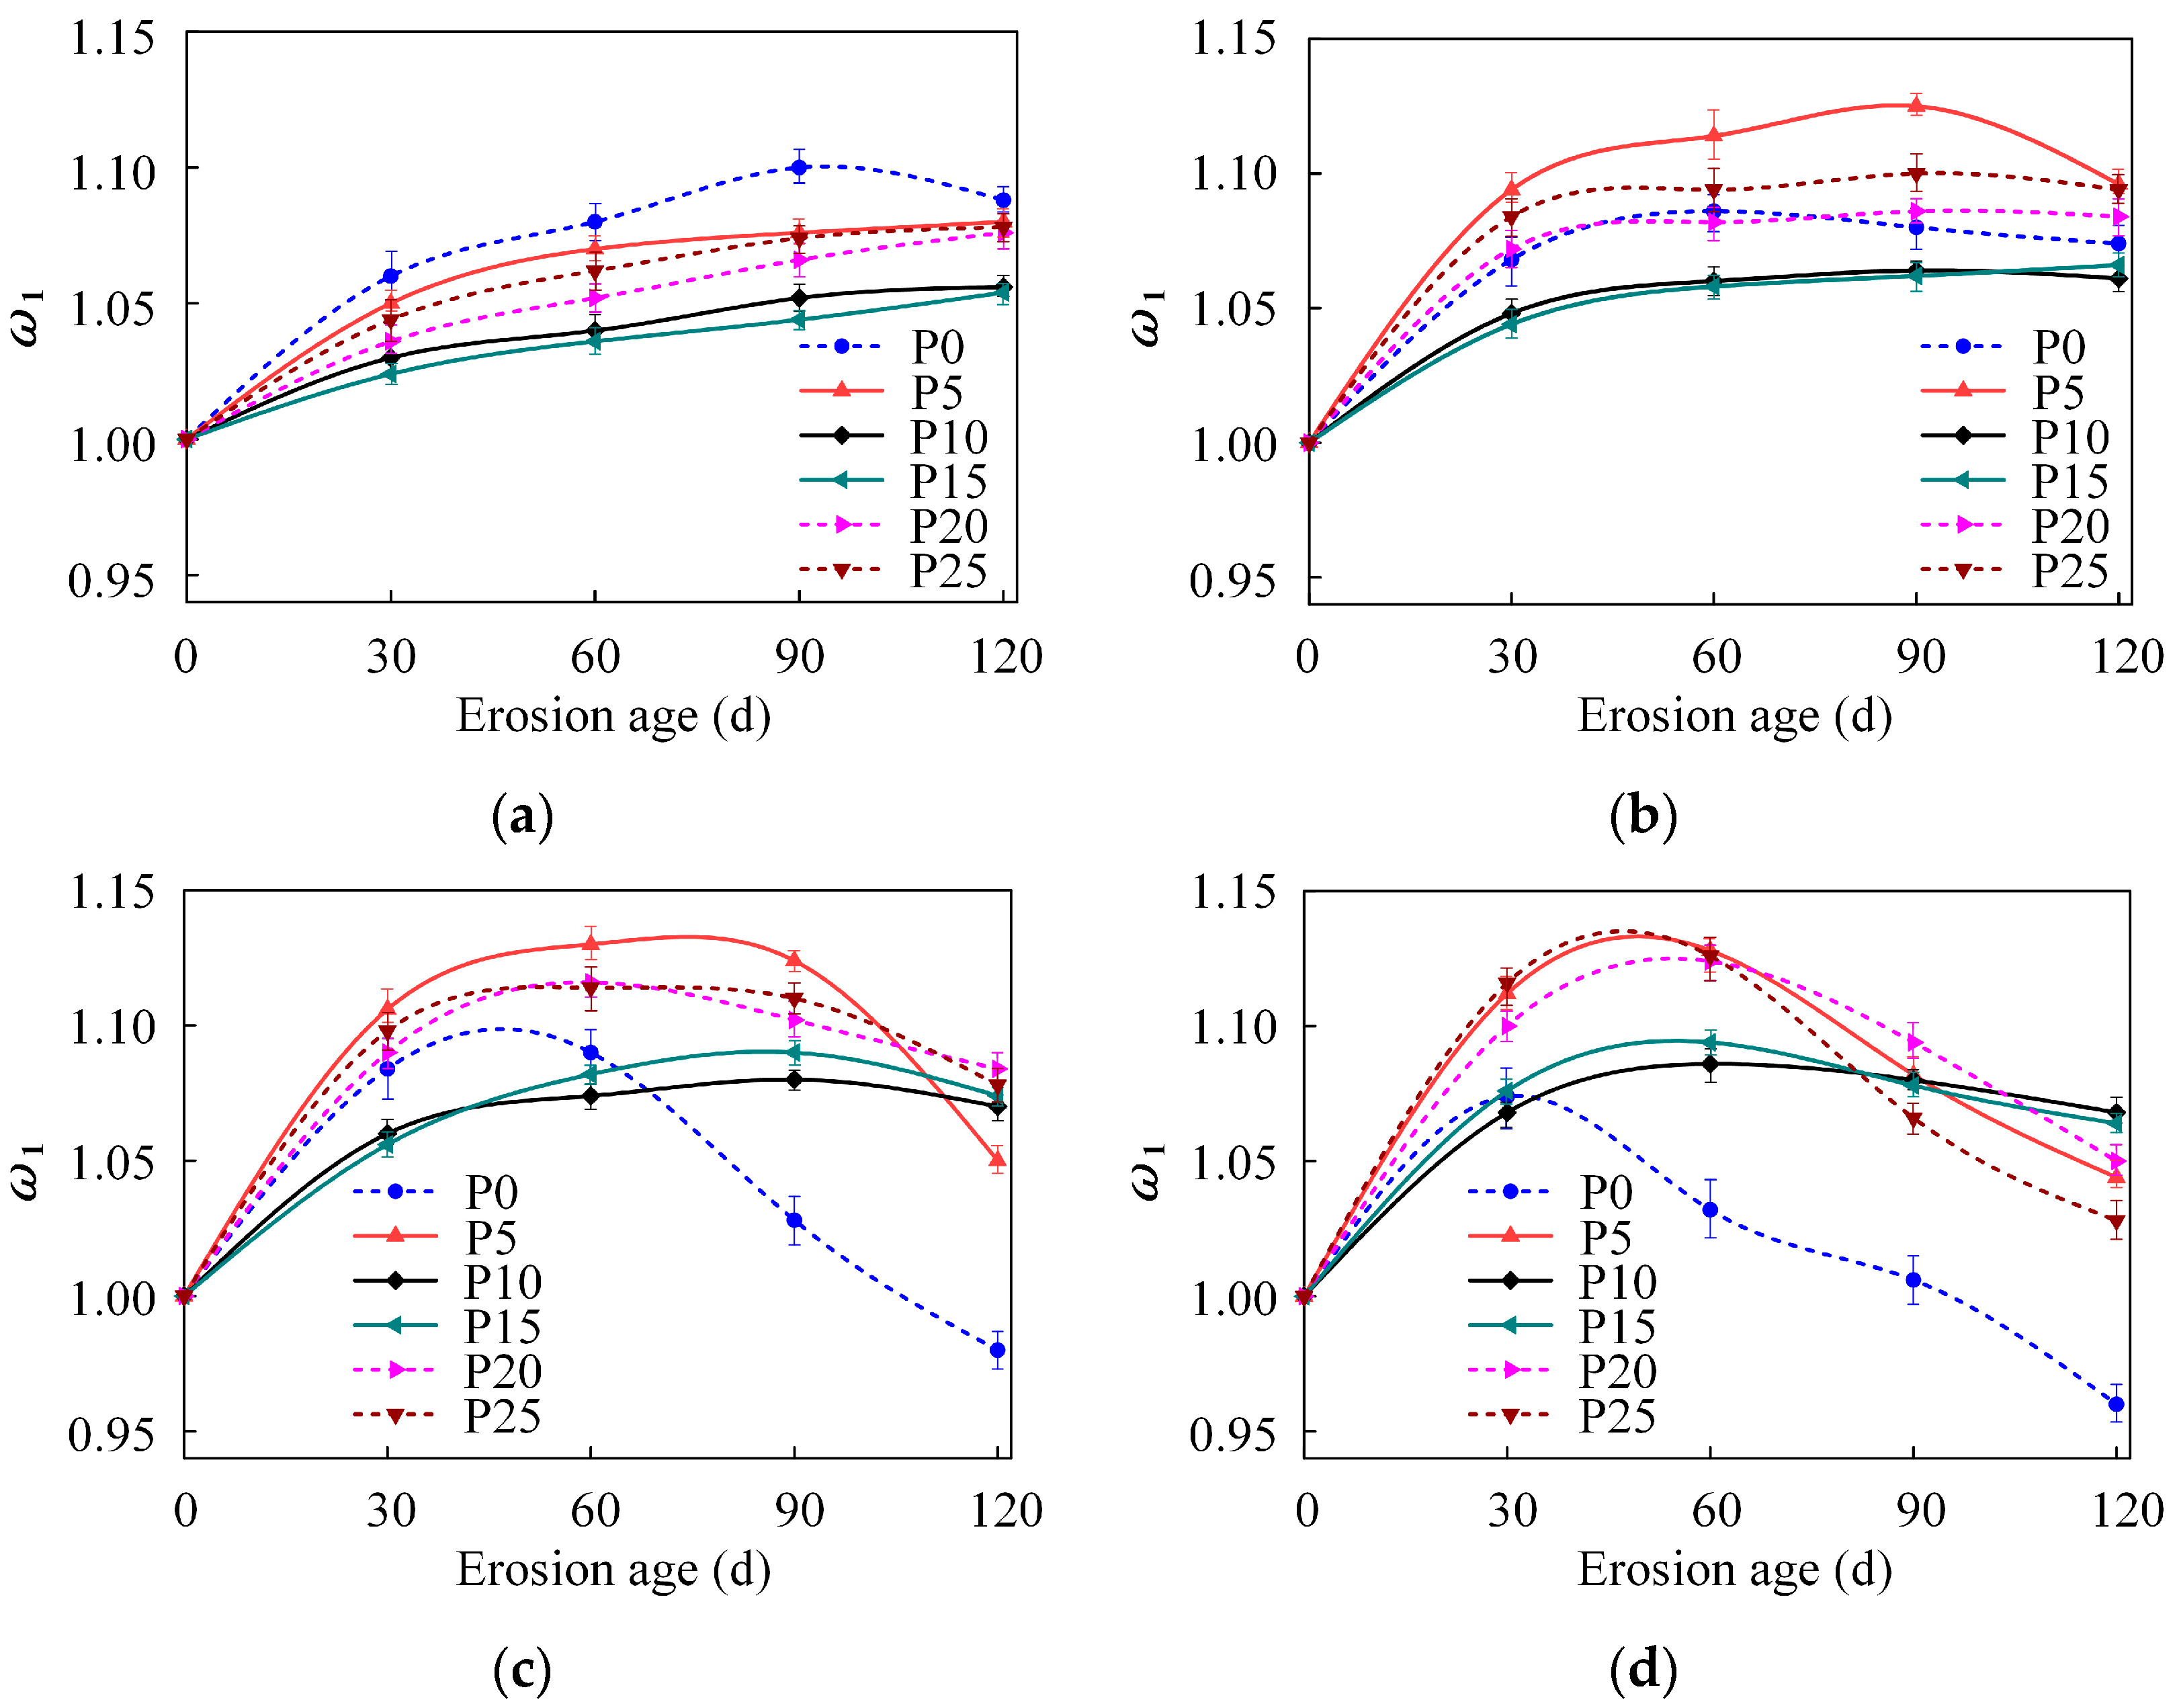
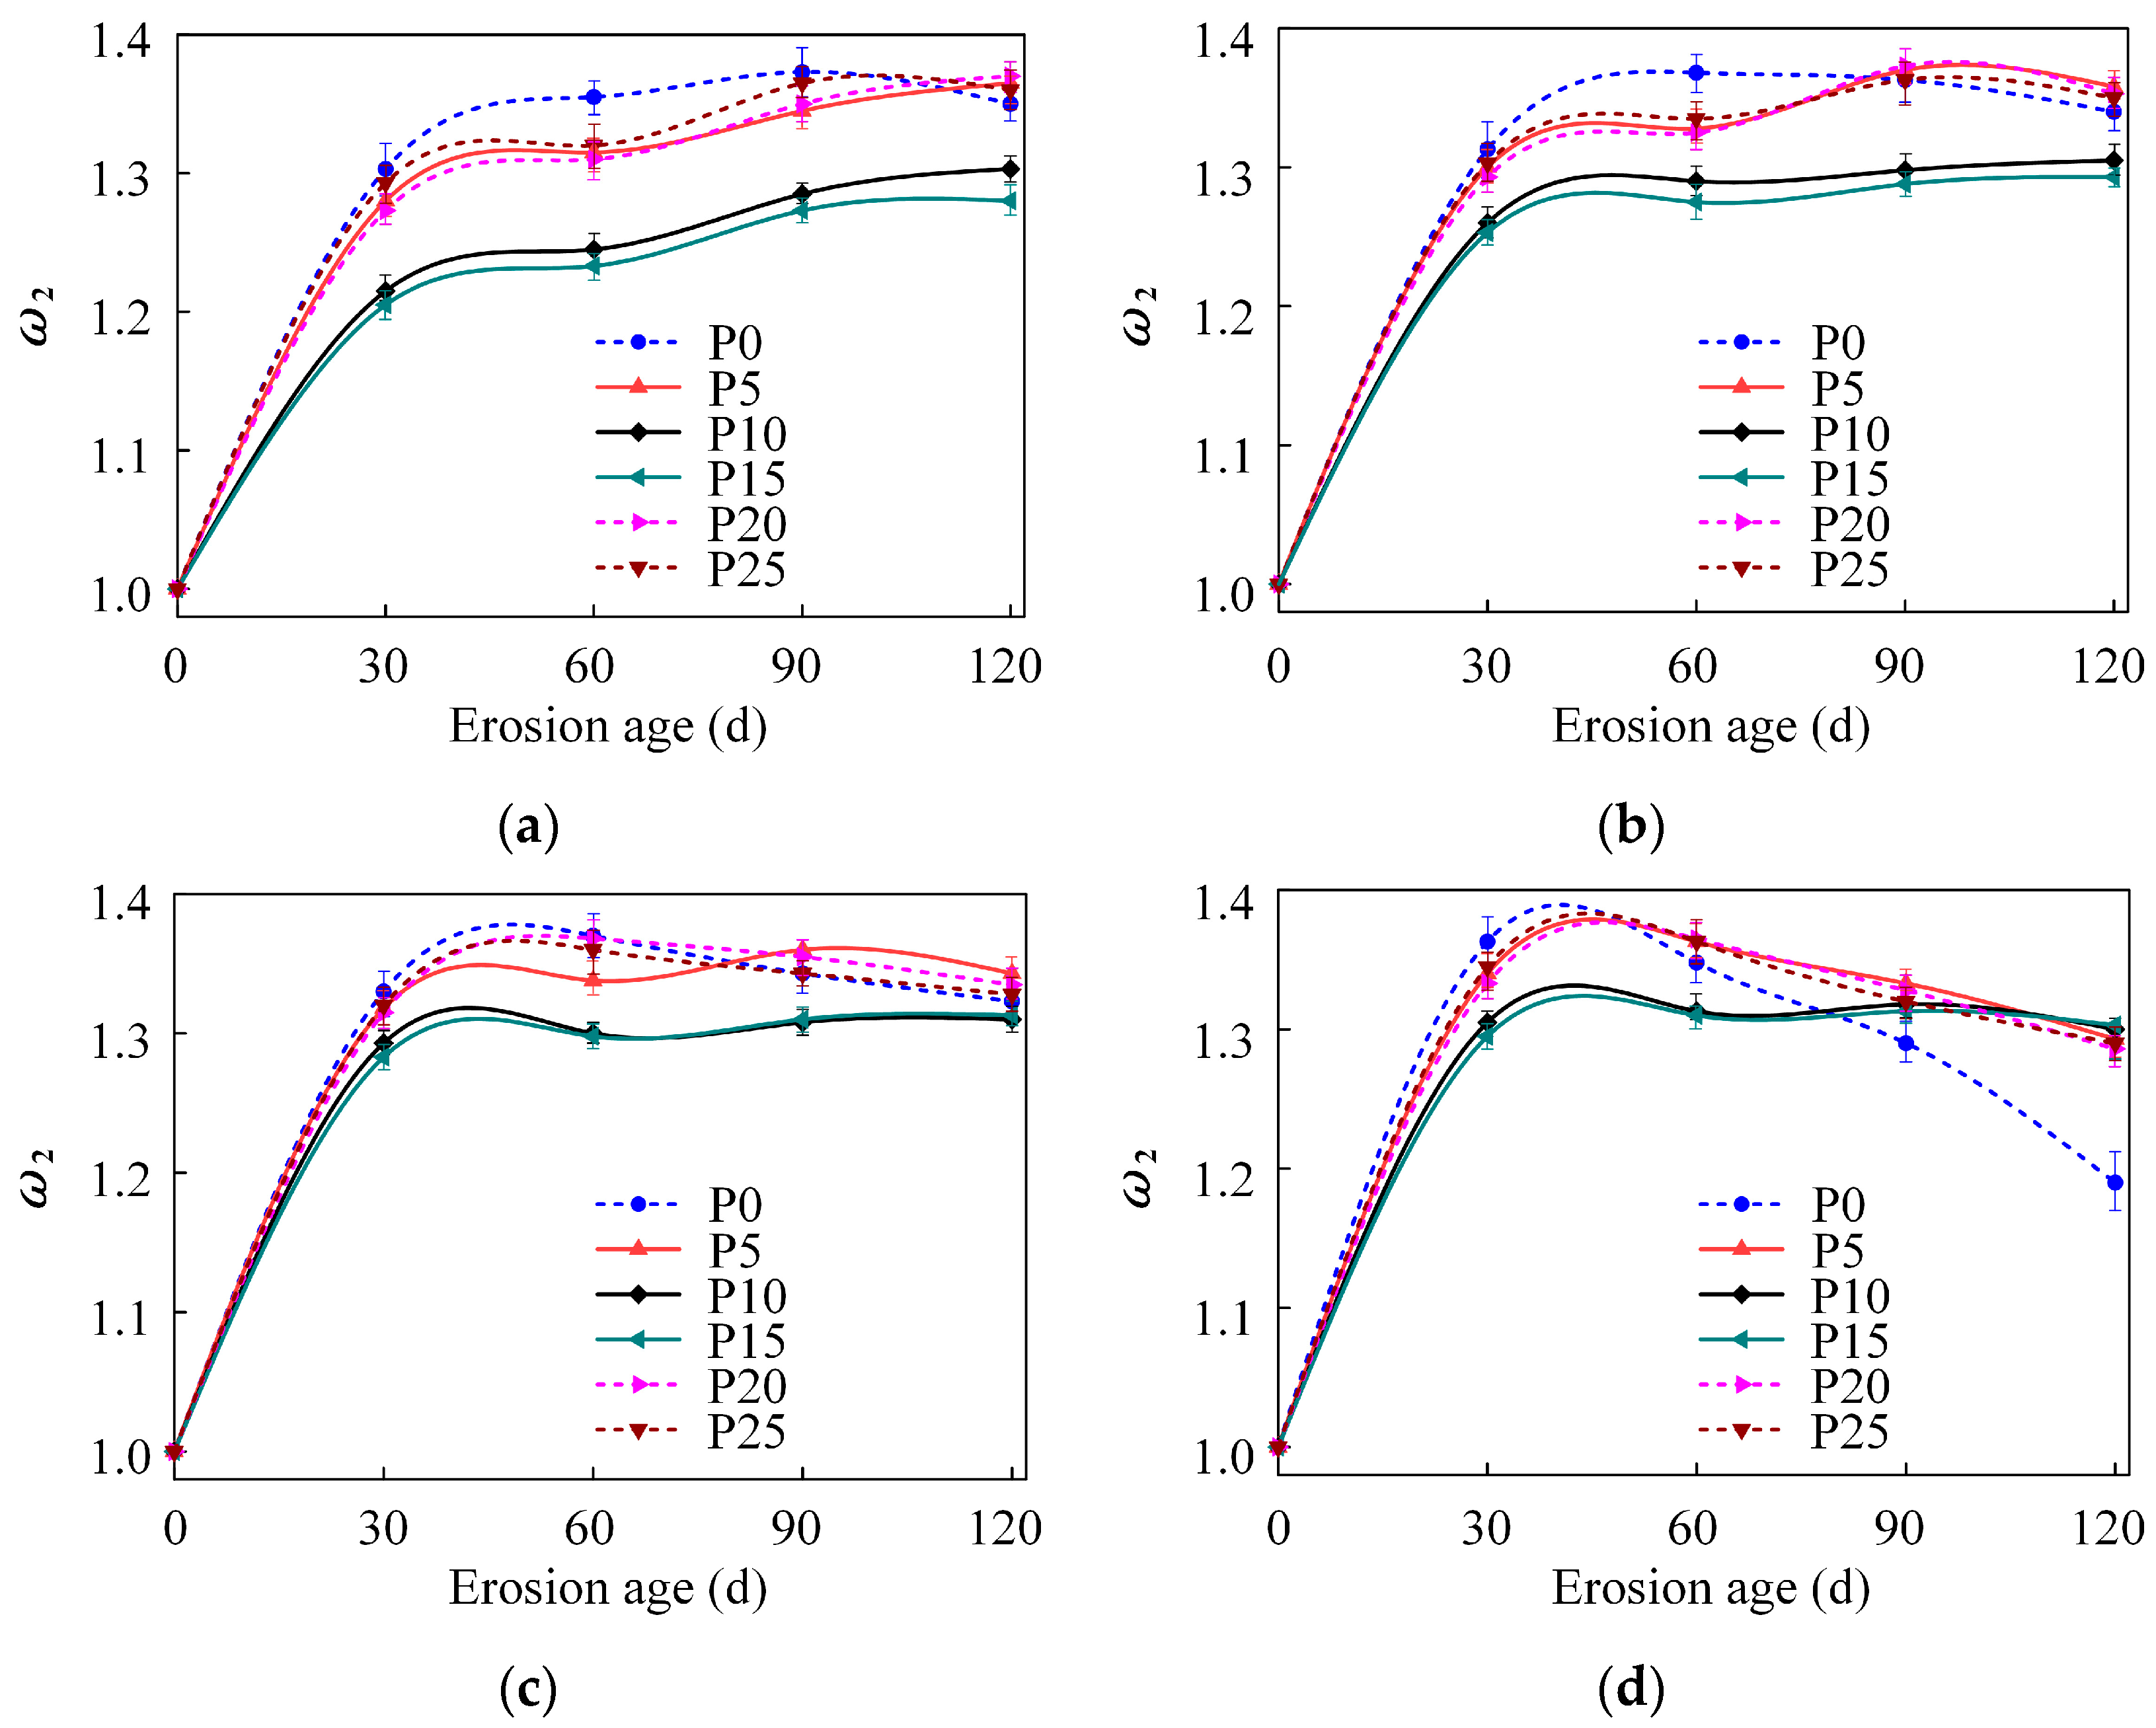
- After 90 days of erosion in F1 solution, the surface porosity of P10 was 7.069%, which was 50.48% lower than that of P0 and 48% lower than that of P25. The standard deviation of Kf for P10 was 0.79, which was 36.8% lower than that of P0, and the average value of Kf for P10 increased 5.04% compared to P0. Under identical salt erosion conditions, both ω1 and ω2 of P0-P25 specimens initially increased before gradually decreasing with prolonged exposure. As the epoxy resin content increased, their fluctuation amplitudes first decreased and then rose.
- (2)
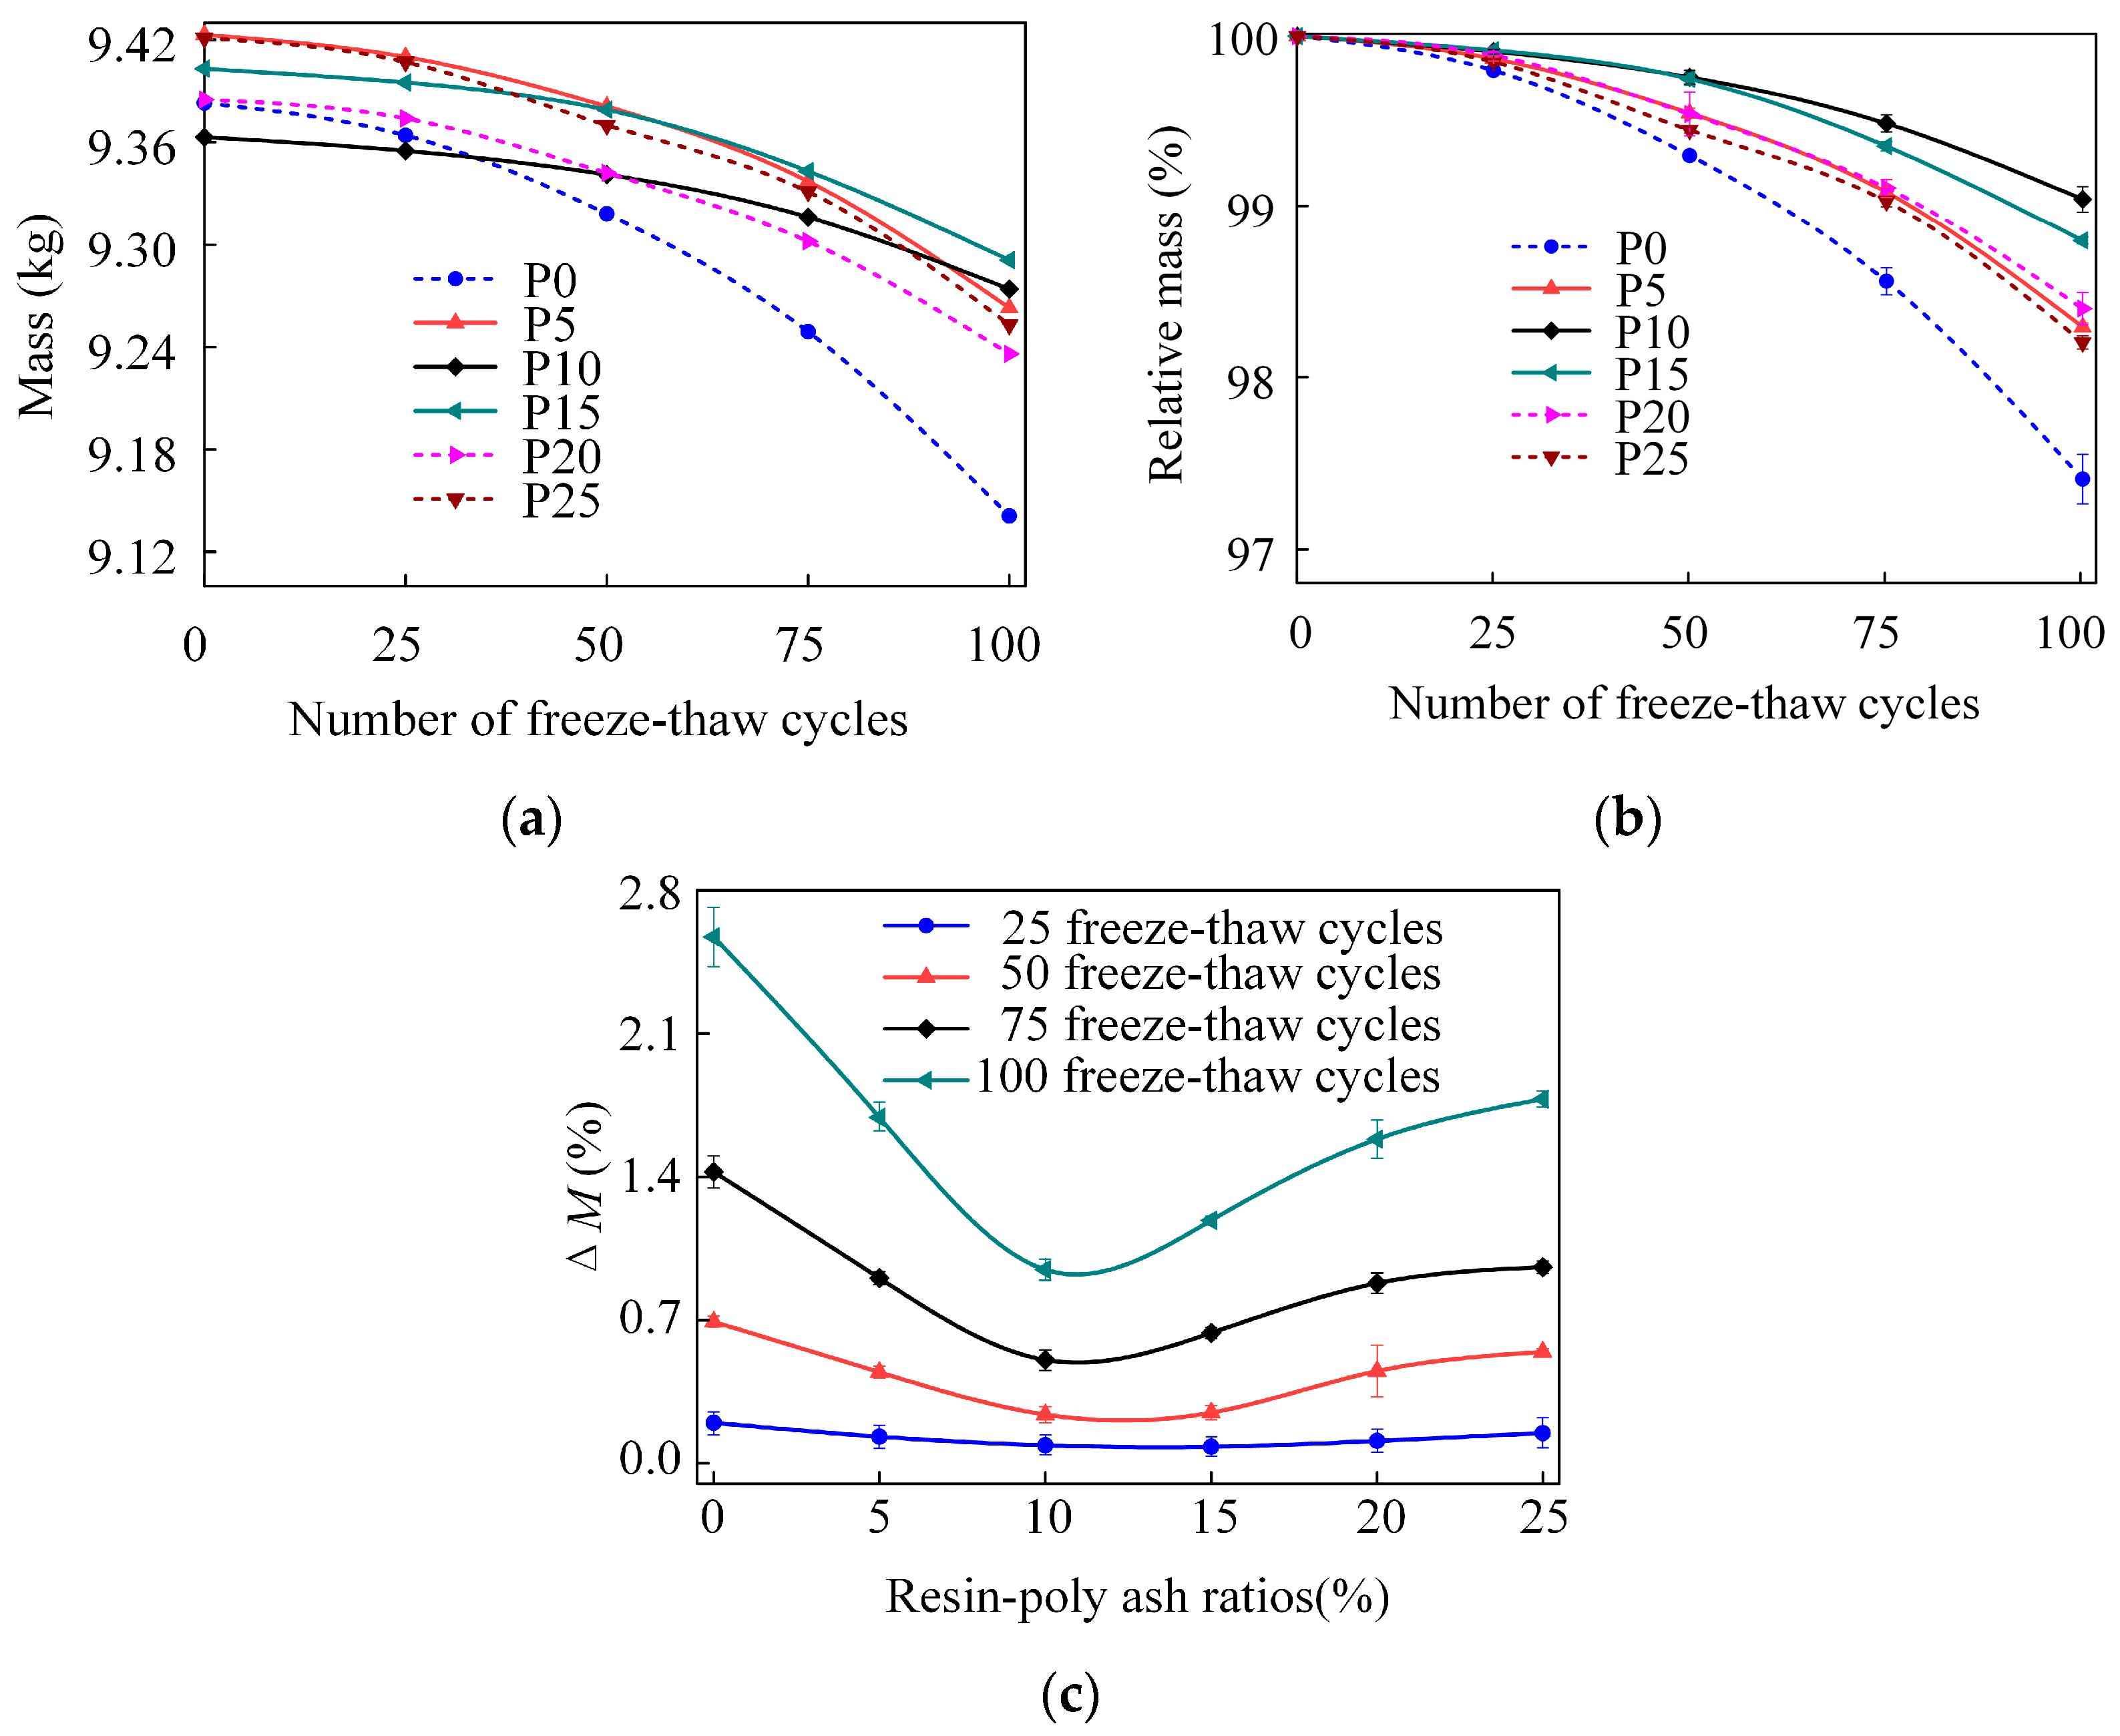
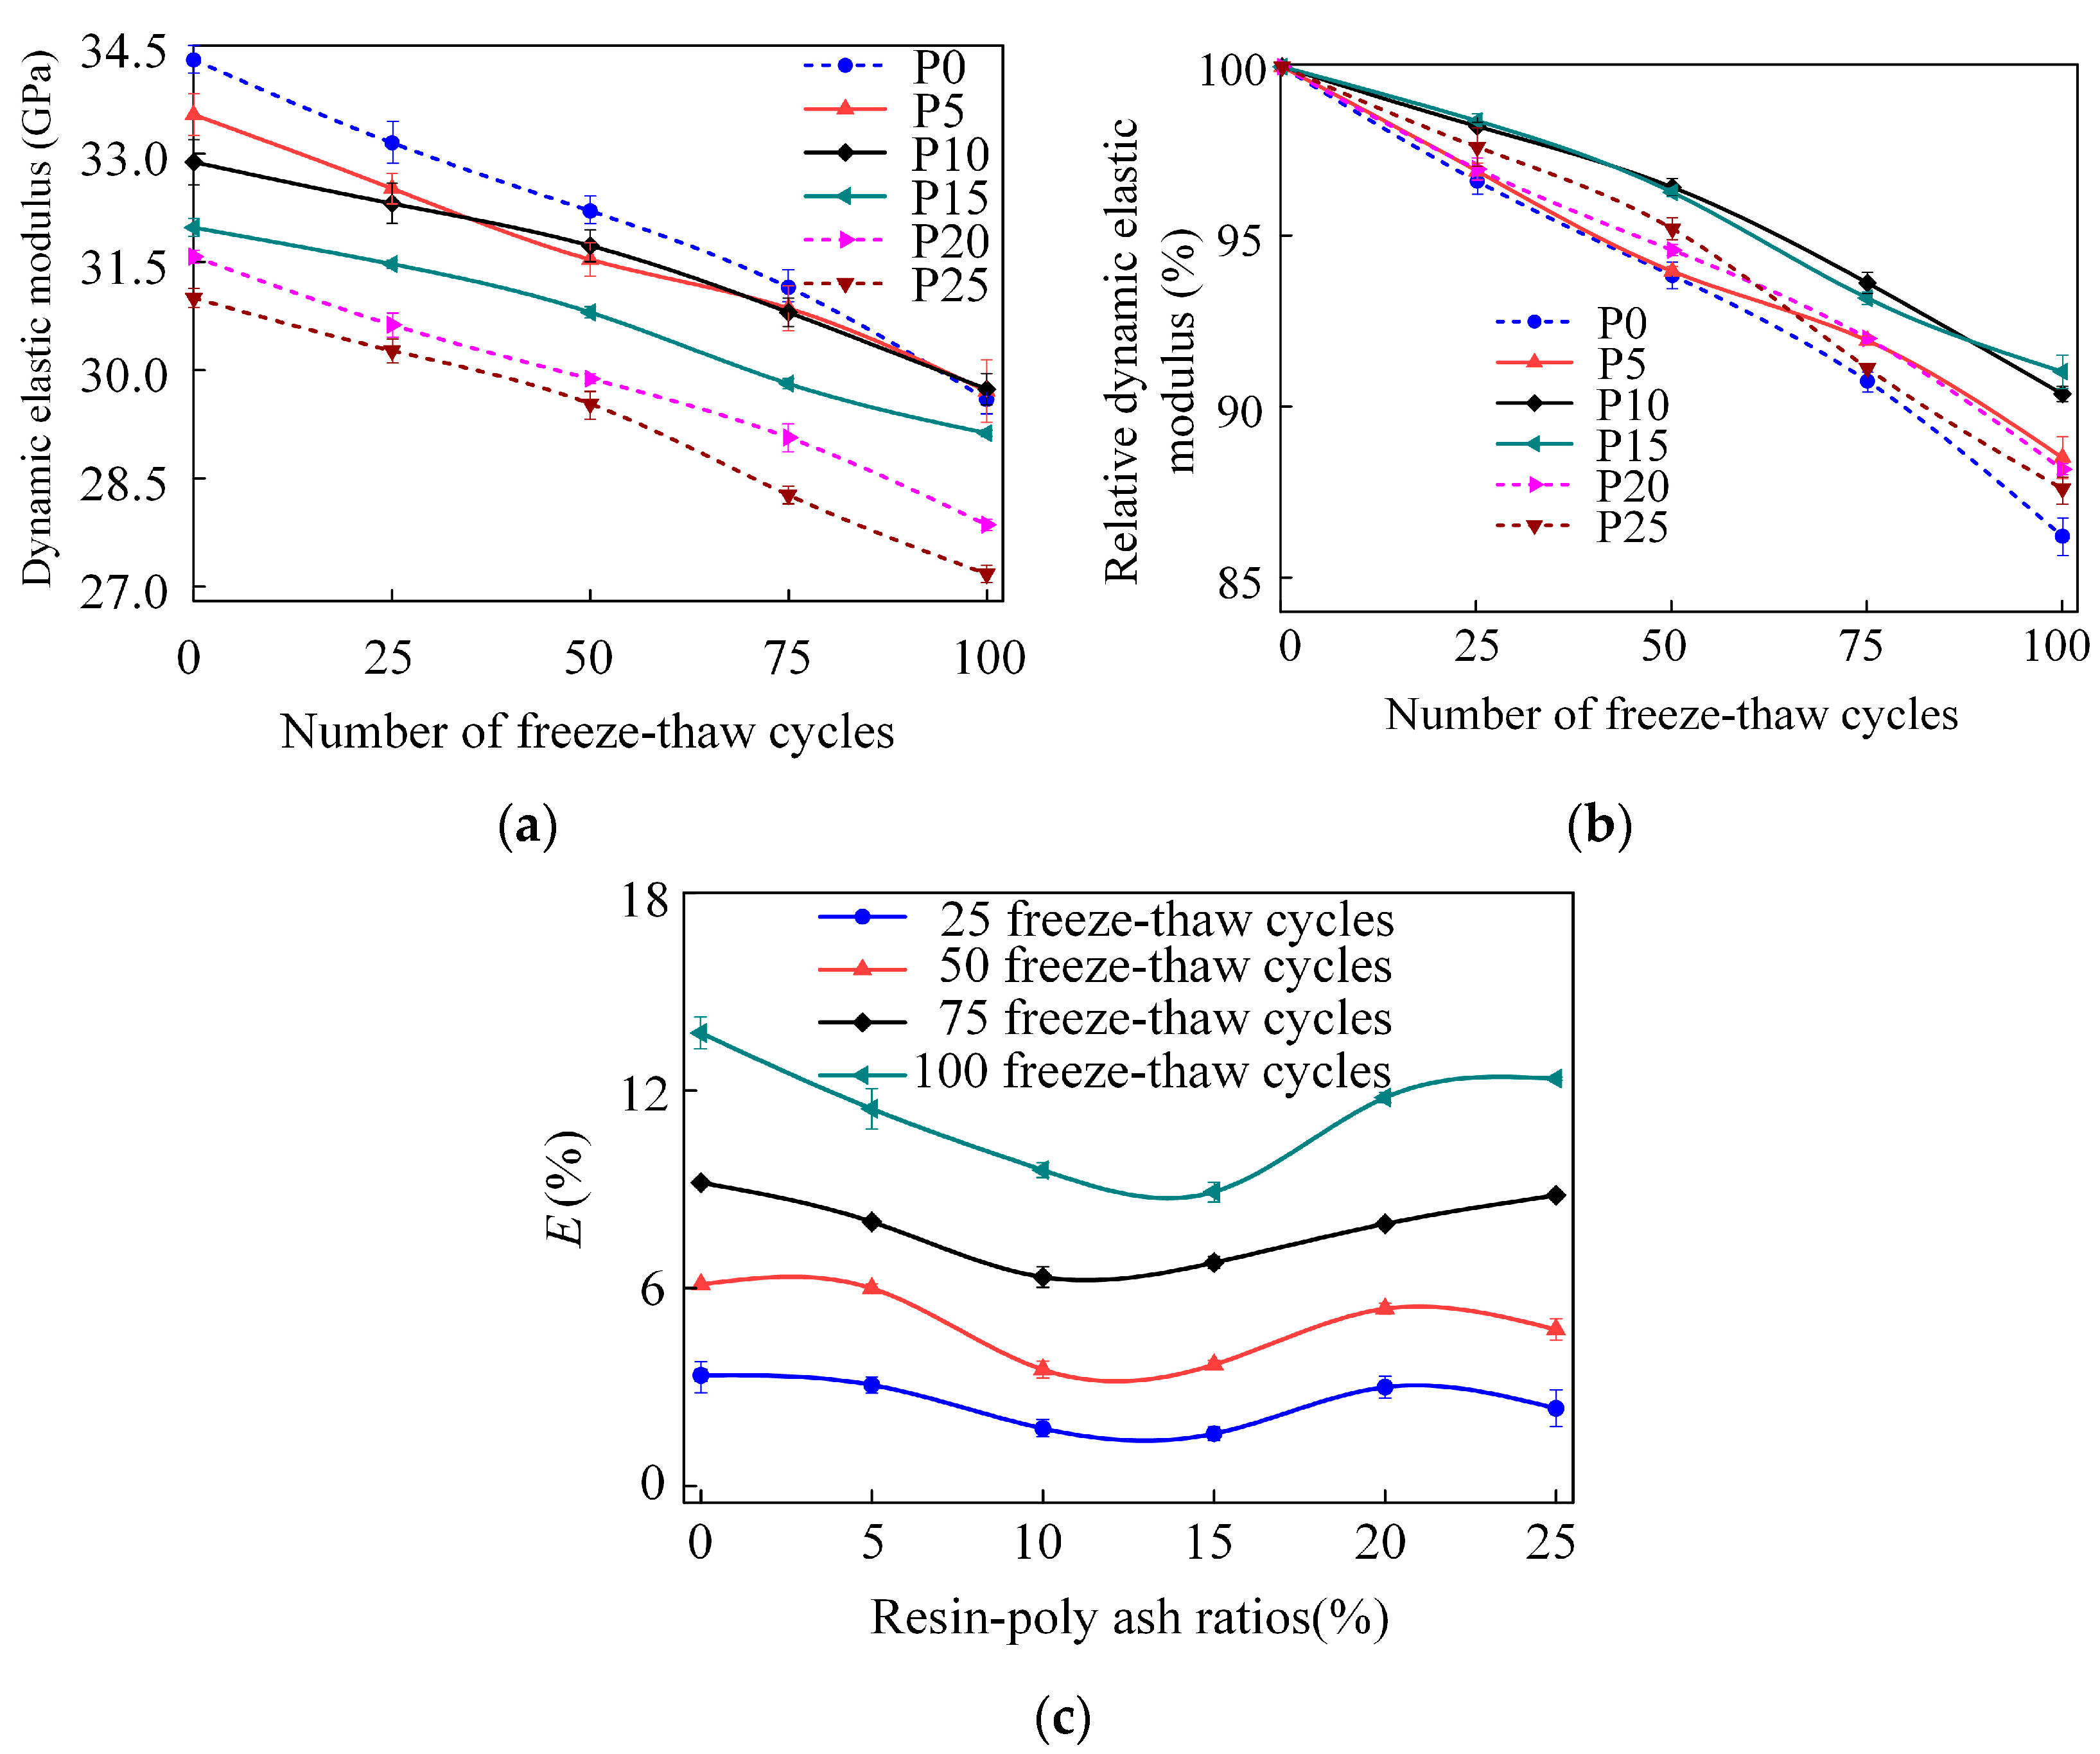
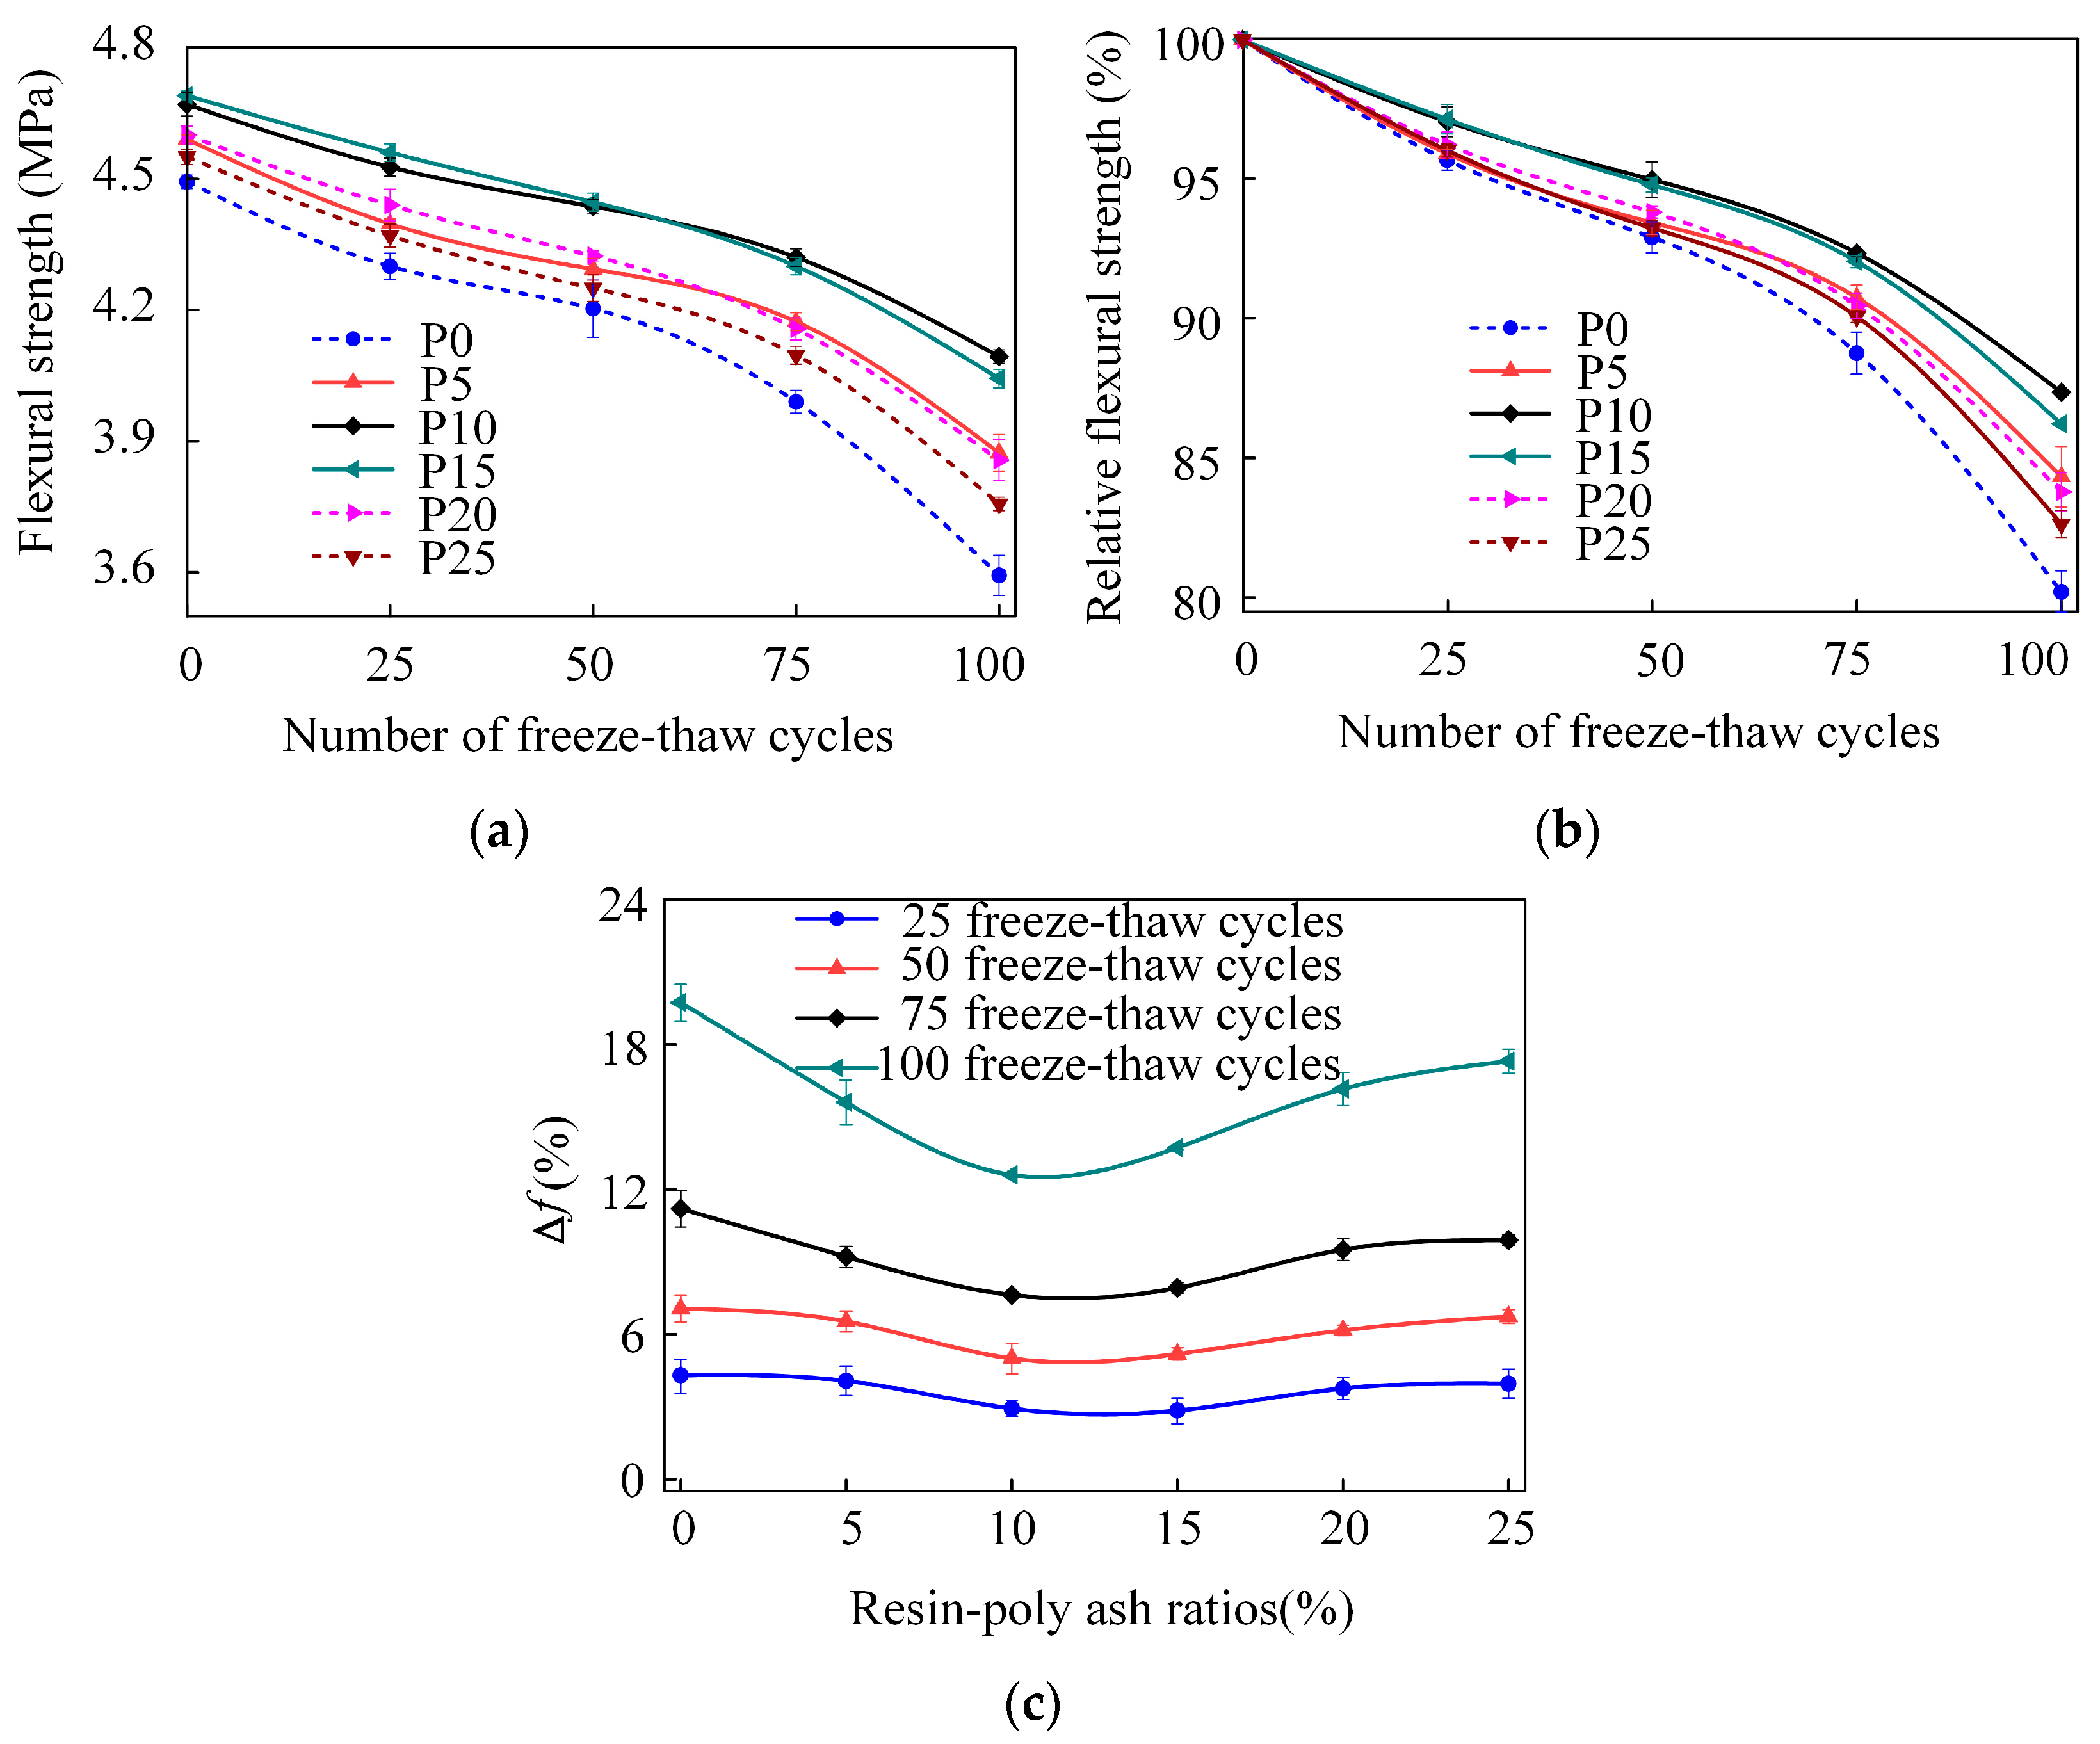
- After 100 freeze–thaw cycles, the surface porosity of P10 was 13.894%, which was 22.73% lower than that of P0 and 22.31% lower than that of P25. The ΔW of P0 was 2.57%, whereas that of P15 was 0.95%, marking a 63.04% reduction. The ΔE of P0 was 13.74%, whereas that of P15 was 8.92%, marking a 35.08% reduction. The Δf of P0 was 19.73%, whereas that of P15 was 13.73%, marking a 30.41% reduction. Under the same number of freeze–thaw cycles, the loss rates of dynamic elastic modulus and flexural strength exhibited an initial decline followed by an increase as epoxy resin content increased.
- (3)
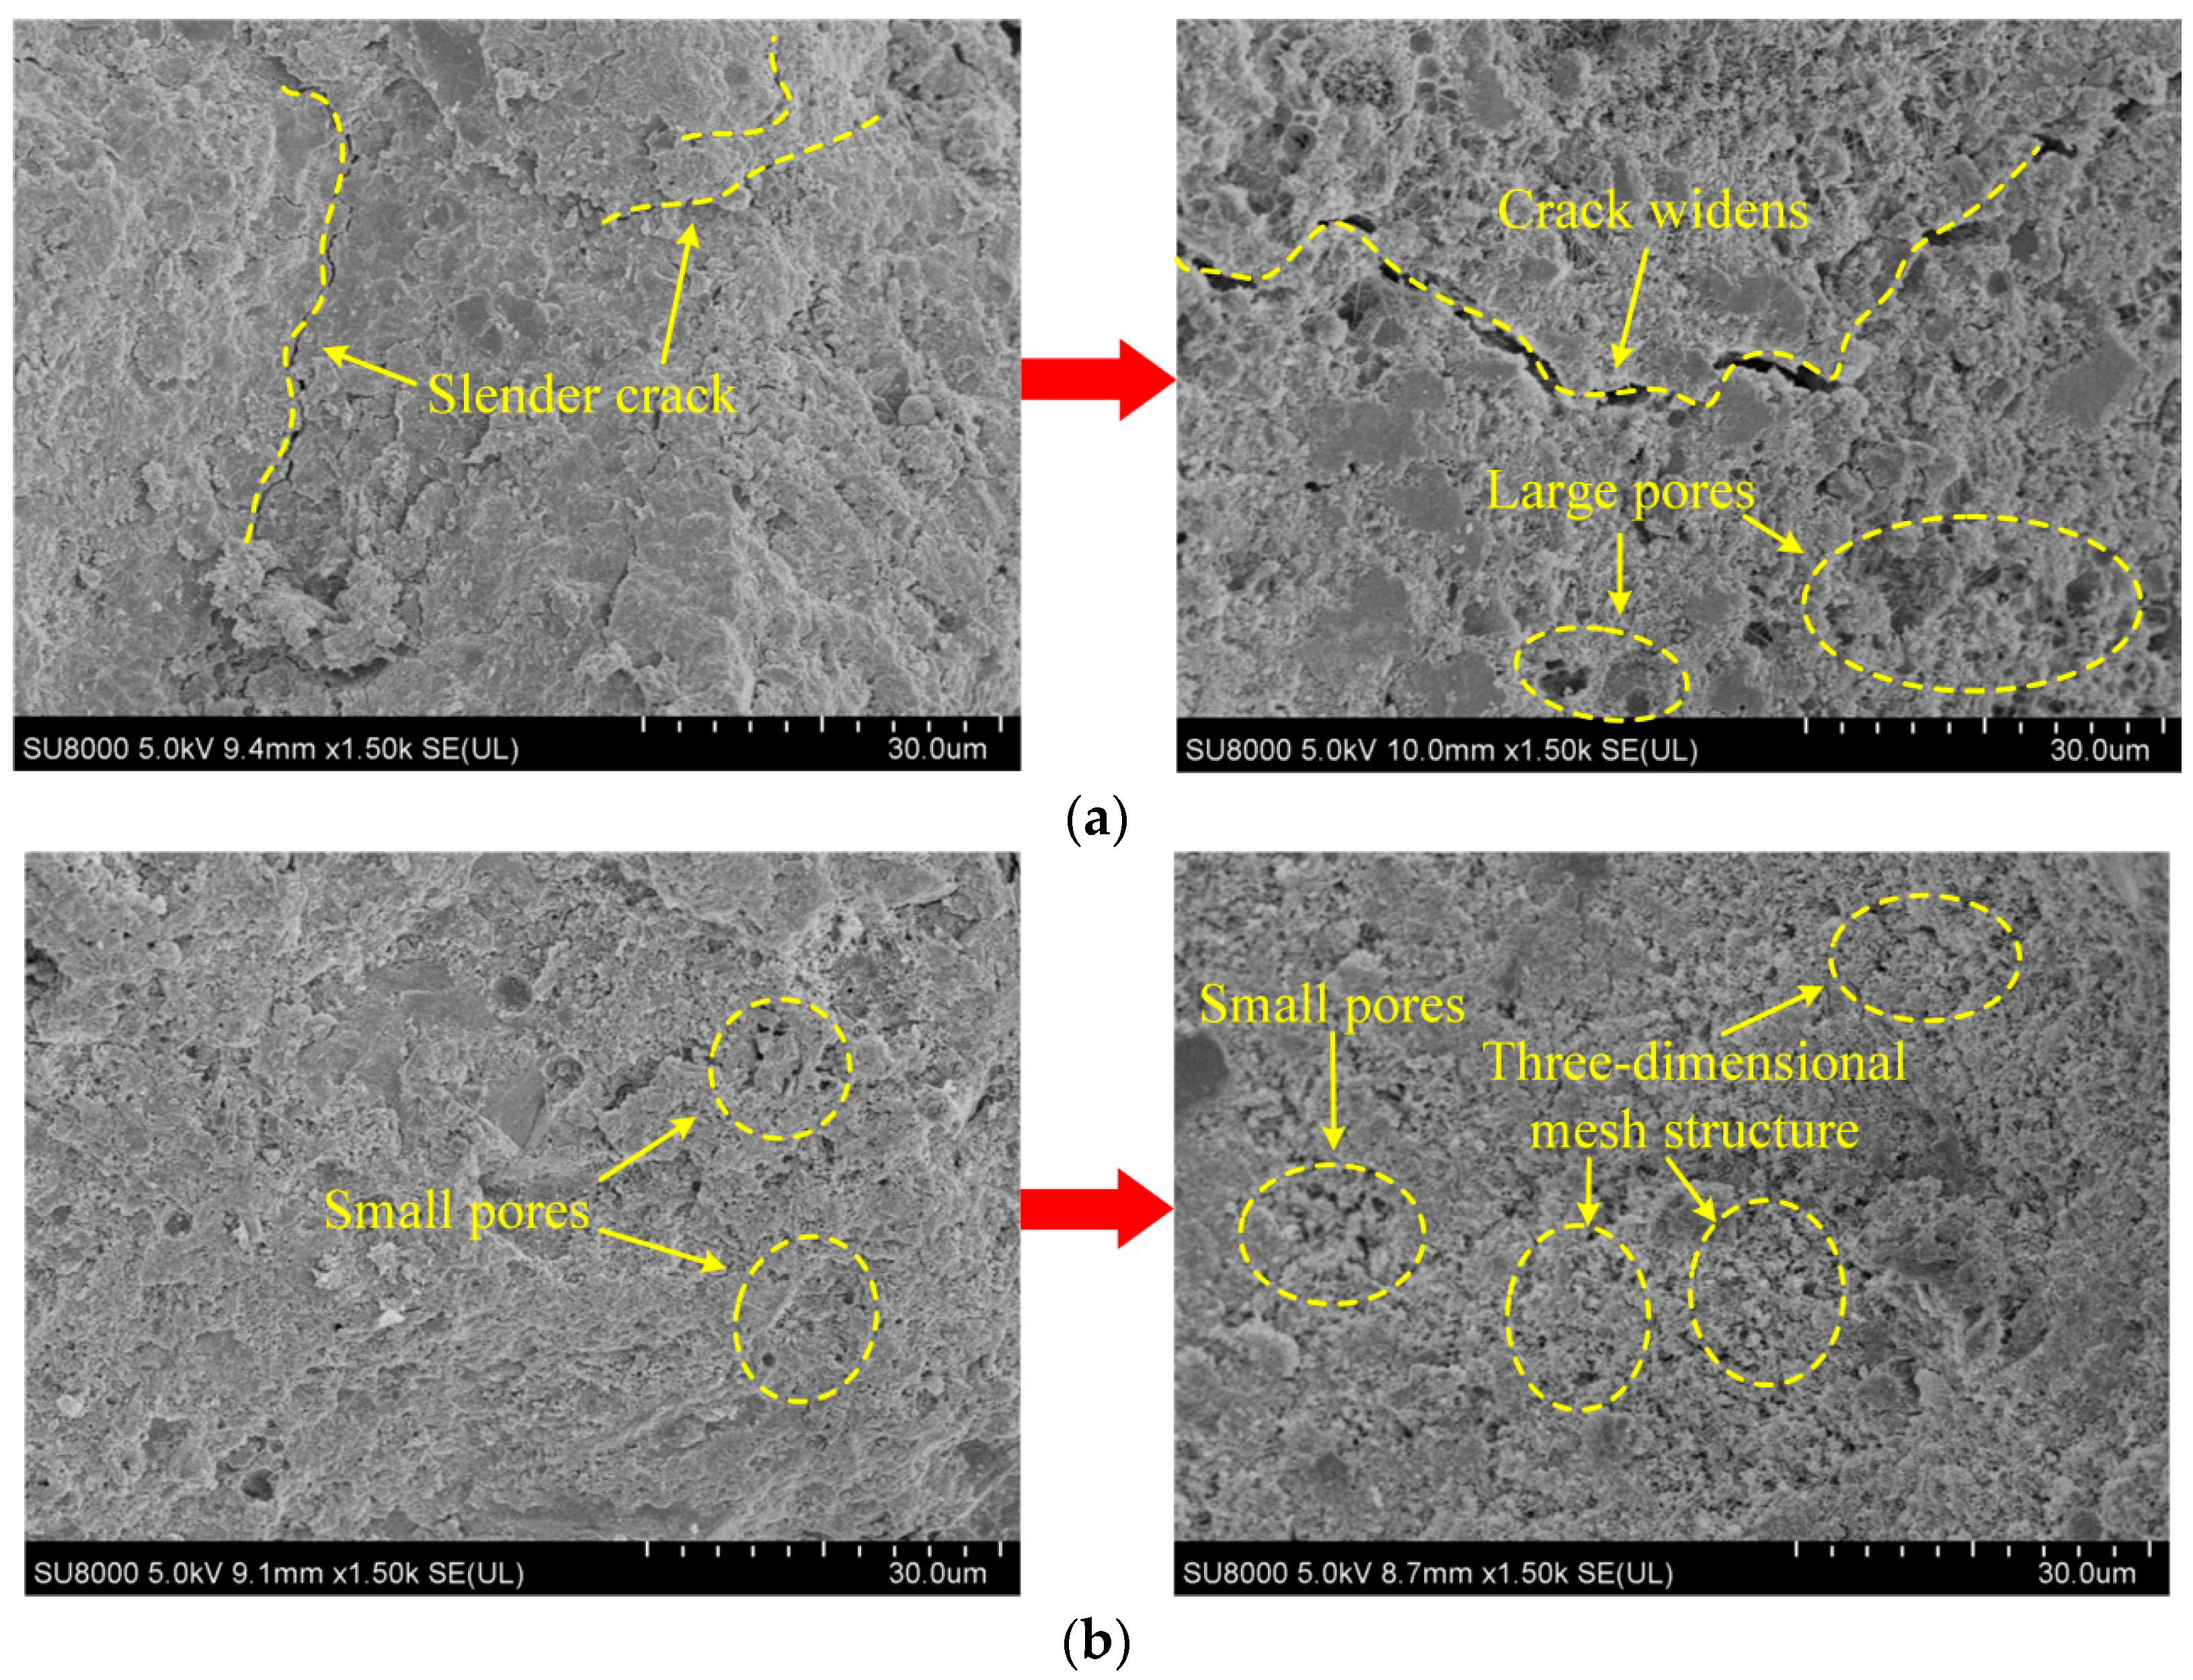
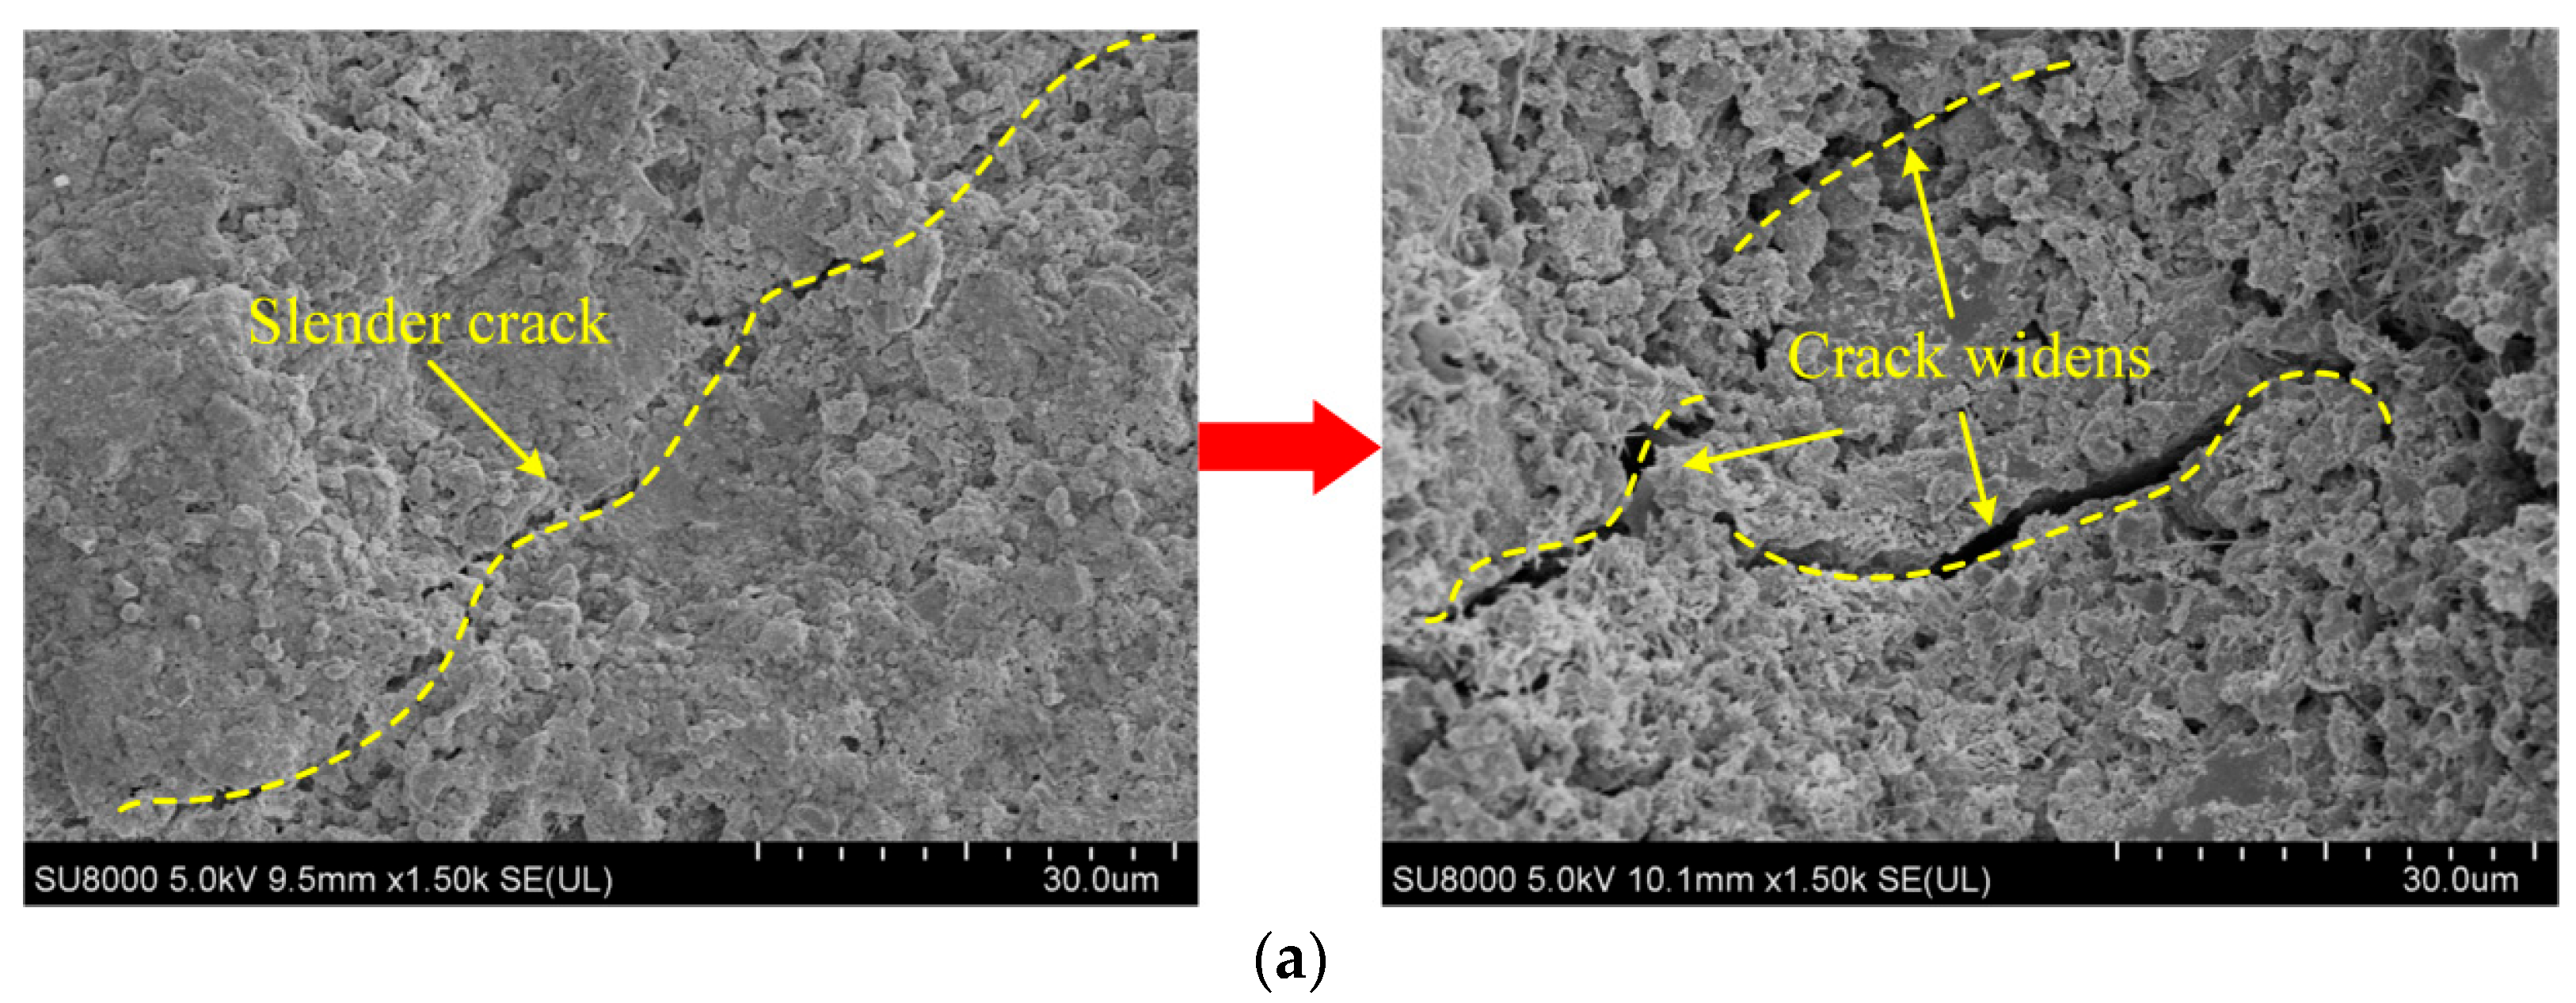
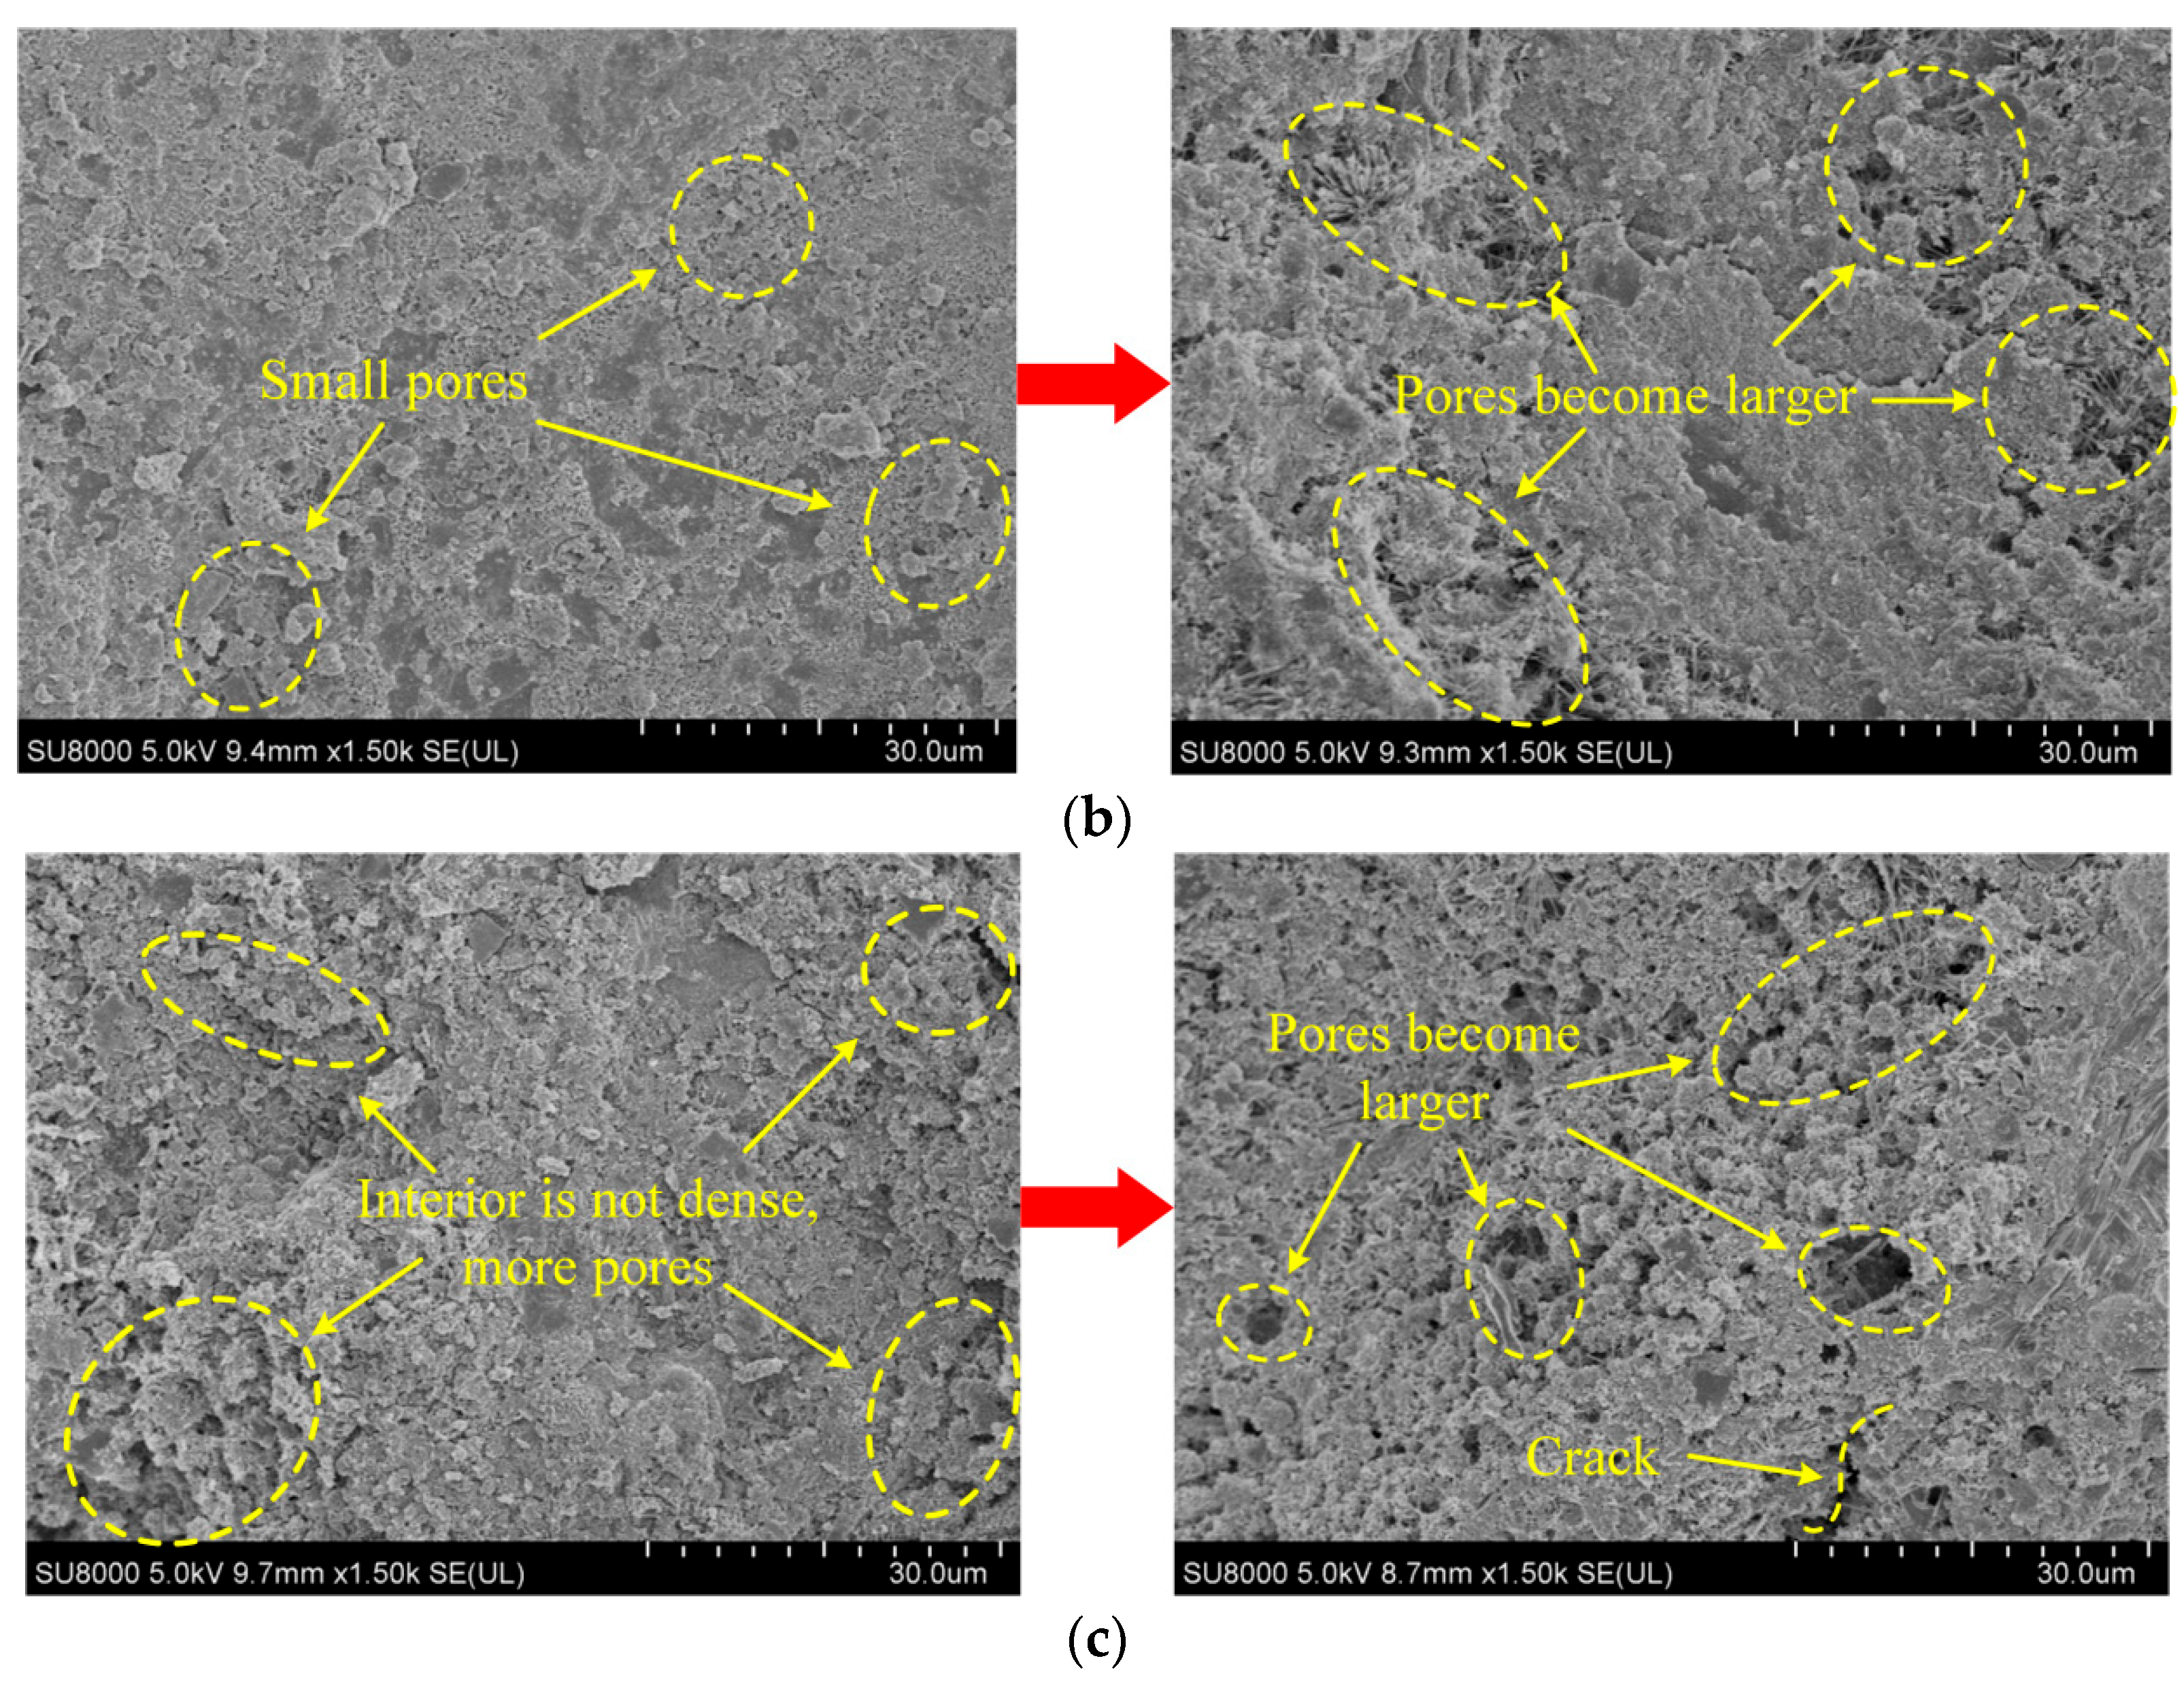
- After 120 days of immersion in the salt solution, the P0 suffered severe erosion, with a substantial increase in pore formation and enlarged microstructural cracks, but the P10 retained a relatively compact structure, with smaller and less interconnected pores, demonstrating superior resistance to salt erosion. After 100 freeze–thaw cycles, the P0 exhibited extensive cracking and increased porosity, whereas P10 and P15 remained crack-free with fewer and smaller pores, maintaining a denser internal structure. An appropriate amount of epoxy resin effectively suppresses crack and pore development under salt erosion and freeze–thaw coupling.
- (4)
- According to the statistical analysis of the data, incorporating an optimal amount of epoxy resin significantly enhances concrete resistance to salt erosion and freeze–thaw cycles. Concrete with 10–15% epoxy resin exhibited minimal surface deterioration, slower degradation in mechanical properties, and a denser microstructure. It showed the lowest reduction rates in the compressive strength corrosion coefficient, relative mass, relative dynamic elastic modulus, and strength loss parameters, demonstrating superior resistance to salt erosion and freeze–thaw damage, making it a sustainable material.
Author Contributions
Funding
Institutional Review Board Statement
Informed Consent Statement
Data Availability Statement
Conflicts of Interest
References
- Zhang, M.S.; Chiu, C.F.; Zhou, Y.Z.; Wang, Y.N. Compression and water retention behavior of saline soil improved by MICP combined with activated carbon. Sci. Rep. 2024, 14, 31484. [Google Scholar] [CrossRef]
- Xiao, S.X.; Bu, X.; Chen, Y.F.; Wang, X.W. Investigating the damage-based seismic performance of the blind bolt-connected steel framework. Structures 2024, 69, 107388. [Google Scholar] [CrossRef]
- Deng, Y.H.; Yan, C.W.; Niu, P.K. Hysteretic model of reinforced concrete bridge piers based on earthquake damage and corrosion from saline soil. Soil Dyn. Earthq. Eng. 2023, 166, 107732. [Google Scholar] [CrossRef]
- Tamayo, P.; Rico, J.; López-Gayarre, F.; Fiol, F.; Panzera, T.H.; Thomas, C. Effect of siderurgical aggregates on concrete exposed to saline environments. Constr. Build. Mater. 2022, 352, 129061. [Google Scholar] [CrossRef]
- Deng, Y.H.; Yan, C.W.; Li, J.; Liu, S.S.; Zhang, J.; Wang, J.J. Seismic deformation of reinforced concrete piers corroded by saline soil. Bull. Earthq. Eng. 2022, 20, 6763–6788. [Google Scholar] [CrossRef]
- Zhang, J.; Lai, Y.M.; Zhang, M.Y.; Li, S.Y.; Li, D.Q.; You, Z.M. Numerical study on the hydro-thermal-chemical–mechanical coupling mechanism in sulfate saline soil under freeze–thaw cycles. Comput. Geotech. 2024, 176, 106803. [Google Scholar] [CrossRef]
- Ji, F.L.; Peng, Y.S.; Lv, Q.F.; Li, W.; Yu, J.J. Pure salt expansion behavior in sulfate saline soil under negative temperature conditions. Cold Reg. Sci. Tech. 2024, 225, 104273. [Google Scholar] [CrossRef]
- Li, H.B.; Kang, X.R.; Li, S.; Shan, L.; Zhang, Z.; Wang, Z. Characterization and mechanism study of sulfate saline soil solidification in seasonal frozen regions using ternary solid waste-cement synergy. Constr. Build. Mater. 2024, 427, 136263. [Google Scholar] [CrossRef]
- Wang, F.J.; Jiang, J.Y.; Zhang, A.N.; Wang, L.G.; Sui, S.Y. Sulfate transport assessment of cementitious materials-solidified saline soil. J. Sustain. Cen.-Based Mater. 2023, 12, 1577–1591. [Google Scholar]
- Yang, B.; Hu, X.P.; Zhong, S.; Sun, J.J.; Peng, G. Macroscopic properties evolution and microstructural analysis of early-age concrete in sulfate saline soil. Constr. Build. Mater. 2024, 431, 136607. [Google Scholar] [CrossRef]
- Wang, C.J.; Wang, Z.H.; Liu, S.P.; Luo, H.X.; Fan, W.H.; Liu, Z.J.; Liu, F.T.; Wang, H.Y. Anti-corrosion and wear-resistant coating of waterborne epoxy resin by concrete- like three-dimensional functionalized framework fillers. Chem. Eng. Sci. 2021, 242, 116748. [Google Scholar] [CrossRef]
- Fahim, H.G.; Mohd, S.A.R.; Iman, F.; Hajmohammadian, B.M. Performance of Epoxy Resin Polymer as Self-Healing Cementitious Materials Agent in Mortar. Materials 2021, 14, 1255. [Google Scholar] [CrossRef]
- Natarajan, S.; Pillai, N.N.; Murugan, S. Experimental Investigations on the Properties of Epoxy-Resin-Bonded Cement Concrete Containing Sea Sand for Use in Unreinforced Concrete Applications. Materials 2019, 12, 645. [Google Scholar] [CrossRef] [PubMed]
- Krzywiński, K.; Sadowski, Ł. The Effect of Texturing of the Surface of Concrete Substrate on the Pull-Off Strength of Epoxy Resin Coating. Coatings 2019, 9, 143. [Google Scholar] [CrossRef]
- Szewczak, A.; Łagód, G. Experimental Research on the Possibility of Changing the Adhesion of Epoxy Glue to Concrete. Materials 2024, 17, 5398. [Google Scholar] [CrossRef] [PubMed]
- Chen, P.Q.; Li, Y.Q.; Zhou, X.J.; Wang, H.; Li, J. Study on the Bond Performance of Epoxy Resin Concrete with Steel Reinforcement. Buildings 2024, 14, 2905. [Google Scholar] [CrossRef]
- Kashyzadeh, R.K. Effect of Corrosive Environment on the High-Cycle Fatigue Behavior of Reinforced Concrete by Epoxy Resin: Experimental Study. Polymers 2023, 15, 3939. [Google Scholar] [CrossRef]
- Zhang, W.B.; Liu, Z.Y.; Liu, Q.B.; Zhang, W.Q. Investigation of bond behavior between waterborne epoxy-coated steel reinforcing bars (WECR) and concrete. J. Build. Eng. 2023, 76, 107328. [Google Scholar] [CrossRef]
- Andrzej, S.; Grzegorz, Ł. Adhesion of Modified Epoxy Resin to a Concrete Surface. Materials 2022, 15, 8961. [Google Scholar] [CrossRef]
- Gong, J.Q.; Li, K. Minimizing Drying Shrinkage and Enhancing Impermeability of Foam Concrete Modified with Epoxy Resin. Adv. Civ. Eng. 2020, 2020, 8897687. [Google Scholar] [CrossRef]
- Geng, W.Z.; Li, C.G.; Zeng, D.L.; Chen, J.Y.; Wang, H.T.; Liu, Z.Z.; Liu, L.C. Effect of epoxy resin surface-modified techniques on recycled coarse aggregate and recycled aggregate concrete. J. Build. Eng. 2023, 76, 107081. [Google Scholar] [CrossRef]
- Zhang, Z.; Zhang, H.L.; Lv, W.J.; Zhang, J.M.; Wang, N. Micro-structure characteristics of unsaturated polyester resin modified concrete under fatigue loads and hygrothermal environment. Constr. Build. Mater. 2021, 296, 123766. [Google Scholar] [CrossRef]
- Guo, S.Y.; Zhang, X.; Chen, J.Z.; Mou, B.; Shang, H.S.; Wang, P.; Zhang, L.H.; Ren, J. Mechanical and interface bonding properties of epoxy resin reinforced Portland cement repairing mortar. Constr. Build. Mater. 2020, 264, 120715. [Google Scholar] [CrossRef]
- Xia, D.T.; Xia, P.; Hu, J.; Li, X.Y.; Zhan, Z.J. Optimization of mechanical properties of pervious recycled concrete using polypropylene fiber and waterborne epoxy resin. Structures 2024, 63, 106372. [Google Scholar] [CrossRef]
- Lei, Z.; Xiao, T.Y.; Yang, C.B.; Li, Z.P.; Shi, X.M. Improving the performance of CFRP-reinforced concrete cylinders in sulfate-laden environment through nanoclay modification of epoxy resin. Constr. Build. Mater. 2024, 436, 136860. [Google Scholar] [CrossRef]
- Shen, B.H.; Sheng, Y.P.; Abdulakeem, A.; Zhu, C.Y.; Yang, H.F.; Wang, L.B. An experimental characterization of the properties of graphene oxide—Waterborne epoxy resin coating of concrete after chloride erosion. Constr. Build. Mater. 2024, 428, 136207. [Google Scholar] [CrossRef]
- Zhang, H.X.; Sun, X.W.; Wang, Y. Bond performance of NSM FRP–concrete interfaces with epoxy under chloride-salt conditioned environments. Struct. Concr. 2024, 25, 2269–2288. [Google Scholar] [CrossRef]
- Luo, D.M.; Li, F.; Niu, D.T. Study on the deterioration of concrete performance in saline soil area under the combined effect of high low temperatures, chloride and sulfate salts. Cem. Concr. Comp. 2024, 150, 105531. [Google Scholar] [CrossRef]
- Tian, H.Z.; Qiao, H.X.; Feng, Q.; Han, W.W. Corrosion Deterioration of Reinforced Concrete in a Saline Soil Environment. J. Mater. Civ. Eng. 2023, 35, 04023387. [Google Scholar] [CrossRef]
- Fu, Y.; Qiao, H.X.; Hakuzweyezu, T.; Qiao, G.B.; Guo, F. Accelerated Deterioration Mechanism and Reliability Evaluation of Concrete in Saline Soil Area. J. Wuhan Univ. Technol.-Mater. Sci. Ed. 2023, 38, 582–590. [Google Scholar] [CrossRef]
- Wang, L.; Zhang, B.; Zhang, H.L.; Zhao, B.D.; Wang, B.; Zhao, Q.M.; Sun, M. Research on Flexural and Freeze–Thaw Properties of Polypropylene-Fiber-Reinforced Pavement Concrete Containing Waterborne Epoxy. Coatings 2023, 13, 1035. [Google Scholar] [CrossRef]
- Zhang, J.H.; Li, J.; Yun, H.; Long, J.Z.; Zhu, Q.X.; Guan, Z.G. Durability of new-to-old concrete interface under coupling action of freeze-thaw cycle and chloride salt erosion. Structures 2024, 70, 107867. [Google Scholar] [CrossRef]
- Deng, Q.; Wang, Z.X.; Li, S.H.; Yu, Q.L. Salt scaling resistance of pre-cracked ultra-high performance concrete with the coupling of salt freeze-thaw and wet-dry cycles. Cem. Concr. Compos. 2024, 146, 105396. [Google Scholar] [CrossRef]
- Ning, X.L.; Liu, Z.Y.; Li, Y.Y.; You, Z.G.; Zhang, Z.K.; Li, J.F. Bond durability between GFRP rebars and fiber reinforced self-compacting concrete under coupled chloride salt and freeze-thaw cycles. Acta Mater. Compos. Sin. 2024, 1–18. [Google Scholar] [CrossRef]
- Ding, Y.N.; Ge, M.L.; Liu, Q.W.; Zhu, H. Effect of macro steel fiber on damage of concrete after salt freeze-thaw cycle. J. Civil Environ. Eng. 2024, 46, 159–166. [Google Scholar]
- Xia, D.T.; Feng, C.L.; Zheng, Z.; Wu, H. Salt-frost damage model of hybrid fiber reinforced concrete under the coupling action of salt-freeze-thaw cycles. Eng. J. Wuhan Univ. 2024, 57, 55–63. [Google Scholar]
- JGJ 55-2011; Specification for Mix Proportion Design of Ordinary Concrete. Ministry of Housing and Urban-Rural Development of the People’s Republic of China: Beijing, China; China Architecture & Building Press: Beijing, China, 2011; pp. 4–14.
- GB/T 50082-2009; Standard for Test Methods of Long-Term Performance and Durability of Ordinary Concrete. Ministry of Housing and Urban-Rural Development of the People’s Republic of China: Beijing, China; China Architecture & Building Press: Beijing, China, 2009; pp. 6–14.
- Zhang, X.Y. Research on Anti-corrosion Performance and Mechanism of Concrete in Saline Soil Environment. M.A. Thesis, Taiyuan University of Technology, Taiyuan, China, 2020; p. 42. [Google Scholar]
- Li, P.F.; Lu, W.; An, X.H.; Zhou, L.; Du, S.L. Effect of Epoxy Latexes on the Mechanical Behavior and Porosity Property of Cement Mortar with Different Degrees of Hydration and Polymerization. Materials 2024, 14, 517. [Google Scholar] [CrossRef]
- Zhang, Z.H.; Li, M.; Liu, G.; Zhou, P.; Qi, H. Effects of waterborne epoxy resin on the mechanical properties and microstructure of slag cementing slurries. J. Disper. Sci. Technol. 2023, 44, 1932–1939. [Google Scholar] [CrossRef]
- Wang, Y.X.; Liu, Q.S. Investigation on fundamental properties and chemical characterization of water-soluble epoxy resin modified cement grout. Constr. Build. Mater. 2021, 299, 123877. [Google Scholar] [CrossRef]
- Zhong, X. Preparation and mechanical properties of cement concrete modified by waterborne epoxy resin. J. Funct. Mater. 2021, 52, 12008–12012. [Google Scholar]
- Liang, X.J. Preparation and durability experimental analysis of epoxy resin modified cement concrete. J. Funct. Mater. 2023, 54, 3217–3223. [Google Scholar]
- Li, L.J.; Qin, D.J.; Xu, Z.J.; Feng, Y. Study on Strengthening Mechanism of Epoxy Resin/Rubber Concrete Interface by Molecular Dynamics Simulation. Adv. Civil Eng. 2022, 2022, 5100758. [Google Scholar] [CrossRef]
- Li, H.; Guo, H.L.; Zhang, Y. Deterioration of concrete under the coupling action of freeze–thaw cycles and salt solution erosion. Rev. Adv. Mater. Sci. 2022, 61, 322–333. [Google Scholar] [CrossRef]
- Li, L.L.; Kang, K.; Feng, Z.P.; Xiao, Q.B.; Xiao, Q.H. Study on performance deterioration of recycled concrete under coupling effect of freeze-thaw and sulfate. J. Xi’an Univ. Arch. Tech. (Nat. Sci. Ed.). 2023, 55, 571–577. [Google Scholar]
- Huang, Y.X.; Xiong, C.S.; Yang, H.; Jin, Z.Q.; Wang, P.G.; Guo, X.K.; Wang, Z.R.; Hu, Y.; Zhao, X.Y. Effect of temperature on epoxy resin deterioration for fibre-reinforced polymer reinforcement in simulated concrete pore solutions. Constr. Build. Mater. 2023, 409, 133701. [Google Scholar]


| Type | Appearance | Solid Content/% | PH Value | Epoxide Number | Viscosity/Pa.s | Density/g·cm−3 |
|---|---|---|---|---|---|---|
| DY-128-50 | Milky white uniform liquid | 50 ± 3 | 6~8 | 0.52 | ≤2 | 1.05 |
| Type | Appearance | Solid Content/% | PH Value | Viscosity/Pa.s | Amine Value |
|---|---|---|---|---|---|
| DY-175 | Light brown uniform liquid | 49~51 | 9.5~10.5 | 6.5~9 | 330 |
| Group | Specimens | Epoxy Resin Content /% | Defoamer Content /% | Cement /kg·m−3 | Sand /kg·m−3 | Coarse Aggregate /kg·m−3 | Water /kg·m−3 |
|---|---|---|---|---|---|---|---|
| No. 1 | P0 | 0 | 0 | 342 | 704 | 1149 | 205 |
| No. 2 | P5 | 5 | 1 | 342 | 704 | 1149 | 205 |
| No. 3 | P10 | 10 | 1 | 342 | 704 | 1149 | 205 |
| No. 4 | P15 | 15 | 1 | 342 | 704 | 1149 | 205 |
| No. 5 | P20 | 20 | 1 | 342 | 704 | 1149 | 205 |
| No. 6 | P25 | 25 | 1 | 342 | 704 | 1149 | 205 |
| Ion Types | SO42−/g·kg−1 | Mg2+/g·kg−1 | Cl−/g·kg−1 | CO32−/g·kg−1 | HCO3−/g·kg−1 |
|---|---|---|---|---|---|
| Contents | 3.92 | 3.38 | 4.55 | 1.07 | 0.94 |
| Solution Name | Types of Solutions | Baseline Salt Content/g·L−1 | Solution Concentration/% | ||||
|---|---|---|---|---|---|---|---|
| NaCl | Na2CO3 | NaHCO3 | MgSO4 | Na2SO4 | |||
| F0 | Pure Water | 0 | 0 | 0 | 0 | 0 | 0 |
| F1 | Reference Solution | 6.53 | 1.54 | 1.35 | 9.70 | 0.78 | 1.99 |
| F5 | 5× Solution | 32.65 | 7.70 | 6.75 | 48.50 | 3.90 | 9.95 |
| F10 | 10× Solution | 65.30 | 15.40 | 13.50 | 97.00 | 7.80 | 19.90 |
Disclaimer/Publisher’s Note: The statements, opinions and data contained in all publications are solely those of the individual author(s) and contributor(s) and not of MDPI and/or the editor(s). MDPI and/or the editor(s) disclaim responsibility for any injury to people or property resulting from any ideas, methods, instructions or products referred to in the content. |
© 2025 by the authors. Licensee MDPI, Basel, Switzerland. This article is an open access article distributed under the terms and conditions of the Creative Commons Attribution (CC BY) license (https://creativecommons.org/licenses/by/4.0/).
Share and Cite
Zhang, Z.; Zhang, F.; Wu, C.; Chen, Y. Experimental Study on the Performance of Sustainable Epoxy Resin-Modified Concrete Under Coupled Salt Corrosion and Freeze–Thaw Cycles. Sustainability 2025, 17, 6186. https://doi.org/10.3390/su17136186
Zhang Z, Zhang F, Wu C, Chen Y. Experimental Study on the Performance of Sustainable Epoxy Resin-Modified Concrete Under Coupled Salt Corrosion and Freeze–Thaw Cycles. Sustainability. 2025; 17(13):6186. https://doi.org/10.3390/su17136186
Chicago/Turabian StyleZhang, Zhen, Fang Zhang, Chuangzhou Wu, and Yafei Chen. 2025. "Experimental Study on the Performance of Sustainable Epoxy Resin-Modified Concrete Under Coupled Salt Corrosion and Freeze–Thaw Cycles" Sustainability 17, no. 13: 6186. https://doi.org/10.3390/su17136186
APA StyleZhang, Z., Zhang, F., Wu, C., & Chen, Y. (2025). Experimental Study on the Performance of Sustainable Epoxy Resin-Modified Concrete Under Coupled Salt Corrosion and Freeze–Thaw Cycles. Sustainability, 17(13), 6186. https://doi.org/10.3390/su17136186