Abstract
This study aims to evaluate how key financial, educational, technological, and institutional drivers shape resource efficiency (RCE), a critical pillar of sustainable development—across major economies. Enhancing RCE is vital for ensuring long-term ecological and economic stability while meeting global sustainability targets. Using panel data from 2000 to 2022 for G20 countries, this research examines the dynamic effects of natural resources (NRSs), educational quality (EDQ), financial inclusion (FIN), green innovation (GRI), and economic complexity (ECC) on RCE. The Cross-Sectional Autoregressive Distributed Lag (CS-ARDL) model is applied to capture both short- and long-term relationships and is validated by robustness checks using the Augmented Mean Group (AMG) and Common Correlated Effects Mean Group (CCEMG) estimators. The results show that EDQ and FIN exert a negative influence on RCE, suggesting that governance inefficiencies occur when aligning education systems and financial mechanisms with sustainability goals. In contrast, NRS, GRI, and ECC significantly enhance RCE, underscoring the value of resource stewardship, innovation-driven transitions, and complex economic structures in promoting efficiency. These findings have governance implications, emphasizing the need for institutional reforms that integrate sustainability into the education and financial sectors while supporting green innovation and economic diversification. Policymakers in G20 economies are urged to implement coherent strategies that redirect educational and financial frameworks toward inclusive, resilient, and resource-efficient development pathways, thereby advancing the United Nations Sustainable Development Goals (SDGs).
1. Introduction
Resource efficiency (RCE) is generally described as the optimal use of resources to achieve the desired outcome with minimal waste and environmental impact. Moreover, RCE is crucial as it supports sustainable economic growth, minimizes environmental impact, and reduces costs [1,2]. RCE is important for addressing global challenges like climate change and resource scarcity. On the other hand, the Sustainable Development Goals (SDGs) established by the United Nations represent a comprehensive blueprint for addressing global challenges, including environmental sustainability, economic growth, and social inclusion [3,4]. Among these goals, SDG 12 (Responsible Consumption and Production) and SDG 13 (Climate Action) are particularly relevant to RCE in G20 countries [5,6]. As nations are striving toward these goals, recognizing the complex effects of educational quality (EDQ), financial inclusion (FIN), green innovation (GRI), and economic complexity (GEP) on RCE is essential.
Moreover, research has shown that better educational outcomes are linked to increased environmental awareness and more effective resource management strategies [7,8]. Furthermore, refs. [9,10] reported that NRSs and human development significantly contribute to ecological sustainability. According to the literature, NRSs are integral to economic development but require careful management to avoid detrimental environmental impacts. However, efficient resource utilization is essential for sustainable growth and involves optimizing the use of available resources while minimizing waste and environmental harm [11,12]. Furthermore, FIN is increasingly recognized as a vital component of sustainable development. Access to financial services empowers individuals and businesses to invest in green technologies and sustainable practices, thereby enhancing RCE [13]. NRS and FIN reduce environmental degradation [14,15]. Additionally, studies by [16,17] indicate that long-term growth requires GRI, sustainable resource use, and a strengthened FIN sector. GRI is crucial for advancing sustainability by reducing environmental impacts and improving RCE. Innovations in green technology contribute to more sustainable production and consumption patterns [18,19]. Increasing ECC leads extensively to the advancement of green development. The ECC reflects the diversity and sophistication of an economy’s production and export capabilities. A higher ECC often correlates with enhanced innovation and more efficient resource use [20,21].
Furthermore, educational quality (EDQ) plays a vital role in sustainable development by equipping individuals with the skills to develop innovative resource-saving solutions [22]. Meanwhile, the effective management of natural resources (NRSs) is critical for achieving resource consumption efficiency (RCE), although resource-rich nations often encounter the paradox of abundance, resulting in inefficiencies and ecological degradation [23]. Within the G20 economies, NRS management outcomes vary—Brazil’s policies to protect the Amazon rainforest support global RCE [24]—whereas fossil-fuel-dependent nations like Russia and Saudi Arabia struggle with unsustainable exploitation [25]. Financial inclusion (FIN) also fosters sustainable development by enabling investments in green technologies and promoting social equity [26], with evidence from South Africa highlighting its positive effect on resource management [27]. Furthermore, long-run links between fiscal growth, NRS management, and sustainability have been affirmed in recent studies [28]. Green innovation (GRI) reduces environmental impacts by enhancing resource efficiency [29], and in G20 countries, it plays a pivotal role given the region’s intensive economic activity [30]. For example, ref. [31] employed a PVAR model across 29 countries and reported that green bonds and technology promote agricultural green growth. Finally, economic complexity (ECC) supports RCE by fostering innovation capacity; countries like Japan and Germany exemplify how complex economies can effectively implement resource-efficient technologies [32,33].
Although this topic has been extensively studied, few studies have focused on environmental, financial, and academic aspects, which can play a major role in accelerating RCE, especially when G20 countries and the years 2000–2022 are considered. In addition, conventional econometric methods have been used in most of the previous studies, which might not adequately capture the complex and dynamic interactions between NRS, EDQ, FIN, GRI, and ECC, as they navigate RCE to achieve sustainable development. Moreover, sophisticated econometric techniques like CS-ARDL, AMG, and CCEMG have not yet been applied to fully understand the effects of the previously listed components. These techniques take cross-sectional dependence and heterogeneity into consideration to generate predictions that are more reliable and accurate. Likewise, thorough cointegration tests like Westerlund, CADF, and CIPS are rarely used to evaluate long-term relationships between variables. Hence, this paper objectively fills in these gaps by utilizing an extensive framework considering RCE (dependent variable) and independent variables (NRS, EDQ, FIN, GRI, and ECC), providing a precise depiction of the overall impact created by G20 economies. However, finding both short- and long-term dynamics is possible with the help of the CS-ARDL approach. Furthermore, integrating the AMG and CCEMG methods strengthens the robustness and coherence of the results and enables a more accurate evaluation of the correlations between variables. Nevertheless, the conclusions drawn from the research will be valuable for G20 authorities in putting SDG-aligned policies about the prudent management of resources for positive outcomes into practice.
Based on the previous literature and current needs, the primary aim of this study is to explore the dynamic and heterogeneous effects of financial inclusion, educational quality, natural resource utilization, green innovation, and economic complexity on resource efficiency (RCE) within G20 countries. Unlike previous studies that often analyze these factors in isolation or within limited geographic scopes, this research integrates them into a unified framework, providing a comprehensive, multidimensional perspective on RCE. The novelty of this study lies in its application of the CS-ARDL approach—capable of addressing cross-sectional dependence and heterogeneity—to derive robust long- and short-term insights, further validated by AMG and CCEMG estimators. This work is timely and policy-relevant, as it aligns with the urgent global agenda to achieve the Sustainable Development Goals (SDGs), particularly those related to responsible resource use, innovation, and institutional strengthening. By bridging gaps in the existing literature, this paper offers valuable guidance to policymakers aiming to optimize RCE through structural reforms and sustainability-aligned development strategies. Moreover, this research addresses several critical questions:
- How does FIN impact resource consumption efficiency, and what does its negative relationship imply for RCE strategies in G20 countries?
- What role does EDQ play in shaping RCE, and why might improvements in human development not translate into better resource outcomes?
- How do GRI and ECC contribute to or hinder progress toward enhanced RCE in these G20 nations?
These questions are pivotal for understanding how to effectively integrate FIN, EDQ, and technological strategies to achieve the sustainability targets set forth by the SDGs.
The structure of this paper is organized as follows: Section 1 provides the introduction. Section 2 outlines the data sources and methodological framework employed in this study. Section 3 presents the empirical results, followed by Section 4, which discusses the key findings in the context of the existing literature. Section 5 concludes this paper and offers relevant policy recommendations.
2. Data and Methodology
2.1. Data
Selected variables of this investigation have either direct or indirect influences on RCE. For example, GRI, measured by patents of environmentally related technology, facilitates green practices and advancements, which contribute to productive consumption of resources [34]. Additionally, RCE is significantly impacted by NRS, which establishes the sustainability and availability of resources and hence shapes strategies for their effective use. Responsible management of NRS ensures the balance between resource extraction and conservation, which is crucial for long-term ecological and economic stability [35,36]. Likewise, human capital index has been used to calculate EDQ and was extracted from Penn World Table (PWT); it optimizes RCE by promoting knowledge and skills for sustainable practices and efficient resource utilization [37]. Moreover, FIN, which has been measured by domestic credit to private sector, supports RCE by enabling investments in sustainable practices and efficient resource utilization [38]. However, Table 1 shows the variables’ measurements and sources.

Table 1.
Description, measurements, and sources of variables.
2.2. Theoretical Framework
Achieving resource efficiency (RCE) in G20 economies requires a multidimensional analytical framework that incorporates educational quality (EDQ), natural resources (NRS), financial inclusion (FIN), green innovation (GRI), and economic complexity (ECC). This framework is grounded in well-established economic and sustainability theories that explain how these variables influence RCE. Human Capital Theory posits that education enhances the productivity and efficiency of individuals by equipping them with knowledge and skills [39]. Within the context of RCE, education plays a dual role: it fosters innovation and sustainable practices but may also lead to increased consumption and demand [40]. This aligns with insights from Endogenous Growth Theory, which emphasizes that long-term economic growth depends on internal factors like human capital and technological progress [41]. Therefore, the effect of EDQ on RCE depends on how well sustainability is embedded into educational curricula and institutional frameworks.
Natural resource management is understood from two opposing perspectives. The Resource Curse Theory argues that an over-reliance on resource extraction may lead to institutional weakness, poor governance, and slower long-term growth [42]. This theory highlights the risk of inefficient and unsustainable resource use, undermining RCE. In contrast, the Resource-Based View (RBV) emphasizes that natural resources, if managed sustainably, can be a source of long-term competitive advantage. Effective governance structures and environmental management systems are essential to convert resource wealth into sustainable development and improve RCE [43,44]. Financial inclusion (FIN) is often linked to economic growth and poverty alleviation [45]. According to the theory of financial intermediation, financial systems allocate capital to productive uses, including green investments [46,47]. However, if misaligned with environmental goals, increased financial access can stimulate excessive consumption, reducing resource efficiency. Therefore, the impact of FIN on RCE is contingent on regulatory frameworks that direct finance toward sustainability-aligned activities. Together, these theories underscore the central premise of this study: improving RCE in G20 countries requires not only investments in education, innovation, and finance but also the strategic governance of natural resources and economic complexity. The integration of these variables into policy and institutional systems determines their collective contribution to sustainable development.
With their advanced technological capabilities, G20 economies are well-positioned to lead in the development and adoption of GRI, thereby increasing their RCE [48,49]. Moreover, ECC, which reflects the diversity and sophistication of a country’s economic activities, is closely linked to RCE. The Economic Complexity Theory clarifies that more complex economies are better able to innovate and optimize resource use, leading to higher levels of efficiency [50,51]. In G20 economies, increased ECC can drive RCE by promoting the development of advanced technologies and industries that are less resource-intensive. This, in turn, contributes to sustainable economic growth and environmental sustainability. The integration of EDQ, NRS, FIN, GRI, and ECC provides a comprehensive framework for understanding and enhancing RCE in G20 economies. These factors are interconnected, and their combined effects can either enhance or hinder RCE depending on how they are managed.
2.3. Methodology
This paper explains the methods that have been chosen to assess the links between NRS, EDQ, FIN, GRI, and ECC with RCE in the eighteen economies of G20 from 2000 to 2022. This study adopts an advanced framework of techniques. However, the lack of data on GRI led to the exclusion of Turkey and the European Union. To guarantee the validity and correctness of the results, this section makes connections between various statistical and econometric techniques. To provide an overview of the dataset, descriptive statistics are presented at the beginning, highlighting the key characteristics of each element. It consists of measures of central tendency (mean, median) and dispersion (standard deviation, range, skewness, kurtosis, Jarque–Bera, probability, and observations), which help in identifying the basic patterns and distribution of the dataset [52]. All statistical analyses were performed using Stata 17 and EViews 12, which facilitated panel data modeling, robustness checks, and diagnostic testing. Mendeley reference management software (desktop version 1.19.1) was used to organize and format citations throughout the manuscript. Equation (1) can then be used for various statistical analyses, including descriptive statistics, to explore the relationships between RCE, NRS, EDQ, FIN, GRI, and ECC. is the intercept of the equation, and are the coefficients that measure the impact of each independent variable on the dependent variable. Similarly, represents the error term, capturing the effects of all other variables not included in the model.
Subsequently, matrix correlation analysis was conducted to assess the strength and direction of the linear relationships between the independent and dependent components. For a correlation matrix where is the dependent variable, the equation used to calculate the correlation between and any independent variable (where could be NRS, EDQ, FIN, GRI, and ECC) is as follows:
where denotes the covariance between and in Equation (2), represents the standard deviation of , and represents the standard deviation of . The associations and potential multicollinearity among factors can be understood by matrix correlation [53]. In this matrix, each entry was calculated using the correlation formula expressed in Equation (3), where and are any pairs of variables from the set . In addition, CSD tests, like the Pesaran CD test, were run on the panel data to find interdependence between the G20 member states. Furthermore, it could guarantee that these interdependencies are considered in subsequent economic simulations, improving the predictability of the outcomes [54]. Likewise, to understand country-specific dynamics and ascertain whether the impacts of the independent factors on RSM differ among G20 economies, slope heterogeneity tests are crucial [55]. The Delta test statistic can be computed as shown in Equation (4), where is the estimated coefficient for unit and where represents the average coefficient across all units. highlights the variance of the coefficient estimates. This statistic follows a chi-square distribution with degrees of freedom, where is the number of cross-sectional units. In contrast, Equation (5) demonstrates the model of Adjusted Delta test in slope heterogeneity test.
is the adjusted variance of the coefficient estimates in Equation (4). Similarly, the Adjusted Delta statistic follows a chi-square distribution with degrees of freedom. Meanwhile, the panel data’s stationarity was measured via the CIPS unit root test. The CIPS test is relevant for confirming that all the factors are integrated in the same order. Stationarity is a prerequisite for reliable econometric analysis [56]. The model for the CIPS unit root can be written as demonstrated in Equation (6), where is the variable of interest, and are parameters, is the coefficient of the lagged variable, and represent the coefficients of differenced terms, denotes the coefficient of the cross-sectional average, and is the error term. Furthermore, the CADF test accounts for cross-sectional dependence when unit roots are examined, providing a more robust check for stationarity [57]. CADF can be utilized with Equation (7), where is the lagged first difference of and where represents any additional covariates or regressors. signifies the autoregressive coefficient, and represents the coefficient for the lagged difference term. shows the coefficient for , and represents the residual term. The flow chart of the approaches applied in the current study is portrayed in Figure 1.
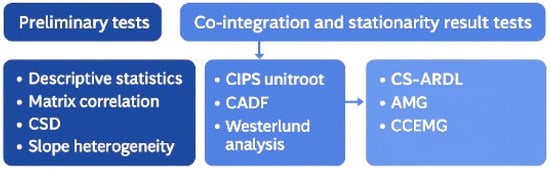
Figure 1.
Flow chart of incorporated techniques.
Additionally, Westerlund cointegration tests were utilized to characterize long-term equilibrium relationships between the parameters. Knowing whether the independent and dependent variables exhibit a steady long-term trend is essential for comprehending relationships that are durable [58]. It is based on the error correction model expressed in Equation (8), where denotes the first difference operator and where is the dependent variable for panel unit at time . Additionally, depicts the independent variable for panel unit at time , and and are the parameters to be estimated. is the error correction term coefficient (which indicates how quickly the variable returns to equilibrium after a deviation), and represents the short-term effect of on . Residual terms are shown by . Likewise, the CS-ARDL approach has been employed to investigate the immediate and long-term effects on RCE of NRS, EDQ, FIN, GRI, and ECC. CS-ARDL is an excellent option for analyzing panel data with a variety of effects since it can manage different lag structures and dynamics that are unique to a certain nation [59]. Traditional panel data estimators such as fixed effects, random effects, or first-difference GMM models often assume slope homogeneity and cross-sectional independence, which are unrealistic in macro-panel settings like the G20, where economies are interconnected and subject to shared global shocks [60].
Furthermore, the CS-ARDL model is particularly suitable for handling mixed order of integration (I(0)/I(1)) variables and cross-sectional dependence through the inclusion of cross-sectional averages [61]. It allows for long-run cointegration relationships while accounting for country-specific dynamics, making it ideal for analyzing sustainability transitions across structurally diverse economies [62]. The Augmented Mean Group (AMG) estimator is employed for robustness as it accounts for unobserved common factors and parameter heterogeneity by augmenting the regression with a common dynamic process. This approach is particularly effective when slope heterogeneity exists across panel units [63]. The Common Correlated Effects Mean Group (CCEMG) estimator further reinforces robustness by explicitly controlling for cross-sectional dependence via cross-sectional averages of the regressors and the dependent variable, making it reliable even when unobserved common shocks affect all units simultaneously [64]. These models complement each other and together offer a robust and nuanced estimation strategy that aligns with the structural and statistical complexities of the dataset, ensuring more reliable and generalizable results.
Equation (9) is suitable for applying CS-ARDL analysis for this investigation, where is the dependent variable for country at time . Likewise, and are the independent variables, and is the country-specific effect. In a similar vein, are the short-term coefficients. captures the long-term equilibrium adjustment. are the long-term coefficients, and is the error term. Moreover, sophisticated approaches of AMG and CCEMG have been leveraged to validate the dependability and correctness of the empirical results derived from CS-ARDL. Additionally, AMG assists in addressing cross-sectional dependence and heterogeneity, offering reliable estimations of the relationships between variables [65]. Nonetheless, the CCEMG estimator accounts for common causes affecting countries in the panel and improves the robustness of the results by considering the effects of unobserved common shocks [66].
Meanwhile, both AMG and CCEMG procedures consider CSD. Equation (10) is the computation of AMG method, where represents resource management for country at time . Similarly, denotes the country-specific intercept. represent the coefficients for the independent components. Additionally, unobserved common factors with heterogeneous factor loadings are expressed by , while represents the error term. In addition, Equation (11) can be used to summarize the CCEMG analysis for current study, where is the common factor for time and where denotes the dependent variable for cross-sectional unit and time . Similarly, represents the independent variables (e.g., , and ), while represents the mean of the independent variables across cross-sectional units for time period . However, combining the AMG and CCEMG estimation methods can offer multiple options for managing parameter variability within units and taking into consideration the time-varying characteristics of regressors. CCEMG can increase panel consistency by using frequent variables that represent cross-sectional dependence, where units, precision, and credibility of projected bonds have a substantial link. These sophisticated methods create insightful policy recommendations and increase the accuracy and efficacy of outcomes by considering both common and distinctive traits.
3. Results
Table 2 presents descriptive statistics for all variables across 414 observations. The mean values indicate the average level of each variable, with RCE having a notably high mean (319.72) compared with the other variables. The standard deviations show significant variability, particularly for RCE and FIN, suggesting wide dispersion around the mean. The skewness and kurtosis values highlight the non-normal distribution of these variables, especially NRS and GRI, which are highly skewed and leptokurtic, indicating extreme values. The Jarque–Bera test confirms that all the variables deviate significantly from a normal distribution (p value = 0.000). Overall, the data suggests substantial variation and non-normality, which may influence the statistical analyses and should be considered when interpreting the results. The maximum and minimum values reveal a broad range within each variable, with RCE and NRS showing particularly large disparities. The median values, which are much lower than the means for RCE and NRS, further suggest the presence of outliers that skew the data. Lastly, the sum and sum of squared deviations provide an aggregate measure, highlighting the overall scale and variability of the data across the 414 observations.
Table 2.
Descriptive statistics.
Table 3 illustrates the correlation matrix between the six variables. RCE has a positive but weak correlation with NRS (0.0958) and EDQ (0.3991), suggesting that higher NRS availability and EDQ are modestly associated with better RCE. However, RCE has a negative correlation with FIN (−0.0774), GRI (−0.2473), and ECC (−0.0286), indicating that these factors may not directly contribute to RCE. Notably, NRS and ECC are positively correlated (0.5005), whereas EDQ and FIN are strongly correlated (0.6067), reflecting significant relationships among the independent variables that could affect their combined influence on RCE. Table 4 presents the results of the CSD test for the variables under study: RCE, NRS, EDQ, FIN, GRI, and ECC. The test statistics, along with their corresponding p values (all 0.000), indicate significant cross-sectional dependence on all the variables. This suggests that the variables are interrelated across the cross-sections, implying that shocks or changes in one country may affect the others within the panel data, making it necessary to account for this dependence on further econometric analyses.
Table 3.
Matrix correlation.
Table 4.
Cross-sectional dependence test.
Table 5 reports the results of the slope heterogeneity test, which assesses whether the relationships between variables differ across the cross-sections in the panel data. The test statistics for both the Delta and Adjusted (Adj.) tests are 0.433 and 0.531, respectively, with p values of 0.000. These results indicate significant slope heterogeneity, suggesting that the impact of the independent variables on the dependent variable varies across countries, highlighting the need for models that allow for different slopes in the analysis.
Table 5.
Slope heterogeneity.
Furthermore, Table 6 encapsulates the outcomes of the CIPS unit root test for all the components. The test examines the stationarity of these variables at levels (I(0)) and after first differencing (I(1)). The aftermath shows that all variables are non-stationary at levels, with test statistics not significant at conventional levels. However, after the first difference, all variables become stationary, as indicated by the highly significant test statistics (denoted by ***). This indicates that the variables are integrated of order one, I(1), meaning that they become stationary after being differenced once, which is a common scenario in time series and panel data analysis.
Table 6.
CIPS unit root.
Table 7 displays the results of the CADF unit root test for all the variables. The test assesses whether these variables are stationary at levels (I (0)) and after first differencing (I (1)). The results indicate that all the variables are non-stationary at levels, as the test statistics are not significant. However, after the first difference, all variables become stationary, as evidenced by the significant test statistics (denoted by ***). This suggests that these variables are integrated into order one, I (1), meaning that they require differencing to achieve stationarity, which is essential for accurate econometric modeling. Additionally, conclusions of the Westerlund cointegration analysis are shown in Table 8, which tests the presence of a long-run relationship among the variables in the panel data.
Table 7.
CADF unit root.
Table 8.
Westerlund cointegration analysis.
Meanwhile, Table 8 reports four test statistics, Gt, Ga, Pt, and Pa, along with their corresponding Z values and p values. The Gt and Pt statistics show significant results, with p values of 0.000, indicating strong evidence of cointegration, meaning that a long-run equilibrium relationship exists among the variables. However, the Ga statistic has a p value of 0.254, which is not significant, suggesting that cointegration may not be consistent across all cross-sections. The Pa statistic also shows significance, with a p value of 0.001, further supporting the presence of a long-run relationship in the panel data, although this relationship might vary across different groups within the panel.
To ensure the validity of our regression estimates under the CS-ARDL framework, we conducted the Durbin-Wu-Hausman (DWH) test to assess potential endogeneity among the key explanatory variables. The test was performed using Stata 17, which employs lagged values of the respective regressors as instruments in a two-stage instrumental variable (IV) regression setup. The DWH test results, summarized in Table 9, reveal that none of the variables exhibit statistically significant endogeneity at conventional levels. Specifically, the p values for all suspected regressors exceed the 0.05 threshold, indicating that we fail to reject the null hypothesis of exogeneity. This outcome confirms that our explanatory variables—including financial development (FIN), environmental innovation (GRI), economic complexity (ECC), human capital development (EDQ), and natural resources (NRS)—can be treated as exogenous within the model. Consequently, the CS-ARDL estimation can be applied without bias arising from endogeneity, reinforcing the robustness and reliability of our findings.
Table 9.
Durbin–Wu–Hausman (DWH) test results.
Table 10 demonstrates the findings of the CS-ARDL analysis with RCE as the dependent variable. The table shows both short-run and long-run estimations. In the short run, NRS has a positive coefficient of 0.1744, which is significant at the 5% level (**), indicating a significant impact on RCE. Conversely, EDQ has a negative coefficient of −0.1529, which is significant at the 5% level (**), suggesting a detrimental effect on RCE. Additionally, FIN has a negative coefficient of −0.1535, which is significant at the 1% level (***), while GRI has a positive coefficient of 0.1770, which is significant at the 1% level (***). Furthermore, ECC has a positive coefficient of 0.1176, which is significant at the 10% level (*). For the long run, NRS has a positive coefficient of 0.1643, which is significant at the 1% level (***); EDQ has a negative coefficient of −0.1026, which is significant at the 1% level (***); FIN has a negative coefficient of −0.1760, which is significant at the 1% level (***); GRI has a positive ratio of 0.1101, which is significant at the 1% level (***); and ECC has a positive link with RCE, with a coefficient of 0.1261, which is significant at the 1% level (***). However, the model has a high R-squared value of 0.95, indicating a strong fit.
Table 10.
CS-ARDL analysis (CCE: dependent variable).
Furthermore, Figure 2 displays the trends of resource efficiency (RCE) across G20 countries from 2010--2022, revealing considerable variation in performance. Countries such as Canada and Russia show persistently high RCE levels, which aligns with the positive impact of natural resources (NRS) found in the CS-ARDL results—indicating effective resource management. Likewise, Germany and France maintain strong RCE trends, which is consistent with the positive role of economic complexity (ECC) and green innovation (GRI) in driving efficiency. Emerging economies like China and India demonstrate gradual improvements in RCE over time, reinforcing the positive association of educational quality (EDQ) and GRI identified in the model and suggesting that investments in human capital and innovation are beginning to yield sustainability gains. Conversely, countries such as Argentina and South Africa exhibit stagnant or declining RCE, reflecting challenges that may stem from inefficient financial allocation—which is consistent with the negative relationship between financial inclusion (FIN) and RCE observed in the regression results. Overall, the visual trends in Figure 2 complement the empirical findings, emphasizing the differentiated progress of G20 countries toward achieving resource efficiency and the importance of aligning financial, educational, and innovation policies with sustainability goals.
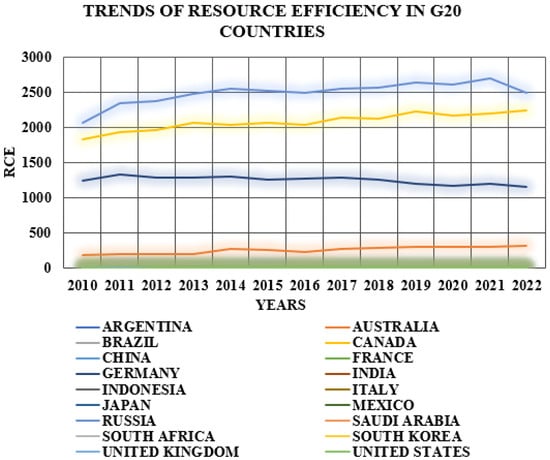
Figure 2.
Demonstration of trends in RCE in G20 nations from 2010 to 2022.
Moreover, the trends of natural resource rents (NRSs) in G20 countries from 2015 to 2022, illustrated in Figure 3, reveal notable fluctuations that align with both resource endowments and national economic strategies. Countries such as Australia, Brazil, and Saudi Arabia exhibit a sustained increase in NRS, which is consistent with the resource abundance hypothesis and suggests that economies rich in natural resources often depend heavily on extractive sectors for growth. This reliance, while economically beneficial in the short run, may hinder diversification and long-term sustainability unless accompanied by strong governance frameworks. Conversely, France and Germany consistently show low levels of NRS, reflecting their post-industrial, innovation-driven economies and successful transition toward less resource-intensive growth models—supporting the decoupling hypothesis, which emphasizes breaking the link between economic output and resource use. Countries like Russia and Indonesia demonstrate a volatile pattern with peaks and troughs in NRS, potentially indicative of commodity price fluctuations, shifts in global demand, or domestic policy adjustments in resource extraction and trade. These patterns underscore the heterogeneity of G20 economies in terms of resource dependence and management approaches. Integrating these insights with broader sustainability theories, the data suggest that long-term improvements in resource efficiency (RCE) require not only technological and economic reforms but also differentiated governance strategies that reflect each country’s resource profile and development trajectory.
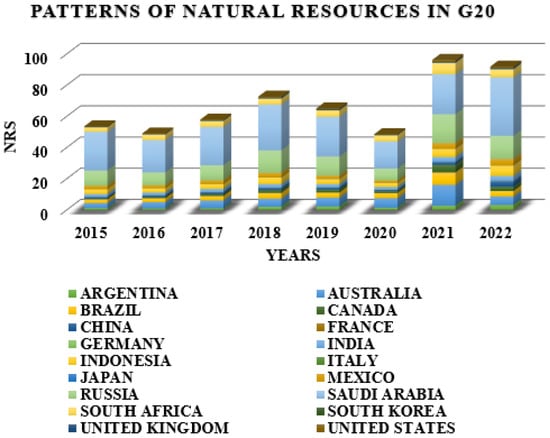
Figure 3.
A graphical representation of the NRS trajectories for the G20 territories from 2015 to 2022.
Moreover, the trend of ECC in G20 nations from 2015 to 2022 is relatively stable in some countries like Japan and Germany (as demonstrated in Figure 4), which maintains consistently high complexity. On the other hand, countries like Argentina, Brazil, and Russia exhibit fluctuations, with slight improvements over the years. Meanwhile, emerging economies such as India and China have shown gradual increases in complexity, reflecting their growing industrial diversification and integration into global value chains. Thus, by synthesizing the discussed factors, this paper aims to provide a comprehensive analysis of how EDQ, NRS, FIN, GRI, and ECC interact to shape RCE in G20 nations. The findings aim to offer actionable policy recommendations to guide G20 countries toward more effective and sustainable RCE.

Figure 4.
Patterns of ECC in G20 countries from 2015 to 2022.
In addition, GRI, which consists of the development and implementation of technologies and practices that reduce environmental impact, is essential for achieving RCE. In the context of RCE, GRI can lead to significant reductions in resource use and waste, contributing to more sustainable production processes [67]. In 2022, the GRI in the G20 nations exhibited significant variation (as shown in Figure 5). Argentina and Saudi Arabia stand out for their particularly high percentages of green innovation (GRI), which may reflect targeted national strategies. Saudi Arabia’s high GRI aligns with Vision 2030, which prioritizes investment in renewable energy and environmental technology to diversify its oil-dependent economy [68]. Similarly, Argentina has shown increased commitment to sustainable innovation through policies promoting clean technology and renewable energy sectors [69]. In contrast, Indonesia and Germany display relatively lower GRI values. Indonesia’s performance may be constrained by limited institutional capacity, low R&D expenditure, and reliance on fossil fuels [70]. Although Germany is globally recognized for its environmental leadership, its innovation efforts may focus more on incremental improvements or cross-border partnerships, which may not be fully captured by domestic patent-based indicators [71]. These differences underscore the role of national policy orientation, institutional frameworks, and innovation measurement methods in shaping GRI across G20 economies.
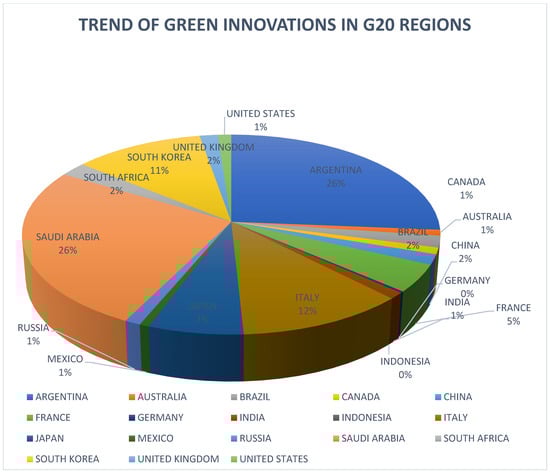
Figure 5.
GRI developments within G20 nations in 2022.
Furthermore, Table 11 presents the results of the AMG robustness analysis. The coefficients indicate the impact of various variables on RCE, with statistical significance denoted by asterisks. NRS has a positive and significant effect (0.1269 ***) on the dependent variable. EDQ and FIN exhibit negative and significant effects (−0.1106 *** and −0.1309 **, respectively). Additionally, GRI has a positive and significant effect (0.1213***). Nevertheless, ECC positively influences the dependent variable with a significant coefficient (0.1731 ***). The constant term (_CONS) is significantly positive (12.43 ***).
Table 11.
AMG robustness analysis.
Moreover, Table 12 shows the CCEMG results. NRS has a significant positive effect (0.1340 **). EDQ and FIN have significant negative effects (−0.1273 ** and −0.0033 **, respectively). GRI has a positive significant effect (0.1787 ***). ECC also has a positive significant effect (0.1189 ***). The constant is positive and significant (1.658 **). This study’s findings are visually summarized in Figure 6, which illustrates that all variables—except financial inclusion (FIN)—exhibit a positive relationship with resource efficiency (RCE).
Table 12.
CCEMG robustness analysis.
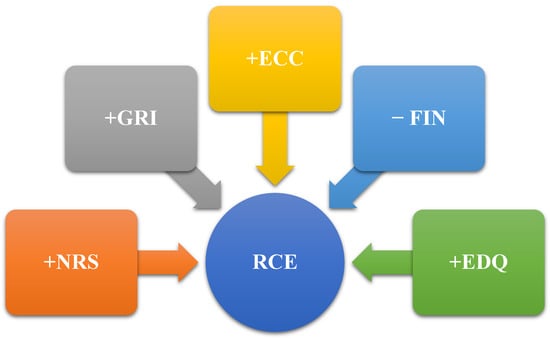
Figure 6.
Illustration of the positive and negative correlations between the independent and dependent variables.
4. Discussions
The empirical findings derived from CS-ARDL, further supported by AMG and CCEMG estimators, reveal significant short-run and long-run relationships between the selected drivers—natural resources (NRSs), educational quality (EDQ), financial inclusion (FIN), green innovation (GRI), economic complexity (ECC), and resource efficiency (RCE)—in G20 economies from 2000 to 2022. The consistency and statistical robustness of the results across models enhance the credibility of these associations and provide valuable insights into the structural dynamics of sustainability in advanced and emerging economies. In line with the Resource-Based View, the positive association of natural resources (NRS) with RCE suggests that G20 countries are, to a certain extent, leveraging their resource wealth to support efficiency gains. This may reflect improved governance, environmental regulation, and the reinvestment of resource revenues into sustainable practices. In contrast to the Resource Curse Theory, which predicts inefficiency and stagnation from resource dependency, the findings imply that many G20 nations may have successfully implemented institutional mechanisms to convert resource wealth into sustainable outcomes. This is consistent with findings by [72,73], who report a positive link between resource governance and sustainability indicators.
The positive impact of green innovation (GRI) on RCE supports both Endogenous Growth Theory and empirical research, which argue that innovation is a crucial driver of long-term economic and environmental performance. GRI contributes directly to the development of cleaner technologies and more efficient production processes, reducing waste and lowering environmental intensity. For G20 economies, which possess advanced innovation systems and higher R&D capacity, this finding emphasizes the importance of sustaining and scaling green technological progress as a lever for improving resource efficiency and achieving climate targets. Similarly, the positive relationship of economic complexity (ECC) with RCE aligns with the view that economic diversification and structural sophistication promote more efficient use of inputs and enable a shift toward low-carbon, high-value industries. This finding supports insights from the Resource-Based View and studies like [74], which find that complexity enables nations to adopt sustainable production models. For G20 economies—many of which lead in global value chains—this suggests that fostering complex and diversified industrial structures can yield both economic and environmental dividends.
Furthermore, the findings reveal a positive association between educational quality (EDQ) and RCE, which aligns with conventional expectations under Human Capital Theory and Endogenous Growth Theory. Both theories posit that education enhances productive efficiency by equipping individuals with knowledge and skills that foster innovation and better decision making. This result is also consistent with those of previous studies, such as [75,76], which highlight that improved education contributes to greater environmental awareness and more efficient resource use. The observed positive relationship in G20 countries suggests that investments in human capital, when aligned with sustainability-oriented curricula and policies, can significantly enhance resource efficiency. This further underscores the importance of integrating environmental literacy, critical thinking, and systems thinking across educational institutions to prepare the workforce for sustainable development challenges.
However, financial inclusion (FIN) has a negative relationship with RCE, suggesting that greater financial access may not necessarily translate into sustainability-oriented behavior. This finding runs counter to that of [77,78], who associated FIN with poverty reduction and inclusive growth. However, it aligns with concerns raised in the Theory of Financial Intermediation, which warns that, in the absence of regulation, financing can be misallocated. In the context of G20 economies, this could imply that financial resources are being directed toward consumption or carbon-intensive sectors rather than toward green investments. Ref. [79] also highlights this risk, arguing that financial systems must be intentionally guided to support sustainable development goals. The result thus calls for stronger financial governance, incentive mechanisms, and green conditionality within financial markets. Overall, these results offer both affirmation and reflection. The high R-squared values and consistent significance levels across models reinforce the robustness of the explanatory variables in capturing RCE dynamics in G20 nations. Moreover, by comparing empirical evidence with established theories and previous empirical findings, this study provides a balanced and multidimensional understanding of the interplay between economic complexity, innovation, finance, education, and resource use. These relationships are particularly important for the G20 economies, as they collectively account for the majority of global resource consumption and emissions. Enhancing RCE in these nations is crucial not only for national development but also for global sustainability.
This study has several limitations that should be acknowledged. First, it relies on a limited set of explanatory variables and does not capture all potential factors influencing resource efficiency. Second, the analysis is confined to the period from 2000 to 2022 and does not account for recent policy shifts or emerging environmental challenges. Third, the empirical findings depend on the availability and quality of secondary data, which may affect the robustness and completeness of the conclusions. Finally, although advanced panel estimation techniques were employed, the models may not fully capture complex interdependencies or nonlinear dynamics between variables.
5. Conclusions and Policy Recommendations
This study investigates the short-term and long-term associations between natural resources (NRS), human capital (EDQ), financial development (FIN), green innovation (GRI), and economic complexity (ECC) with resource efficiency (RCE) in G20 economies over the period 2000–2022. Employing the advanced CS-ARDL approach, which is supported by AMG and CCEMG estimators for robustness, the findings indicate that NRS, ECC, and GRI are positively associated with RCE in both the short and long run. In contrast, EDQ and FIN demonstrate a negative relationship with RCE across most specifications. While these relationships are statistically significant and robust across estimation techniques, it is important to acknowledge that this study is based on observational data and does not establish strict causal linkages. Thus, the interpretations and policy recommendations derived from these findings are indicative rather than determinative and should be viewed as insights for guiding further empirical and policy inquiry rather than direct cause-effect assertions. The consistency of results across estimation techniques suggests that enhancing green innovation, optimizing natural resource management, and deepening economic complexity may contribute to improved RCE, provided that appropriate institutional and policy frameworks are in place. Conversely, the observed negative associations with EDQ and FIN suggest the need for more targeted investments and strategic alignment within these domains to ensure that they support sustainability objectives.
Based on the empirical findings, while recognizing that the relationships identified are correlational rather than strictly causal, several policy directions can be cautiously recommended to increase resource efficiency (RCE) in G20 economies. As natural resources (NRSs), human capital development (EDQ), green innovation (GRI), and economic complexity (ECC) are positively associated with RCE, they represent critical levers for advancing sustainability. On the other hand, the observed negative relationship between financial development (FIN) and RCE suggests that financial flows may currently be misaligned with environmental priorities. The following are the proposed policy recommendations:
- As NRSs are positively associated with RCE, their use should be guided by sustainable extraction and reinvestment strategies, emphasizing the development of green technologies and the promotion of circular economy practices.
- Since EDQ has a positive effect on RCE, educational systems, especially in science, technology, engineering, and environmental studies, should be strengthened to build skills aligned with sustainable development goals and the needs of green industries.
- As GRI contributes positively to RCE, governments should incentivize research and development in eco-friendly technologies and provide support to firms engaging in resource-efficient innovations.
- Given that ECC enhances RCE, economic policies should promote structural diversification toward knowledge-intensive and sustainable sectors, reducing dependence on resource-heavy industries.
- Because FIN is negatively associated with RCE, financial institutions and regulatory bodies should revise existing frameworks to redirect credit and investment flows toward green projects, using sustainability-linked instruments and conditional lending mechanisms.
- As sustainability outcomes depend on integrated planning, fiscal policies should include green budgeting practices, and governance institutions should ensure environmental accountability in both the public and private sectors.
- In line with SDG 17, G20 countries should deepen international cooperation, share knowledge, and align policies that support inclusive, low-carbon economic transformation on a global scale.
Future studies are encouraged to expand the analytical framework by incorporating a broader range of socio-economic and environmental variables. Employing more granular data—such as sector-specific or regional-level observations—can provide deeper insights into context-specific drivers of resource efficiency. Researchers should also explore the use of more advanced or nonlinear econometric techniques to uncover dynamic interactions that may have been overlooked in this study. Extending the time frame and integrating more recent data can help capture the evolving impact of global policy responses, technological shifts, and sustainability investments. Finally, evaluating the real-world outcomes of specific educational, financial, and innovation-related policies will strengthen the evidence base for effective decision making.
Author Contributions
Conceptualization, S.L.; methodology, A.P.; software, S.L.; validation, A.P.; formal analysis, S.L.; investigation, S.L.; resources, S.L.; data curation, A.P.; writing—original draft preparation, A.P.; writing—review and editing, A.P. and S.L.; visualization, S.L.; supervision, S.L.; project administration, S.L. All authors have read and agreed to the published version of the manuscript.
Funding
This research received no external funding.
Institutional Review Board Statement
Not applicable.
Informed Consent Statement
Not applicable.
Data Availability Statement
Data will be available upon request.
Conflicts of Interest
The authors declare no conflicts of interest.
Abbreviations
| RCE | Resource Efficiency |
| NRS | Natural Resources |
| EDQ | Educational Quality |
| FIN | Financial Inclusion |
| GRI | Green Innovation |
| ECC | Economic Complexity |
| CS-ARDL | Cross-Sectional Autoregressive Distributed Lag |
| AMG | Augmented Mean Group |
| CCEMG | Common Correlated Effects Mean Group |
| SDGs | Sustainable Development Goals |
References
- Xu, J.; She, S.; Gao, P.; Sun, Y. Role of Green Finance in Resource Efficiency and Green Economic Growth. Resour. Policy 2023, 81, 103349. [Google Scholar] [CrossRef]
- Li, D.; Ortegas, K.D.; White, M. Exploring the Computational Effects of Advanced Deep Neural Networks on Logical and Activity Learning for Enhanced Thinking Skills. Systems 2023, 11, 319. [Google Scholar] [CrossRef]
- Trinh, H.H.; Sharma, G.D.; Tiwari, A.K.; Vo, D.T.H. Examining the Heterogeneity of Financial Development in the Energy-Environment Nexus in the Era of Climate Change: Novel Evidence around the World. Energy Econ. 2022, 116, 106415. [Google Scholar] [CrossRef]
- Mao, F.; Yuan, Y.; Zhang, F. Firm-Level Perception of Uncertainty, Risk Aversion, and Corporate Real Estate Investment: Evidence from China’s Listed Firms. Econ. Anal. Policy 2025, 85, 1428–1441. [Google Scholar] [CrossRef]
- Kedir, F.; Hall, D.M. Resource Efficiency in Industrialized Housing Construction—A Systematic Review of Current Performance and Future Opportunities. J. Clean. Prod. 2021, 286, 125443. [Google Scholar] [CrossRef]
- Cai, X.; Xiang, H.; Akbari, F. Integrated Sustainability Perspective to Interconnect Circular Economy, Environmental Development, and Social Status: Designation of Sustainable Development Spillovers. Socioecon. Plann. Sci. 2025, 101, 102253. [Google Scholar] [CrossRef]
- Lin, Y.; Mahmood, M.A.; Meng, W.; Ali, Q. Green Economy Transition in Asia Pacific: A Holistic Assessment of Renewable Energy Production. J. Clean. Prod. 2024, 437, 140648. [Google Scholar] [CrossRef]
- Xing, W.; Imran, A. Financial and Technological Drivers of Sustainable Development: The Role of Communication Technology, Financial Efficiency and Education in BRICS. Sustainability 2025, 17, 2326. [Google Scholar] [CrossRef]
- Dam, M.M.; Kaya, F.; Bekun, F.V. How Does Technological Innovation Affect the Ecological Footprint? Evidence from E-7 Countries in the Background of the SDGs. J. Clean. Prod. 2024, 443, 141020. [Google Scholar] [CrossRef]
- Li, D.; Zhang, M.; Zhou, S.; Yu, X. Structural Equation Modeling and Validation of Virtual Learning Community Constructs Based on the Chinese Evidence. Interact. Learn. Environ. 2025, 36, 1–16. [Google Scholar] [CrossRef]
- Zhou, G.; Xu, H.; Jiang, C.; Deng, S.; Chen, L.; Zhang, Z. Has the Digital Economy Improved the Urban Land Green Use Efficiency? Evidence from the National Big Data Comprehensive Pilot Zone Policy. Land 2024, 13, 960. [Google Scholar] [CrossRef]
- Xu, A.; Dai, Y.; Hu, Z.; Qiu, K. Can Green Finance Policy Promote Inclusive Green Growth?—Based on the Quasi-Natural Experiment of China’s Green Finance Reform and Innovation Pilot Zone. Int. Rev. Econ. Financ. 2025, 100, 104090. [Google Scholar] [CrossRef]
- Gozman, D.; Liebenau, J.; Mangan, J. The Innovation Mechanisms of Fintech Start-Ups: Insights from SWIFT’s Innotribe Competition. J. Manag. Inf. Syst. 2018, 35, 145–179. [Google Scholar] [CrossRef]
- Guliyev, H. Determinants of Ecological Footprint in European Countries: Fresh Insight from Bayesian Model Averaging for Panel Data Analysis. Sci. Total Environ. 2024, 912, 169455. [Google Scholar] [CrossRef]
- Yang, X.; Chen, J.; Li, D.; Li, R. Functional-Coefficient Quantile Regression for Panel Data with Latent Group Structure. J. Bus. Econ. Stat. 2024, 42, 1026–1040. [Google Scholar] [CrossRef]
- Arilla-Llorente, R.; Gavurova, B.; Rigelsky, M.; Ribeiro-Soriano, D. Quantifying the Dynamics of Relationships between Eco-Innovations and SDG 8. Energy Econ. 2024, 130, 107280. [Google Scholar] [CrossRef]
- Liu, S.; Chen, Y.; Yang, D.; Zhao, C. How Does Knowledge Sharing Create Business Value in the Supply Chain Platform Ecosystem? Unveiling Its Mediating Role in Governance Mechanisms. J. Knowl. Manag. 2025, 55, 1367–3270. [Google Scholar] [CrossRef]
- Cheng, X.; Yao, D.; Qian, Y.; Wang, B.; Zhang, D. How Does Fintech Influence Carbon Emissions: Evidence from China’s Prefecture-Level Cities. Int. Rev. Financ. Anal. 2023, 87, 102655. [Google Scholar] [CrossRef]
- Craiut, L.; Bungau, C.; Negru, P.A.; Bungau, T.; Radu, A.F. Technology Transfer in the Context of Sustainable Development—A Bibliometric Analysis of Publications in the Field. Sustainability 2022, 14, 11973. [Google Scholar] [CrossRef]
- Xiao, Y.; Pan, L. Disseminating Sustainable Development Education in English Language through Individuals Learning Capabilities and Institutional Infrastructural Initiatives. Econ. Res. Istraz. 2022, 35, 6667–6687. [Google Scholar] [CrossRef]
- Liu, K.; Luo, J.; Faridi, M.Z.; Nazar, R.; Ali, S. Green Shoots in Uncertain Times: Decoding the Asymmetric Nexus between Monetary Policy Uncertainty and Renewable Energy. Energy Amp Environ. 2025, 47, 105–237. [Google Scholar] [CrossRef]
- Zuo, S.; Zhao, Y.; Zheng, L.; Zhao, Z.; Fan, S.; Wang, J. Assessing the Influence of the Digital Economy on Carbon Emissions: Evidence at the Global Level. Sci. Total Environ. 2024, 946, 174242. [Google Scholar] [CrossRef] [PubMed]
- Świader, M.; Szewrański, S.; Kazak, J.K.; van Hoof, J.; Lin, D.; Wackernagel, M.; Alves, A. Application of Ecological Footprint Accounting as a Part of an Integrated Assessment of Environmental Carrying Capacity: A Case Study of the Footprint of Food of a Large City. Resources 2018, 7, 52. [Google Scholar] [CrossRef]
- Wang, H.; Ciais, P.; Sitch, S.; Green, J.K.; Tao, S.; Fu, Z.; Albergel, C.; Bastos, A.; Wang, M.; Fawcett, D.; et al. Anthropogenic Disturbance Exacerbates Resilience Loss in the Amazon Rainforests. Glob. Change Biol. 2024, 30, e17006. [Google Scholar] [CrossRef]
- Pata, U.K. Linking Renewable Energy, Globalization, Agriculture, CO2 Emissions and Ecological Footprint in BRIC Countries: A Sustainability Perspective. Renew. Energy 2021, 173, 197–208. [Google Scholar] [CrossRef]
- Saqib, N.; Duran, I.A.; Ozturk, I. Unraveling the Interrelationship of Digitalization, Renewable Energy, and Ecological Footprints within the EKC Framework: Empirical Insights from the United States. Sustainability 2023, 15, 10663. [Google Scholar] [CrossRef]
- Huang, J. Resources, Innovation, Globalization, and Green Growth: The BRICS Financial Development Strategy. Geosci. Front. 2024, 15, 101741. [Google Scholar] [CrossRef]
- Sharma, G.D.; Tiwari, A.K.; Erkut, B.; Mundi, H.S. Exploring the Nexus between Non-Renewable and Renewable Energy Consumptions and Economic Development: Evidence from Panel Estimations. Renew. Sustain. Energy Rev. 2021, 146, 111152. [Google Scholar] [CrossRef]
- Zhou, F.; Bin Samsurijan, M.S.; Ibrahim, R.L.; Al-Faryan, M.A.S. An Assessment of the Aggregated and Disaggregated Effects of Natural Resources Rents on Environmental Sustainability in BRICS Economies. Int. J. Sustain. Dev. World Ecol. 2024, 31, 375–394. [Google Scholar] [CrossRef]
- Usman, A.; Ozturk, I.; Naqvi, S.M.M.A.; Ullah, S.; Javed, M.I. Revealing the Nexus between Nuclear Energy and Ecological Footprint in STIRPAT Model of Advanced Economies: Fresh Evidence from Novel CS-ARDL Model. Prog. Nucl. Energy 2022, 148, 104220. [Google Scholar] [CrossRef]
- Kutlar, A.; Gulmez, A.; Kabasakal, A.; Kutlar, S. Ecological Footprint, Energy Usage, and Economic Progress Relationship: The MINT Countries. Econ. Res.Ekon. Istraživanja 2022, 35, 4457–4480. [Google Scholar] [CrossRef]
- Shahzad, U.; Ferraz, D.; Nguyen, H.H.; Cui, L. Investigating the Spill Overs and Connectedness between Financial Globalization, High-Tech Industries and Environmental Footprints: Fresh Evidence in Context of China. Technol. Forecast. Soc. Change 2022, 174, 121205. [Google Scholar] [CrossRef]
- Craiut, L.; Bungau, C.; Bungau, T.; Grava, C.; Otrisal, P.; Radu, A.F. Technology Transfer, Sustainability, and Development, Worldwide and in Romania. Sustainability 2022, 14, 15728. [Google Scholar] [CrossRef]
- Khan, I.; Hou, F.; Zakari, A.; Tawiah, V.K. The Dynamic Links among Energy Transitions, Energy Consumption, and Sustainable Economic Growth: A Novel Framework for IEA Countries. Energy 2021, 222, 119935. [Google Scholar] [CrossRef]
- Afshan, S.; Ozturk, I.; Yaqoob, T. Facilitating Renewable Energy Transition, Ecological Innovations and Stringent Environmental Policies to Improve Ecological Sustainability: Evidence from MM-QR Method. Renew. Energy 2022, 196, 151–160. [Google Scholar] [CrossRef]
- Qin, F.; Imran, A. Greening the Gulf: A Deep-Dive into the Synergy Between Natural Resources, Institutional Quality, Foreign Direct Investment, and Pathways to Environmental Sustainability. Sustainability 2024, 16, 11250. [Google Scholar] [CrossRef]
- Wang, Y.; Zhang, X.; Lin, F.; Peng, M. The Role of Digital Governance on Carbon Emission Performance: Evidence from the Cities in Yangtze River Delta, China. Environ. Res. Commun. 2023, 5, 085013. [Google Scholar] [CrossRef]
- Miao, C.; Fang, D.; Sun, L.; Luo, Q. Natural Resources Utilization Efficiency under the Influence of Green Technological Innovation. Resour. Conserv. Recycl. 2017, 126, 153–161. [Google Scholar] [CrossRef]
- Munawar, S.; Yousaf, D.H.Q.; Ahmed, M.; Rehman, D.S. Effects of Green Human Resource Management on Green Innovation through Green Human Capital, Environmental Knowledge, and Managerial Environmental Concern. J. Hosp. Tour. Manag. 2022, 52, 141–150. [Google Scholar] [CrossRef]
- Miah, M.T.; Lakner, Z.; Fekete-Farkas, M. Addressing Poverty through Social Entrepreneurship for Sustainable Development: A Comprehensive Bibliometric Analysis. Adm. Sci. 2024, 14, 16. [Google Scholar] [CrossRef]
- Bayarçelik, E.B.; Taşel, F. Research and Development: Source of Economic Growth. Procedia Soc. Behav. Sci. 2012, 58, 744–753. [Google Scholar] [CrossRef]
- Tara, N.; Ahmad, Z. Socioemotional Wealth a Blessing or Curse in the Context of Management Accounting Practices (MAPS) in Family Businesses. IUB J. Soc. Sci. 2022, 4, 62–74. [Google Scholar] [CrossRef]
- Shahzad, M.; Qu, Y.; Zafar, A.U.; Rehman, S.U.; Islam, T. Exploring the Influence of Knowledge Management Process on Corporate Sustainable Performance through Green Innovation. J. Knowl. Manag. 2020, 24, 2079–2106. [Google Scholar] [CrossRef]
- Liu, T.; Imran, A. Green Economy Advancement: Evaluating the Role of Digitalization, Technological Innovation, and Natural Resources in Shaping Environmental Quality Amid Globalizations. Sustainability 2024, 16, 10673. [Google Scholar] [CrossRef]
- Taghizadeh-Hesary, F.; Zakari, A.; Yoshino, N.; Khan, I. Leveraging on Energy Security to Alleviate Poverty in Asian Economies. Singap. Econ. Rev. 2023, 68, 1063–1090. [Google Scholar] [CrossRef]
- Zhang, Y.J. The Impact of Financial Development on Carbon Emissions: An Empirical Analysis in China. Energy Policy 2011, 39, 2197–2203. [Google Scholar] [CrossRef]
- Li, J.; Imran, A. Sustainable Transitions: Navigating Green Technologies, Clean Energy, Economic Growth, and Human Capital for a Greener Future. Sustainability 2025, 17, 3446. [Google Scholar] [CrossRef]
- Shah, W.U.H.; Hao, G.; Yan, H.; Yasmeen, R.; Xu, X. Natural Resources Utilization Efficiency Evaluation, Determinant of Productivity Change, and Production Technology Heterogeneity across Developed and Developing G20 Economies. Technol. Soc. 2024, 77, 102507. [Google Scholar] [CrossRef]
- Mehmood, U.; Imran, A.; Abid, A.; Tariq, S.; Haq, Z.U.; Mazhar, R.; Daud, A.; Mahmood, K.; Iqbal, M.; Batool, A. Nexus between Greenhouse Gas Emissions, Energy Use and Economic Growth: Empirical Evidence From South Asian Countries. Pol. J. Environ. Stud. 2022, 31, 763–770. [Google Scholar] [CrossRef]
- Joof, F.; Samour, A.; Ali, M.; Abdur Rehman, M.; Tursoy, T. Economic Complexity, Renewable Energy and Ecological Footprint: The Role of the Housing Market in the USA. Energy Build. 2024, 311, 114131. [Google Scholar] [CrossRef]
- Li, Y.; Wang, X.; Imran, A.; Aslam, M.U.; Mehmood, U. Analyzing the Contribution of Renewable Energy and Natural Resources for Sustainability in G-20 Countries: How Gross Capital Formation Impacts Ecological Footprints. Heliyon 2023, 9, e18882. [Google Scholar] [CrossRef] [PubMed]
- Carfora, A.; Pansini, R.V.; Scandurra, G. Energy Dependence, Renewable Energy Generation and Import Demand: Are EU Countries Resilient? Renew. Energy 2022, 195, 1262–1274. [Google Scholar] [CrossRef]
- Arellano, M.; Bover, O. Another Look at the Instrumental Variable Estimation of Error-Components Models. J. Econom. 1995, 68, 29–51. [Google Scholar] [CrossRef]
- Rudolph, A.; Figge, L. Determinants of Ecological Footprints: What Is the Role of Globalization? Ecol. Indic. 2017, 81, 348–361. [Google Scholar] [CrossRef]
- Nassef, A.M.; Olabi, A.G.; Rezk, H.; Abdelkareem, M.A. Application of Artificial Intelligence to Predict CO2 Emissions: Critical Step towards Sustainable Environment. Sustainability 2023, 15, 7648. [Google Scholar] [CrossRef]
- Pesaran, M.H. A Simple Panel Unit Root Test in the Presence of Cross-Section Dependence. J. Appl. Econom. 2007, 22, 265–312. [Google Scholar] [CrossRef]
- Nasrin, N.; Haider, M.Z.; Ahsan, M.N. Well-Being Effect of International Migration and Remittance on Human and Gender Development in South Asian Countries. PLoS ONE 2024, 19, e0300597. [Google Scholar] [CrossRef]
- Ghosh, S.; Adebayo, T.S.; Abbas, S.; Doğan, B.; Sarkodie, S.A. Harnessing the Roles of Renewable Energy, High Tech Industries, and Financial Globalization for Environmental Sustainability: Evidence from Newly Industrialized Economies. Nat. Resour. Forum 2023, 48, 1186–1207. [Google Scholar] [CrossRef]
- Zeraibi, A.; Balsalobre-Lorente, D.; Murshed, M. The Influences of Renewable Electricity Generation, Technological Innovation, Financial Development, and Economic Growth on Ecological Footprints in ASEAN-5 Countries. Env. Sci. Pollut. Res. 2021, 28, 51003–51021. [Google Scholar] [CrossRef]
- Trinugroho, I.; Law, S.H.; Lee, W.C.; Wiwoho, J.; Sergi, B.S. Effect of Financial Development on Innovation: Roles of Market Institutions. Econ. Model. 2021, 103, 105598. [Google Scholar] [CrossRef]
- Hussain, M.; Dogan, E. The Role of Institutional Quality and Environment-Related Technologies in Environmental Degradation for BRICS. J. Clean. Prod. 2021, 304, 127059. [Google Scholar] [CrossRef]
- Abou Houran, M.; Mehmood, U. How Institutional Quality and Renewable Energy Interact with Ecological Footprints: Do the Human Capital and Economic Complexity Matter in the Next Eleven Nations? Environ. Sci. Pollut. Res. 2023, 1, 1–13. [Google Scholar] [CrossRef] [PubMed]
- Nathaniel, S.; Khan, S.A.R. The Nexus between Urbanization, Renewable Energy, Trade, and Ecological Footprint in ASEAN Countries. J. Clean. Prod. 2020, 272, 122709. [Google Scholar] [CrossRef]
- Bosah, P.C.; Li, S.; Ampofo, G.K.M. Natural Resource Rents and Financial Inclusion Nexus: Evidence from Africa. Resour. Policy 2024, 94, 105134. [Google Scholar] [CrossRef]
- Ibrahim, R.L.; Ajide, K.B. The Dynamic Heterogeneosus Impacts of Nonrenewable Energy, Trade Openness, Total Natural Resource Rents, Financial Development and Regulatory Quality on Environmental Quality: Evidence from BRICS Economies. Resour. Policy 2021, 74, 102251. [Google Scholar] [CrossRef]
- Li, K.; Cui, G.; Lu, L. Efficient Estimation of Heterogeneous Coefficients in Panel Data Models with Common Shocks. J. Econom. 2020, 216, 327–353. [Google Scholar] [CrossRef]
- Ahmad, A.; Yadav, A.K.; Singh, A.; Singh, D.K. A Comprehensive Machine Learning-Coupled Response Surface Methodology Approach for Predictive Modeling and Optimization of Biogas Potential in Anaerobic Co-Digestion of Organic Waste. Biomass Bioenergy 2024, 180, 106995. [Google Scholar] [CrossRef]
- Asif, M.; Muneer, T. Energy Supply, Its Demand and Security Issues for Developed and Emerging Economies. Renew. Sustain. Energy Rev. 2007, 11, 1388–1413. [Google Scholar] [CrossRef]
- Chandra Voumik, L.; Ridwan, M. Impact of FDI, Industrialization, and Education on the Environment in Argentina: ARDL Approach. Heliyon 2023, 9, e12872. [Google Scholar] [CrossRef]
- Chovancová, J.; Zambrano-Monserrate, M.A.; Bergougui, B.; Ahakwa, I.; Dam, M.M. Global Determinants of Methane Emissions in OECD Countries: A Dynamic Panel Approach. Res. Glob. 2024, 9, 100232. [Google Scholar] [CrossRef]
- Sun, H.; Edziah, B.K.; Kporsu, A.K.; Sarkodie, S.A.; Taghizadeh-Hesary, F. Energy Efficiency: The Role of Technological Innovation and Knowledge Spillover. Technol. Forecast. Soc. Change 2021, 167, 120659. [Google Scholar] [CrossRef]
- Guliman, S.D.O. The Role of Entrepreneur’s Financial Sophistication on the Nexus of Business Strategy and Sustainability Indicators of Philippine Microenterprises. Asia Pac. Soc. Sci. Rev. 2020, 20, 11. [Google Scholar] [CrossRef]
- Liu, C.; Yang, H. Waste to Energy Closed-Loop Supply Chain: Recycling Energy Supply, Collaborative Operation and Sustainability. Nongye Gongcheng Xuebao Trans. Chin. Soc. Agric. Eng. 2021, 37, 182. [Google Scholar] [CrossRef]
- Gerhart, B.; Feng, J. The Resource-Based View of the Firm, Human Resources, and Human Capital: Progress and Prospects. J. Manage. 2021, 47, 1796–1819. [Google Scholar] [CrossRef]
- Carlbäck, M.; Nygren, T.; Hägglund, P. Human Resource Development in Restaurants in Western Sweden–A Human Capital Theory Perspective. J. Hum. Resour. Hosp. Tour. 2024, 23, 289–314. [Google Scholar] [CrossRef]
- Yanke, A.; Zendrato, N.E.; Soleh, A.M. Handling Multicollinearity Problems in Indonesia’s Economic Growth Regression Modeling Based on Endogenous Economic Growth Theory. Indones. J. Stat. Its Appl. 2022, 6, 228–244. [Google Scholar] [CrossRef]
- Gunawan, A.; Jufrizen; Pulungan, D.R. Improving MSME Performance through Financial Literacy, Financial Technology, and Financial Inclusion. Int. J. Appl. Econ. Financ. Account. 2023, 15, 39–52. [Google Scholar] [CrossRef]
- Malik, A.H.; Isa, A.H.b.M.; bin Jais, M.; Rehman, A.U.; Khan, M.A. Financial Stability of Asian Nations: Governance Quality and Financial Inclusion. Borsa Istanb. Rev. 2022, 22, 377–387. [Google Scholar] [CrossRef]
- García-Sánchez, I.M.; Aibar-Guzmán, B.; Aibar-Guzmán, C.; Somohano-Rodríguez, F.M. The Drivers of the Integration of the Sustainable Development Goals into the Non-Financial Information System: Individual and Joint Analysis of Their Influence. Sustain. Dev. 2021, 30, 513–524. [Google Scholar] [CrossRef]
Disclaimer/Publisher’s Note: The statements, opinions and data contained in all publications are solely those of the individual author(s) and contributor(s) and not of MDPI and/or the editor(s). MDPI and/or the editor(s) disclaim responsibility for any injury to people or property resulting from any ideas, methods, instructions or products referred to in the content. |
© 2025 by the authors. Licensee MDPI, Basel, Switzerland. This article is an open access article distributed under the terms and conditions of the Creative Commons Attribution (CC BY) license (https://creativecommons.org/licenses/by/4.0/).