Article

Research on the Configurations and Control Methods of a Hybrid System of Air-Source Heat Pumps and Gas Boilers for Space Heating: Simulation and Comparative Analysis

1
Hubei Key Laboratory of Multi-Media Pollution Cooperative Control in Yangtze Basin, School of Environmental Science and Engineering, Huazhong University of Science and Technology, Wuhan 430074, China
2
School of Municipal and Environmental Engineering, Shenyang Jianzhu University, Shenyang 110168, China
3
Department of Building Science, Tsinghua University, Beijing 100084, China
*
Author to whom correspondence should be addressed.
Sustainability 2025, 17(13), 6173; https://doi.org/10.3390/su17136173
Submission received: 22 May 2025 / Revised: 18 June 2025 / Accepted: 30 June 2025 / Published: 4 July 2025

Abstract

This study analyzes the configurations and control strategies of hybrid heating systems of air-source heat pumps (ASHPs) and gas boilers for space heating in different climatic regions in China, with the aim of improving the comprehensive energy efficiency. Parallel and series hybrid modes were proposed, and simulation analysis was conducted to analyze the energy performance, energy costs, and CO2 emissions of different hybrid systems. The results show that the supply water temperatures of ASHPs in series mode are lower than that of ASHPs in parallel mode; thus, the COP of ASHPs in series mode reached 2.73 and was higher than the COP of ASHPs in parallel mode with a value of 2.65. Then, the optimal intermediate temperatures of hybrid system in series mode were analyzed, so as to guide the system control. The results show that compared with series mode with a fixed 50% load distribution, the operational costs and CO2 emissions were reduced by 10.0% and 10.4% in Harbin, reduced by 6.4% and 8.3% in Beijing, and reduced by 10.0% and 15.1% in Wuhan. Additionally, the optimal intermediate temperature was affected by the building load ratio, supply water temperature, ambient air temperature, and the electricity–gas price ratio. The series-hybrid ASHP and gas boiler system achieves remarkable energy and cost savings across different climatic conditions, providing a scientific basis for promoting low-carbon heating solutions.

1. Introduction

China’s building heating demand is regionally widespread, marked by large energy consumption and CO2 emission [1]. Apart from the centralized space heating area with clean waste heat, there are still more than 10 billion m2 buildings with distributed and low-carbon space heating demand [2]. Traditional heating technologies such as gas boilers and electric boilers can no longer satisfy energy-saving requirements, while clean, energy-efficient, and low-carbon energy utilization has become the new trend [3,4]. Electric heat pump systems, heated by mid-deep geothermal energy [5], shallow-depth geothermal energy [6], solar energy [7], and air [8], have been analyzed and widely applied for space heating in China, among which mid-deep geothermal heat pump systems (MD-GHPs) demonstrate higher energy efficiency and flexible regulation ability since they use heat sources with a high-temperature and large heat extraction ability [9,10]. But these advantages are also due to the higher initial costs and the distribution differences in geothermal resources, in which MD-GHPs have failed to be widely applied. Air-source heat pumps (ASHPs), with the advantages of lower initial costs and flexible installation, have gained broad applications in space heating and domestic hot water supply worldwide [11].
In recent years, there has been a growing number of studies focusing on the energy performance of ASHPs for space heating in severe cold regions, especially with the dynamic variation in ambient environments and space heating demand, thus enhancing energy performance and stability [12,13,14]. Field measurements indicate rural households using ASHPs maintain indoor temperatures of 10–23.5 °C, meeting thermal comfort needs [15]. Xu [16] conducted on-site measurements to study the energy performance of ASHPs for space heating in extreme cold conditions with ambient air temperatures between −20.9 °C and −10.4 °C in Harbin, a severe cold region in China. The results show that the COP of ASHPs declined from 2.44 to 1.04 across three of the typically coldest days. To improve low-temperature applicability, technologies like enhanced vapor injection [17,18] and multi-stage compression [19,20] have been proposed to boost energy efficiency. Liang [21] found that low wind speeds caused air inlet short-circuiting (CIE), which increased the defrost frequency by 243.5% and reduced the operational COP by 27.7%. Liu [22] proposed a control strategy to regulate the heating capacity of ASHPs to match the space heating demand dynamically, thus improving the energy performance of the system, and put forward that the enhancement of building envelope insulation is critical for better energy performance of ASHPs in cold regions. Zhang [23] compared a low-temperature air-source heat pump (LTASHP) and conventional heating systems via modeling, finding that the LTASHP was more cost-effective in heat generation in terms of primary energy use, emissions, and costs. Kelly [24] modeled ASHP performance in Scottish retrofits, showing 12% CO2 reductions compared with gas boilers, 55% compared with all-electric systems, with operating costs 55% below electric and 10% below gas heating. Huang [25] analyzed ASHPs across 353 locations, demonstrating up to 23.1% COP improvements and 90% carbon reductions in low-emission areas.
With ASHPs gaining traction for space heating, research focuses on the system configuration and operational optimization of hybrid systems with ASHPs and other space heating technologies [26,27]. Xu [28] simulated boiler–ASHP coupled systems in cruise pool heating via TRNSYS simulation, thus optimizing energy performance under comfort constraints. Olympios [29] developed a data-driven thermodynamic model, showing 55–62% thermal decarbonization in boiler–ASHP systems across scales. Bagarella [30] used TRNSYS to identify optimal balance temperatures for residential boiler–ASHP systems in diverse climates. In addition, a solar–ASHP coupling system showed significant energy-saving and efficiency benefits [31,32]. Cold-region solar–ASHP coupling optimized via TRNSYS and NSGA-II reduced energy use by 31.79% in Beijing and 16.25% in Changchun, enhancing solar efficiency [33]. Life cycle studies [34] show that ASHP–gas boiler systems have the lowest operational emissions (25.7 tCO2), with ASHP–solar favored for renewable energy.
It can be seen that hybrid space heating systems with ASHPs and gas boilers have gained significant attention among researchers for their diverse applications. However, current research mainly focuses on theoretical analysis, lacking studies on their suitability for various climate zones. Moreover, the influence of typical factors on the energy performance of hybrid systems should be studied quantitatively in order to guide system configuration and control. Therefore, this paper proposes hybrid systems of ASHP–gas boilers in parallel and series configurations. Through system simulation, the influence mechanisms of key factors such as building load rate, supply water temperature, ambient air temperature, and electricity–gas price ratio on the energy efficiency and economic effect of the hybrid system are quantitatively analyzed. On this basis, a load distribution control strategy based on intermediate temperature is constructed, which optimizes energy distribution and renders sustainable heating systems economically viable. The research shows that by optimizing the intermediate temperature setpoints, significant reductions in operation costs and carbon dioxide emissions can be achieved. Furthermore, the applications and energy-saving effects of hybrid systems across severe cold zones (Harbin), cold zones (Beijing), and hot-summer–cold-winter zones (Wuhan) in China were studied, verifying that the hybrid system demonstrates remarkable energy-saving and carbon-reduction benefits.

2. Methodology

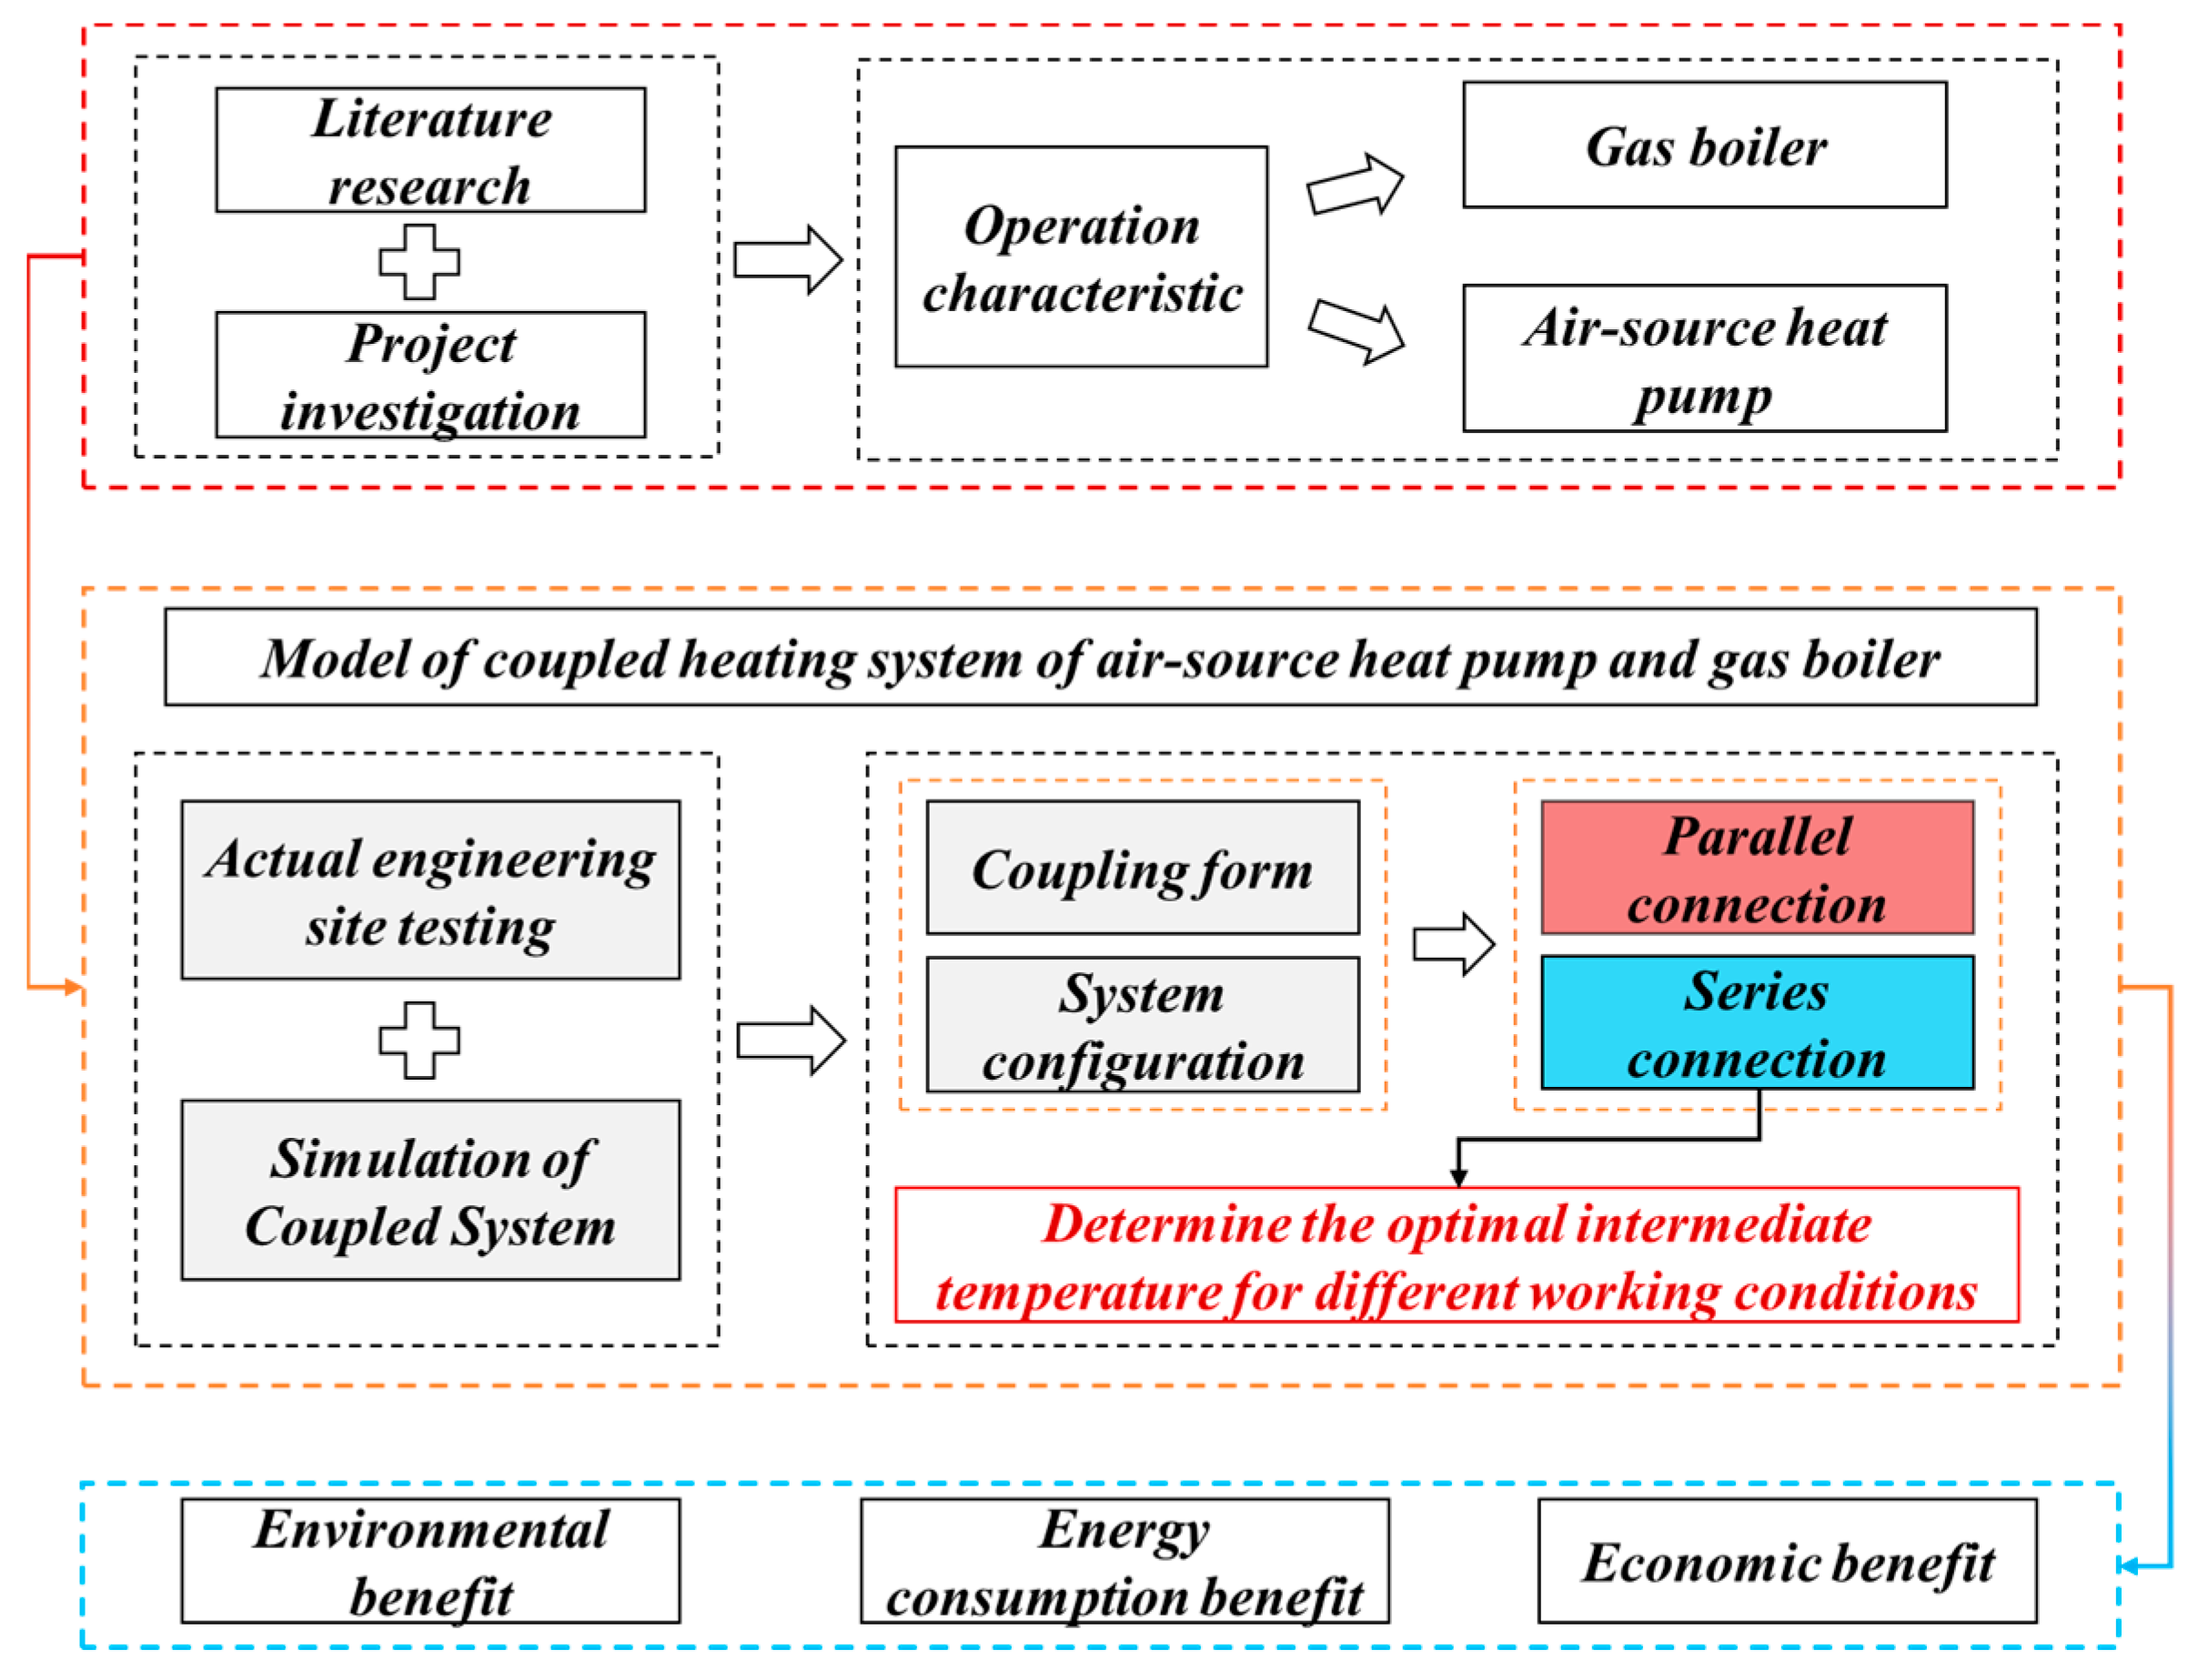
2.1. Research Framework

2.1.1. Research Workflow

This paper established a simulation framework based on Python (Version 3.11) and constructed dynamic mathematical models to investigate the operational characteristics of hybrid systems combining air-source heat pumps (ASHPs) and gas boilers. The system configuration and control strategies of hybrid systems were studied and optimized, aiming to fully leverage the energy saving and flexibility of ASHPs under part-load conditions while ensuring the stable operation of gas boilers under peak-load conditions. Figure 1 shows the technical framework of this study. The operational characteristics of individual ASHPs and gas boiler heating systems were studied first, so as to highlight the rationale for developing the hybrid system. Then, the hybrid system was proposed and studied in series and parallel configurations by simulation analysis, while the system configurations and control strategies for variable operating conditions were compared and optimized. Finally, the applicability of the hybrid heating system across different Chinese climate zones was evaluated from environmental, energy consumption, and economic perspectives.

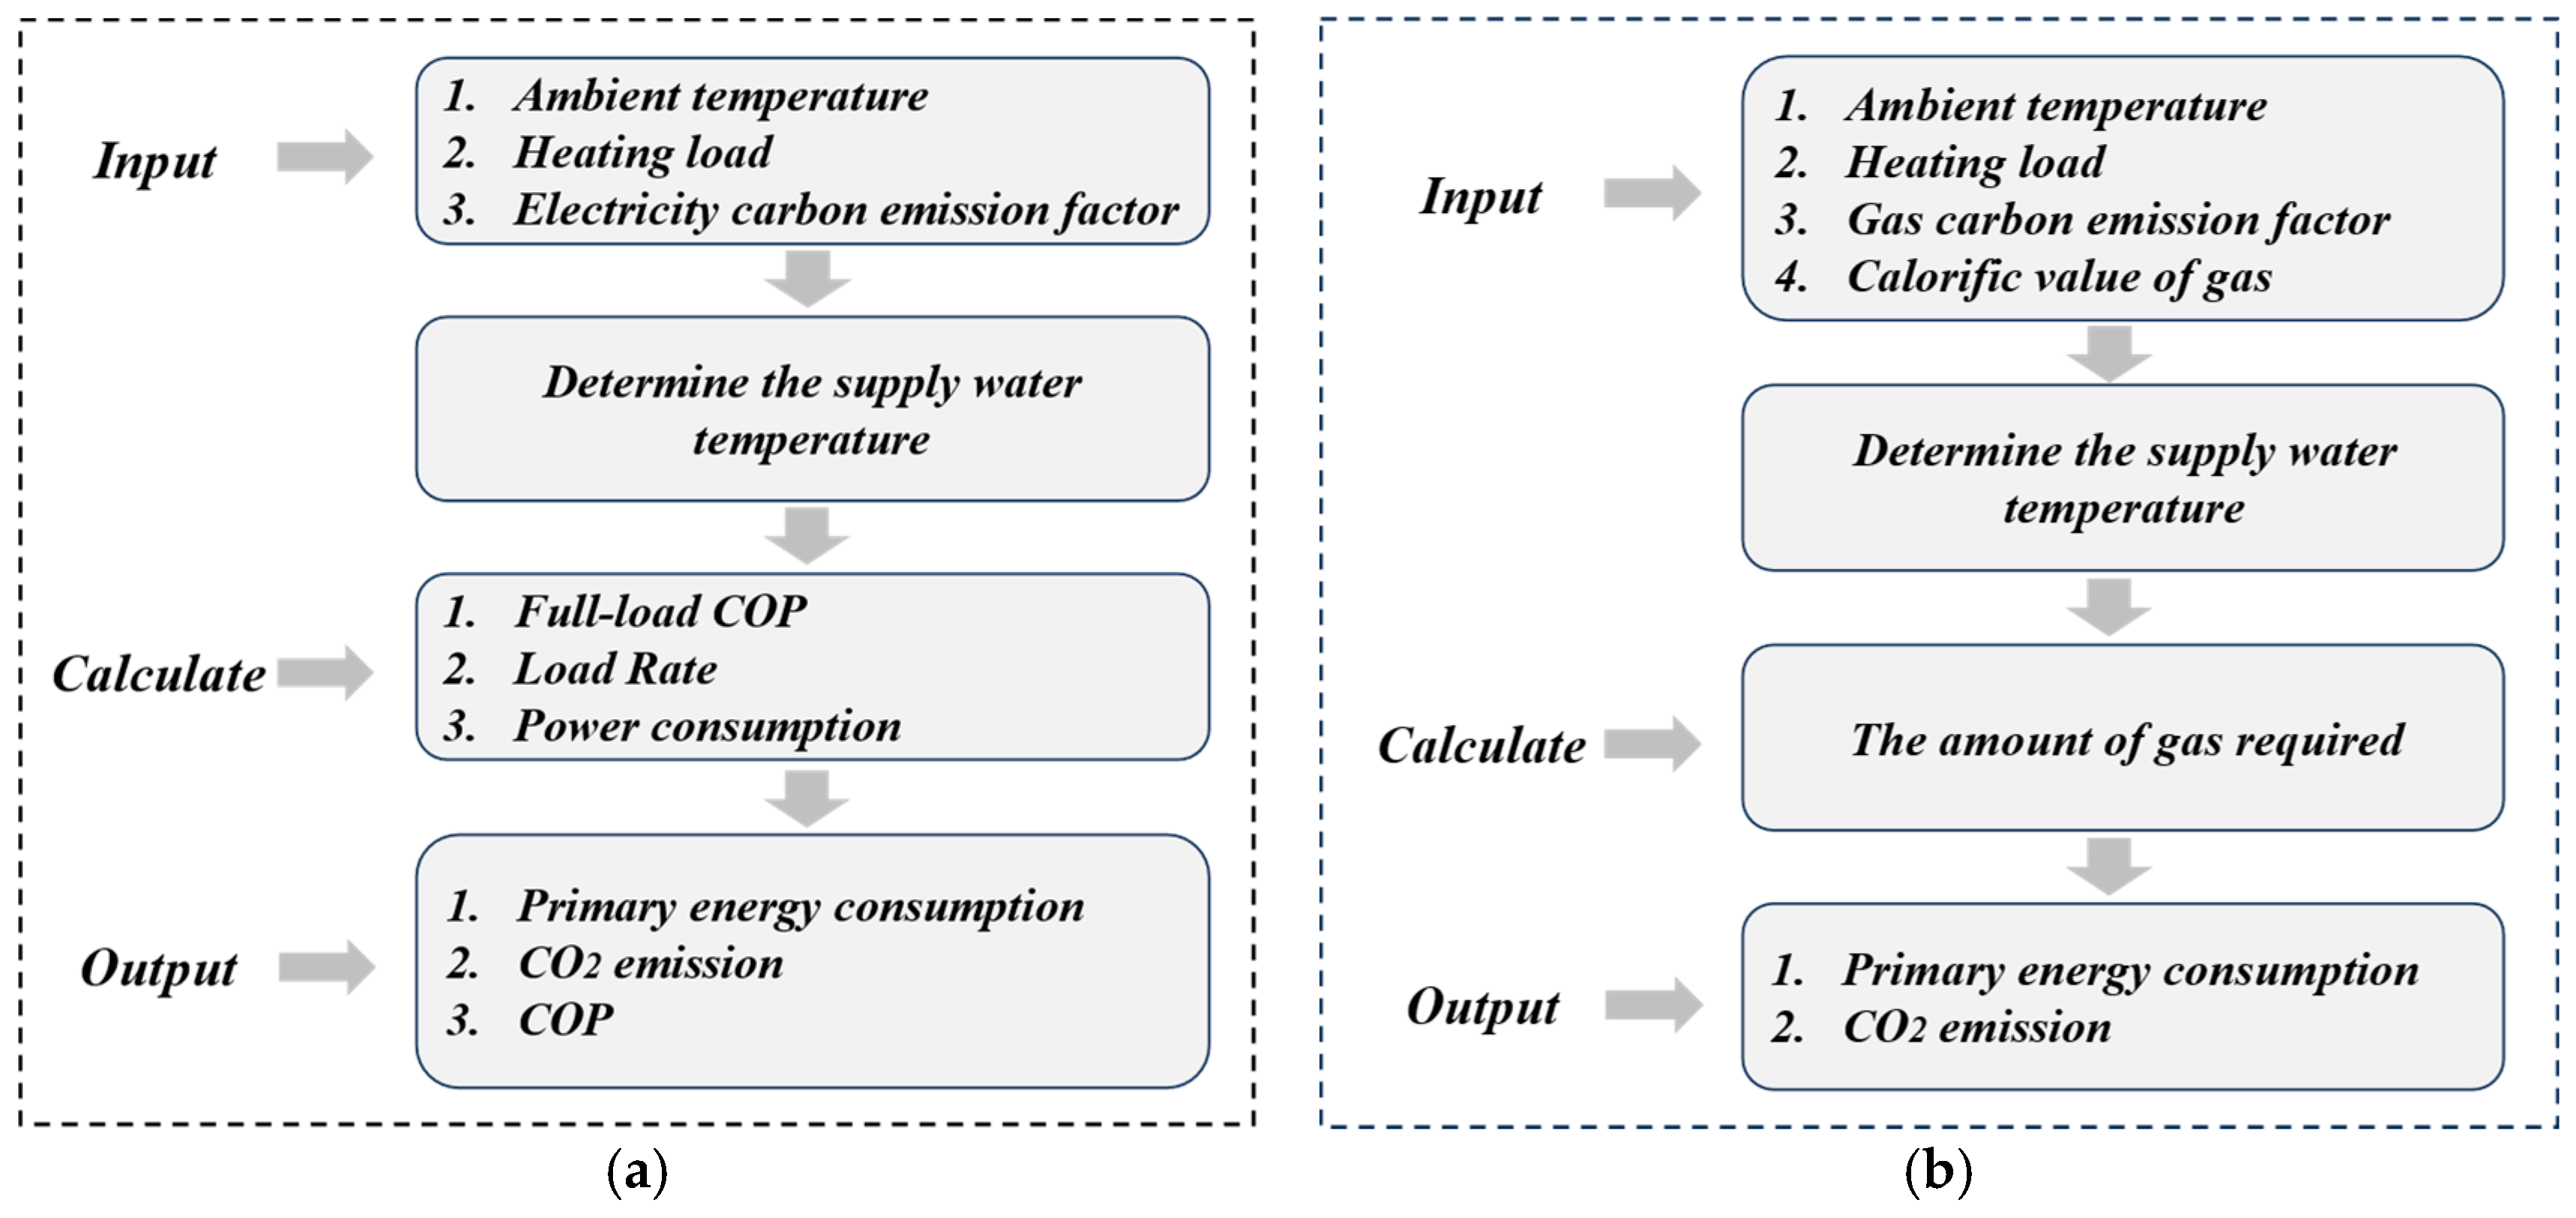
2.1.2. Evaluation Indexes

To clarify the operational performance of the system, the following operational performance evaluation indicators are adopted to support data analysis.
(1) The transient space heating demand (Qc) is obtained by simulation analysis, and serves as an input parameter for the hybrid system model. In addition, Qc can be further divided into water flow rate, supply, and return water temperatures using Equation (1).
Q c =   G u   ×   C p   ×   ( T s T r )
where Qc represents the transient space heating demand, with kW as the unit. Gu represents the user-side water flow rate, with kg/s as the unit. Cp is the specific heat capacity of water at constant pressure, with J/(kg⋅K) as the unit. Ts and Tr represent the user-side supply and return water temperatures, with °C as the unit.
(2) The electricity consumption of ASHPs can be calculated by Equation (2).
C E = Q c , a C O P
where Qc,a and CE are the heating capacity and the electrical energy consumption of ASHPs, with kW representing transient value, and kWh representing accumulated value. The COP represents the coefficient of performance of ASHPs.
(3) Then, for the gas boilers, the energy efficiency is assumed to be 100% and the local heat value of gas is used; thus, the gas consumption of gas boilers can be calculated by Equation (3).
C g = Q c , g h g
where Qc,g is the heating capacity of gas boilers, with kW representing transient value, and kWh representing accumulated value. Gg is the heating capacity and gas consumption, with m3/s representing transient value, and m3 representing accumulated value. hg represents the gas calorific value; its effect on gas boiler efficiency is eliminated by the uniformly assigned value of 35.59 MJ/m3.
(4) The total amount of primary energy required (PE) to meet the energy demand of the system can be calculated with Equation (4).
P E = α   ×   C E + β   ×   C g
where PE is the primary energy consumption, in kg. CE is the electric consumption, in kWh. Cg represents the gas consumption, in m3. The values of α and β are 0.31 and 1.33, respectively [35].
(5) The CO2 emissions (M) can be calculated with Equation (5), which represents the amount of CO2 released into the atmosphere due to the energy consumption of the system.
M = C E   ×   N E +   C g   ×   N g
where M is the CO2 emissions, in kg. NE represents the CO2 emission factor of electricity. Ng is the CO2 emission factor of natural gas. The electricity CO2 emission factors for Harbin, Beijing, and Wuhan are 0.5368, 0.5580, and 0.4364, respectively, in kg · CO2/kWh [36].

2.2. Simulation Model and Control Strategies for Different Operation Modes

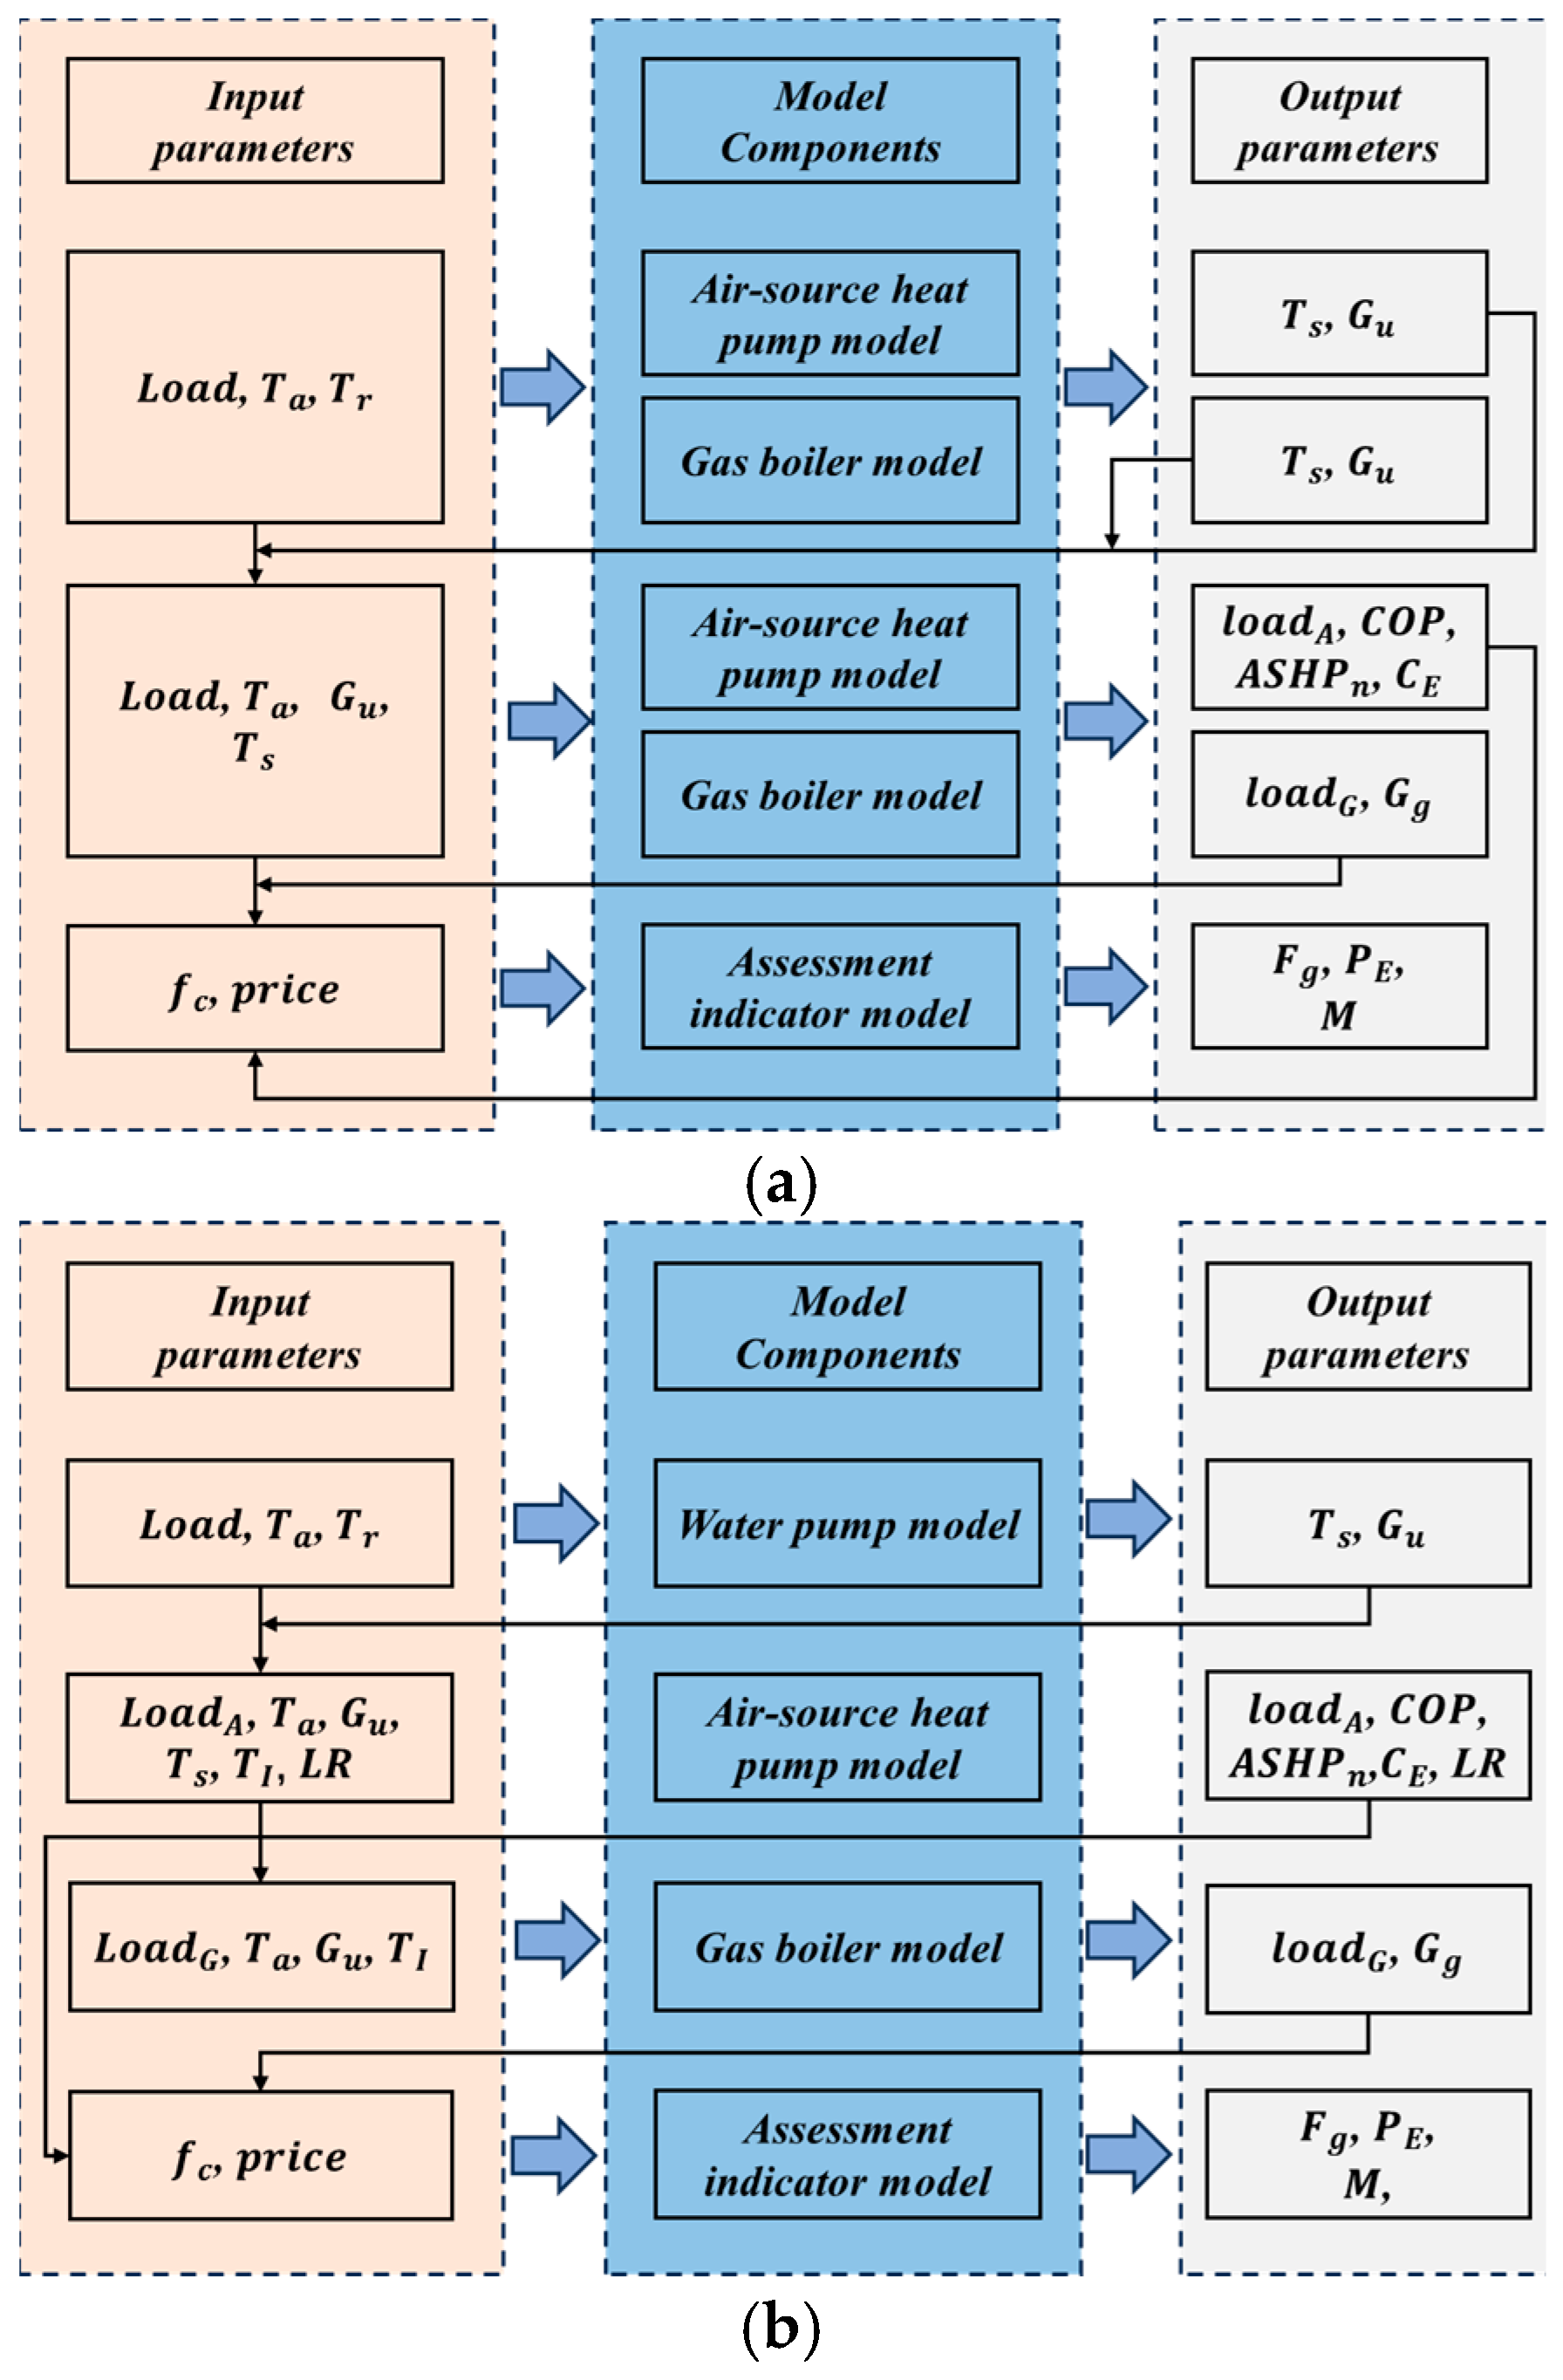
2.2.1. System Model Description

Figure 2a shows a model diagram of the ASHPs, where the ambient air temperature ( T a ), heating load, and N E serve as input parameters, and Ts is determined by building heating load. Based on the rated coefficient of performance of ASHPs at full load condition ( C O P f ) and the actual load rate (LR), the actual COP, C E , P E , and M are obtained. Figure 2b shows the schematic diagram of the gas boiler model, whose input parameters include T a , heating load, C g , and h g . Then the C g , P E , and M are calculated.

2.2.2. Model Assumption

To simplify the calculation methods and ensure the accuracy of simulation models, some assumptions have been made as follows:
(1) The indoor temperature was assumed constant at 18 °C during the whole heating season, thus the hourly space heating demand could be calculated with a specific ambient air temperature under the guidance of the national standard of China [35].
(2) Theoretically, the user-side supply water temperature follows a functional relationship with space heating demand of buildings. However, in practical engineering, the real-time and continuous regulation of the supply water temperature is difficult to implement. Therefore, this paper employs a segmented setting method for the supply water temperature [5].
(3) This paper focuses on the collaborative configuration and operation control strategies of gas boilers and air-source heat pumps, without an analysis of the energy efficiency of gas boilers and improvement methods. In view of the fact that the actual energy efficiency of gas boilers reaches mainly between 90% and 105%, the energy efficiency is uniformly assumed to be 100% in this paper for the convenience of research.
(4) The ASHPs and gas boilers adopt the same user-side water distribution systems. As the energy consumption of the user-side water distribution system is consistent under the two heating modes, this was therefore not considered in the scope of this study.

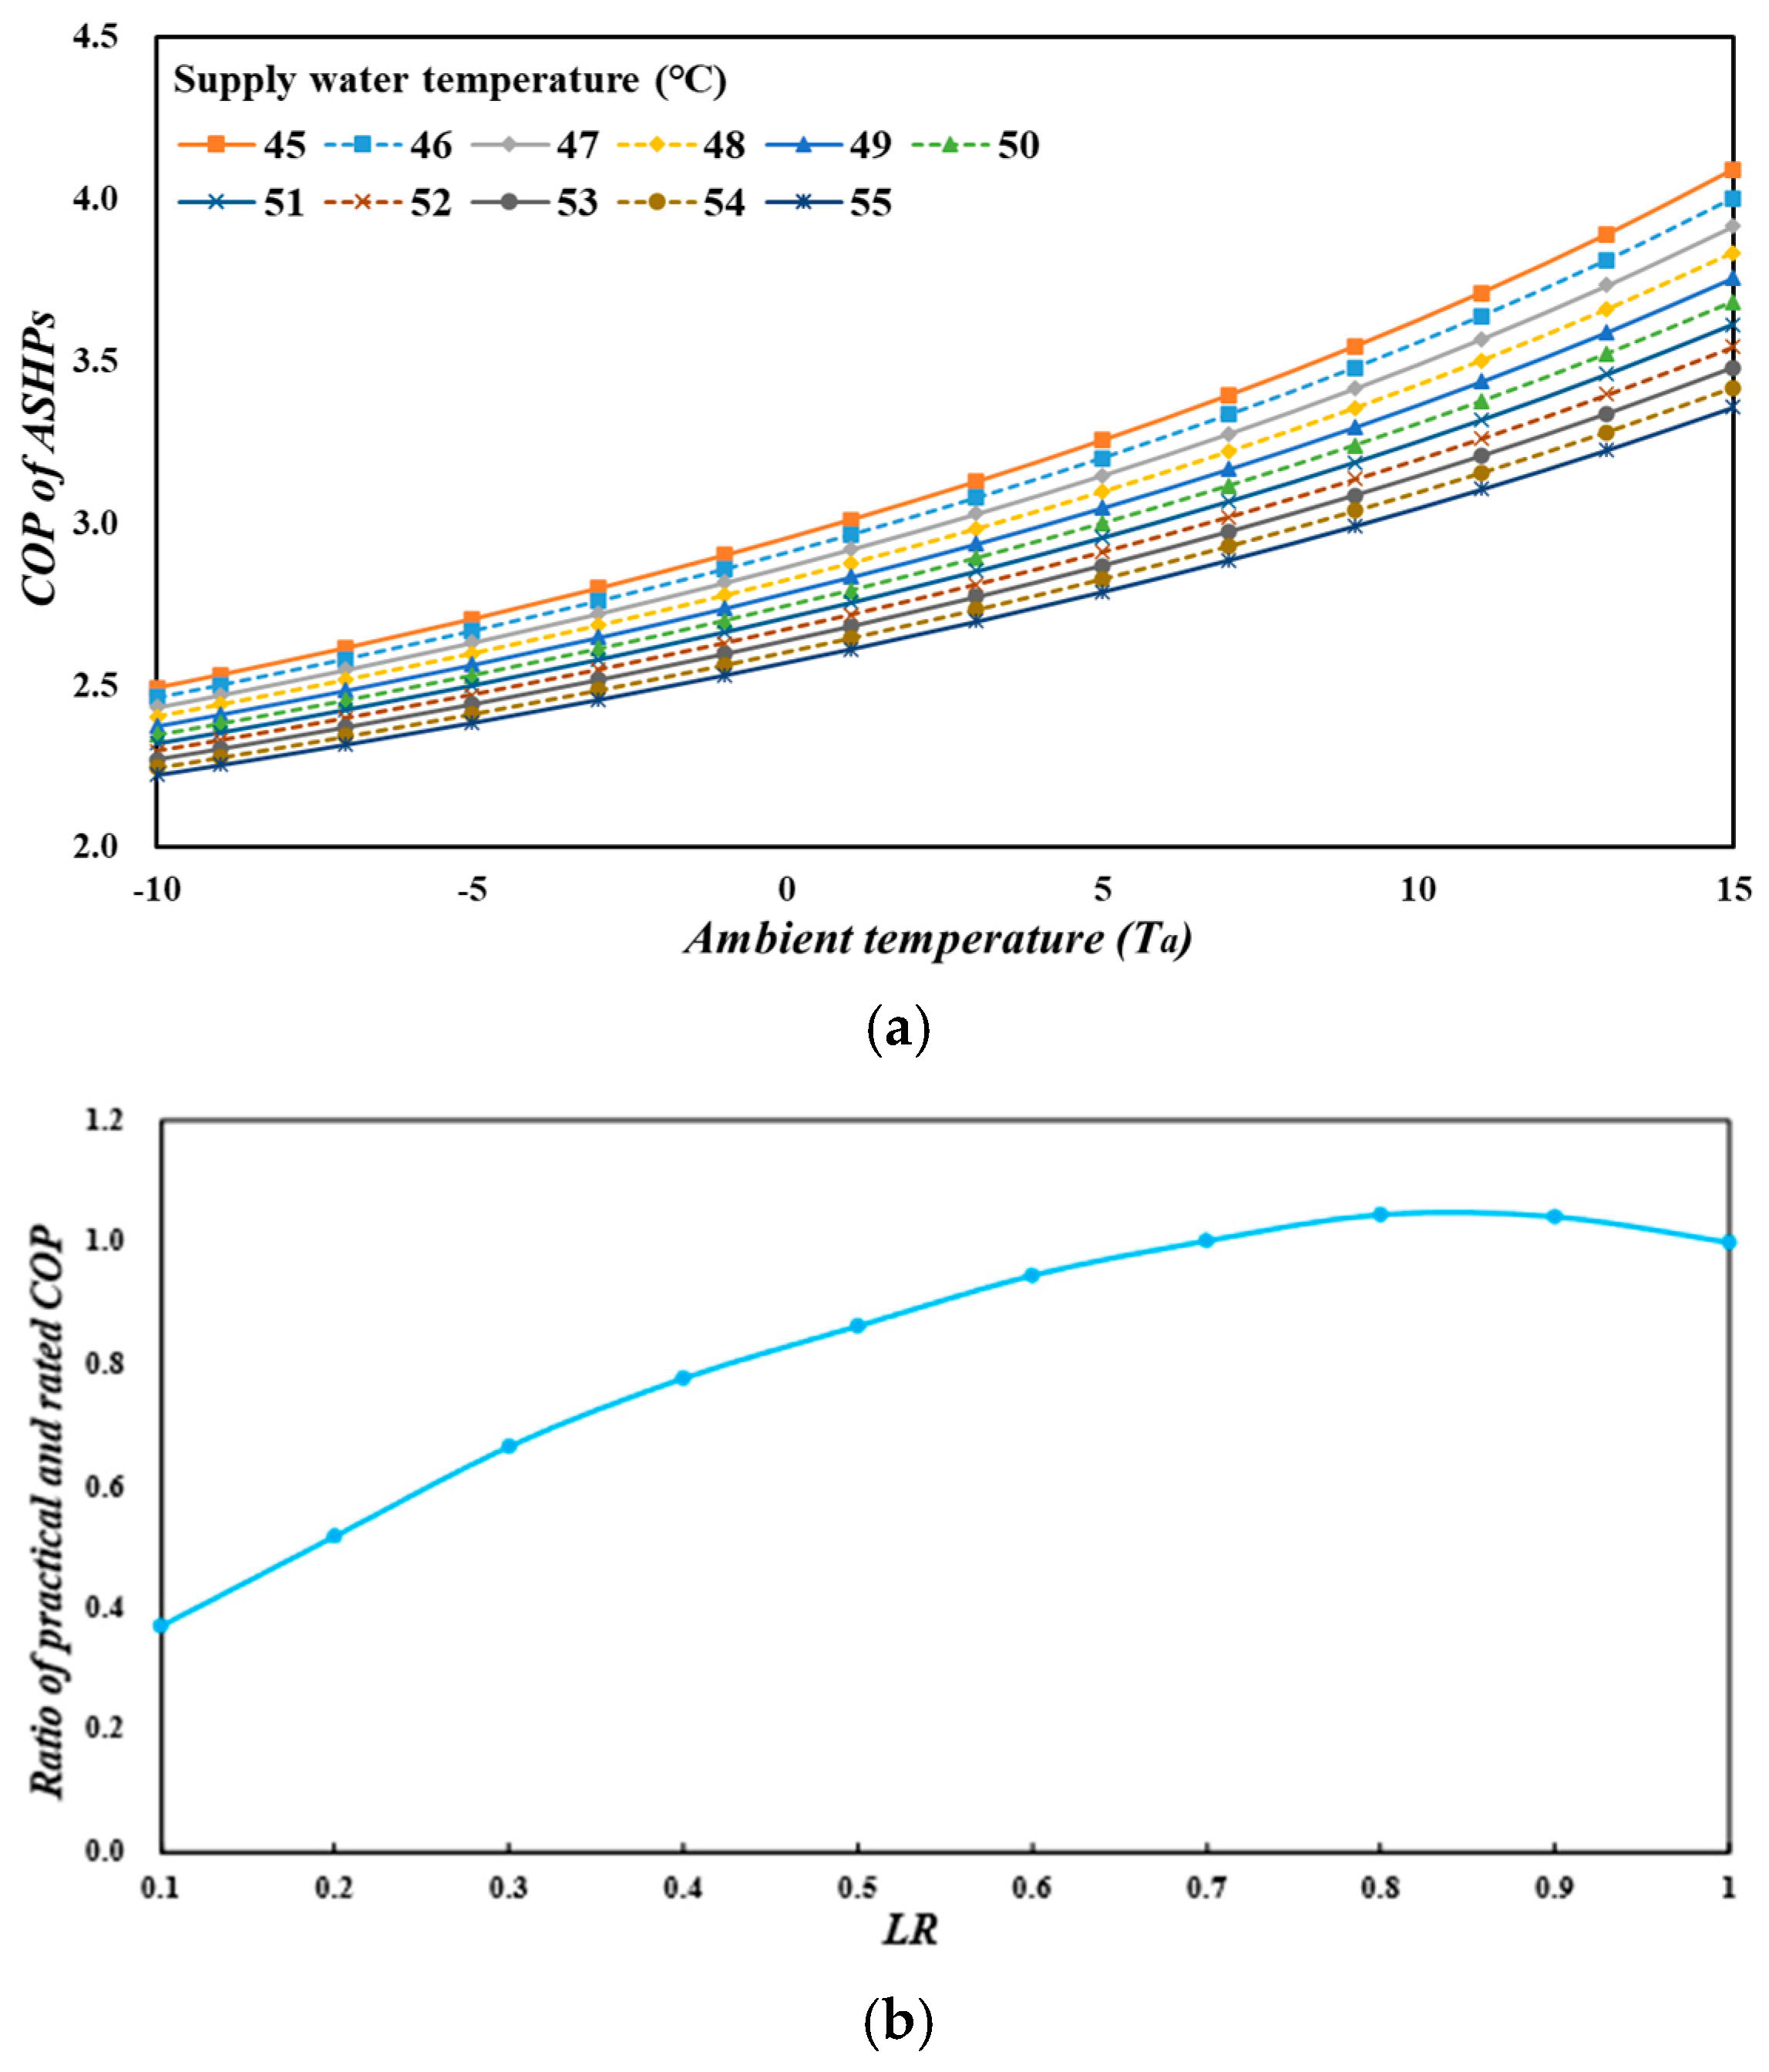
2.2.3. Simulation Models of ASHPs

In this paper, ASHPs with a rated heating capacity of 500 kW were applied for analysis. The COPf of the ASHPs with full load can be determined according to Equation (6) [37], with operation performance fitted by manufacture data.
C O P f = S 1   ×   T a 2 + S 2   ×   T s 2 + S 3   ×   T s   ×   T a + S 4   ×   T a + S 5   ×   T s + S 6
where Ta represents the ambient air temperature, in °C. S1~S6 are constant coefficients fitted from practical operation data or the manufacturer.
Then, the actual COP of the ASHPs is affected by the LR, and can be calculated with Equation (7) [37], with operation performance fitted by manufacture data.
C O P = C O P f   ×   S 7   ×   L R 2 + S 8   ×   L R +   S 9
where S7~S9 are constant coefficients fitted from practical operation data or the manufacturer.
Figure 3 then shows the energy efficiency of ASHPs under different supply water temperatures, ambient air temperatures, and heating load ratios. The data was provided by manufacturers.
The coefficients (S1~S9) in the equations are fitted from the data of manufacturers, and the results are shown in Table 1. With this simulation mode, the energy performance of ASHPs could be simulated and analyzed quantitatively under different operation conditions, including supply water temperatures, air temperatures, and space heating capacities.
With this simulation mode, the dynamic and practical energy performance of ASHPs can be simulated and analyzed quantitatively under different operation conditions, including supply water temperatures, air temperatures, and space heating demand.

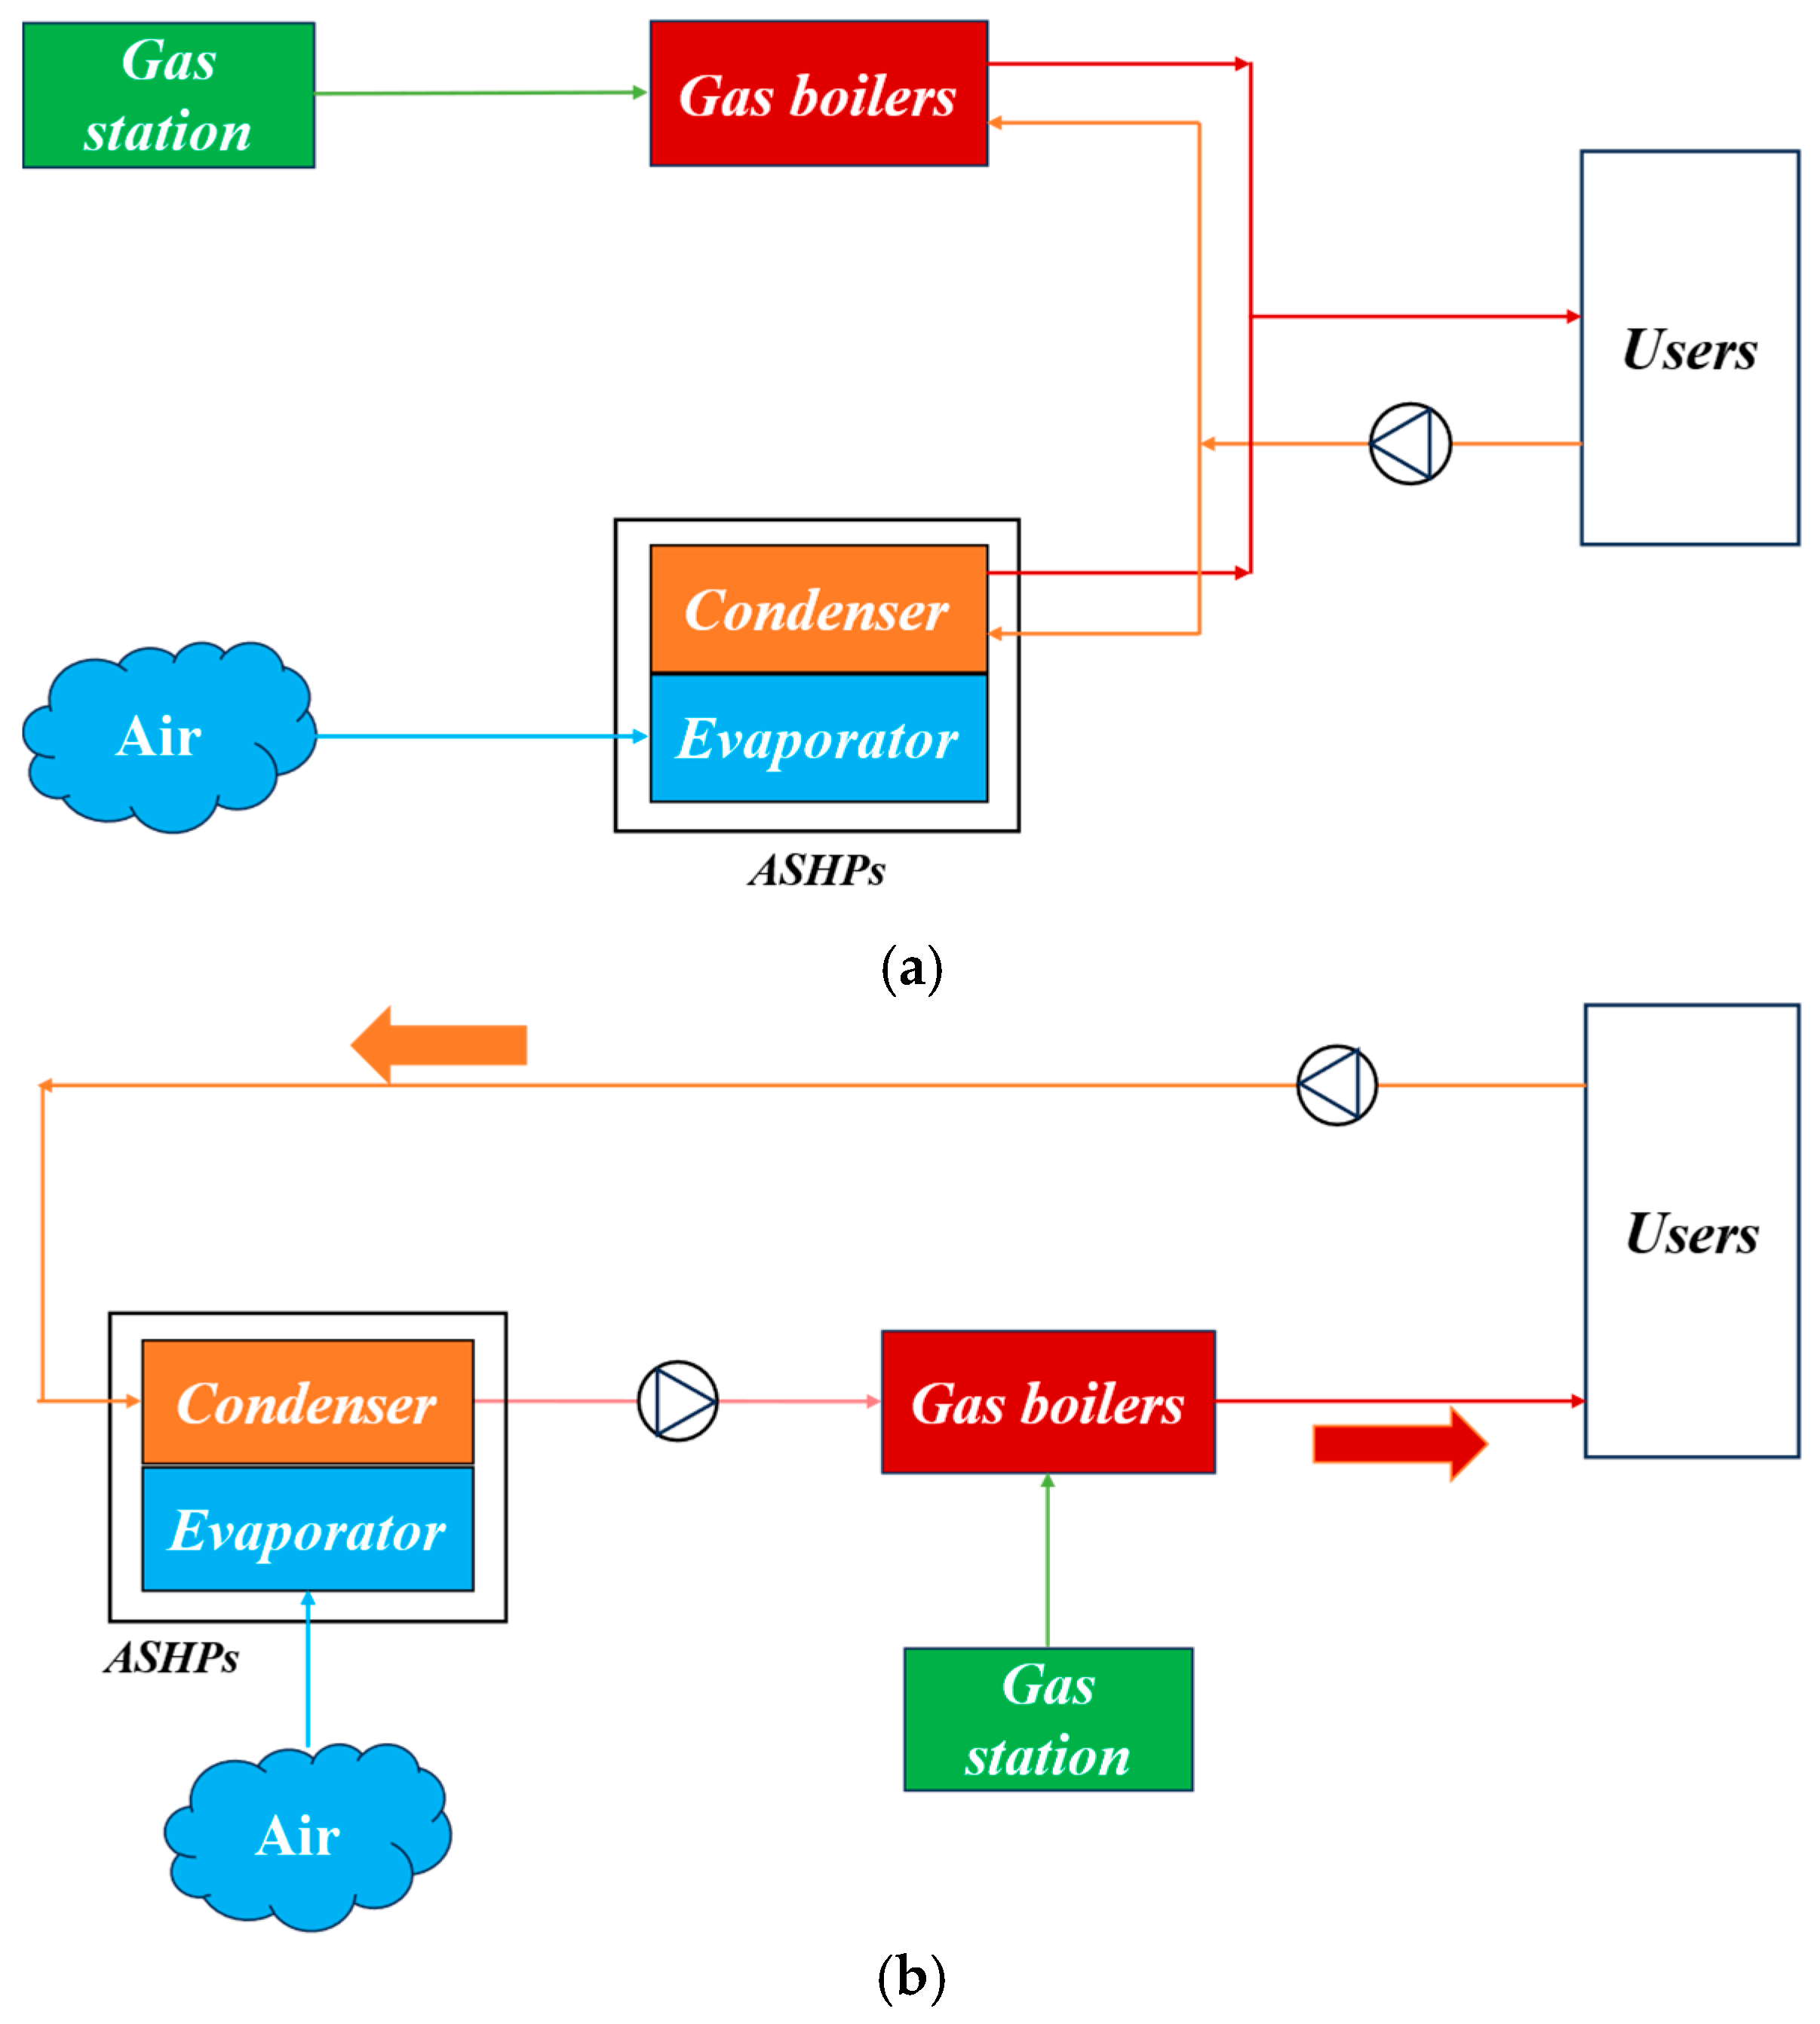
2.2.4. Control Strategies for Different Operating Modes

In this paper, the parallel and series hybrid modes of ASHPs and gas boilers are studied to analyze the load distribution methods of the hybrid system under different operation conditions, aiming to achieve significant economic, energy-saving, and emission-reduction benefits. Figure 4a presents the control strategy and simulation methods of the hybrid system in parallel mode, where the gas boilers and the ASHPs are connected in parallel, and share the same T s and T r . The load distribution is then achieved by allocating the Gu to the ASHPs and gas boilers. The heating demand model is applied to calculate the heading load and the corresponding T s and the temperature difference between the supply and return water in the user side is set at 5 °C. Subsequently, operation parameters such as space heating demand, T a , and T r are input into the gas boiler and the ASHP models, respectively, to calculate the C E of the ASHP and the C g of the gas boiler. Then the natural gas cost ( F g ), P E , and M of the hybrid system can be obtained.
Figure 4b then illustrates the control strategy and simulation methods of the hybrid system in series mode where the condenser of the ASHPs and the gas boiler are connected in series. The user-side return water flows into and is heated by ASHPs first, and then flows into gas boilers. Thus, the outlet water temperature of ASHPs serves as the inlet water temperature of the gas boilers, which can be set as the intermediate water temperature according to the load distribution ratio, and the user-side water temperature difference is also fixed at 5 °C. The load distribution between the ASHPs and gas boilers is achieved by controlling the intermediate water temperature. Based on these input parameters, the C E of the ASHPs and the C g of the gas boilers can be calculated, and the F g , P E , and M of the system can be determined.
This paper first evaluates the hybrid system’s operational performance under pre-defined load allocation ratios to identify the optimal coupling mode between parallel and series configurations. Then, a real-time load distribution strategy is developed to dynamically adjust the load allocation, based on the outdoor air temperature and heating load demand, thereby achieving optimal system performance.

3. Heating System Performance Analysis

3.1. Analysis of Heating Performance of Conventional Systems

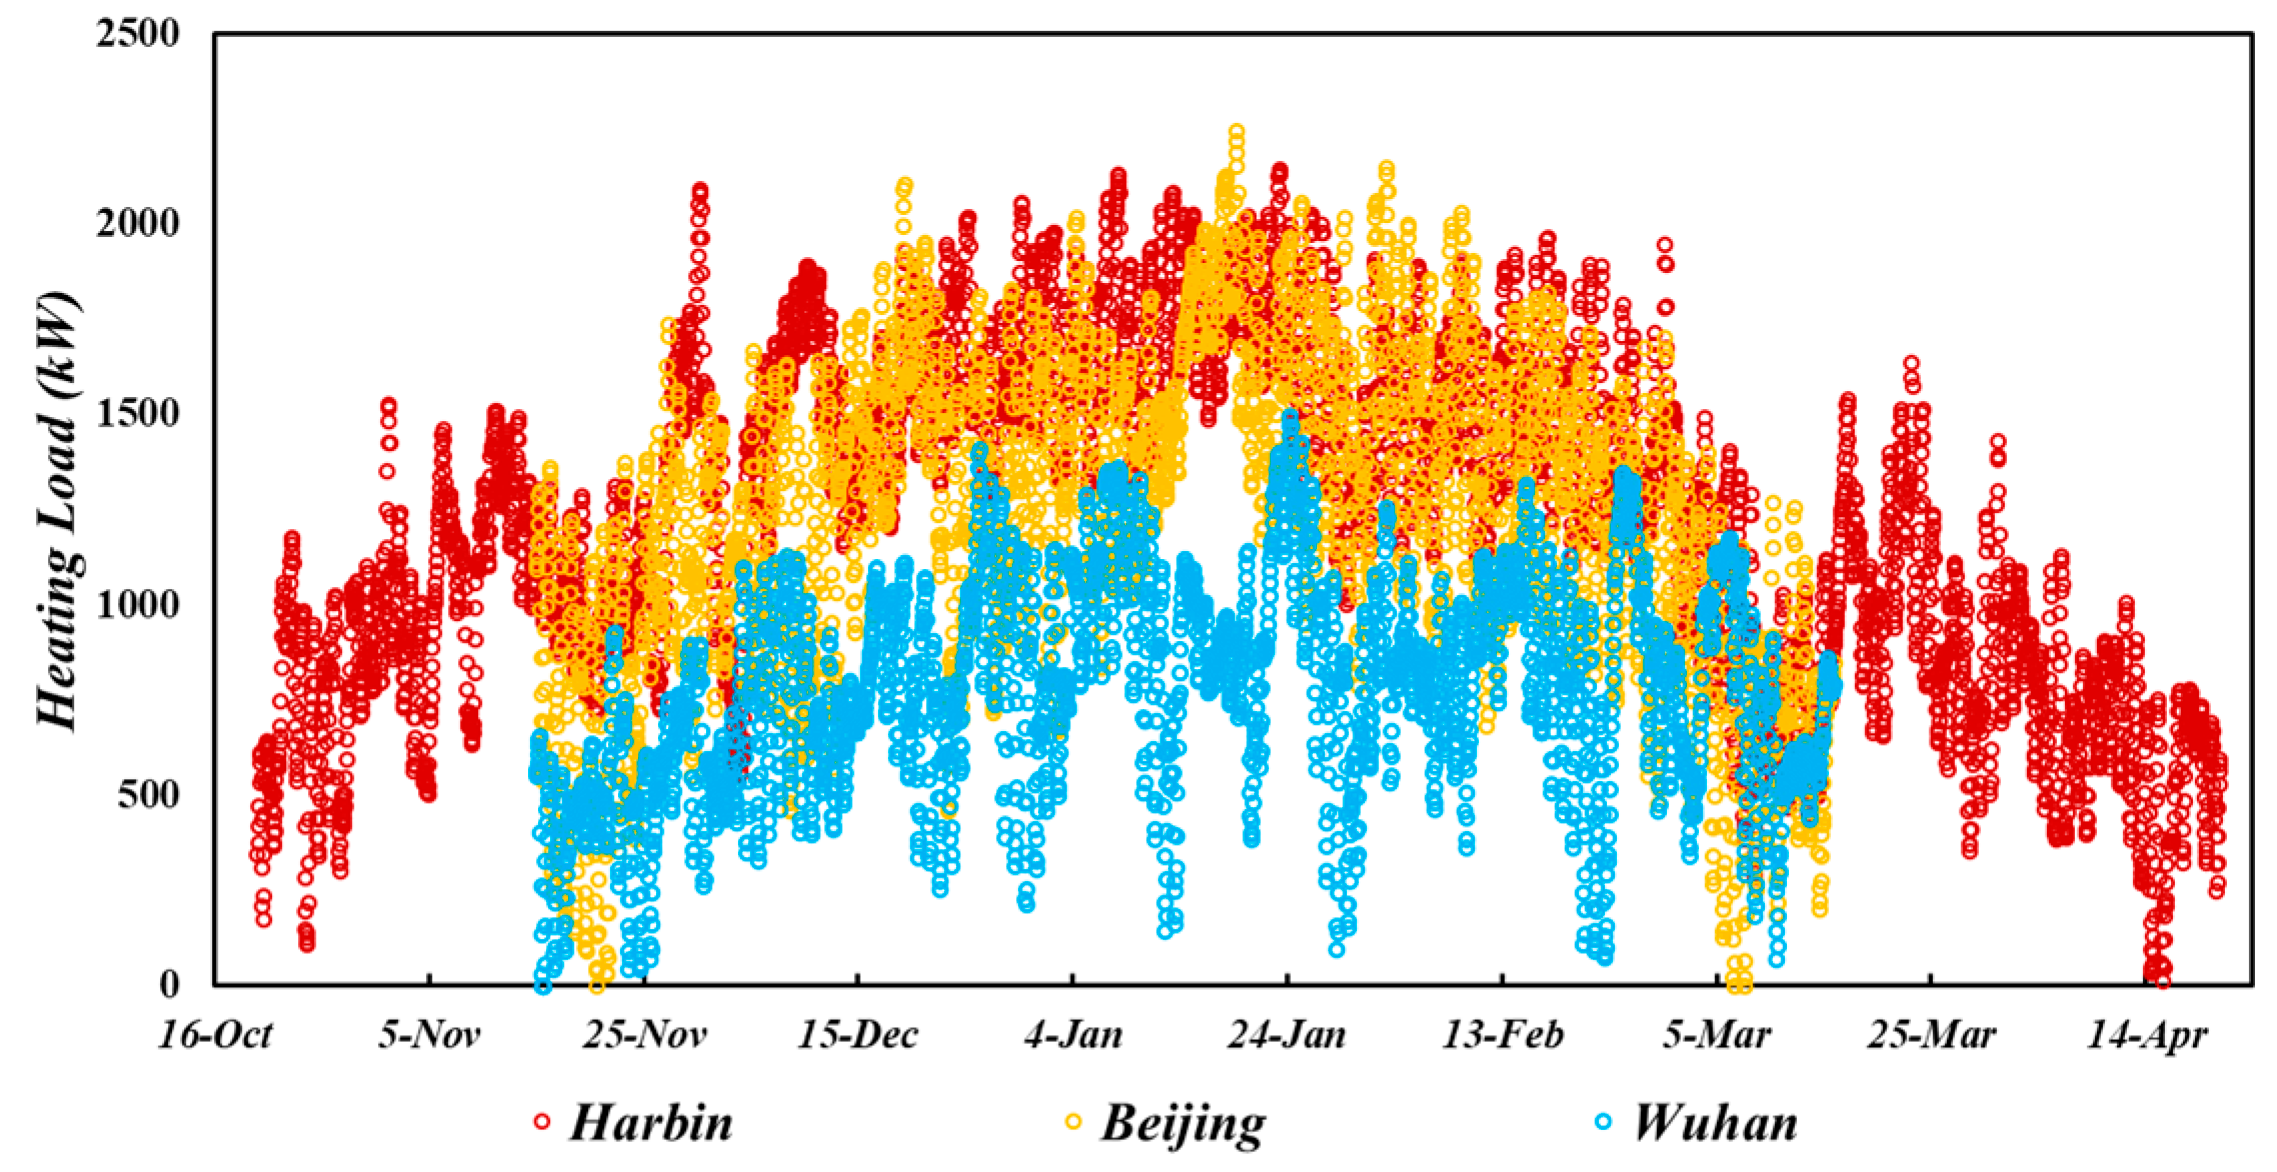
3.1.1. Analysis of Space Heating Load

This section takes a typical conventional residential community with a building area of 50,000 m2 as the research object. A comparative analysis of heating loads is systematically carried out for three climatic zones: Harbin (severe cold region), Beijing (cold region), and Wuhan (hot-summer–cold-winter region), to explore the differential characteristics of heating demands under different climatic conditions. The climatic data adopted in the simulation are derived from the DeST database [38]. In addition, Harbin has a heating period of 183 days, while both Beijing and Wuhan experience 121-day heating seasons. The heating loads of these cities are calculated by integrating Ta data with the heating energy consumption limits specific to their respective climate zones. Figure 5 illustrates the hourly fluctuations of heating loads across Harbin, Beijing, and Wuhan, providing a detailed temporal profile that serves as a foundation for further analysis.
It can be seen that the heating loads of Harbin, Beijing, and Wuhan all exhibit a trend of first increasing and then decreasing in the heating season. During the early period of the heating season, the heating load is low due to the relatively higher Ta. As the Ta drops, the heating demand gradually rises, and reaches its peak value during the severe cold period, with values of 2141.8 kW, 2244.4 kW, and 1494.7 kW, respectively, in Harbin, Beijing, and Wuhan. As shown in Table 2, the total heating loads of Harbin, Beijing, and Wuhan throughout the heating season reach 5.42 million kWh, 3.61 million kWh, and 2.27 million kWh, respectively, and the total heating loads per unit area reach 108.34 kWh/m2, 72.23 kWh/m2, and 45.43 kWh/m2, respectively. This is consistent with the distribution trend of the climate zones.
Figure 6 shows the load duration diagrams of studied buildings in the different cities. During the heating season, the duration when the building load is below 70% reaches 2983 h, 2249 h, and 2377 h, respectively, in Harbin, Beijing, and Wuhan, which accounts for 67.9%, 77.4%, and 81.9% of the total heating duration.

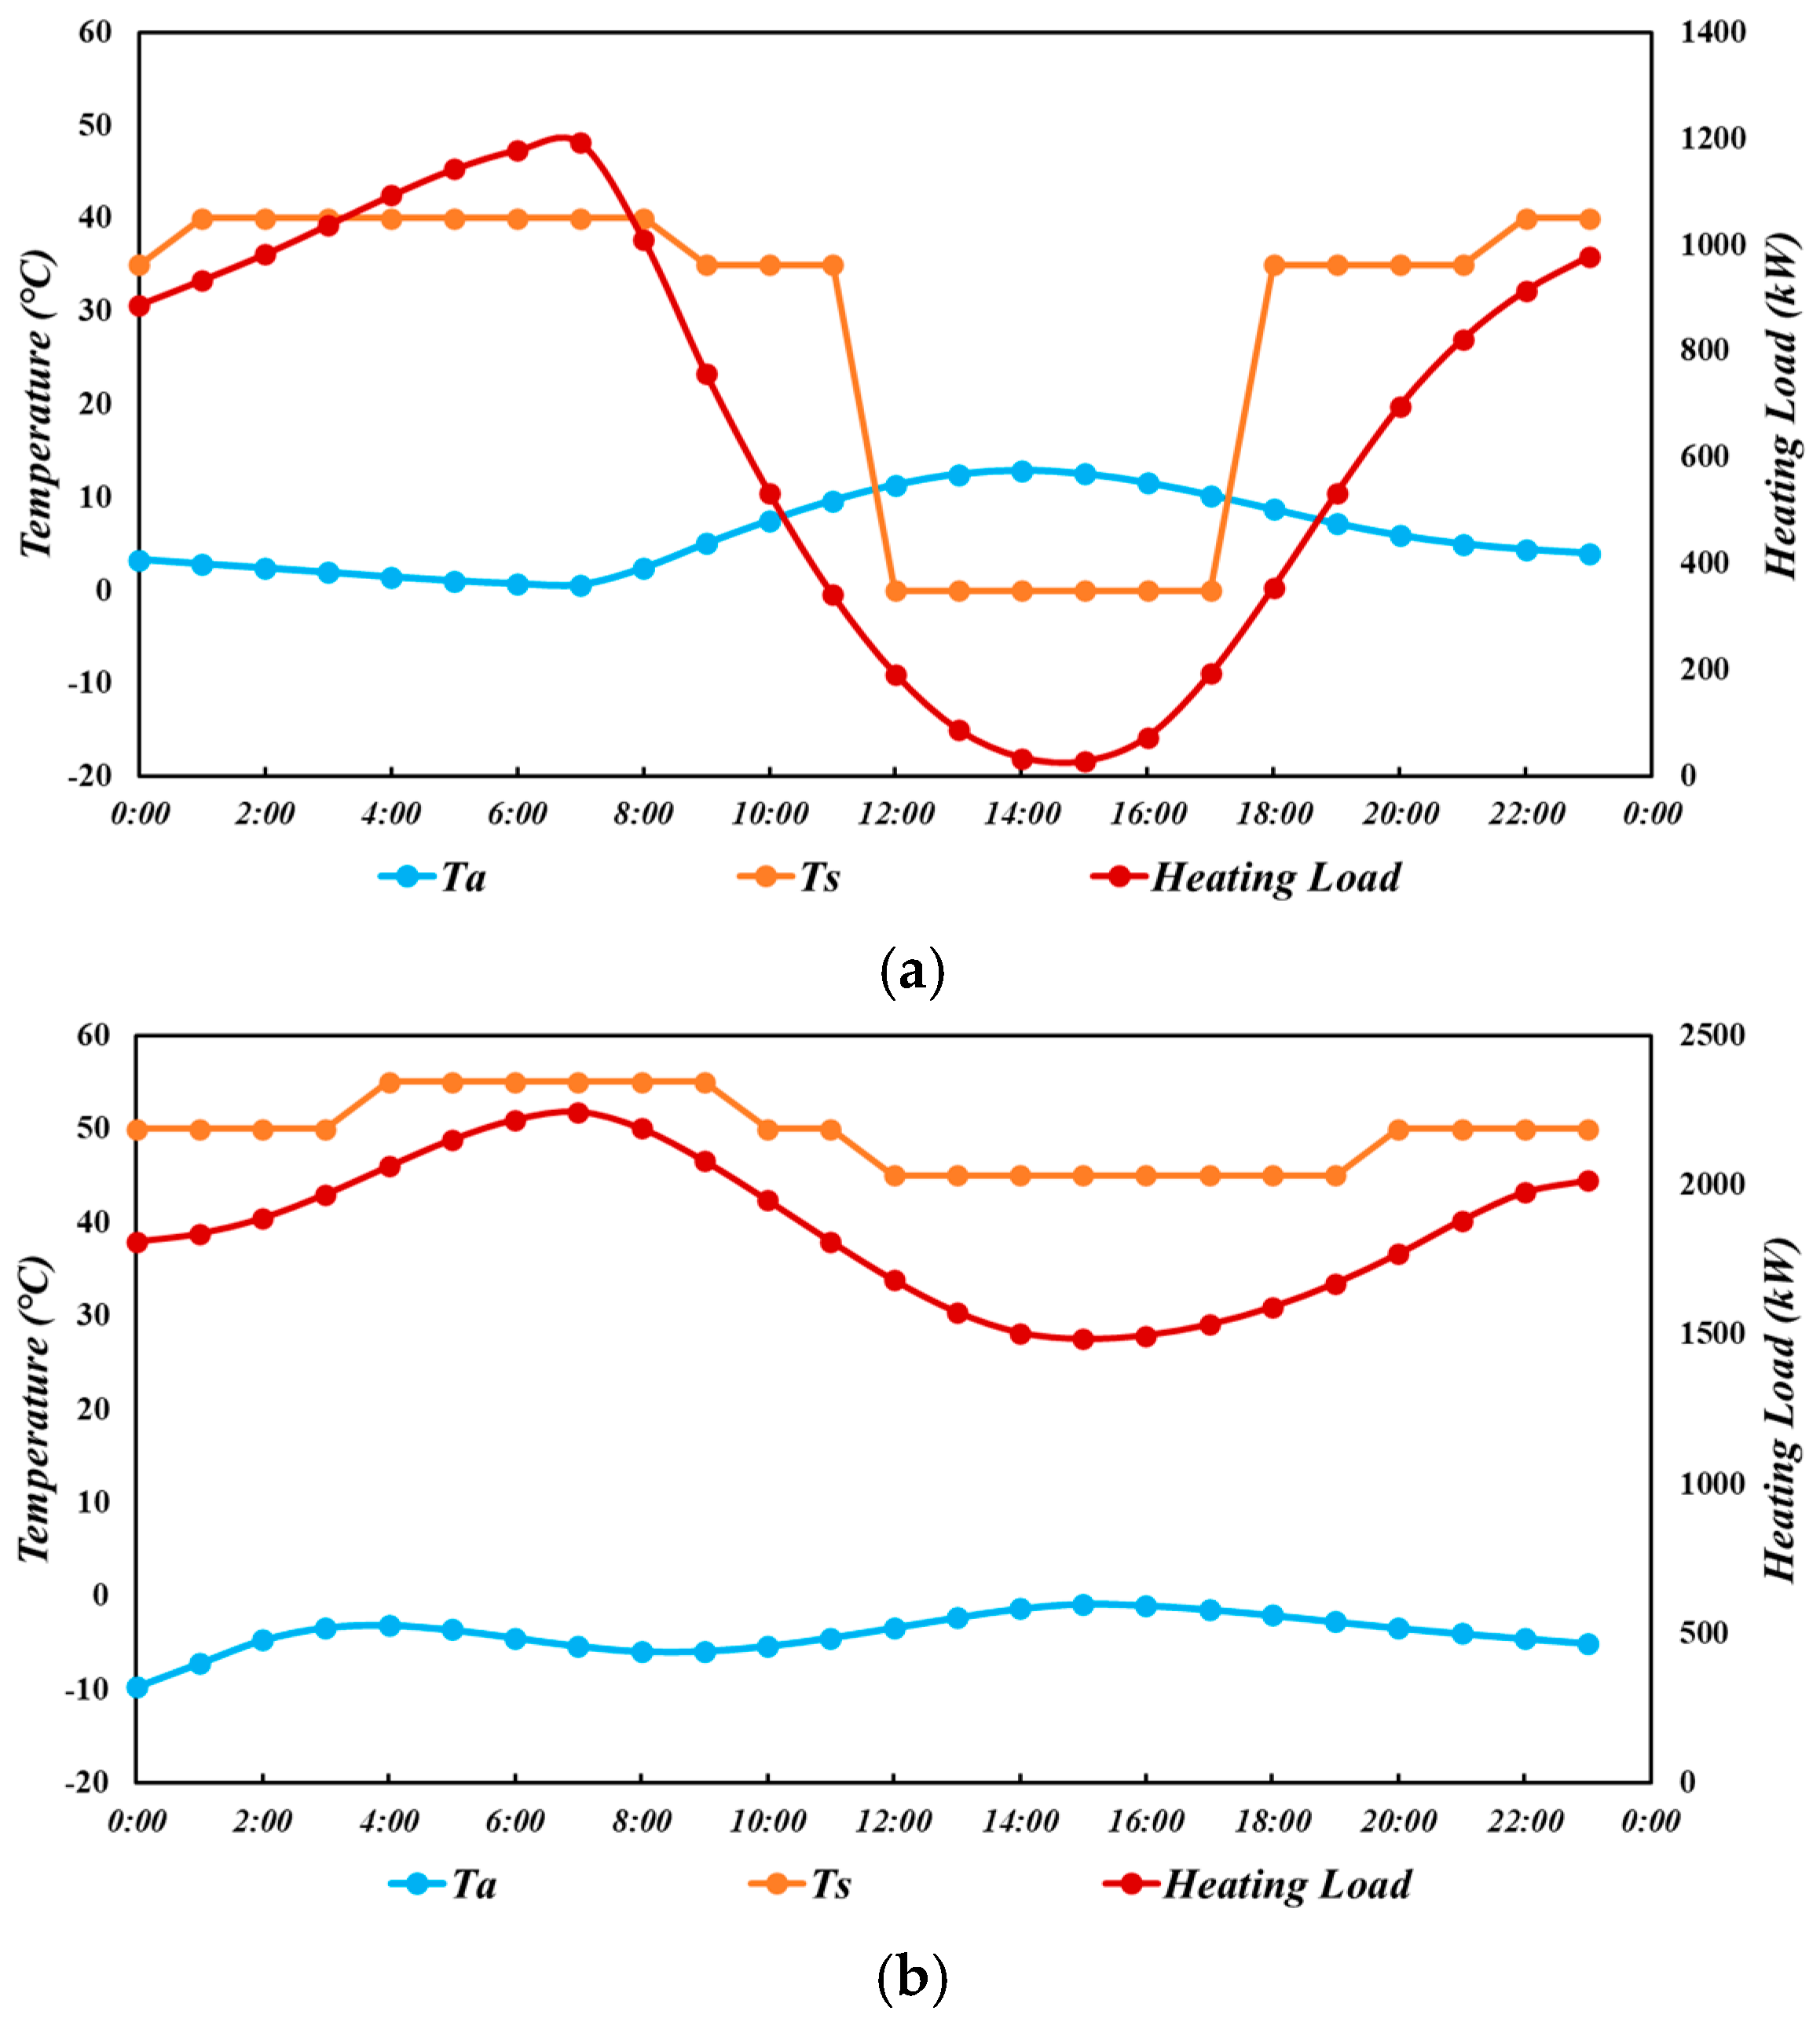
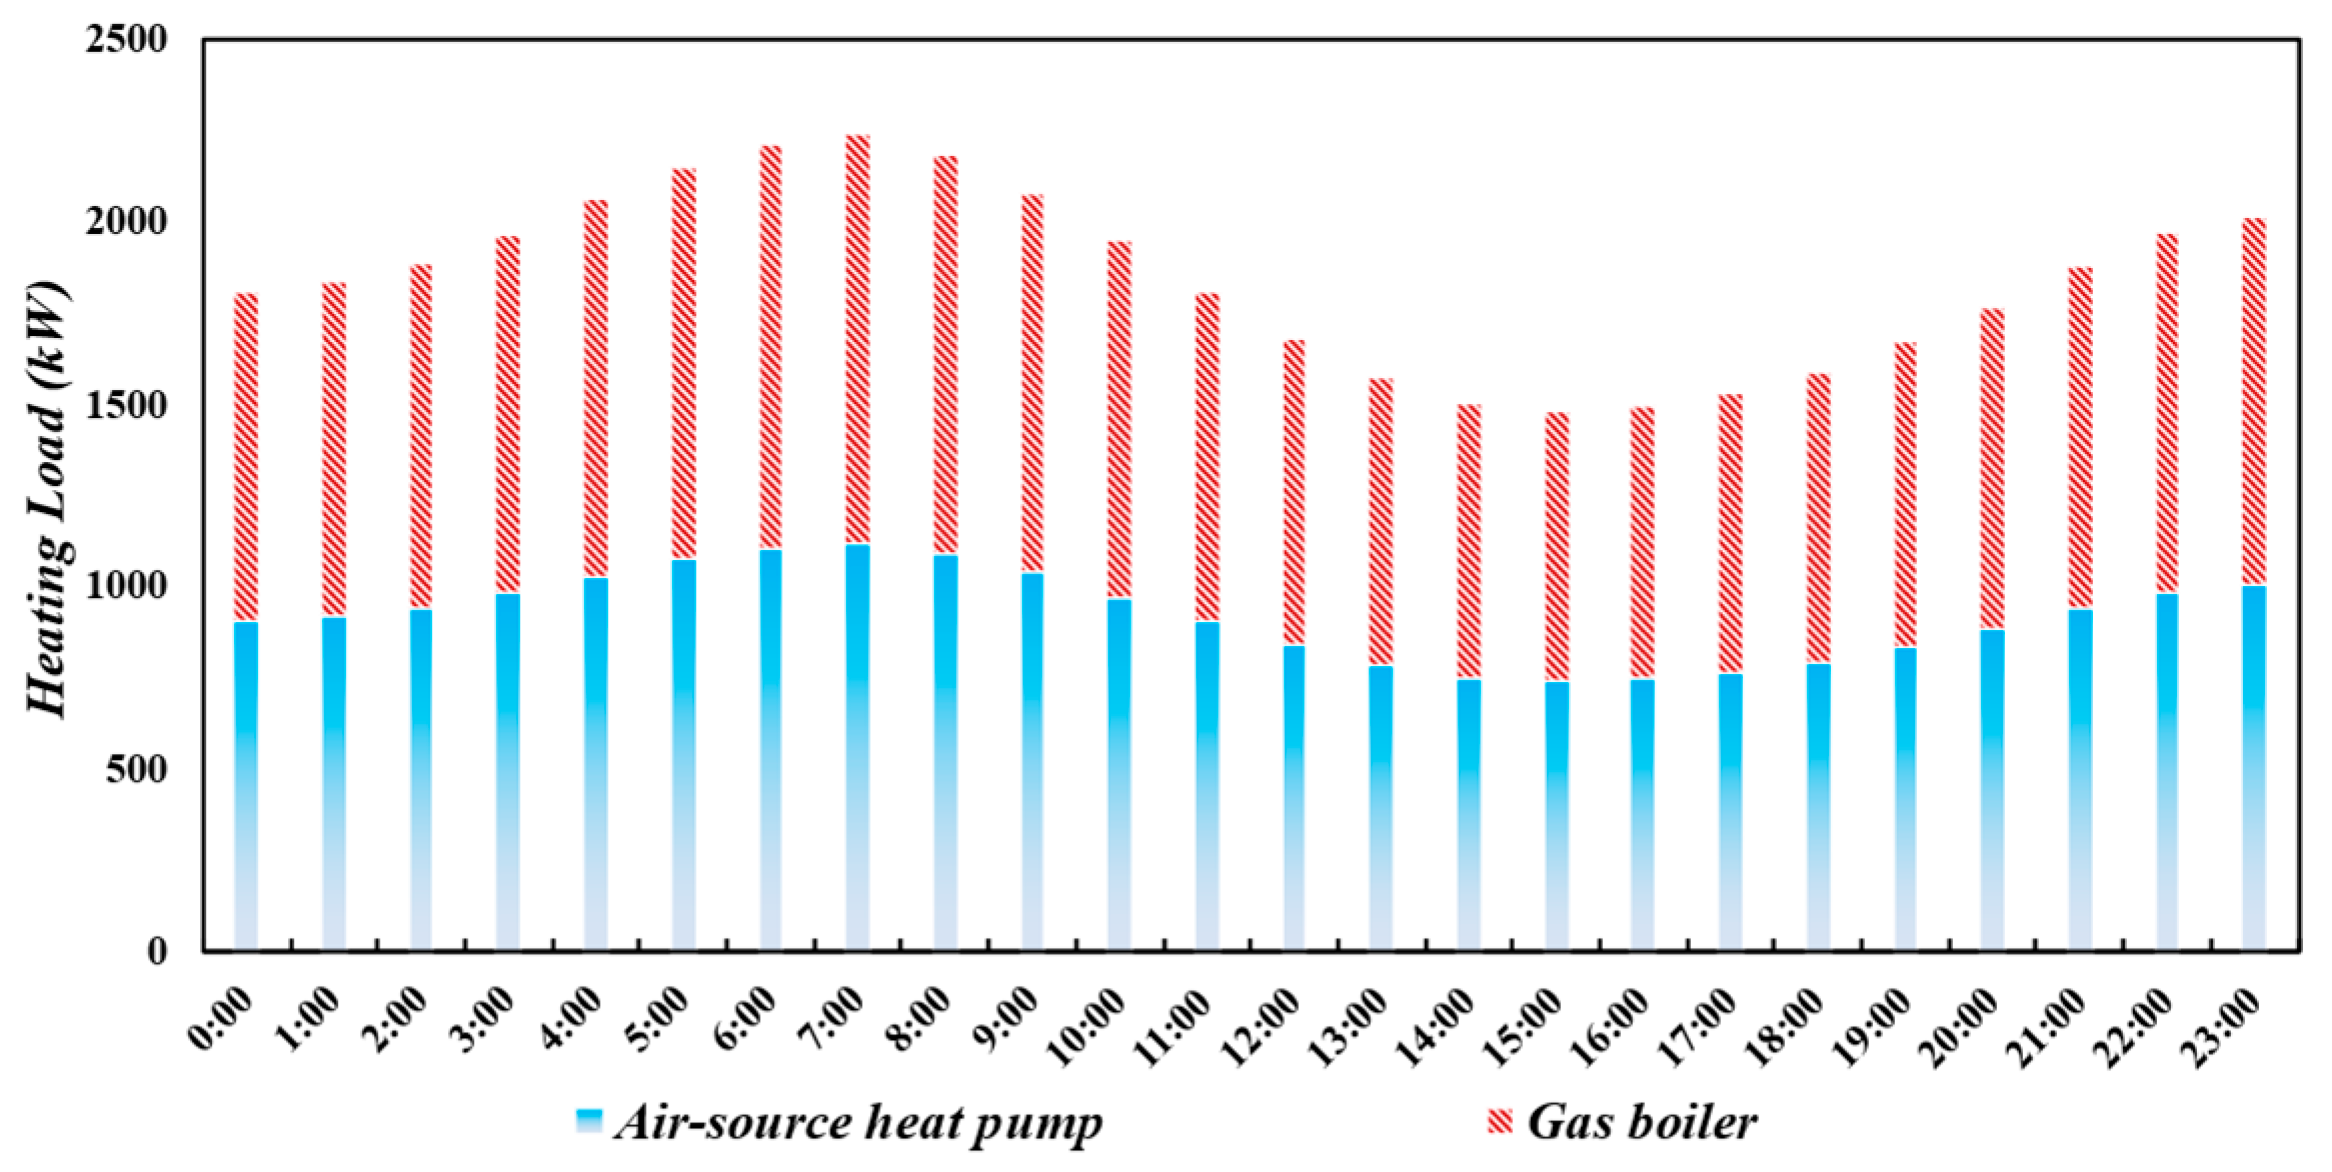
3.1.2. Analysis of Heating Demand on Typical Days

This paper selects typical days in Beijing for analysis. One day was chosen from periods with similar heating loads in both the early and late cold periods, while the peak-load day was selected for the severe cold period. This aims to analyze the variation characteristics of heat demand and the interactions between Ts and Ta across different stages. This paper selects typical days in Beijing for analysis. Figure 7 then shows the variation relationship between the Ts, the heat load, and the Ta at different times during the heating season.
Figure 7a shows the variation in Ts and heating load with Ta on a typical day during the early cold period. From night to early morning, the Ta gradually drops from 3.3 °C to 0.6 °C. The overall heat load rises from 887.3 kW to 1191.9 kW, and the Ts is adjusted from 35 °C to 40 °C. During the daytime, as the Ta rises, the heat load gradually decreases and then the heating system turns off. In the afternoon, as the Ta drops, the heating load increases, and the heating system turns on again with Ts gradually adjusted from 35 °C to 40 °C. Figure 7b then shows the variation in Ts and heating load with the Ta on a typical day during the severe cold period. From night to early morning, the Ta gradually rises from −9.7 °C to −3.1 °C. In order to meet the heating demand, the overall heat load rises from 1810.2 kW to 2244.4 kW, and the Ts is adjusted from 50 °C to 55 °C. During the daytime, the heat load gradually decreases as the Ta rises, and the Ts is adjusted to 45 °C. Then, from the afternoon to night, the heating load increases again as Ta drops, and thus the Ts is adjusted from 45 °C to 50 °C. Figure 7c then shows the variation of Ts and heating load with the Ta on a typical day during the late cold period, where the variation trend is similar to that on typical days during the early cold period.

3.1.3. Analysis of Heating Performance of Air-Source Heat Pump and Gas Boiler Systems

Figure 8 shows the operational performance of ASHPs on typical days in different periods of the heating season. It can be observed that the C O P exhibits a positive correlation with T a . where the average C O P in both the early cold period and the late cold period is higher than that in the severe cold period. Specifically, the average T a in the early cold period and late cold period reaches 6.0 °C and 4.1 °C, and thus the COP of ASHPs reaches 3.9 and 3.7. Then, in the severe cold period, the average T a decreases to −3.9 °C, and the average C O P of ASHPs decreases to 2.7.
Figure 9 then shows the variation in energy costs and CO2 emissions on typical days. Figure 9a shows the electricity costs (Fe) of heat pumps and gas costs (Fg) of boilers on typical days in different periods of the heating season. The average daily Fe values for ASHPs are CNY 3566.7, CNY 14,050.5, and CNY 5991.6, respectively, in the early cold period, severe cold period, and late cold period. The average daily Fg values for gas boilers are CNY 5760.8, CNY 16,611.9, and CNY 9255.5, respectively. Figure 9b then shows the CO2 emissions of ASHPs and gas boilers on typical days. The daily CO2 emissions of ASHPs are 2383.0 kg, 9387.7 kg, and 4003.2 kg, respectively, in the early cold period, severe cold period, and late cold period, while the CO2 emissions of gas boilers are 3553.0 kg, 10,245.7 kg, and 5708.5 kg, respectively.

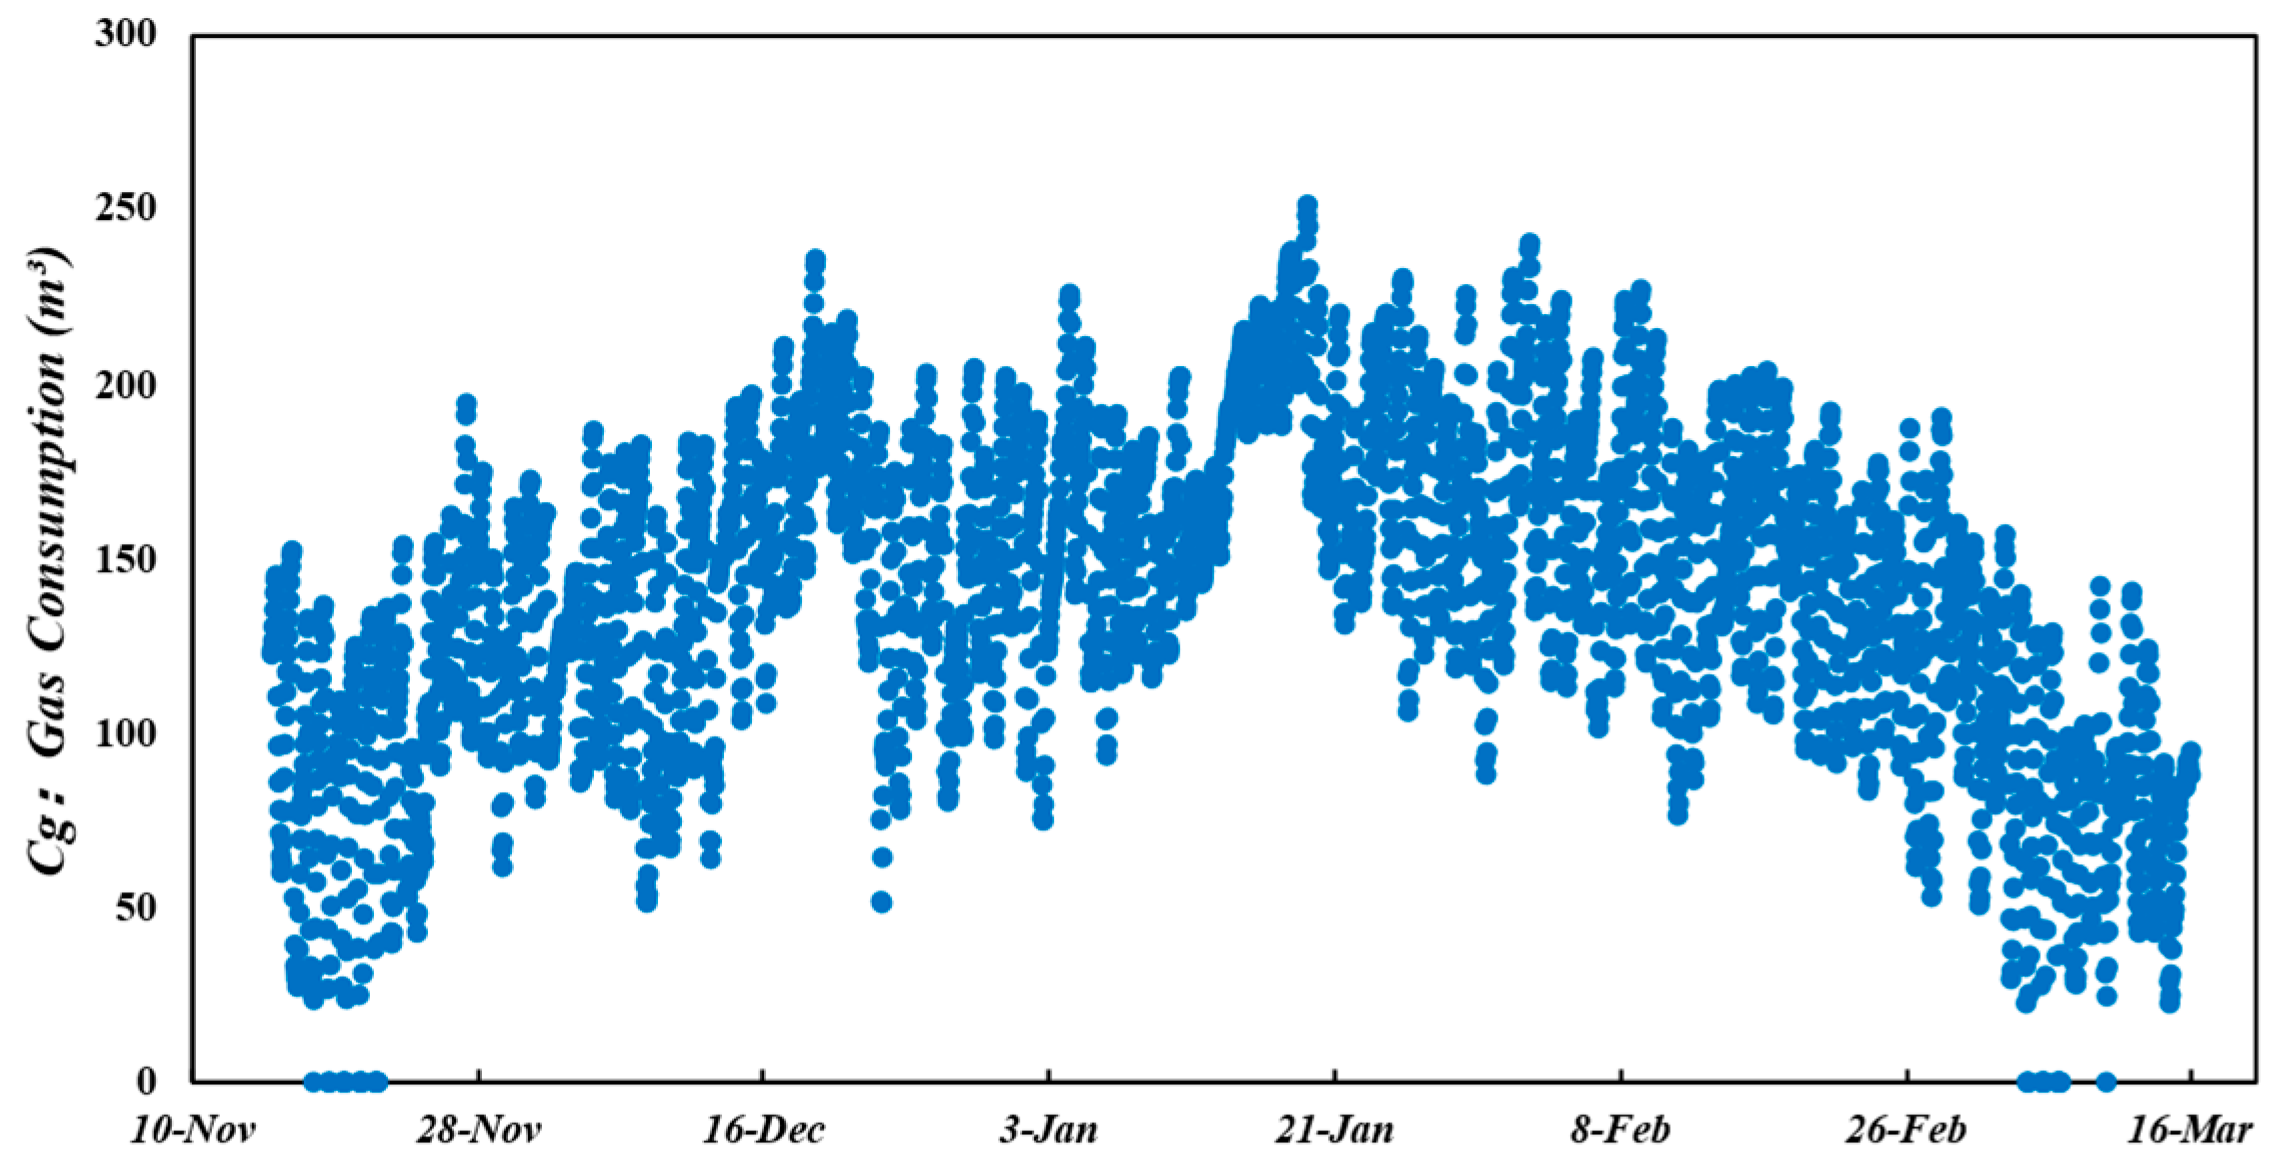
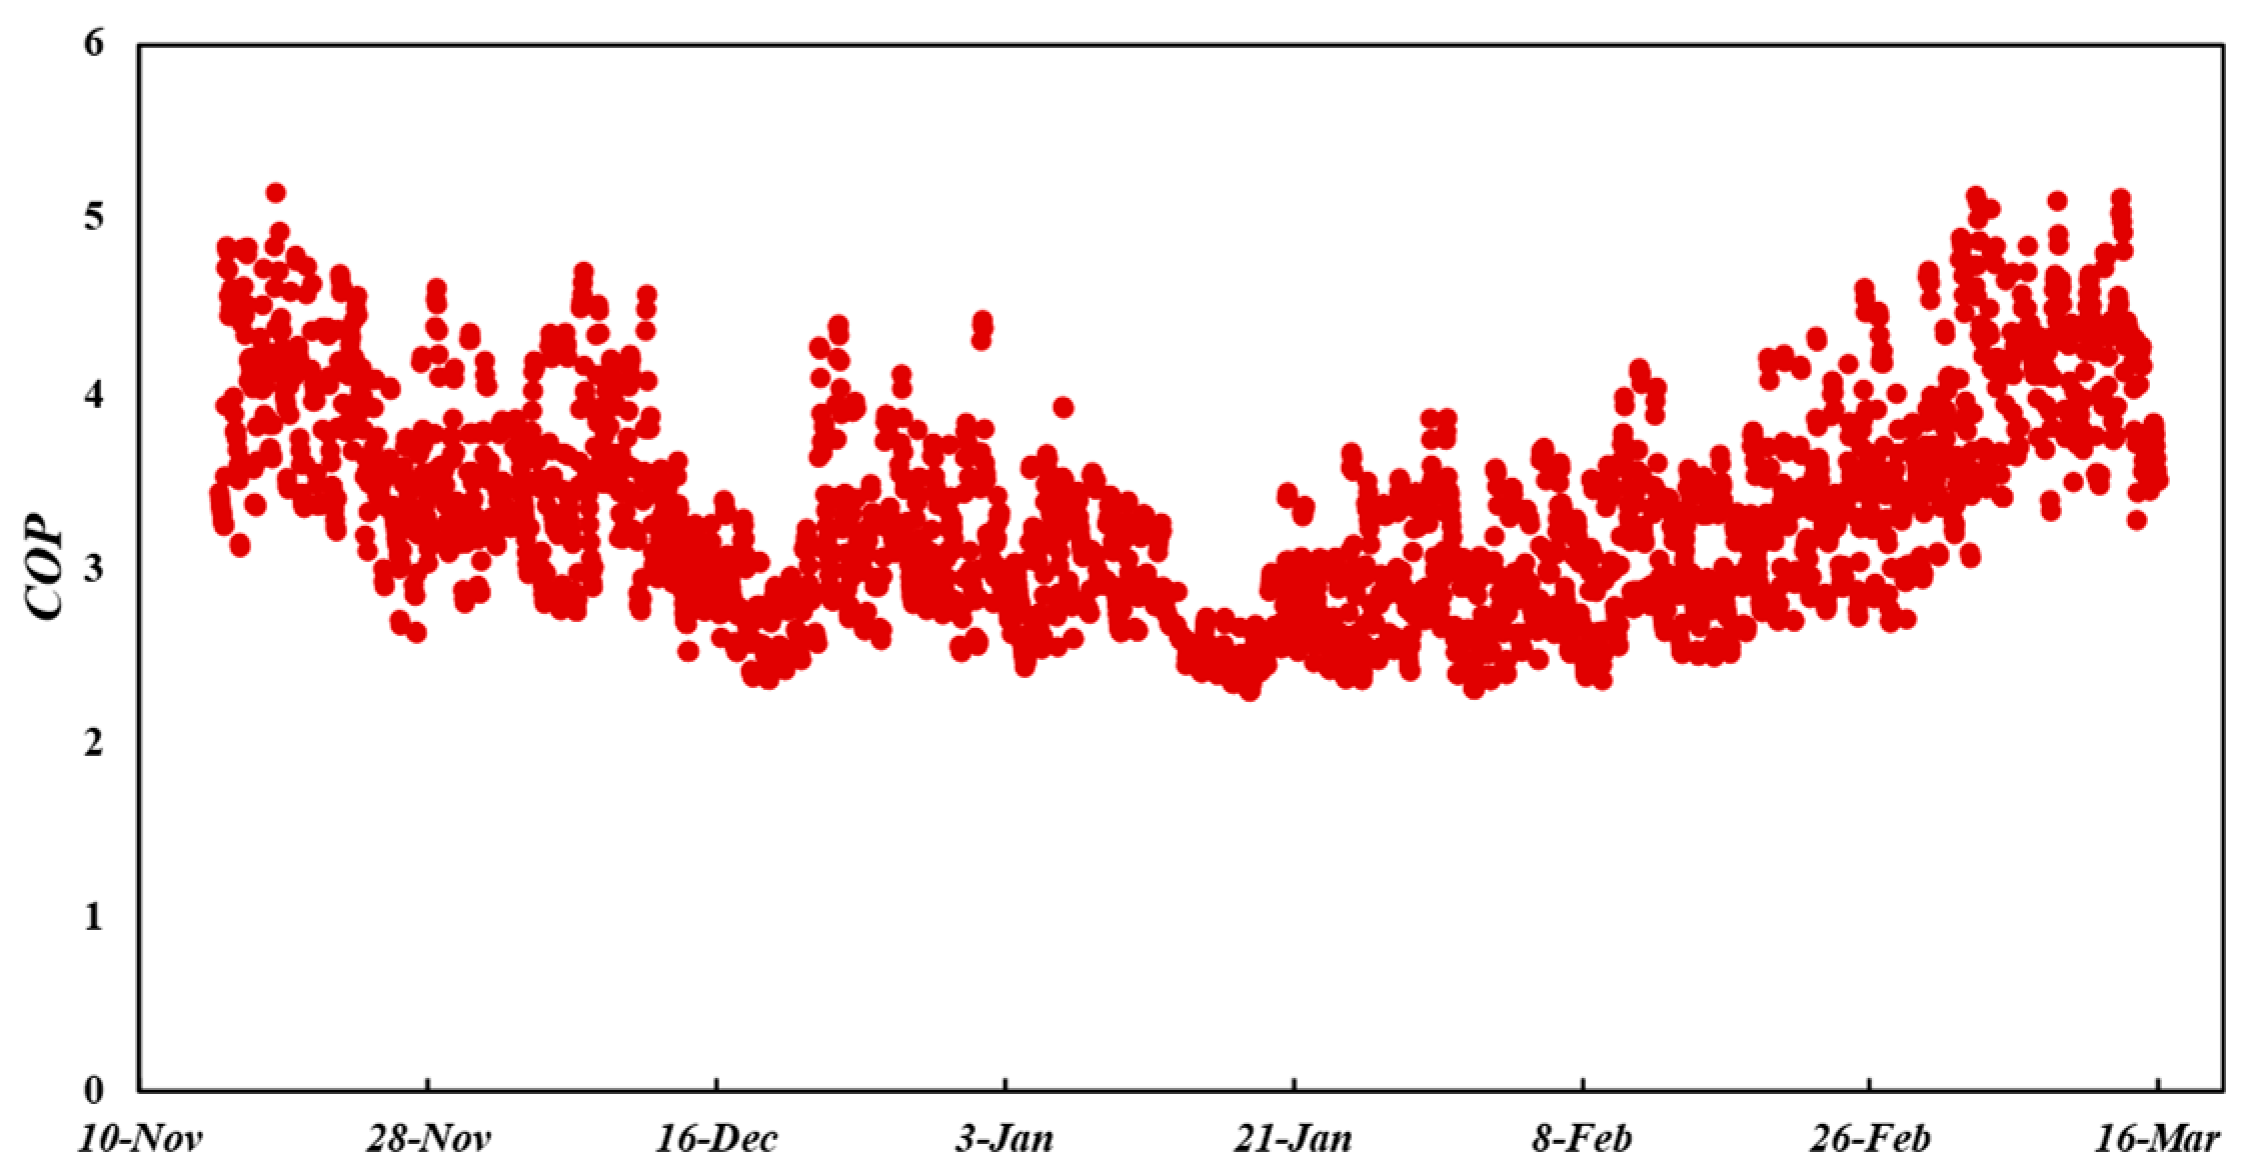
3.1.4. Analysis of Heating Performance During the Heating Season

Figure 10 then shows the Cg during the heating season. The Cg throughout the heating season reaches 404.2 thousand m3, which is equivalent to a PE of 539.3 tons of standard coal (tce). The total cost (FT) is CNY 1.16 million, and the total M amounts to 835.3 tons.
Figure 11 illustrates the variation in COP during the heating season. The average COP throughout the entire heating season is 3.3, and the variation in transient COP shows a significant positive correlation with Ta. In the early cold period, due to the relatively high Ta, COP remains at a high level with a maximum value of 5.2. As the Ta gradually decreases, COP decreases accordingly, reaching a minimum value of 2.19 during the severe cold period. After entering the late cold period, with the rise of Ta, COP gradually increases again. Additionally, the total PE of the heat pump system is 370.0 tce. The FT is CNY 1.00 million, and the total M amounts to 666.1 tons.

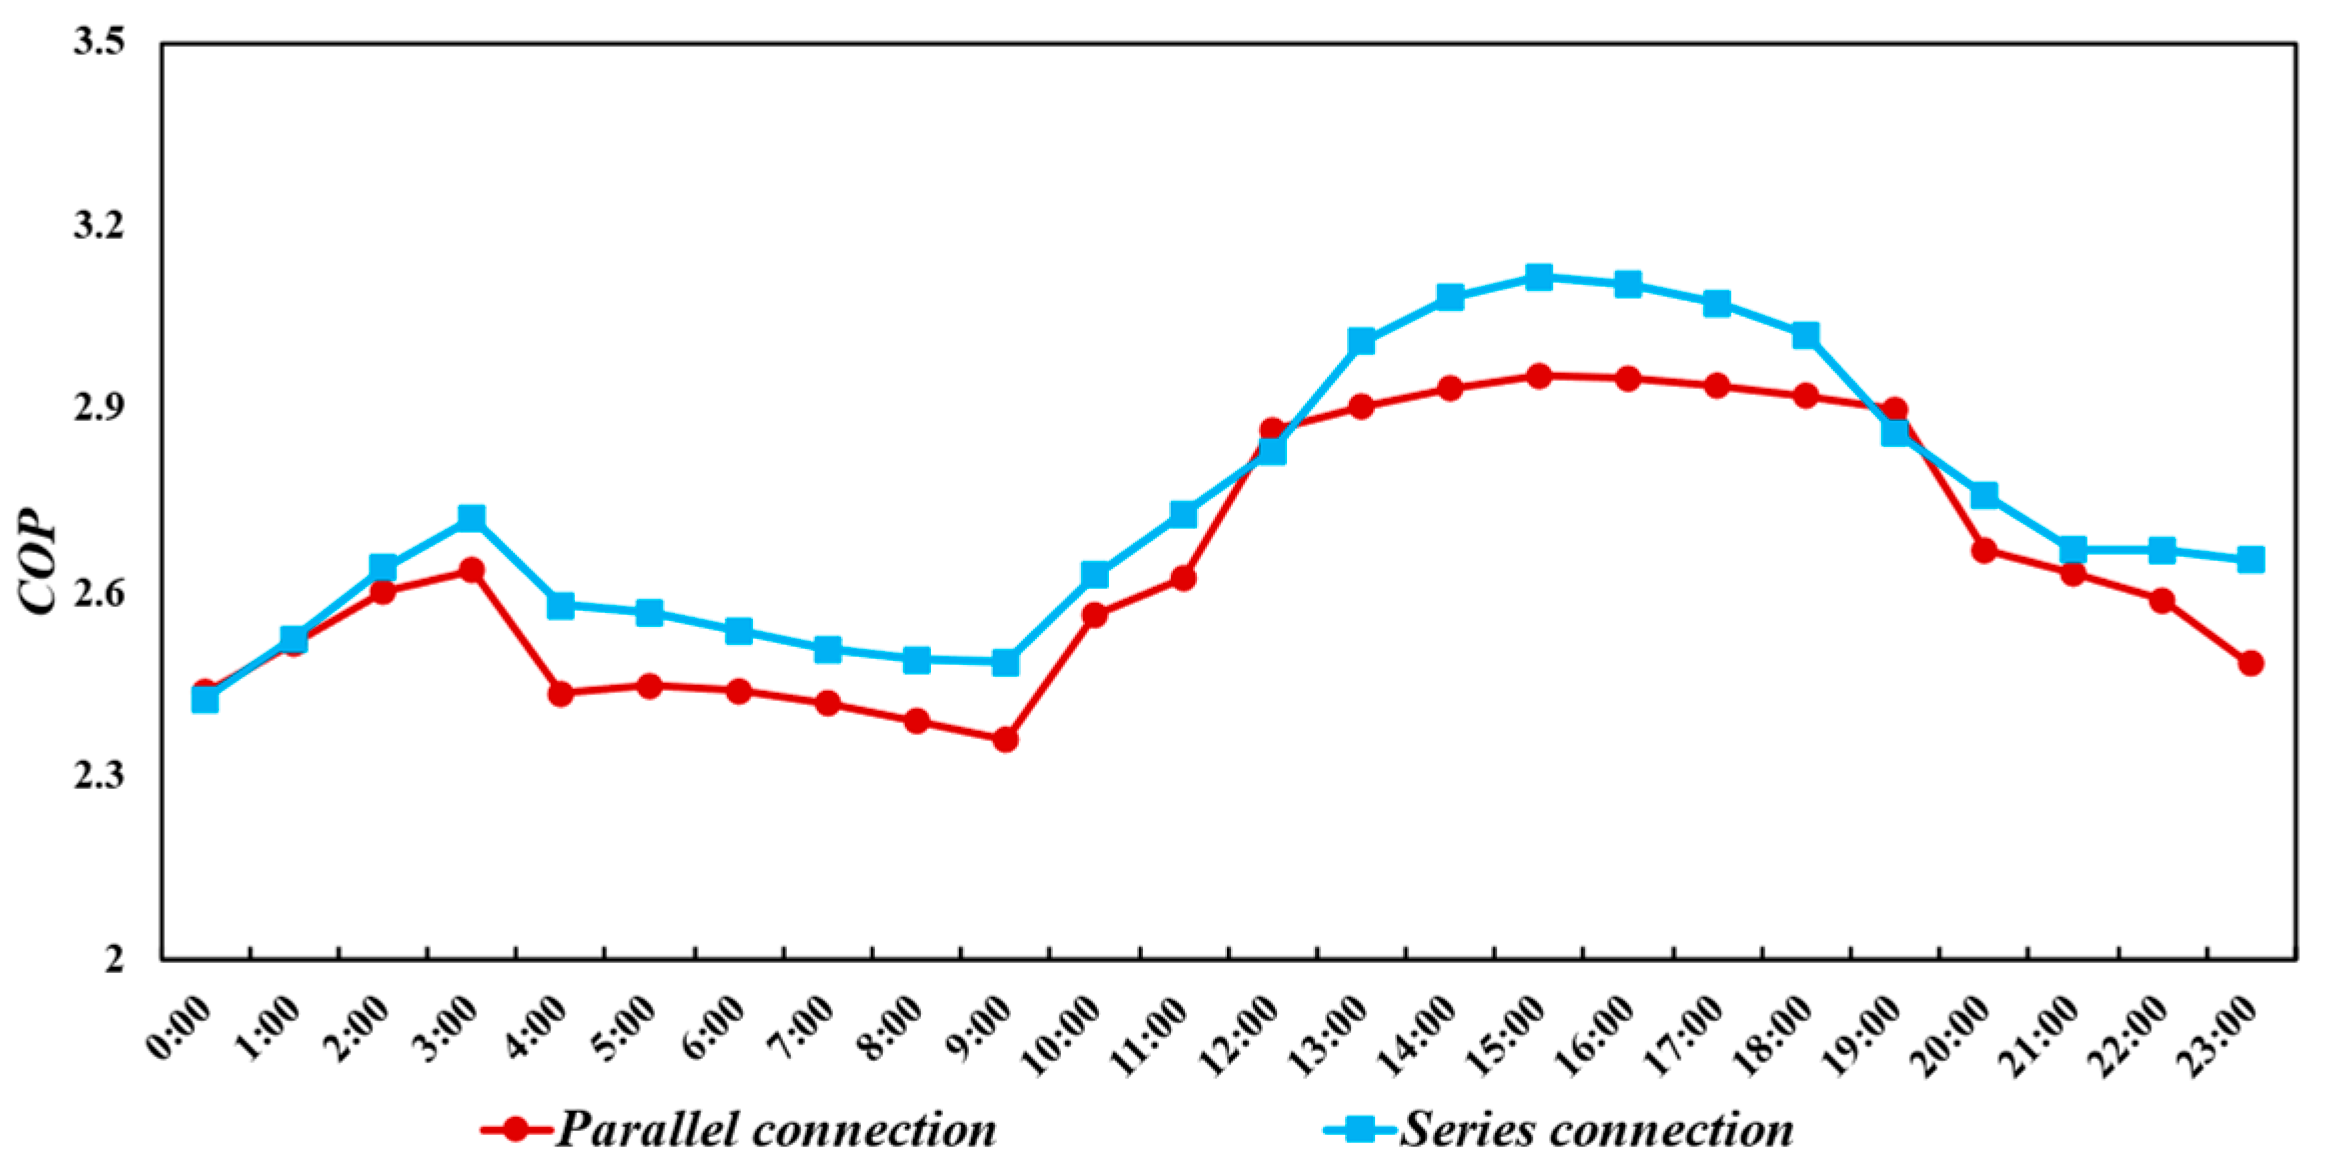
3.2. Analysis fn Heating Performance of Hybrid Systems

This paper then proposes two hybrid modes, with ASHPs and gas boilers connected in series and parallel configurations, and the energy performances of the hybrid systems are studied.
Figure 12a shows the parallel hybrid mode, where the gas boiler and the ASHPs operate in parallel, and the user-side water flow rate distribution ratio represents the heating load distribution ratio. In addition, the Tu and Tr of ASHPs and gas boilers are equal to each other. Figure 12b then illustrates the system coupling model under the series mode, where the user-side return water first undergoes primary heating via the ASHPs, and then is secondarily heated by the gas boilers. Taking a heating load distribution ratio of 50% in both study cases, Table 3 presents the relevant parameters and configuration information of ASHPs and gas boilers under different coupling systems. Both the ASHPs and the gas boiler have a heating capacity of 500 kW.
Figure 13 shows the heating load variation during the severe cold period where the heating load reaches a peak value of 2244.4 kW at 7 a.m. Subsequently, as the Ta gradually rises, the heating load decreases to 1484.6 kW at 3 p.m. In the afternoon, with the decrease in Ta, the heating load increases accordingly. As the ASHPs and gas boilers bear 50% heating load in both series mode and parallel mode, the load variation in the series mode is the same as that in the parallel mode.

3.3. Comprehensive Comparison of Various Schemes

Figure 14 shows the transient operation parameters with peak load, where the Ts and Tr reach 55 °C and 50 °C, with a Ta of −5.3 °C. When the gas boilers and ASHPs operate in parallel, as shown in Figure 14a, the user-side water flow rate is divided equally between ASHPs and gas boilers, resulting in a gas consumption of gas boilers reaching 125.74 m3/h and electric consumption of ASHPs reaching 463.8 kW. In series operation, as shown in Figure 14b, the Tr is heated by ASHPs first from 50 °C to 52.5 °C, and then heated by gas boilers to 55 °C. Notably, the Cg remains 125.74 m3/h, while the CE of ASHPs decreases to 453.2 kW.
Figure 15 then shows the COP of ASHPs in series and parallel modes on a severe-cold day. It can be seen that, due to the low Ta and high heat demand in the early morning, the COP of the ASHPs in series and parallel modes are 2.43 and 2.44, respectively, with little difference. However, at noon, when the Ta rises, the COP of the ASHPs in series mode reaches 3.12, which is higher than COP of the ASHPs in parallel mode with a value of 2.95. The average COP values of the parallel and series modes are 2.65 and 2.73, respectively. Therefore, compared with parallel operation, series operation allows the ASHPs to reduce the Ts and thus achieve a higher COP while meeting the terminal heating demand.
Figure 16 compares FT and M in the heating season in Harbin, Beijing, and Wuhan with two coupled modes. In Harbin, the operation costs of the parallel and series modes are CNY 1.85 and 1.84 million, respectively. In Beijing, the FT of the two modes is CNY 1.09 and 1.07 million, respectively. In Wuhan, the FT of parallel and series mode is CNY 0.69 and 0.69 million, respectively. Overall, the FT of series operation is lower than that of parallel operation. In addition, the operational M of the parallel and series modes reaches 1.20 and 1.19 million kg in Harbin, 0.76 and 0.75 million kg in Beijing, and 0.41 and 0.41 million kg in Wuhan.
In summary, for the series mode, the ASHPs operate with a lower T s , thereby resulting in a higher C O P , with its energy consumption slightly lower than that of the parallel mode. Therefore, in terms of the coupling mode between ASHPs and boilers, the series configuration offers more comprehensive advantages.

4. Discussion

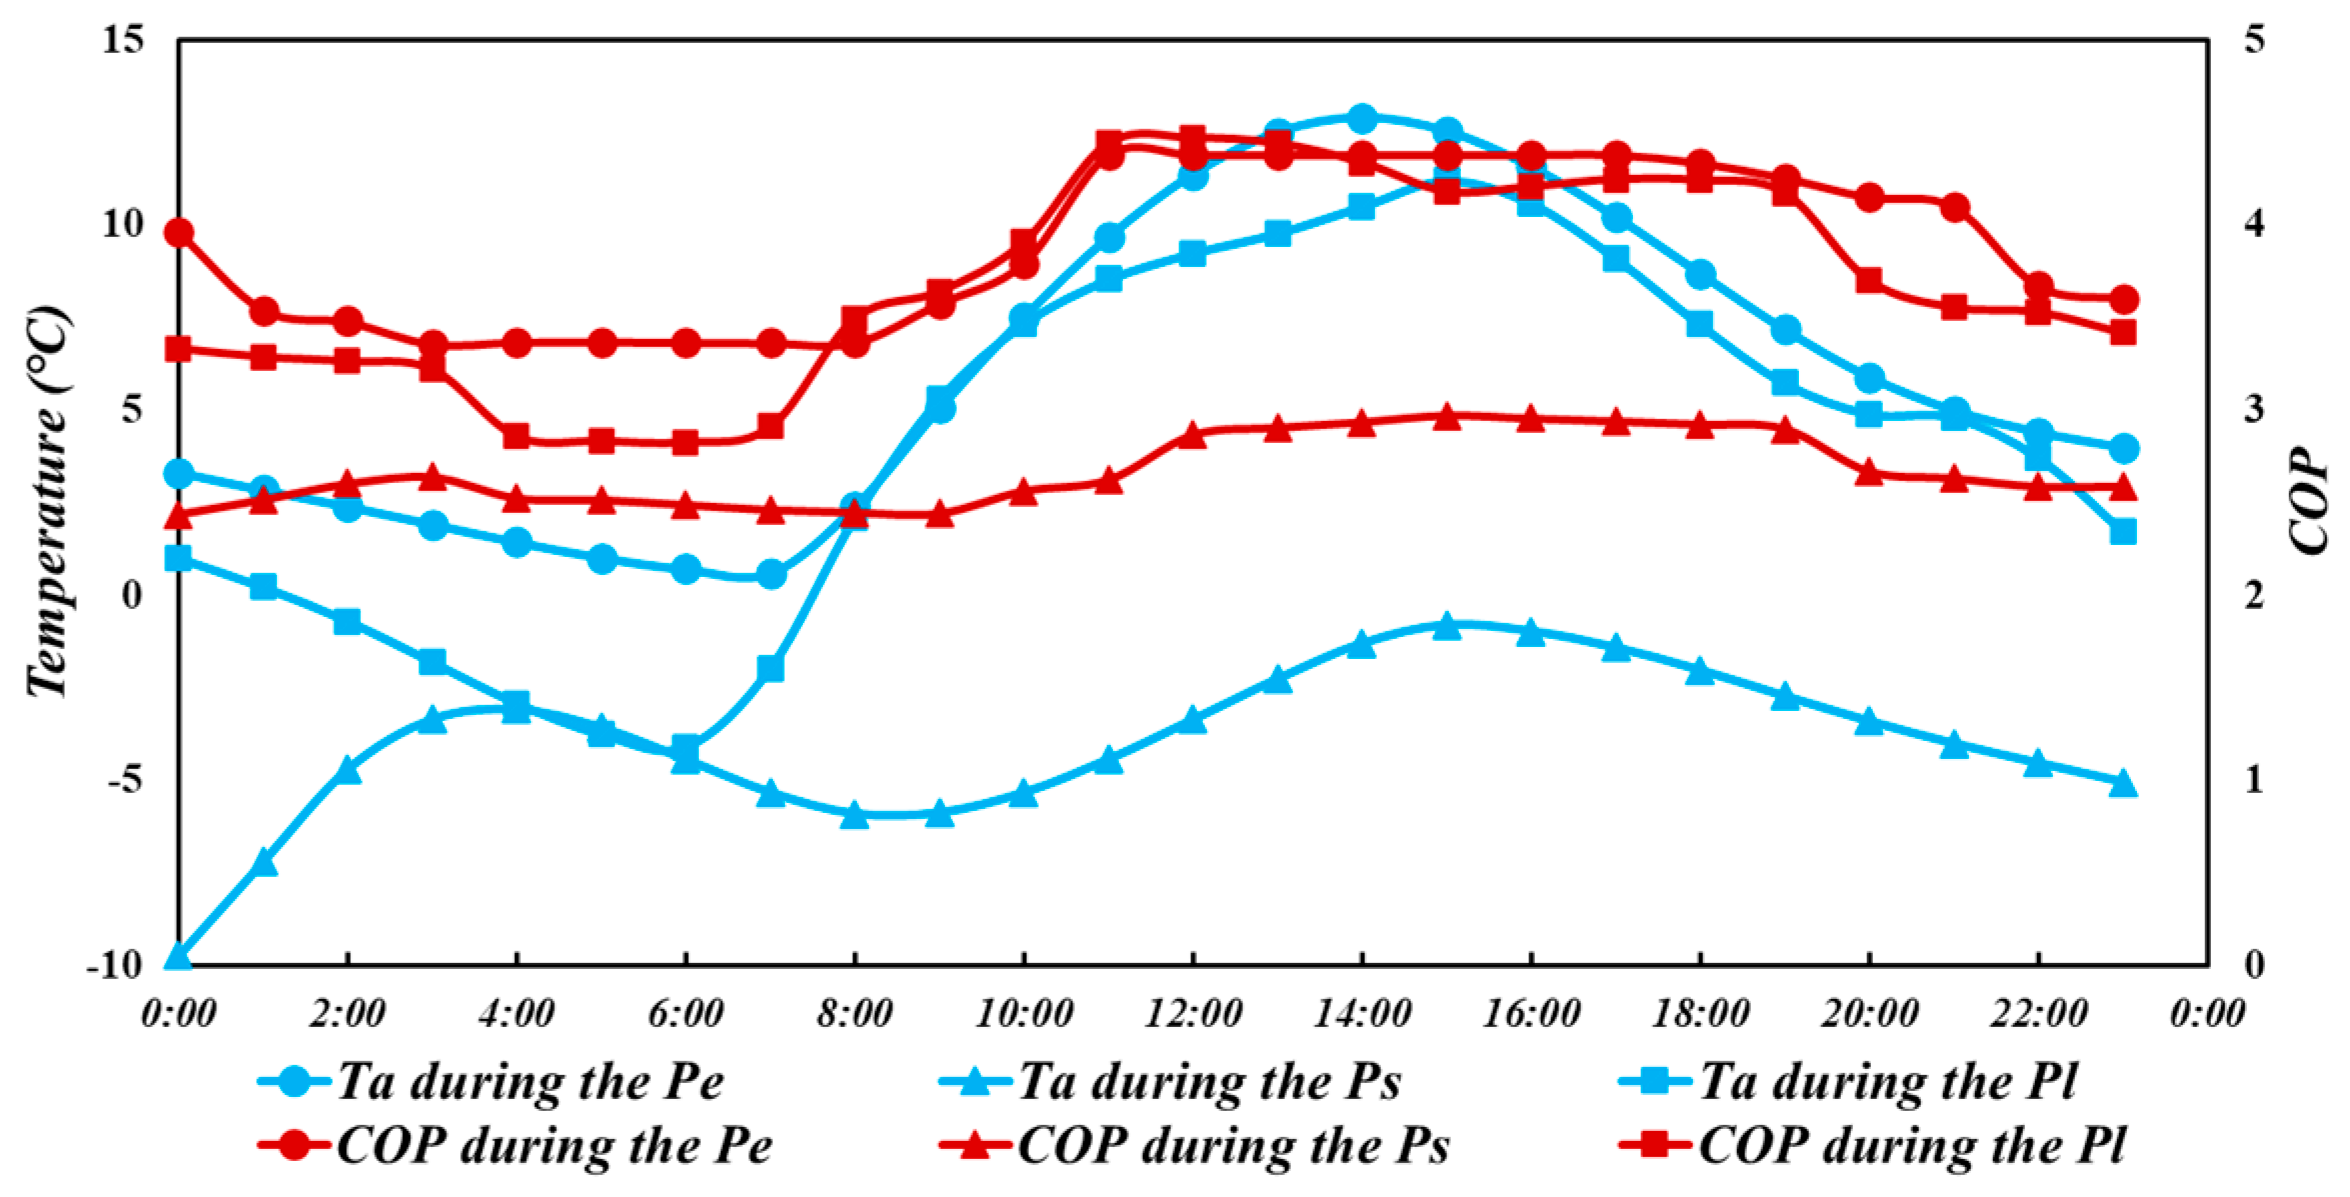
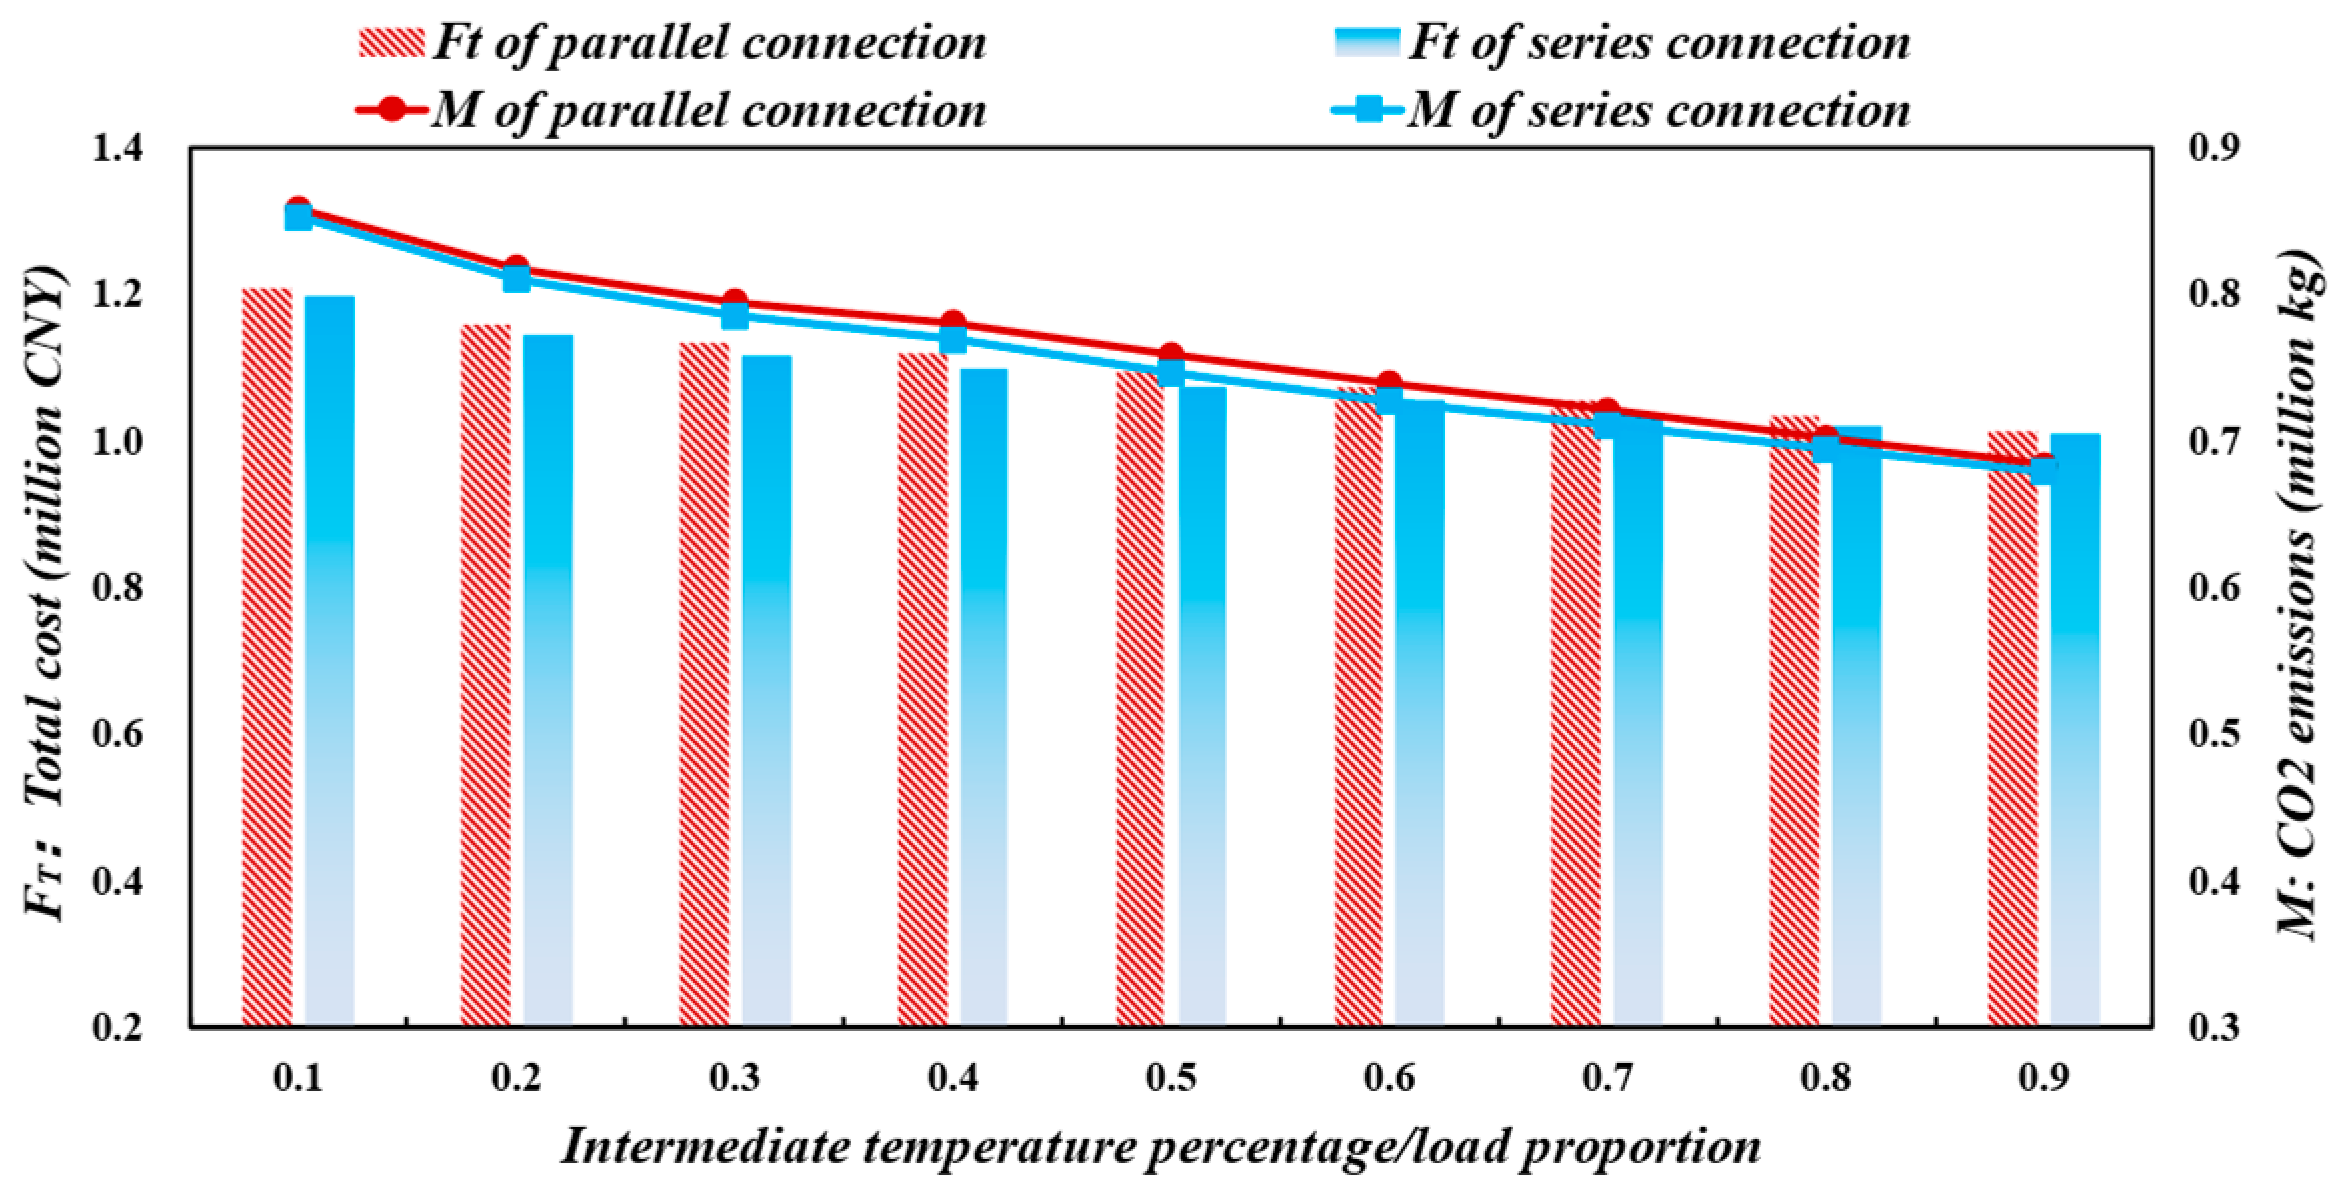
4.1. Comparative Analysis of the Operation Performance of Different Load Distribution Ratios

As previously analyzed, when the heating load distribution ratio is fixed at 50% between ASHPs and gas boilers, the series mode demonstrates better energy performance than the parallel mode. Based on this, this section further studies the operational performance of coupled systems under different load distribution ratios.
Figure 17 compares the FT and M of coupled systems in the heating season, with the heating load distribution ratio of ASHPs ranging from 10% to 90%. Both the FT and M of parallel and series operations exhibit a downward trend with the increase in the heat pump load proportion. Under the parallel mode, when the heat pump load proportion increases from 10% to 90%, the FT decreases from CNY 1.21 to 1.02 million, and the CO2 emissions decrease from 0.86 to 0.68 million kg. In the series mode, within the corresponding load range, the FT decreases from CNY 1.20 to 1.01 million, and the CO2 emissions decrease from 0.85 to 0.68 million kg.

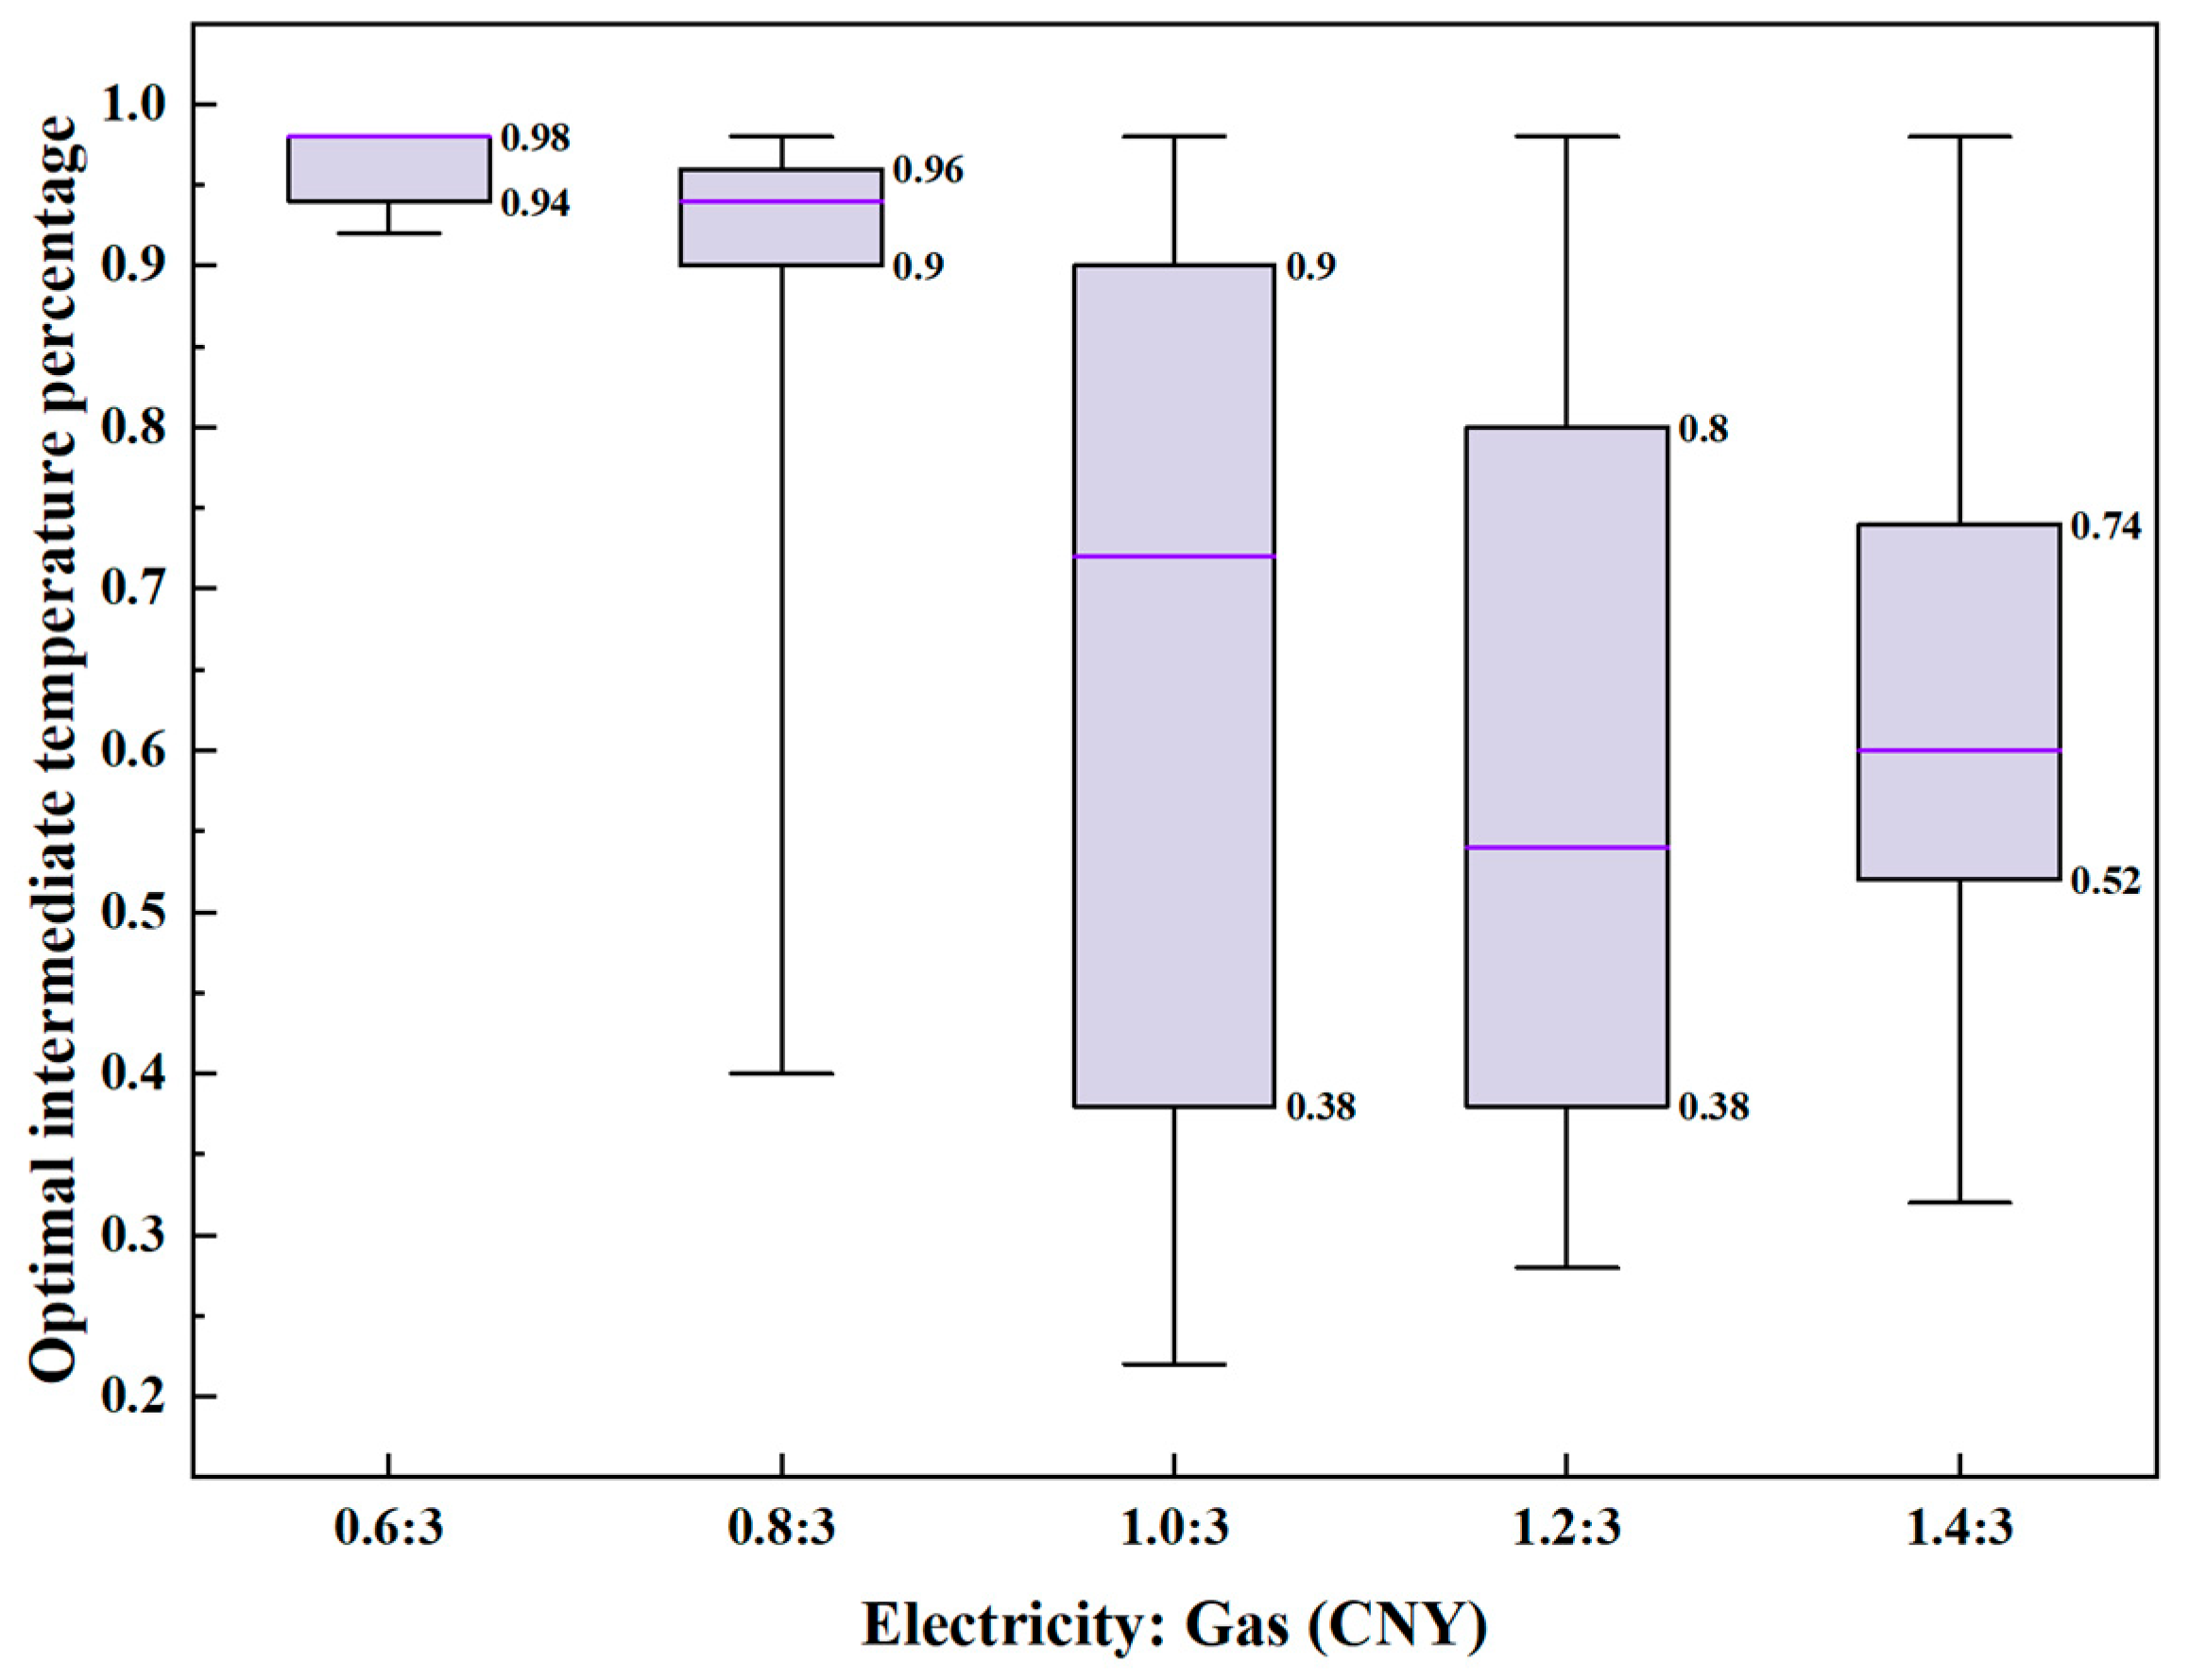
4.2. Analysis of the Optimal Intermediate Temperature in Series Mode

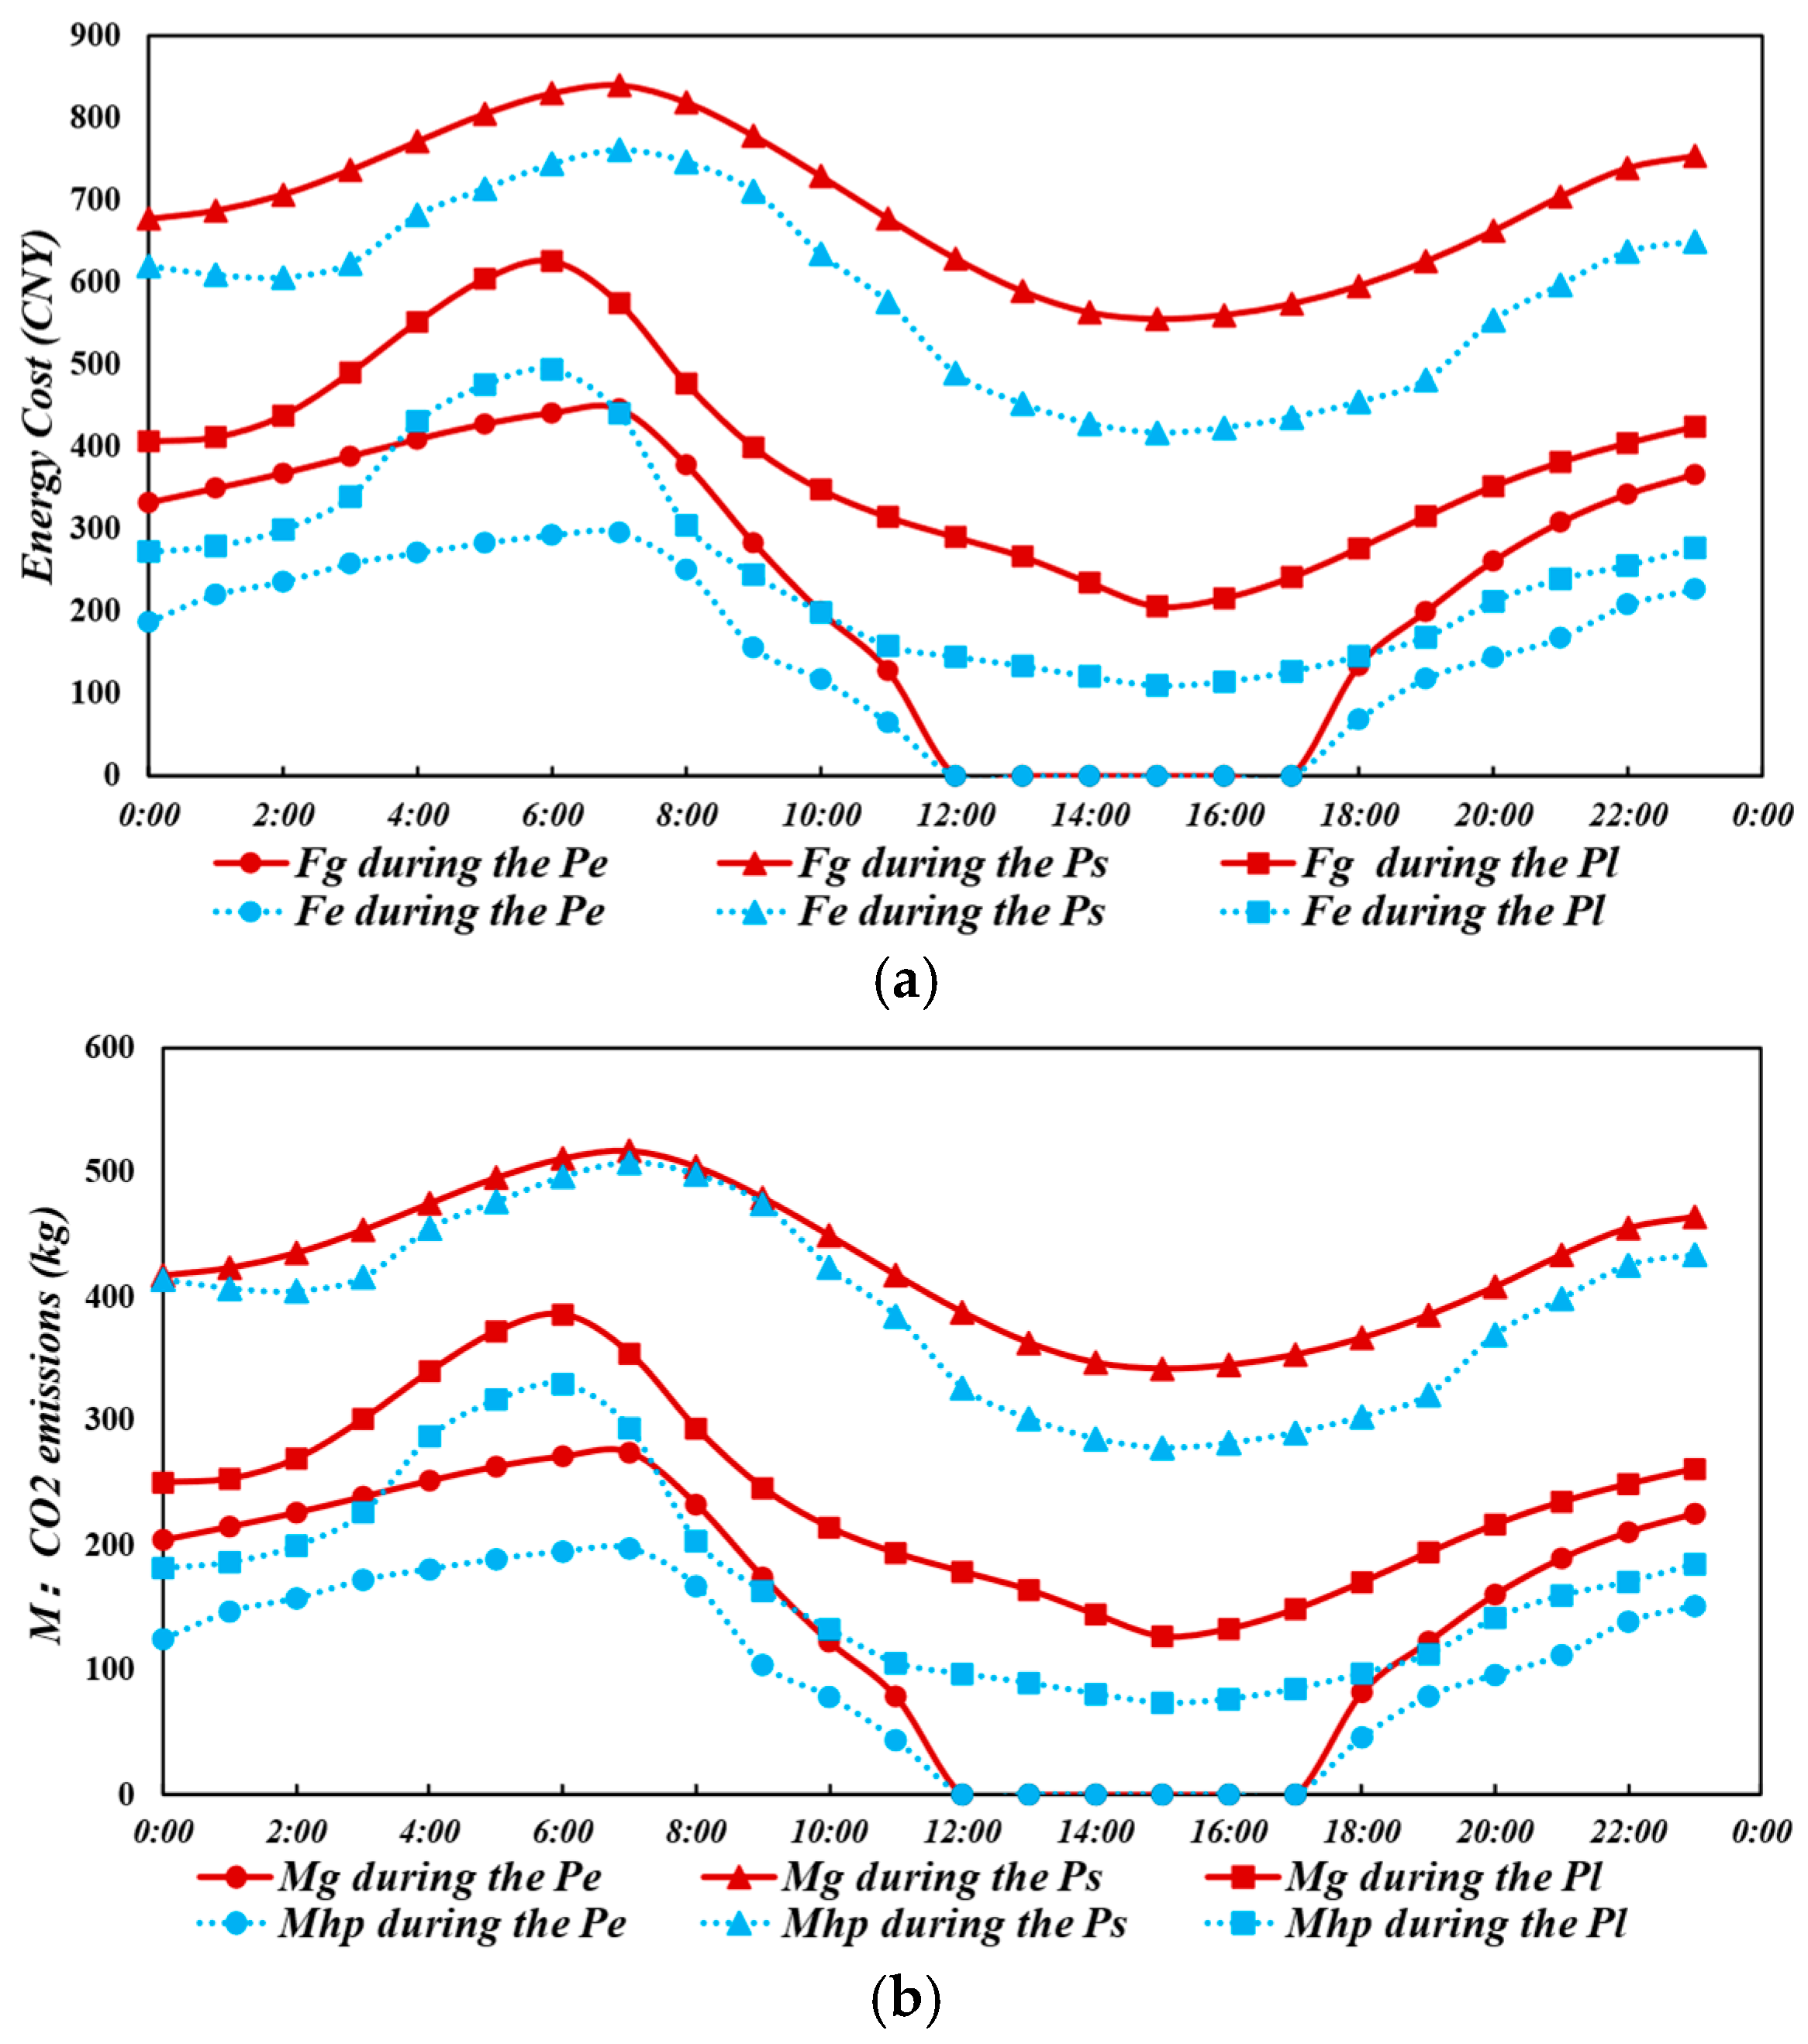
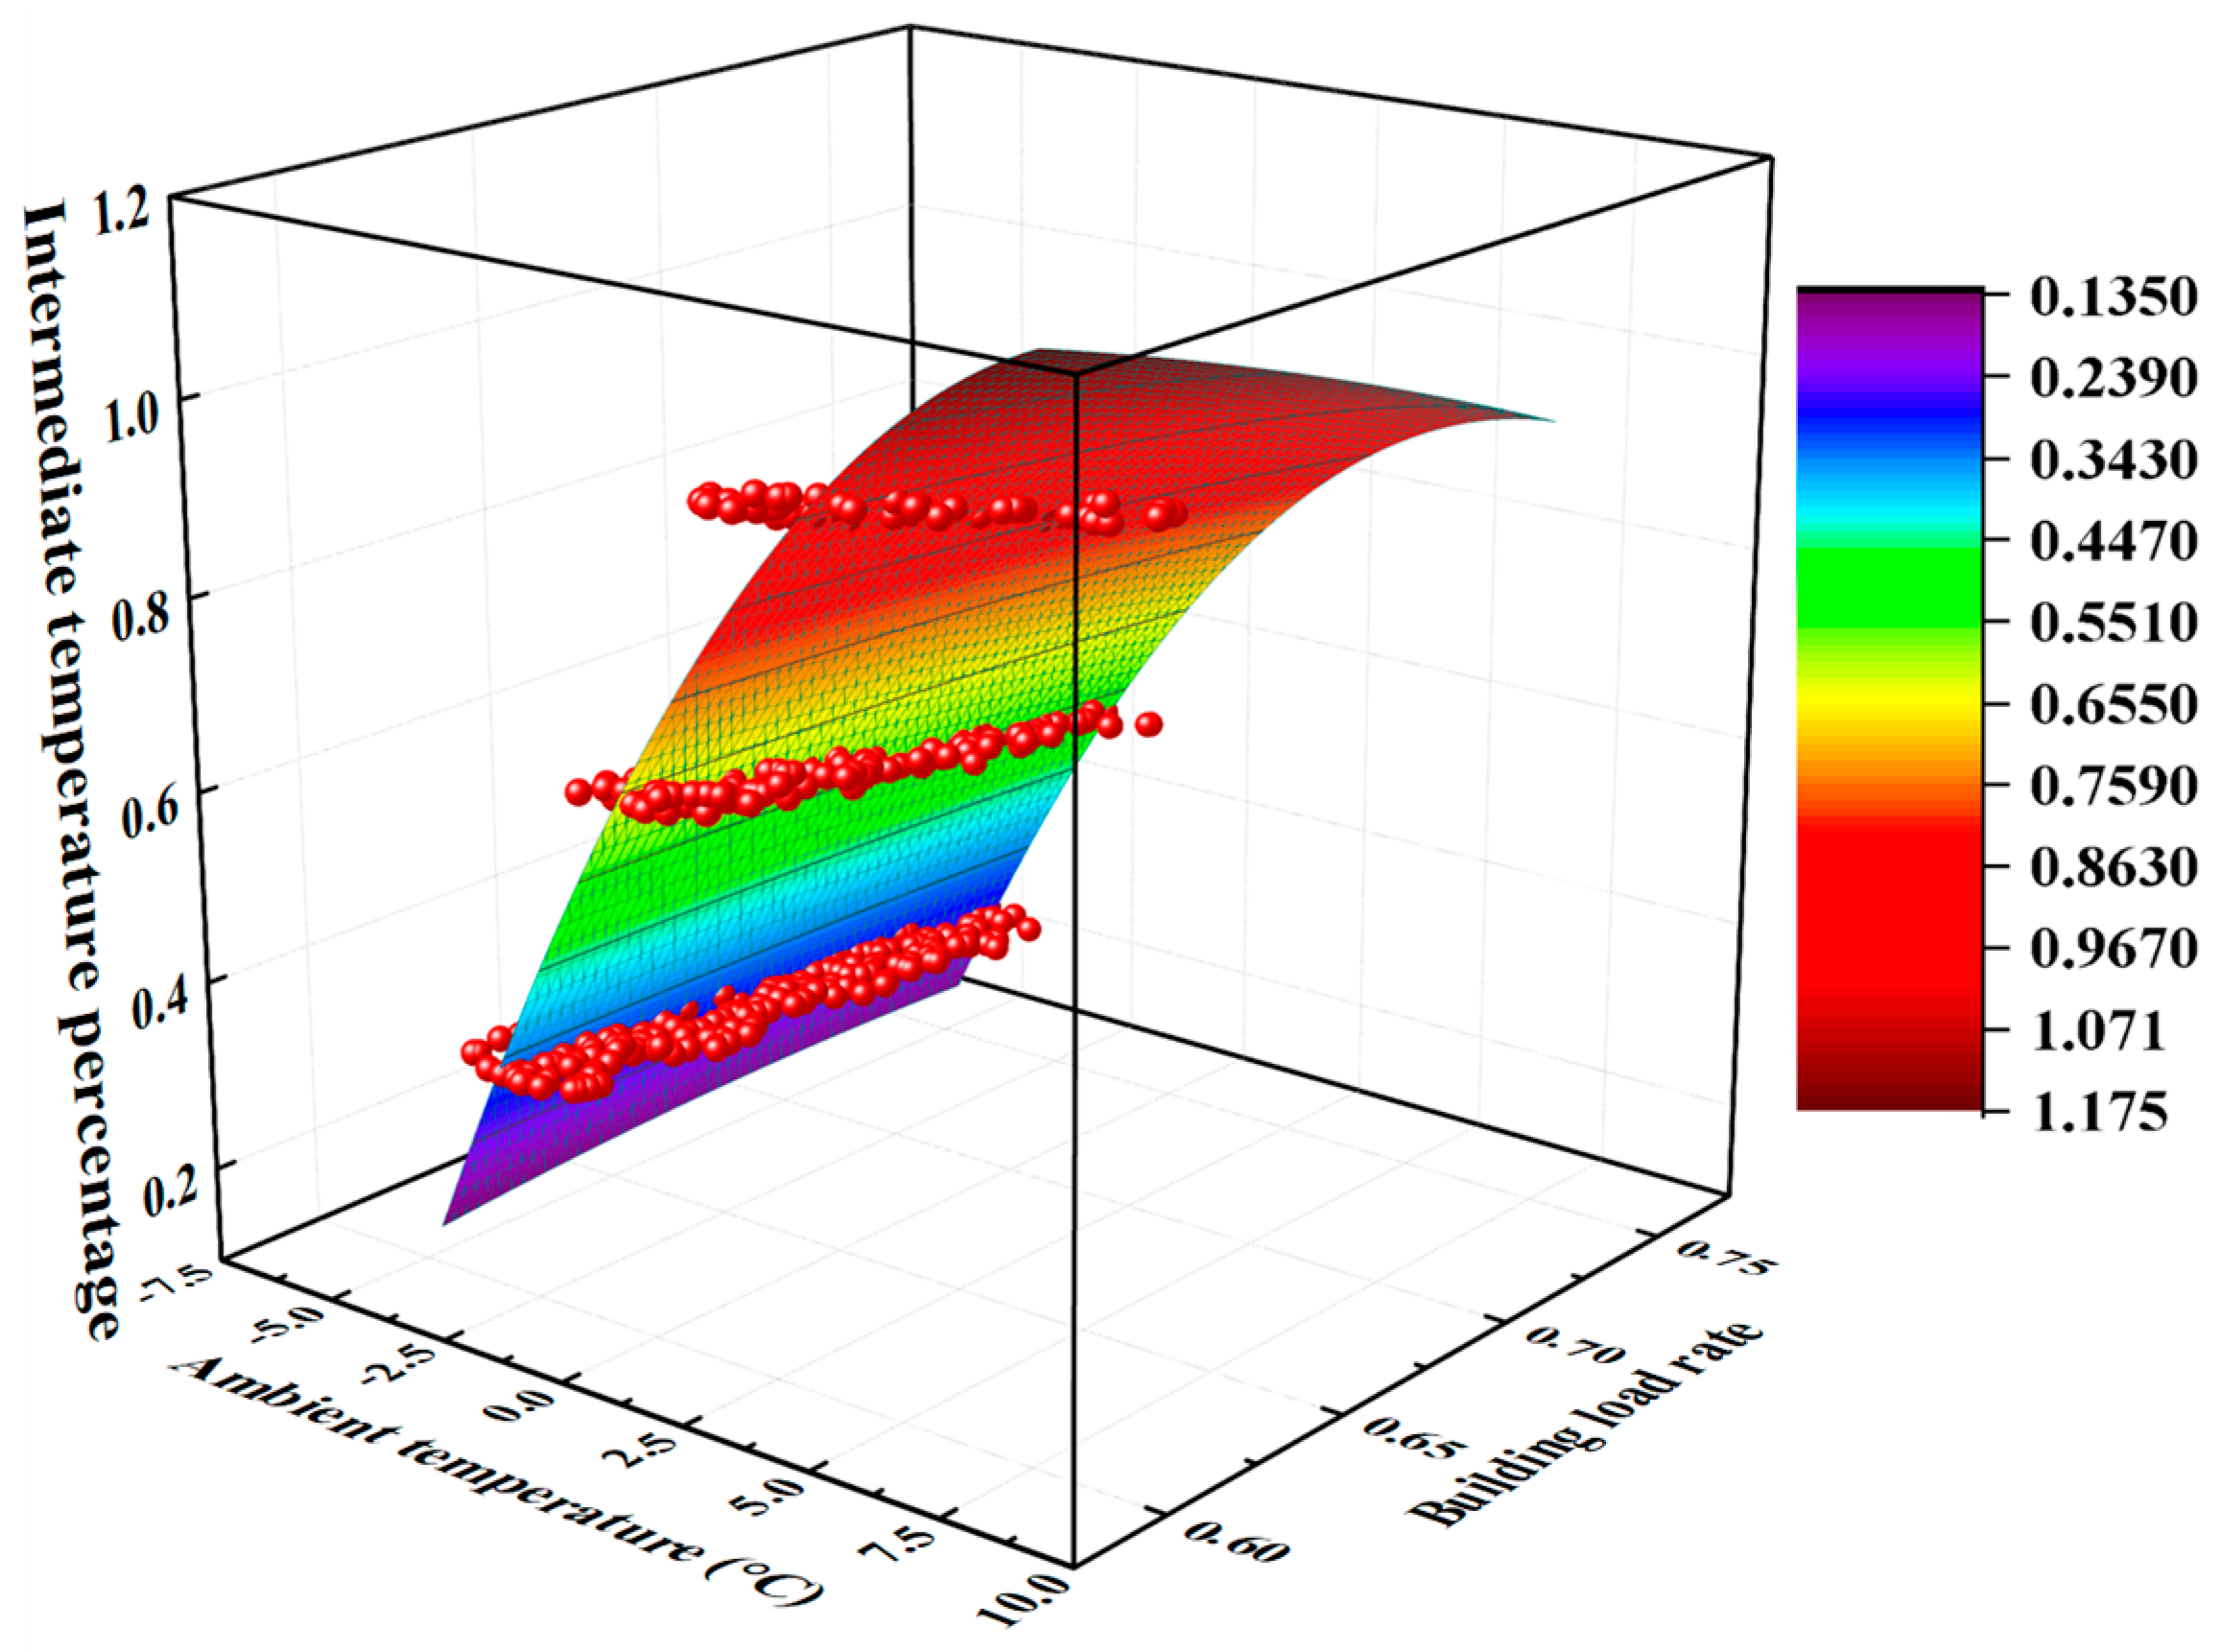
4.2.1. The Optimal Intermediate Temperature Ratio Considering Economic Effect

Figure 18 shows the influence of Ta and building load rate on the optimal intermediate temperature percentage considering economic effect, where the X-axis, Y-axis, and Z-axis represent the Ta, building load rate, and optimal intermediate temperature percentage, respectively, and the color scale corresponds to the numerical values of the intermediate temperature percentage.
Taking a T s of 45 °C as an example, the higher T a and higher building load rate all contribute to the better energy performance of ASHPs, and thus the intermediate temperature percentage should be increased to allow ASHPs to bear more heating load, so as to achieve better economic effects. Specifically, when the T s reaches 35 °C with lower building heating demand, each 1 °C rise in T a increases the intermediate temperature percentage by 0.01, as ASHPs operate more efficiently at high temperature. In addition, when the building load rate increases from 0.6 to around 0.75 with the same T a , the intermediate temperature percentage generally shows an downward trend. As the building load rate increases, the system needs to provide more heat to meet the demand. The primary heating provided by the ASHPs alone is insufficient to reach the required T s . Therefore, it is necessary to decrease the intermediate temperature to allow the gas boiler to conduct more sufficient secondary heating to ensure a T s of 45 °C on the user side.

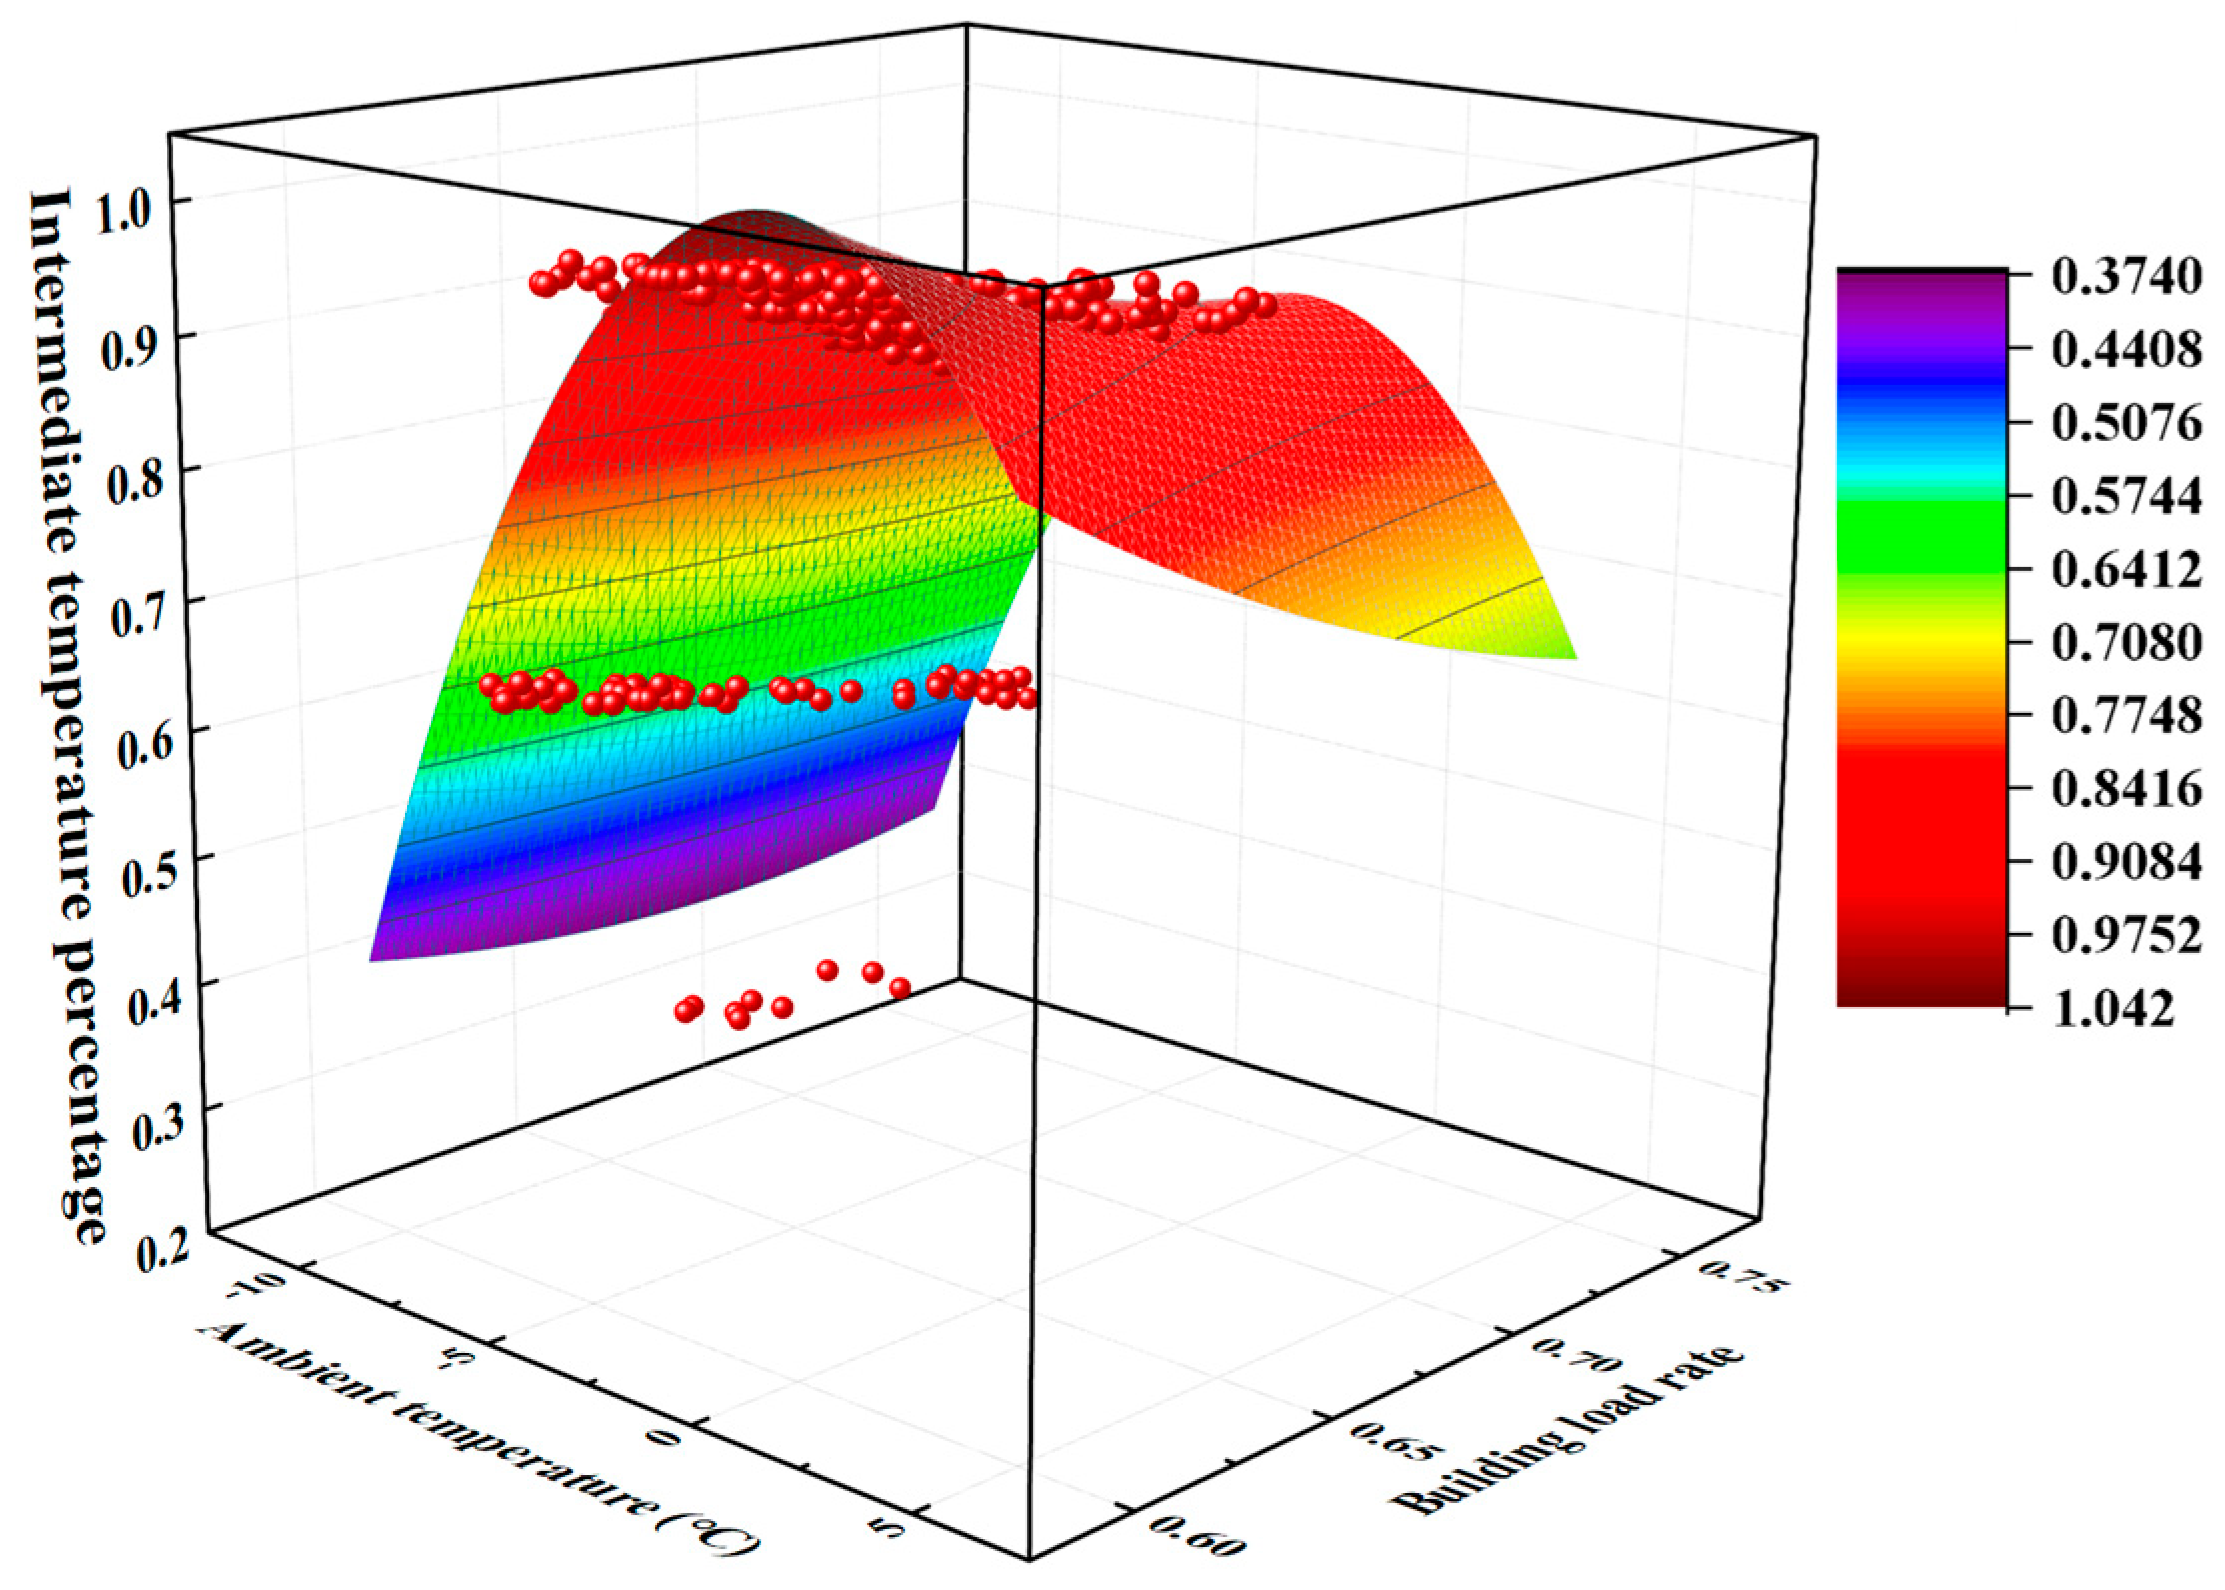
4.2.2. The Optimal Intermediate Temperature Percentage Considering CO2 Emissions

Figure 19 then shows the influence of T a and building load rate on the optimal intermediate temperature percentage considering CO2 emission, taking a T s of 50 °C as a study case, where the X-axis, Y-axis, and Z-axis represent the T a , building load rate, and optimal intermediate temperature percentage, respectively. The red spheres in the figure represent the optimal intermediate temperature percentage, and the color scale corresponds to the numerical values of the intermediate temperature percentage.
In the low-air-temperature and high-load region, the ASHP heating capacity is significantly reduced due to low air temperatures, while the high building load requires the system to provide sufficient heat. In this case, the system can only decrease the intermediate temperature to enable the gas boiler to compensate more heat during secondary heating, ensuring the user-side T s meets the standard. This leads to a significant decrease in the intermediate temperature percentage in this region, forming a bulge in the surface. To achieve the lowest M, the system must find an optimal operational balance point between the ASHPs and the boiler. Under low-air-temperature and high-load conditions, decreasing the intermediate temperature allows the combined ASHP and gas boiler to operate in a more efficient range, reducing energy consumption and M even though this may relatively increase the proportion of boiler usage. In addition, in the high-air temperature and low-load region, the high T a enables the ASHPs to operate with higher energy efficiency. Meanwhile, as the building load is low, the ASHPs can basically meet the heating demand, and the need for auxiliary heating from the gas boiler is minimal. This results in a relatively high intermediate temperature percentage in this region, with gentle changes in the intermediate temperature percentage as T a and load rate vary. The system operates relatively stably in the high-air-temperature and low-load region, primarily relying on the ASHP’s efficient heating to reduce dependence on the boiler, thereby lowering CO2 emissions and ensuring stable system operation. This gentle trend reflects the system’s energy-saving advantages and stable operational characteristics in this region.

4.2.3. The Optimal Intermediate Temperature Percentage Considering Energy Prices

Figure 20 illustrates the distribution of the optimal intermediate temperature percentage under different electricity–gas price ratios. When the price ratio is 0.6:3, the optimal intermediate temperature percentage concentrates at a relatively high level, with a median value of 0.98, indicating that when electricity is relatively cheaper than gas, AHSPs could bear more heating demand, thus decreasing the usage of gas boilers. When the price ratio reaches 0.8:3, the median of the optimal temperature percentage is 0.94, and the overall level remains relatively high, but slightly decreases compared with 0.6:3. When the price ratio is 1:3, the median of the optimal temperature percentage is 0.72, and the change in the electricity–gas price ratio makes the distribution of the optimal temperature percentage more dispersed. When the price ratio is 1.2:3, the median of the optimal temperature percentage is 0.54, and the optimal intermediate temperature percentage decreases as a whole. It can be seen that, as the electricity–gas price ratio increases, the optimal intermediate temperature percentage shows a downward trend, thus the gas boilers should bear more heat supply to decrease the total energy costs.
Figure 21 then illustrates the impact of different electricity carbon emission factors on the optimal intermediate temperature. When the electricity carbon emission factor is between 0.2 and 0.7 kg/kWh, the median of the optimal intermediate temperature is 45 °C. When the carbon emission factor reaches 0.8 kg/kWh, the median of the optimal intermediate temperature is 44.3 °C. In general, as the electricity carbon emission factor increases, the median of the optimal intermediate temperature shows a downward trend, indicating that the electricity carbon emission factor has an impact on the optimal intermediate temperature. The larger the factor, the lower the optimal intermediate temperature may be.

4.2.4. Optimal Intermediate Temperature Multi-Factor Fitting

To better guide the system control, the optimal intermediate temperature percentage at different T s levels considering economy effect and CO2 emission were fitted by previous simulation data, using Equations (8) and (9).
t O I , e = A   ×   T a 2 + B   ×   L R 2 + C   ×   T a   ×   L R + D   ×   T a   + E   ×   L R + F
t O I , C = a   ×   T a 2 + b   ×   L R 2 + c   ×   T a   ×   L R + d   ×   T a + e   ×   L R + f
where t O I , e is the optimal intermediate temperature percentage based on the best economic effect, t O I , C is the optimal intermediate temperature percentage based on the lowest CO2 emissions, T a is the ambient temperature, in °C, L R is the building load rate, and A~F and a~f are the corresponding calculation coefficients. The fitted results are shown in Table 4 and Table 5.
Therefore, with the T a , building load ratio, and T s serving as input parameters, the transient optimal intermediate temperature percentage could be calculated, thus guiding the control of the hybrid system so as to reach the minimum energy costs or the lowest CO2 emission during the heating season.

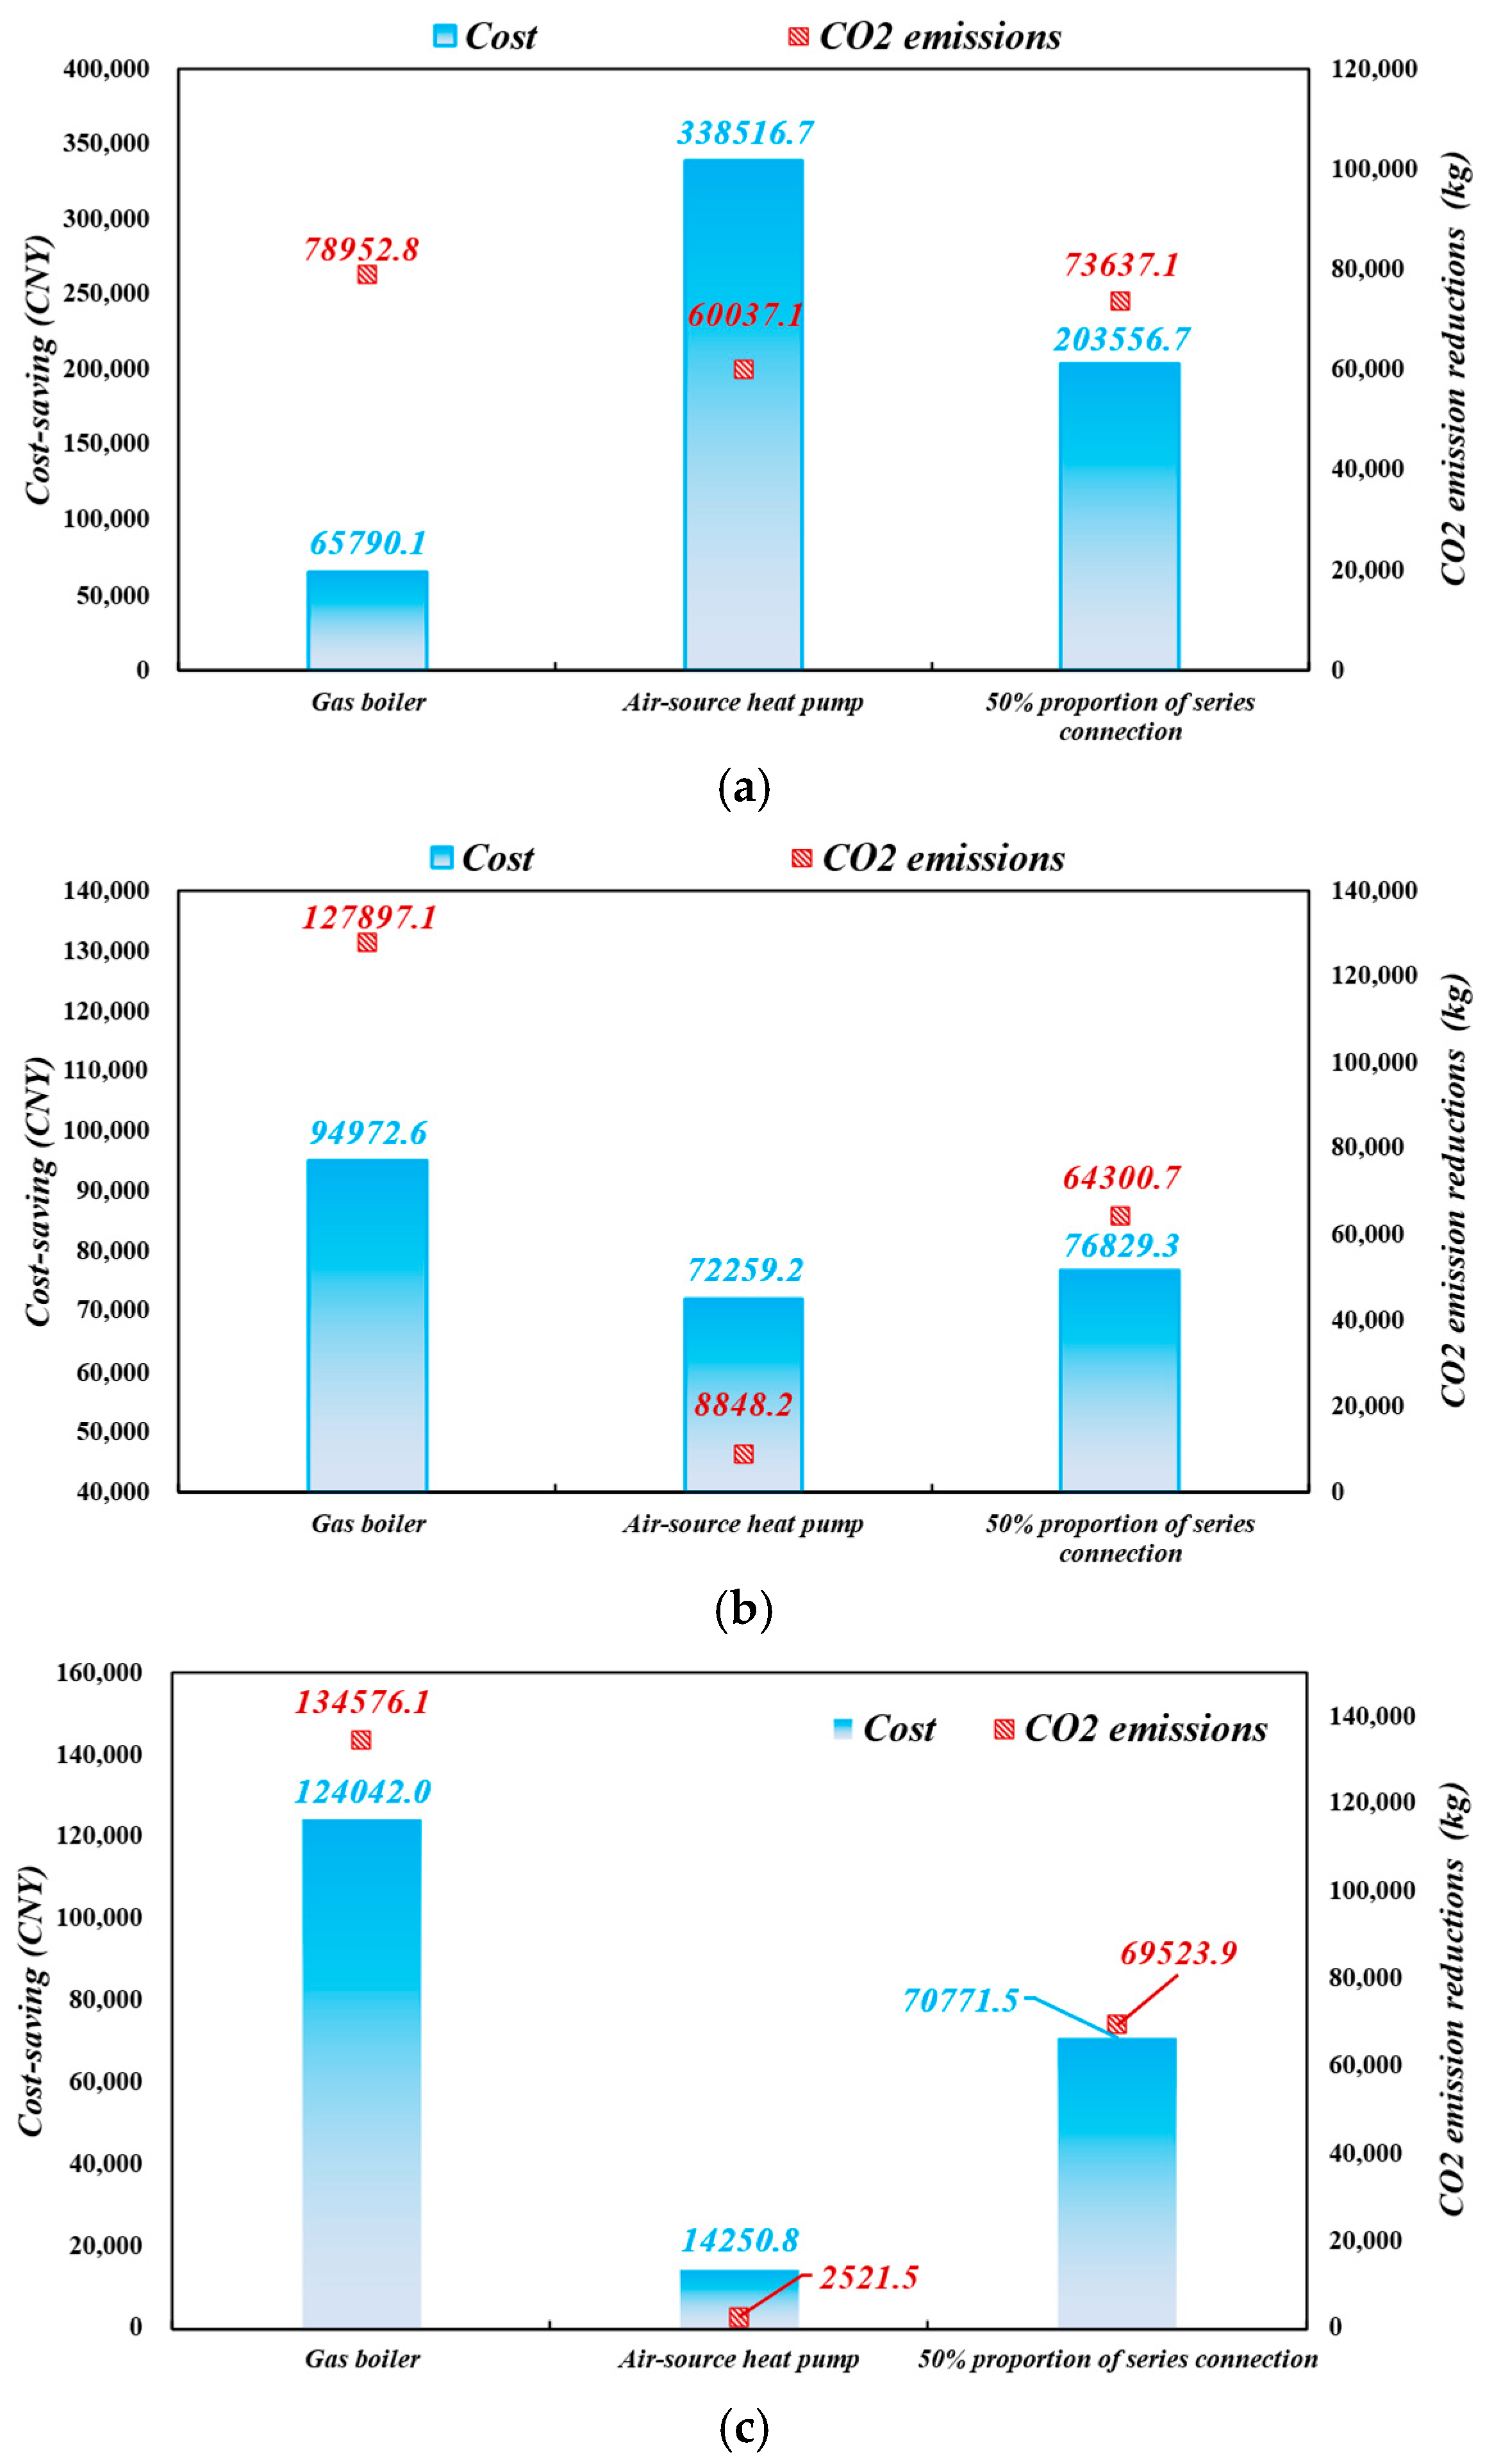
4.3. Analysis of the Cost-Saving and Emission-Reduction Benefits

After obtaining the optimal intermediate-temperature control strategy, the cost-saving and emission-reduction benefits were studied by comparison with a single ASHP system, a single gas boiler system, and a hybrid system with a constant load distribution ratio of 50%. The cost-saving and emission-reduction benefits in studied buildings in Harbin, Beijing, and Wuhan are shown in Figure 22. Results show that compared with the gas boiler scheme, the optimal system saves CNY 65,790.1 with a saving ratio of 20.0%, and reduces CO2 emission by 78.95 tons with a reduction ratio of 3.6%. Compared with the ASHPs system, the optimal system saves CNY 338,516.7 with a saving ratio of 10.0%, and reduces CO2 emission by 60.037 tons with a reduction ratio of 16.1%. Compared with the series mode (fixed 50% load distribution), the optimal system saves CNY 203,556.7 with a saving ratio of 10.0%, and reduces CO2 emission by 73.637 tons with a reduction ratio of 10.4%.
Figure 22b compares the optimal system with other heating schemes throughout the heating season in Beijing. The results show that compared with the gas boiler scheme, the optimal system saves CNY 94,972.6 with a saving ratio of 7.8%, and reduces CO2 emission by 127.90 tons with a reduction ratio of 15.3%. Compared with the ASHP scheme, the optimal system saves CNY 72,259.2 with a saving ratio of 6.1%, and reduces CO2 emission by 8.85 tons with a reduction ratio of 1.2%. Compared with the series mode (fixed 50% load distribution), the optimal system saves CNY 76,829.3 with a saving ratio of 6.4%, and reduces CO2 emission by 64.3 tons with a reduction ratio of 8.3%.
Figure 22c compares the optimal system with three other heating schemes throughout the heating season in Wuhan. The results show that compared with the gas boiler scheme, the optimal system saves CNY 124,042.0 with a saving ratio of 16.2%, and reduces CO2 emission by 134.58 tons with a reduction ratio of 25.67%. Compared with the ASHP scheme, the optimal system saves CNY 14,250.8 with a saving ratio of 2.2%, and reduces CO2 emission by 2.52 tons with a reduction ratio of 0.6%. Compared with the series mode (fixed 50% load distribution), the optimal system saves CNY 70,771.5 with a saving ratio of 10.0%, and reduces CO2 emission by 69.52 tons with a reduction ratio of 15.1%. The comparison reveals that the optimal intermediate-temperature control of the series-connected system outperforms the gas boiler, ASHPs, and fixed 50% load distribution control strategy in both cost savings and CO2 emission reduction.

5. Conclusions

This paper presents a comprehensive analysis of an ASHP and gas boiler hybrid heating system, highlighting its advantages in energy efficiency, cost savings, and carbon dioxide emission reduction across different climate zones in China. The key conclusions are as follows:
(1) The results show that the ASHP operating COP in the series mode is 2.73, higher than 2.65 in the parallel mode, due to lower supply water temperature requirements, leading to slightly reduced energy consumption.
(2) In severe cold regions (e.g., Harbin), the series mode with optimal intermediate-temperature control saves 10.4% in operational costs and reduces CO2 emissions by 10.4% compared to the fixed 50% load distribution series mode. Savings are also evident in cold (Beijing) and hot-summer–cold-winter (Wuhan) regions.
(3) The optimal intermediate temperature in series mode is affected by Ta, load rate, electricity–gas price ratio, and electricity carbon emission factor. Higher Ta and lower electricity prices favor higher ASHP load proportions.
The ASHP–gas boiler hybrid system, particularly in series configuration with adaptive intermediate-temperature control, offers significant energy-saving and cost-reduction potential. Future research should explore flue gas waste heat recovery to further enhance efficiency and reduce NOx emissions, addressing both economic and environmental challenges.

Author Contributions

Y.M.: Conceptualization, Writing—Original Draft. M.M.: Methodology, Writing—Original Draft. S.C.: Software, Validation. H.Z.: Software, Validation. Y.Y.: Investigation. Y.W.: Data Curation. J.D.: Supervision, Funding Acquisition. C.P.: Methodology. All authors have read and agreed to the published version of the manuscript.

Funding

The authors gratefully appreciate the support from the National Natural Science Foundation of China (Grant No. 52308095) and the Natural Science Foundation of Hubei Province of China (Grant No. 2024AFB586).

Institutional Review Board Statement

Not applicable.

Informed Consent Statement

Not applicable.

Data Availability Statement

Data are contained within the article.

Conflicts of Interest

The authors declare no conflicts of interest.

References

  1. Nie, Y.Z.; Deng, M.S.; Shan, M.; Yang, X.D. Clean and low-carbon heating in the building sector of China: 10-Year development review and policy implications. Energy Policy 2023, 179, 113659. [Google Scholar] [CrossRef]
  2. Yuan, M.; Mathiesen, B.V.; Schneider, N.; Xia, J.J.; Zheng, W.; Sorknæs, P.; Lund, H.; Zhang, L. Renewable energy and waste heat recovery in district heating systems in China: A systematic review. Energy 2024, 294, 130788. [Google Scholar] [CrossRef]
  3. Li, W.; Zhang, S.H.; Lu, C. Exploration of China’s net CO2 emissions evolutionary pathways by 2060 in the context of carbon neutrality. Sci. Total Environ. 2022, 831, 154909. [Google Scholar] [CrossRef]
  4. Wang, H.Y.; Gao, L.; Jia, Y. The predicament of clean energy technology promotion in China in the carbon neutrality context: Lessons from China’s environmental regulation policies from the perspective of the evolutionary game theory. Energy Rep. 2022, 8, 4706–4723. [Google Scholar]
  5. Deng, J.W.; Su, Y.Y.; Peng, C.W.; Qiang, W.B.; Cai, W.L.; Wei, Q.P.; Zhang, H. How to improve the energy performance of mid-deep geo-thermal heat pump systems: Optimization of heat pump, system configuration and control strategy. Energy 2023, 285, 129537. [Google Scholar] [CrossRef]
  6. Cui, P.; Yang, W.B.; Zhang, W.K.; Zhu, K.; Spitler, J.D.; Yu, M. Advances in ground heat exchangers for space heating and cooling: Review and perspectives. Energy Built Environ. 2024, 5, 255–269. [Google Scholar] [CrossRef]
  7. Wei, Z.; Calautit, J. Evaluation of model predictive control (MPC) of solar thermal heating system with thermal energy storage for buildings with highly variable occupancy levels. Build. Simul. 2023, 16, 1915–1931. [Google Scholar] [CrossRef]
  8. Da, J.; Li, M.; Li, G.; Wang, Y.; Zhang, Y. Simulation and experiment of a photovoltaic—Air source heat pump system with thermal energy storage for heating and domestic hot water supply. Build. Simul. 2023, 16, 1897–1913. [Google Scholar] [CrossRef]
  9. Deng, J.W.; Peng, C.W.; Su, Y.Y.; Qiang, W.B.; Cai, W.L.; Wei, Q.P. Research on the heat storage characteristic of deep borehole heat exchangers under intermittent operation mode: Simulation analysis and comparative study. Energy 2023, 282, 128938. [Google Scholar] [CrossRef]
  10. Deng, J.W.; Wang, Y.H.; Su, Y.Y.; Wang, Y.G.; Chen, Y.; Ma, M.H.; Peng, C.W.; Cai, W.L.; Li, J.; Wei, Q.P. Research on the natural circulation characteristic of deep borehole heat exchanger and the influences on the water circulation resistance. Build. Simul. 2024, 17, 2213–2232. [Google Scholar] [CrossRef]
  11. Wei, W.Z.; Ni, L.; Li, S.Y.; Wang, W.; Yao, Y.; Xu, L.; Yang, Y. A new frosting map of variable-frequency air source heat pump in severe cold region considering the variation of heating load. Renew. Energy 2020, 161, 184–199. [Google Scholar] [CrossRef]
  12. Huang, Y.; Ezeh, C.I.; Deng, W.; Hong, S.H.; Peng, Z.; Tang, Y. Correlation between building characteristics and associated energy consumption: Prototyping low-rise office buildings in Shanghai. Energy Build. 2020, 217, 109959. [Google Scholar] [CrossRef]
  13. Wang, X.N.; Li, W.G.; Luo, Z.Y.; Wang, K.; Shah, S.P. A critical review on phase change materials (PCM) for sustainable and energy efficient building: Design, characteristic, performance and application. Energy Build. 2022, 260, 111923. [Google Scholar] [CrossRef]
  14. Vassiliades, C.; Agathokleous, R.; Barone, G.; Forzano, C.; Giuzio, G.F.; Palombo, A.; Buonomano, A.; Kalogirou, S. Building integration of active solar energy systems: A review of geometrical and architectural characteristics. Renew. Sustain. Energy Rev. 2022, 164, 112482. [Google Scholar] [CrossRef]
  15. Ma, R.; Mao, C.; Shan, M.; Zhang, L.; Yang, X. Occupant control patterns of low temperature air-to-air heat pumps in Chinese rural households based on field measurements. Energy Build. 2017, 154, 157–165. [Google Scholar] [CrossRef]
  16. Xu, Z.W.; Li, H.; Xu, W.; Shao, S.Q.; Wang, Z.; Gou, X.; Zhao, M.; Li, J. Investigation on the efficiency degradation characterization of low ambient temperature air source heat pump under partial load operation. Int. J. Refrig. 2022, 133, 99–110. [Google Scholar] [CrossRef]
  17. Zhang, Y.N.; Ma, Q.; Li, B.X.; Fan, X.; Fu, Z. Application of an air source heat pump (ASHP) for heating in Harbin, the coldest provincial capital of China. Energy Build. 2017, 138, 96–103. [Google Scholar] [CrossRef]
  18. Xu, S.X.; Ma, G.Y.; Liu, Q.; Liu, Z.L. Experiment study of an enhanced vapor injection refrigeration/heat pump system using R32. Int. J. Therm. Sci. 2013, 68, 103–109. [Google Scholar]
  19. Aikins, K.A.; Lee, S.H.; Choi, J.M. Technology review of two-stage vapor compression heat pump system. Int. J. Air-Cond. Refrig. 2013, 21, 1330002. [Google Scholar] [CrossRef]
  20. Gschwend, A.; Menzi, T.; Caskey, S.; Groll, E.A.; Bertsch, S.S. Energy consumption of cold climate heat pumps in different climates—Comparison of single-stage and two-stage systems. Int. J. Refrig. 2016, 62, 193–206. [Google Scholar] [CrossRef]
  21. Liang, S.M.; Wang, H.; Bai, X.X.; Wang, G.; Gao, X.; Tian, X. A field study on the impacts of cold island effect on operating performances of air source heat pump array for space heating. J. Build. Eng. 2024, 82, 108266. [Google Scholar] [CrossRef]
  22. Liu, X.; Zhou, Q.N.; Huang, K.L.; Wu, Y.; Liang, C.; Cao, H.; Wei, J. Operating characteristics and evaluation of air source heat pumps in cold regions during heating season in China. Energy Built Environ. 2025, 6, 645–654. [Google Scholar] [CrossRef]
  23. Zhang, Q.; Zhang, L.; Nie, J.; Li, Y. Techno-economic analysis of air source heat pump applied for space heating in northern China. Appl. Energy 2017, 207, 533–542. [Google Scholar] [CrossRef]
  24. Kelly, N.J.; Cockroft, J. Analysis of retrofit air source heat pump performance: Results from detailed simulations and comparison to field trial data. Energy Build. 2011, 43, 239–245. [Google Scholar] [CrossRef]
  25. Huang, S.F.; Wang, L.B.; Xie, L.Y.; Liu, J.; Zhang, X.S. Energetic, economic and environmental analyses of frost-free air-source heat pump in multi-type buildings and different locations. J. Build. Eng. 2023, 80, 108060. [Google Scholar] [CrossRef]
  26. Hwang, Y.J.; Jeong, J.W. Energy saving potential of radiant floor heating assisted by an air source heat pump in residential buildings. Energies 2021, 14, 1321. [Google Scholar] [CrossRef]
  27. Liu, Y.; Zhou, W.; Luo, X.; Wang, D.; Hu, X.; Hu, L. Design and operation optimization of multi-source complementary heating system based on air source heat pump in Tibetan area of Western Sichuan, China. Energy Build. 2021, 242, 110979. [Google Scholar] [CrossRef]
  28. Xu, Y.C.; Guo, Z.W.; Yuan, C.Q. Feasibility study of an integrated air source heat pump water heater/chillers and exhaust gas boiler heating system for swimming pool on luxury cruise ship. Energy Rep. 2022, 8, 1260–1282. [Google Scholar] [CrossRef]
  29. Olympios, A.V.; Pantaleo, A.M.; Sapin, P.; Markides, C.N. On the value of combined heat and power (CHP) systems and heat pumps in centralised and distributed heating systems: Lessons from multi-fidelity modelling approaches. Appl. Energy 2020, 274, 115261. [Google Scholar] [CrossRef]
  30. Bagarella, G.; Lazzarin, R.; Noro, M. Annual simulation, energy and economic analysis of hybrid heat pump systems for residential buildings. Appl. Therm. Eng. 2016, 99, 485–494. [Google Scholar] [CrossRef]
  31. Zhang, Z.B.; Cao, Y.; Qin, S.Y.; Wang, Z.; Gao, W.; Jia, G.; Jin, L. Optimization of design parameters and operation conditions of solar-air source heat pump coupled system for rural buildings in cold and severe cold regions. Sol. Energy 2025, 286, 113147. [Google Scholar] [CrossRef]
  32. Zheng, Z.H.; Jin, Y.P.; Zhou, J.; Yang, Y.; Xu, F.; Liu, H. A novel dynamic operation method for solar assisted air source heat pump systems: Optimization control and performance analysis. Energy 2025, 316, 134535. [Google Scholar] [CrossRef]
  33. Wang, N.; Chu, S.L.; Cheng, C.; Zhang, H.; Chen, H.; Gao, D. Performance research and multi-objective optimization of concentrating photovoltaic/thermal coupled air source heat pump heating system. Energy 2024, 296, 131008. [Google Scholar] [CrossRef]
  34. Lin, Z.; Li, X.L.; Lin, M.S.; Zhang, T.H.; Qiang, G.; Lin, L. Analysis of carbon emission associated with composite air source heat pumps in buildings. Case Stud. Therm. Eng. 2025, 69, 106033. [Google Scholar]
  35. GB/T 51161-2016; Ministry of Housing and Urban-Rural Development of the People’s Republic of China. Standard for Building Energy Consumption of Urban Buildings. China Architecture & Building Press: Beijing, China, 2016.
  36. Ministry of Ecology and Environment of the People’s Republic of China. Announcement on Releasing the 2022 Electricity Carbon Dioxide Emission Factors (Annex: 2022 Electricity Carbon Dioxide Emission Factors). Available online: https://www.mee.gov.cn (accessed on 26 December 2024).
  37. Wang, Y.; Deng, J.; Su, Y.; Peng, C.; Ma, M.; Chen, Y.; Fan, L.; Chen, M.; Wei, Q.; Zhang, H. Research on Configuration Optimization and Control Methods for Mid-Deep Geothermal Heat Pumps Coupled with Air-Source Heat Pump Systems for Space Heating in Residential Buildings. Buildings 2025, 15, 1938. [Google Scholar] [CrossRef]
  38. Yan, D.; Zhou, X.; An, J.J.; Kang, X.Y.; Bu, F.; Chen, Y.; Pan, Y.; Gao, Y.; Zhang, Q.; Zhou, H.; et al. DeST 3.0: A new-generation building performance simulation platform. Build. Simul. 2022, 15, 1849–1868. [Google Scholar] [CrossRef]
Figure 1. Research workflow.
Sustainability 17 06173 g001
Figure 2. ASHP and gas boiler model. (a) ASHP model; (b) gas boiler model.
Sustainability 17 06173 g002
Figure 3. COP of ASHPs under different operation conditions. (a) Rated COP of ASHPs under different operation conditions; (b) ratio of practical and rated COP under LR.
Sustainability 17 06173 g003
Figure 4. Control strategy for simulation method of hybrid system. (a) Parallel mode; (b) series mode.
Sustainability 17 06173 g004
Figure 5. Load distribution during the heating season in each city.
Sustainability 17 06173 g005
Figure 6. Heating load duration graph in each city.
Sustainability 17 06173 g006
Figure 7. The variation in heating load, Ts, with Ta. (a) Early cold period; (b) severe cold period; (c) late cold period.
Sustainability 17 06173 g007aSustainability 17 06173 g007b
Figure 8. Variation in the operational performance of ASHPs with T a on typical days.
Sustainability 17 06173 g008
Figure 9. Typical daily energy costs and CO2 emissions during the heating season. (a) Typical daily energy costs; (b) typical daily CO2 emissions.
Sustainability 17 06173 g009
Figure 10. Cg during the heating season.
Sustainability 17 06173 g010
Figure 11. COP during the heating season.
Sustainability 17 06173 g011
Figure 12. The models of series/parallel connections of ASHPs and gas boilers. (a) Parallel model; (b) series model.
Sustainability 17 06173 g012
Figure 13. Analysis of the heating load distributions on typical days during the severe cold period.
Sustainability 17 06173 g013
Figure 14. Schematic diagram of return water heating for parallel and series models. (a) Parallel model; (b) series model.
Sustainability 17 06173 g014
Figure 15. Comparison of COP on typical days during the severe cold period.
Sustainability 17 06173 g015
Figure 16. Comparison of operating costs and CO2 emissions in different regions. (a) Operation costs; (b) CO2 emissions.
Sustainability 17 06173 g016
Figure 17. Operation performance of coupled systems under different load distribution ratio.
Sustainability 17 06173 g017
Figure 18. The optimal intermediate temperature percentage considering economic effect.
Sustainability 17 06173 g018
Figure 19. The optimal intermediate temperature percentage considering CO2 emissions.
Sustainability 17 06173 g019
Figure 20. The t O I under different combinations of electricity prices and gas prices.
Sustainability 17 06173 g020
Figure 21. The t O I under different electricity carbon emission factor.
Sustainability 17 06173 g021
Figure 22. Economic and energy saving effects of optimal intermediate-temperature control. (a) Harbin; (b) Beijing; (c) Wuhan.
Sustainability 17 06173 g022
Table 1. Regression values of constant coefficients of ASHPs.
Coefficients S 1 S 2 S 3 S 4 S 5 S 6 R2
Values0.000970.001−0.0020.1487−0.13787.18920.9928
Coefficients S 7 S 8 S 9 R2
Values−1.11471.95290.17830.9987
Table 2. Peak, total, and average heating load in each city.
Peak Heating
Load (kW)
Total Heating Load
(Million kWh)
Total Heating Load Per Unit Area (kWh/m2)Average Outdoor
Temperature During Heating Season (°C)
Harbin2141.805.42108.34−10
Beijing2244.403.6172.230
Wuhan1494.682.2745.435
Table 3. Configuration capacity chart for each city.
Air-Source Heat PumpGas Boiler
Heating capacity (kW)500500
The number of units required
for a parallel coupling system
Harbin66
Beijing66
Wuhan44
The number of units required
for a series coupling system
Harbin66
Beijing66
Wuhan44
Table 4. Calculation coefficients under different T s for the best economic effect.
T s (°C)ABCDEF
35−0.000413.7607−0.01300.0010−10.29052.5670
40−0.003220.64210.2176−0.0710−20.43065.8951
45−0.0049−2.0010−0.13890.18182.17840.1226
500.03906.83740.4685−0.4039−11.57745.1132
Table 5. Calculation coefficients under different T s for the lowest CO2 emissions.
T s (°C)abcdef
35−0.0000518.91890.0169−0.0035−13.06872.9642
40−0.000727.05350.1409−0.0572−26.53877.4216
45−0.00584.6630−0.09230.0488−7.40203.8047
500.0090−4.1911−0.03180.21886.5154−1.2863
Disclaimer/Publisher’s Note: The statements, opinions and data contained in all publications are solely those of the individual author(s) and contributor(s) and not of MDPI and/or the editor(s). MDPI and/or the editor(s) disclaim responsibility for any injury to people or property resulting from any ideas, methods, instructions or products referred to in the content.

