
Driving Green Transformation Through the National Digital Economy Innovation Pilot: A Quasi-Experimental Study on Reducing Urban Energy Intensity in 282 Chinese Cities


Abstract
1. Introduction
- (1)
- (2)
- (3)
- Carbon trading pilot policy: This policy mechanism has effectively tackled the longstanding problems of low energy efficiency and high emissions, resulting in significant reductions in energy intensity and carbon emissions of the pilot cities where it has been implemented [15].
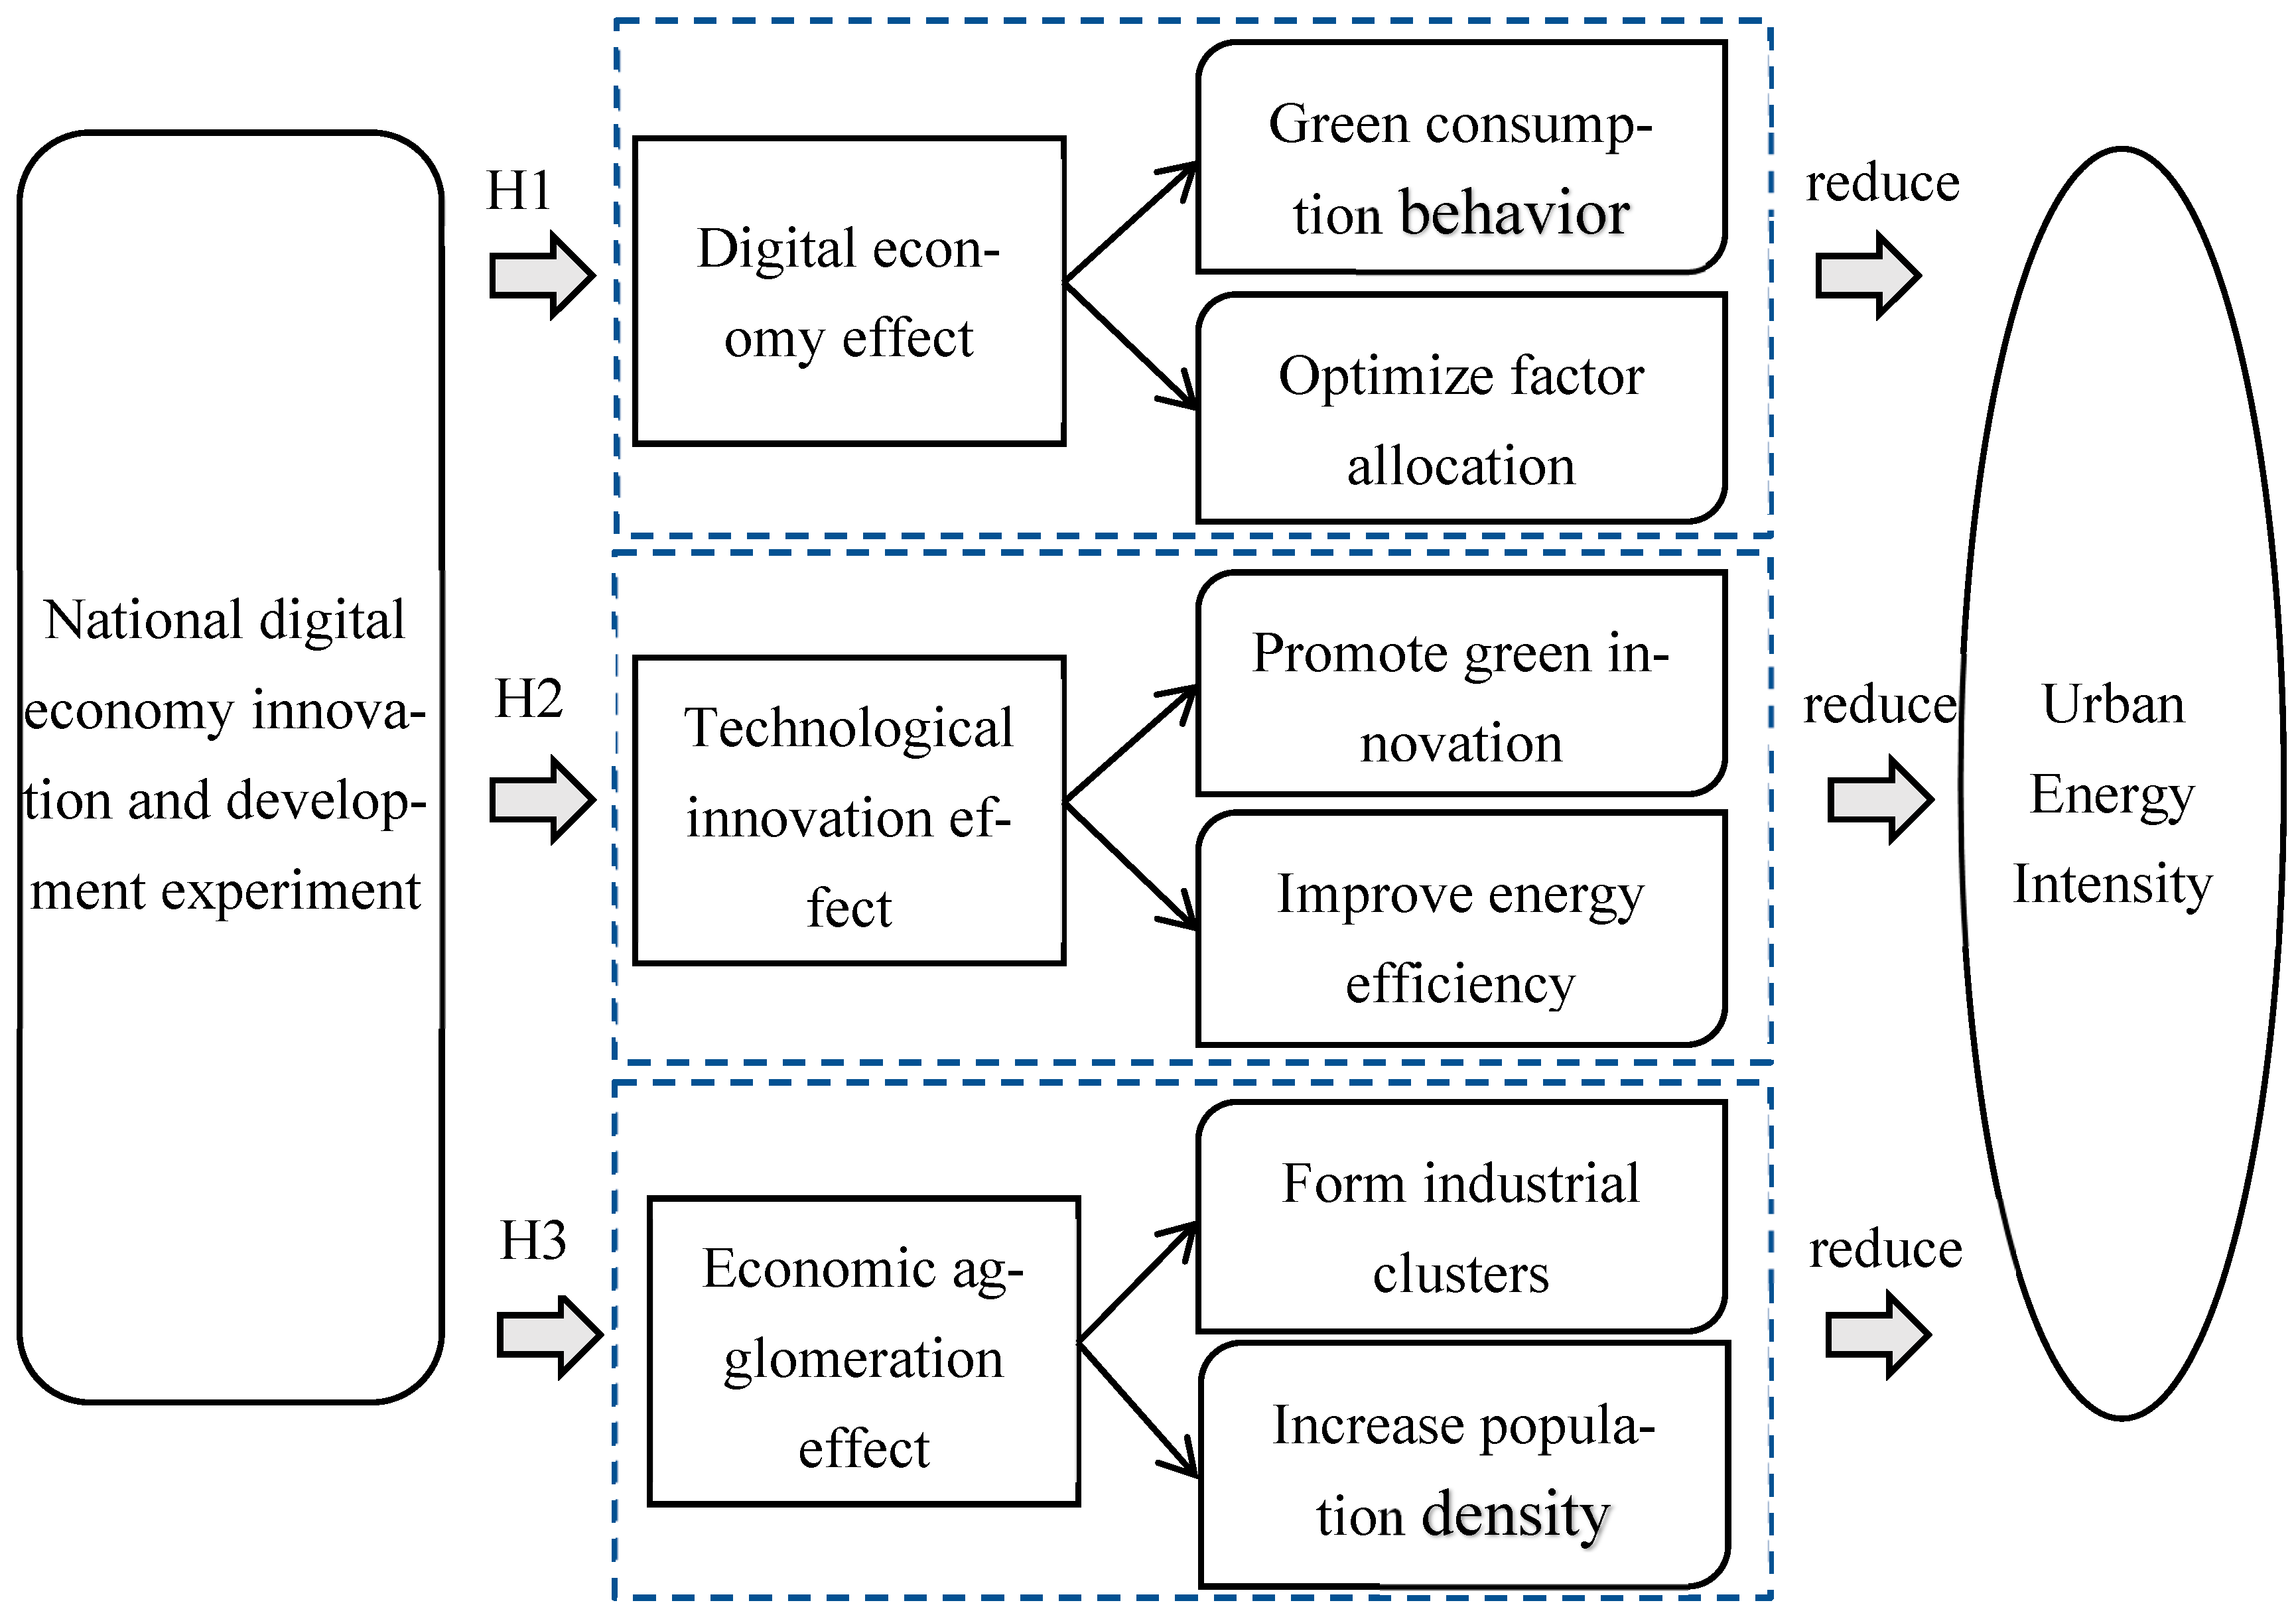
2. Theoretical Foundations and Hypotheses
2.1. Digital Economy Effects
2.2. Technological Innovation Effects
2.3. Economic Agglomeration Effects
3. Research Design
3.1. Model Setting
3.1.1. The Baseline Regression Model
3.1.2. Mechanism Test Model
3.2. Variable Explanations
3.2.1. Dependent Variable and Independent Variable
3.2.2. Mediating Variables
- (1)
- Level of Digital Economy Development (DED). Leveraging available data, our study quantifies the digital economy’s advancement across Chinese cities through two pivotal aspects: internet development and inclusive digital finance. The measurement includes five indicators: the number of internet users per hundred people, the proportion of employees engaged in computer services and software to total urban employment, per capita telecommunications volume, the number of mobile phone users per hundred people, and the China Inclusive Financial Index jointly compiled by the Peking University Digital Finance Research Center and Ant Financial Group. Drawing on the measurement method proposed by Xin et al., the entropy weight method is employed to calculate the developmental level of the digital economy for each city [42]. The weights calculated using the entropy weight method are found in Table 1.
- (2)
- Regional Green Innovation Capacity (RGIC). Since patent grants better reflect the true level of regional innovation, our study uses the number of green patents granted per ten thousand people to gauge the regional green innovation capacity [43].
- (3)
- Degree of Economic Agglomeration (DEA). Economic density is an indicator that measures the intensity of urban economic activities and the level of economic agglomeration, representing the economic value generated per unit area in a region. Drawing on methods from related research, our study employs the non-agricultural GDP per unit of administrative area as a proxy variable for economic agglomeration [44,45].
3.2.3. Control Variables
- (1)
- Government Expenditure on Science and Education (GESE) is measured as the ratio of local fiscal expenditure on science and education to gross regional product.
- (2)
- Level of Informatization (INFO) is measured by the ratio of total postal and telecommunications volume to regional GDP.
- (3)
- Market activity (MA) is indicated by the ratio of the number of urban private and individual practitioners to the total number of employed individuals at year end.
- (4)
- Level of Financial Development (FINA) is assessed by the ratio of the year-end balance of financial institution loans and deposits to regional GDP.
- (5)
- Industrial structure (IS) is measured by the ratio of the tertiary industry to that of the secondary industry.
3.3. Data Description and Data Source
4. Results and Discussion
4.1. Benchmark Regression Results
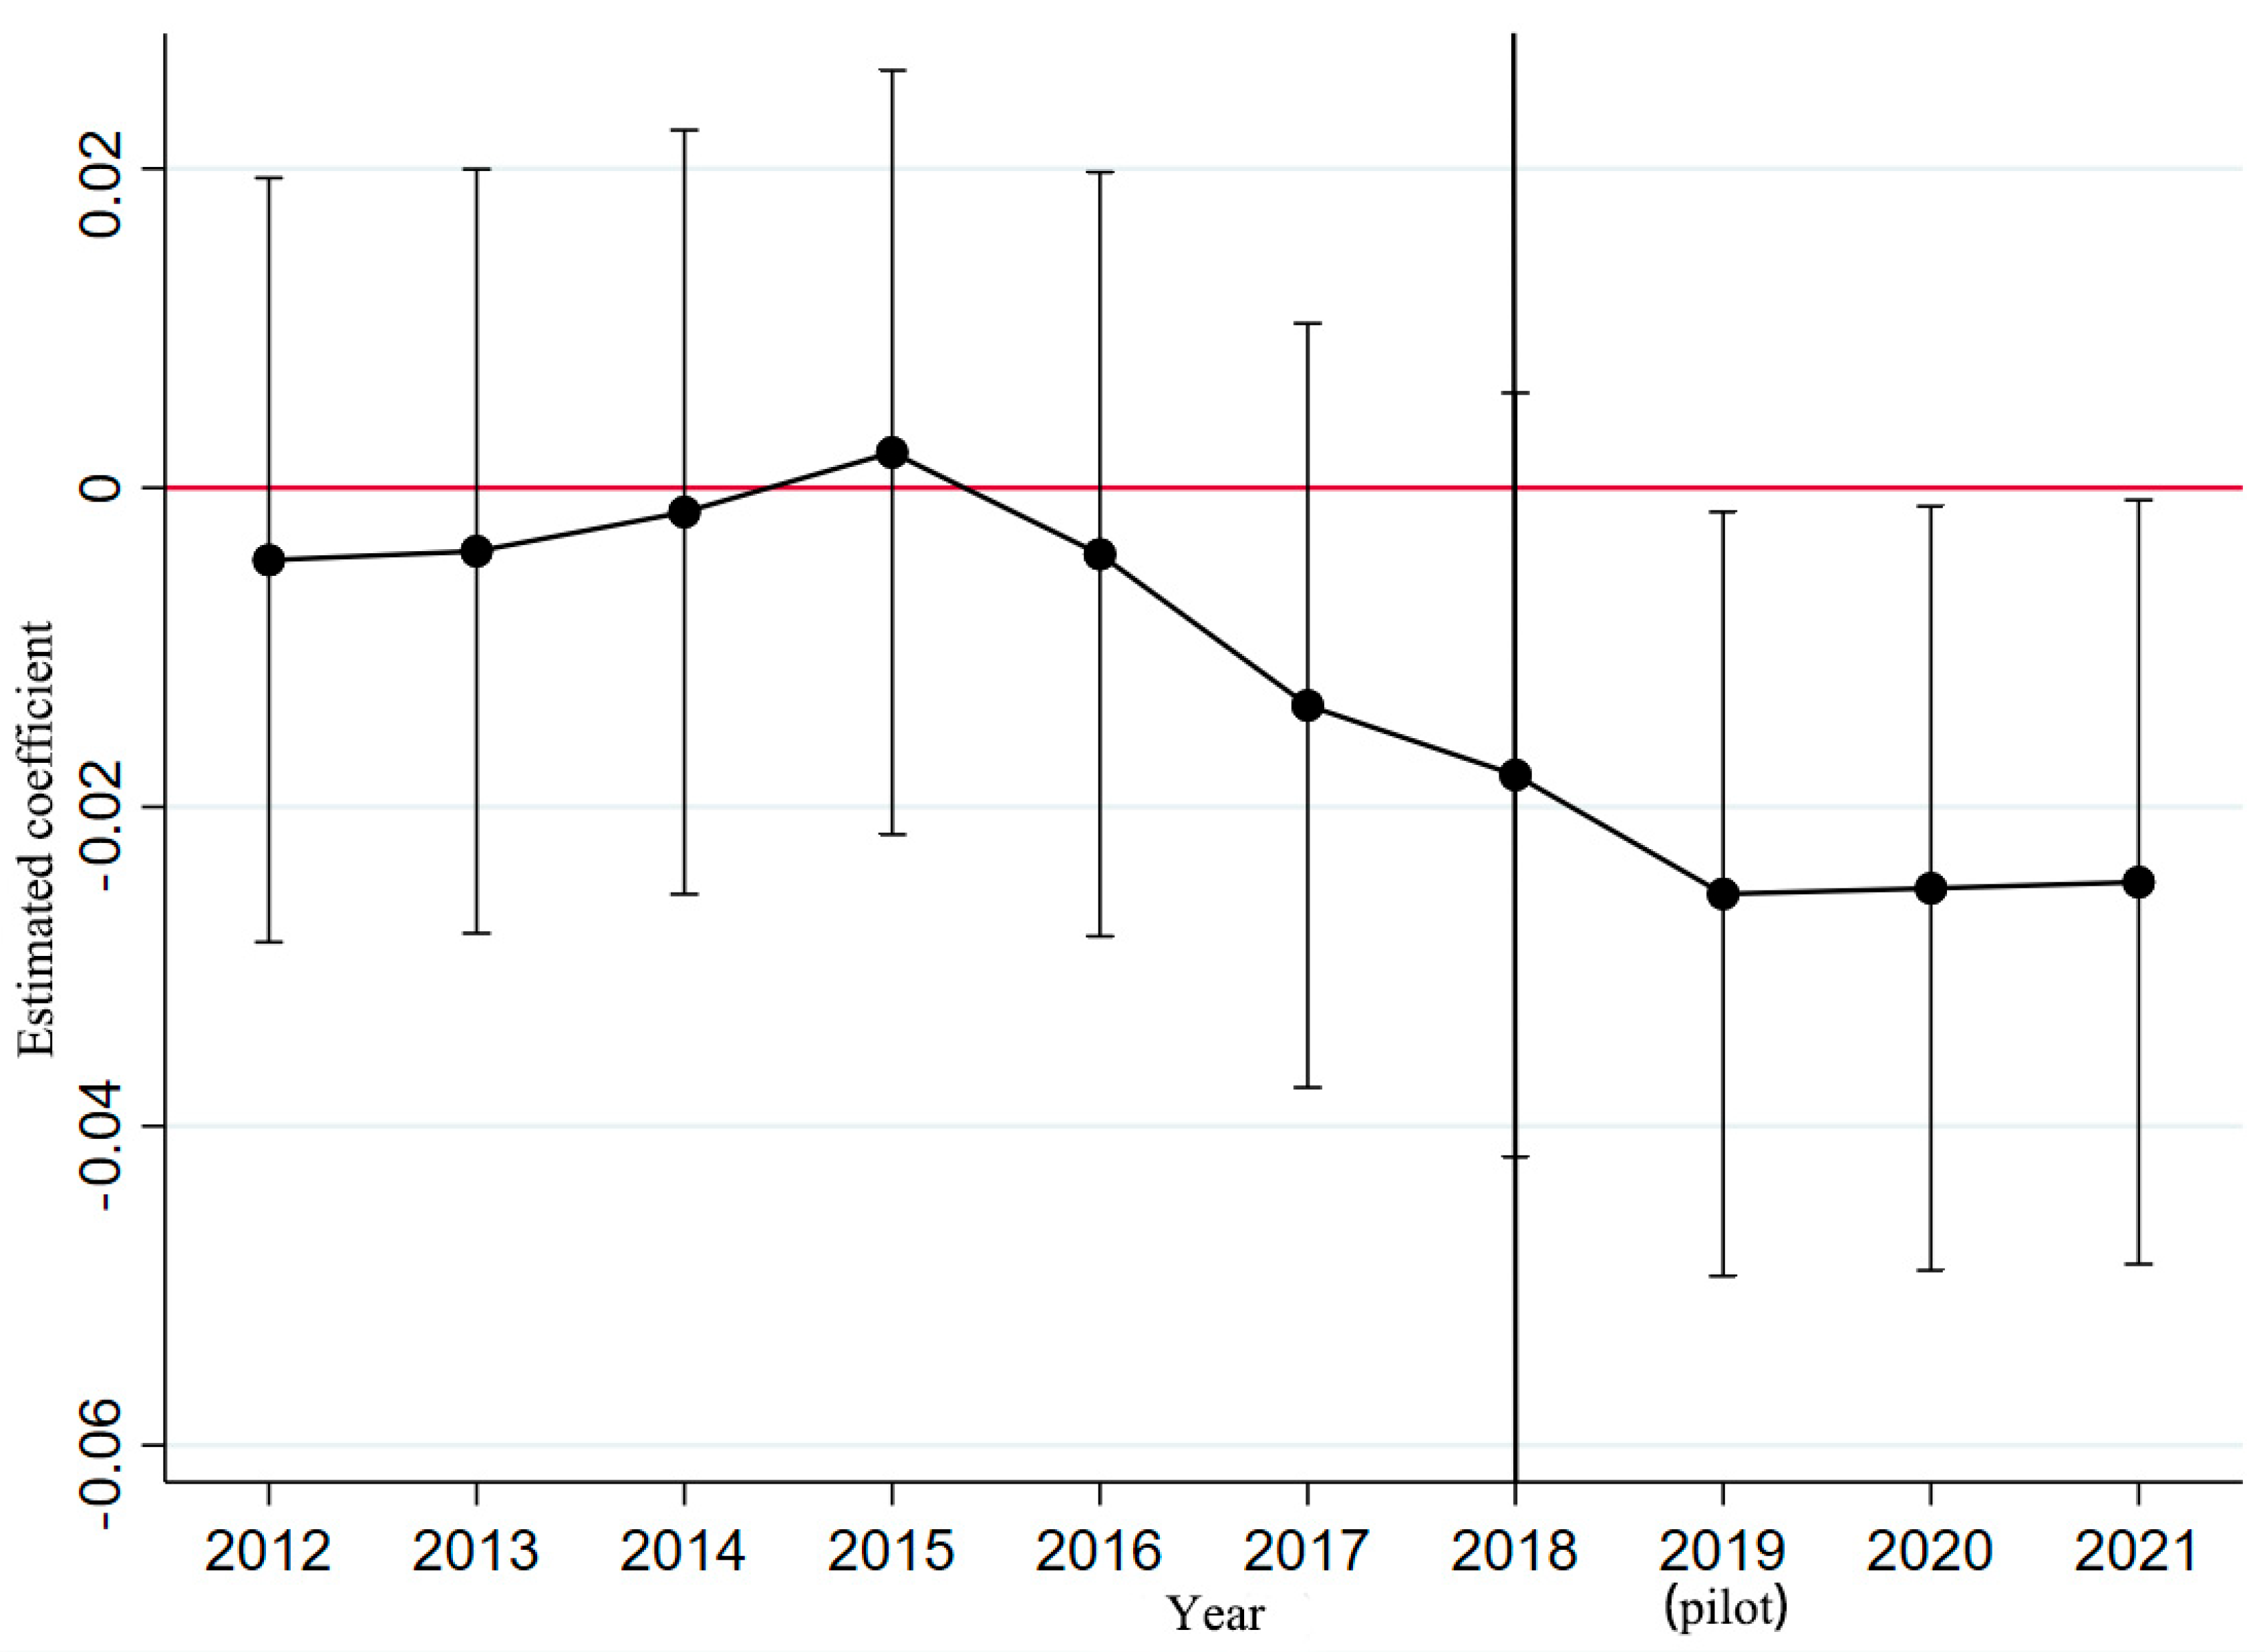
4.2. Parallel Trend Test
4.3. Robustness Test
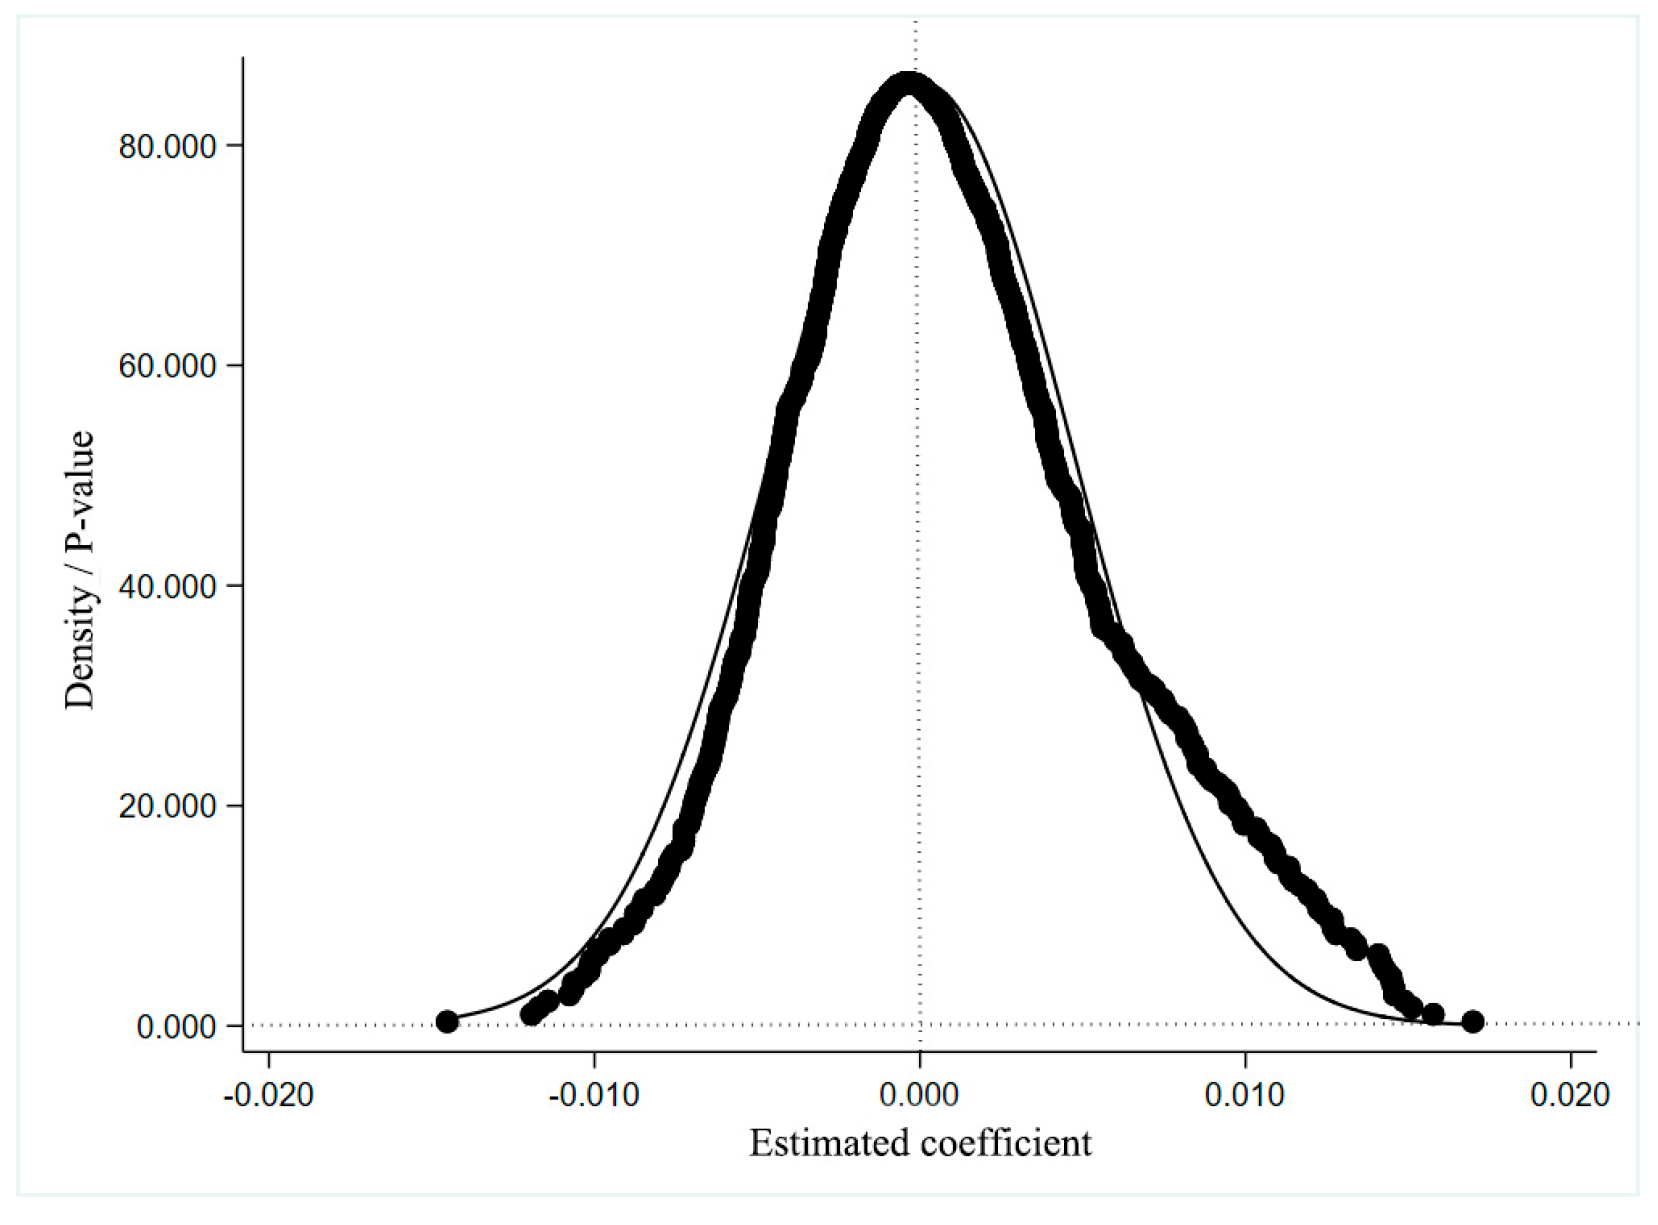
4.3.1. The Placebo Test
4.3.2. Deletion of Sample Values for the Year in Which the Policy Was Piloted
4.3.3. Replacement of Dependent Variables
4.3.4. PSM-DID Test (Propensity Score Matching-Based Differences in Differences Test)
4.3.5. Excluding the Influence of Other Policies
4.4. Heterogeneity Test
4.5. Mechanism Regression Model Robustness Test
5. Conclusions and Recommendations
5.1. Conclusions
- (1)
- Significant reduction in urban energy intensity: The establishment of National Digital Economy Innovation Development Pilot Zones yields a pronounced decrease in urban energy intensity. These results are robust across diverse estimation strategies, which lends credence to the argument that the trial regions could be expanded and that policy lessons gleaned from pilot cities may be beneficially adopted elsewhere.
- (2)
- Heterogeneous effects by administrative level and urban scale: The influence of the National Digital Economy Innovation Development Pilot on urban energy intensity varies according to the administrative hierarchy and population size. Specifically, the policy exerts a stronger effect in ordinary (non-provincial) municipalities and urban areas characterized by smaller populations.
- (3)
- Multiple pathways in reducing energy intensity: Further investigation reveals that the pilot policy reduces urban energy intensity via three channels: (1) digital economic effects, (2) technological innovation effects, and (3) economic agglomeration effects.
5.2. Recommendations
5.2.1. Strengthen Top-Level Design and Clarify Strategic Positioning
5.2.2. Enhance Policy Support for Digital Economy Development
5.2.3. Prioritize Core Technological Breakthroughs and Cultivate an Innovation-Friendly Environment
5.2.4. Optimize Resource Allocation and Stimulate Economic Agglomeration
6. Study Limitations and Future Research
Author Contributions
Funding
Institutional Review Board Statement
Informed Consent Statement
Data Availability Statement
Conflicts of Interest
References
- Hannigan, J. Environmental Sociology; Routledge: London, UK; New York, NY, USA, 2006. [Google Scholar]
- Meadows, D.; Meadows, D.; Randers, J.; Behrens, W.W., III. The Limits to Growth; Universe Books: New York, NY, USA, 1972. [Google Scholar]
- Grossman, G.M.; Krueger, A.B. Economic growth and the environment. Q. J. Econ. 1995, 110, 353–377. [Google Scholar] [CrossRef]
- Kenny, J. Economic conditions and support for the prioritisation of environmental protection during the great recession. Environ. Polit. 2020, 29, 937–958. [Google Scholar] [CrossRef]
- McNeil, A.; Barnes, L. The environment-economic growth trade-off: Does support for environmental protection depend on its economic consequences? Ecol. Econ. 2025, 230, 108522. [Google Scholar] [CrossRef]
- Xue, Y.; Tang, C.; Wu, H.; Liu, J.; Hao, Y. The emerging driving force of energy consumption in China: Does digital economy development matter? Energy Policy 2022, 165, 112997. [Google Scholar] [CrossRef]
- Huang, J.; Wang, Y.; Luan, B.; Zou, H.; Wang, J. The energy intensity reduction effect of developing digital economy: Theory and empirical evidence from China. Energy Econ. 2023, 128, 107193. [Google Scholar] [CrossRef]
- Jiao, J.L.; Song, J.F.; Ding, T. The impact of synergistic development of renewable energy and digital economy on energy intensity: Evidence from 33 countries. Energy 2024, 295, 130997. [Google Scholar] [CrossRef]
- Usman, A.; Ozturk, I.; Hassan, A.; Zafar, S.M.; Ullah, S. The effect of ICT on energy consumption and economic growth in South Asian economies: An empirical analysis. Telemat. Inform. 2021, 58, 101537. [Google Scholar] [CrossRef]
- Song, M.L.; Zhao, X.; Shang, Y.P. The impact of low-carbon city construction on ecological efficiency: Empirical evidence from quasi-natural experiments. Resour. Conserv. Recycl. 2020, 157, 104777. [Google Scholar] [CrossRef]
- Liu, X.; Li, Y.; Chen, X.; Liu, J. Evaluation of low carbon city pilot policy effect on carbon abatement in China: An empirical evidence based on time-varying DID model. Cities 2022, 123, 103582. [Google Scholar] [CrossRef]
- Yu, Y.; Zhang, N. Low-carbon city pilot and carbon emission efficiency: Quasi-experimental evidence from China. Energy Econ. 2021, 96, 105125. [Google Scholar] [CrossRef]
- Guo, Q.; Wang, Y.; Dong, X. Effects of smart city construction on energy saving and CO2 emission reduction: Evidence from China. Appl. Energy 2022, 313, 118879. [Google Scholar] [CrossRef]
- Liu, K.; Meng, C.; Tan, J.; Zhang, G. Do smart cities promote a green economy? Evidence from a quasi-experiment of 253 cities in China. Environ. Impact Assess. 2023, 99, 107009. [Google Scholar] [CrossRef]
- Hong, Q.; Cui, L.; Hong, P. The impact of carbon emissions trading on energy efficiency: Evidence from quasi-experiment in China’s carbon emissions trading pilot. Energy Econ. 2022, 110, 106025. [Google Scholar] [CrossRef]
- Zhang, X.F.; Fan, D.C. Collaborative emission reduction research on dual-pilot policies of the low-carbon city and smart city from the perspective of multiple innovations. Urban. Clim. 2022, 47, 101364. [Google Scholar]
- Xiao, Y.; Duan, Y.; Zhou, H.; Han, X. Has digital technology innovation improved urban total factor energy efficiency?—Evidence from 282 prefecture-level cities in China. J. Environ. Manag. 2025, 378, 124784. [Google Scholar] [CrossRef]
- Pan, L.; Zhang, Y.; Li, J.; Lin, F. Digital Economy and Urban Carbon Emissions: A Quasi-Natural Experiment of the National Big Data Comprehensive Pilot Zone in China. Energy J. 2024, 45, 107–134. [Google Scholar] [CrossRef]
- Zhang, J.; Lyu, Y.; Li, Y.; Geng, Y. Digital economy: An innovation driving factor for low-carbon development. Environ. Impact Assess. 2022, 96, 106821. [Google Scholar] [CrossRef]
- Ma, Q.; Tariq, M.; Mahmood, H.; Khan, Z. The nexus between digital economy and carbon dioxide emissions in China: The moderating role of investments in research and development. Technol. Soc. 2022, 68, 101910. [Google Scholar] [CrossRef]
- Shang, Y.; Raza, S.A.; Huo, Z.; Shahzad, U.; Zhao, X. Does enterprise digital transformation contribute to the carbon emission reduction? Micro-level evidence from China. Int. Rev. Econ. Financ. 2023, 86, 1–13. [Google Scholar] [CrossRef]
- Liu, X.; Chen, L.; Lu, Y.; Chang, M.; Xiao, Y.; Yang, H.; Kong, D.; Zhang, L. Research on the impact of the digital economy on carbon emissions based on the dual perspectives of carbon emission reduction and carbon efficiency. Sci. Rep. 2025, 15, 3416. [Google Scholar] [CrossRef] [PubMed]
- Hamari, J.; Sjklint, M.; Ukkonen, A. The sharing economy: Why people participate in collaborative consumption. J. Assoc. Inf. Sci. Technol. 2016, 67, 2047–2059. [Google Scholar] [CrossRef]
- Lee, C.C.; Wang, F.H. How does digital inclusive finance affect carbon intensity? Econ. Anal. Policy 2022, 75, 174–190. [Google Scholar] [CrossRef]
- Ukoba, K.; Olatunji, K.O.; Adeoye, E.; Jen, T.C.; Madyira, D.M. Optimizing renewable energy systems through artificial intelligence: Review and future prospects. Energy Environ. 2024, 35, 3833–3879. [Google Scholar] [CrossRef]
- Zhang, F.; Deng, X.; Phillips, F.; Fang, C.; Wang, C. Impacts of industrial structure and technical progress on carbon emission intensity: Evidence from 281 cities in China. Technol. Forecast. Soc. 2020, 154, 119949. [Google Scholar] [CrossRef]
- Cheng, M.; Wang, J.; Yang, S.; Li, Q. The driving effect of technological innovation on green development: From the perspective of efficiency. Energy Policy 2024, 188, 114089. [Google Scholar] [CrossRef]
- Song, S.; Wen, J.; Li, Y.; Li, L. How does digital economy affect green technological innovation in China? New evidence from the “Broadband China” policy. Econ. Anal. Policy 2024, 81, 1093–1112. [Google Scholar] [CrossRef]
- Paunov, C.; Rollo, V. Has the internet fostered inclusive innovation in the developing world? World Dev. 2016, 78, 587–609. [Google Scholar] [CrossRef]
- Goldfarb, A.; Tucker, C. Digital Economics. J. Econ. Lit. 2019, 57, 3–43. [Google Scholar] [CrossRef]
- Ge, Y.Q.; Xia, Y.F.; Wang, T.Y. Digital economy, data resources and enterprise green technology innovation: Evidence from A-listed Chinese Firms. Resour. Policy 2024, 92, 105035. [Google Scholar] [CrossRef]
- Birol, F.; Keppler, J.H. Prices, technology development and the rebound effect. Energy Policy 2000, 28, 457–469. [Google Scholar] [CrossRef]
- Lu, X.H.; Lu, Z.R. How does green technology innovation affect urban carbon emissions? Evidence from Chinese cities. Energy Build. 2024, 325, 115025. [Google Scholar] [CrossRef]
- Wang, J.; Wang, S.; Li, S.; Cai, Q.; Gao, S. Evaluating the energy-environment efficiency and its determinants in Guangdong using a slack-based measure with environmental undesirable outputs and panel data model. Sci. Total Environ. 2019, 663, 878–888. [Google Scholar] [CrossRef]
- Yuan, H.; Feng, Y.; Lee, C.C.; Cen, Y. How does manufacturing agglomeration affect green economic efficiency? Energy Econ. 2020, 92, 104944. [Google Scholar] [CrossRef]
- Zheng, J.; Yuan, B.B.; Wu, J.L.; Chen, S. The impact of manufacturing agglomeration on green development performance: Evidence from the Yangtze river economic belt in China. J. Clean. Prod. 2024, 471, 143407. [Google Scholar] [CrossRef]
- Qu, C.; Shao, J.; Shi, Z. Does financial agglomeration promote the increase of energy efficiency in China? Energy Policy 2020, 146, 111810. [Google Scholar] [CrossRef]
- Wang, Y.; Yin, S.; Fang, X.; Chen, W. Interaction of economic agglomeration, energy conservation and emission reduction: Evidence from three major urban agglomerations in China. Energy 2021, 241, 122519. [Google Scholar] [CrossRef]
- Yu, Q.; Li, M.; Li, Q.; Wang, Y.; Chen, W. Economic agglomeration and emissions reduction: Does high agglomeration in China’s urban clusters lead to higher carbon intensity? Urban Clim. 2022, 43, 101174. [Google Scholar] [CrossRef]
- Hausman, J.; Kuersteiner, G.M. Difference in difference meets generalized least squares: Higher order properties of hypotheses tests. J. Econom. 2008, 144, 371–391. [Google Scholar] [CrossRef]
- de Chaisemartin, C.; D’Haultfoeuille, X. Fuzzy Differences-in-Differences. Rev. Econ. Stud. 2018, 85, 999–1028. [Google Scholar] [CrossRef]
- Xin, Y.; Song, H.; Shen, Z.; Wang, J. Measurement of the integration level between the digital economy and industry and its impact on energy consumption. Energy Econ. 2023, 126, 106988. [Google Scholar] [CrossRef]
- Fang, L.T.; Li, Z.H. Corporate digitalization and green innovation: Evidence from textual analysis of firm annual reports and corporate green patent data in China. Bus. Strategy Environ. 2024, 33, 3936–3964. [Google Scholar] [CrossRef]
- Sun, G.Z.; Gao, B.; Zhang, L.G. High-Speed Rail Opening, Economic Agglomeration, and Urban Innovation. Sage Open 2024, 14, 21582440241303255. [Google Scholar] [CrossRef]
- Wu, T. How can open public data promote efficient and equitable green production? Evidence from eco-efficiency in China. Environ. Sci. Pollut. Res. 2024, 31, 35173–35193. [Google Scholar] [CrossRef]
- Zhang, Y.J.; Wang, W. How does China’s carbon emissions trading (CET) policy affect the investment of CET-covered enterprises? Energy Econ. 2021, 98, 105224. [Google Scholar] [CrossRef]
- Alder, S.; Shao, L.; Zilibotti, F. Economic reforms and industrial policy in a panel of Chinese cities. J. Econ. Growth 2016, 21, 305–349. [Google Scholar] [CrossRef]
- Ouyang, X.; Fang, X.; Cao, Y.; Sun, C. Factors behind CO2 emission reduction in Chinese heavy industries: Do environmental regulations matter? Energy Policy 2020, 145, 111765. [Google Scholar] [CrossRef]


| Primary Indicator | Secondary Indicators | Definition | Weight |
|---|---|---|---|
| DED | Internet development | The number of broadband Internet users per 100 people | 0.1401 |
| The ratio of the number of people employed in information transmission, computer services, and software to the number of people employed in regional societies | 0.1030 | ||
| Per capita total telecom business | 0.2699 | ||
| Mobile phone users per 100 people | 0.2726 | ||
| Digital financial inclusion | China’s Digital Inclusive Finance Index | 0.2144 |
| Variable | Variable Name (Units) | Mean | Std. | Min. | Q25 | Median | Q75 | Max. |
|---|---|---|---|---|---|---|---|---|
| GD | Energy intensity/energy consumption per unit of GDP (tons of standard coal/CNY ten thousand) | 0.1047 | 0.1030 | 0.0049 | 0.0084 | 0.0869 | 0.9658 | 2.1319 |
| DED | The digital economy development level | 0.1869 | 0.0858 | 0.0010 | 0.0123 | 0.1786 | 0.7819 | 0.8649 |
| RGIC | Regional green innovation capacity (items/ten thousand people) | 1.0373 | 2.2624 | 0 | 0 | 0.3253 | 24.6919 | 37.0361 |
| DEA | The degree of economic agglomeration (billion CNY per 100 square kilometers) | 0.2896 | 0.6541 | 0.0023 | 0.0026 | 0.1143 | 8.9212 | 10.4773 |
| GESE | Expenditure on financial science and education (%) | 0.0376 | 0.0176 | 0.0079 | 0.0090 | 0.0334 | 0.1475 | 0.1508 |
| INFO | Information level (%) | 0.0238 | 0.0192 | 0.0023 | 0.0032 | 0.0200 | 0.2484 | 0.2943 |
| MA | Market activity (%) | 1.3021 | 0.8722 | 0.0022 | 0.0446 | 1.1156 | 7.0332 | 17.1414 |
| FINA | Financial development level (%) | 1.4776 | 0.7038 | 0.3711 | 0.3925 | 1.3477 | 5.1812 | 20.1002 |
| IS | Industrial structure (%) | 1.0554 | 0.5937 | 0.1136 | 0..1888 | 0.9154 | 5.0721 | 5.3482 |
| Variable | GD | ||||||
|---|---|---|---|---|---|---|---|
| −0.0196 *** | −0.0195 *** | −0.0191 ** | −0.0191 *** | −0.0193 *** | 0.0058 | −0.0189 *** | |
| (0.0058) | (0.0058) | (0.0058) | (0.0058) | (0.0058) | (0.0057) | (0.0059) | |
| GESE | −0.8079 *** | −0.8889 ** | −0.8971 *** | −0.8768 *** | −1.3727 *** | −0.9020 *** | |
| (0.2193) | (0.2201) | (0.2202) | (0.2283) | (0.2319) | (0.2329) | ||
| INFO | 0.2479 *** | 0.2474 *** | 0.2483 *** | 0.2517 *** | 0.2466 *** | ||
| (0.0720) | (0.0720) | (0.0721) | (0.0762) | (0.0722) | |||
| MA | 0.0021 | 0.0020 | 0.0118 *** | 0.0021 | |||
| (0.0019) | (0.0019) | (0.0019) | (0.0019) | ||||
| FINA | −0.0010 | 0.0035 | −0.0012 | ||||
| (0.0029) | (0.0030) | (0.0029) | |||||
| IS | 0.0537 *** | 0.0029 | |||||
| (0.0041) | (0.0053) | ||||||
| cons | 0.0547 *** | 0.0832 *** | 0.0807 *** | 0.0784 *** | 0.0792 *** | 0.0467 ** | 0.0784 *** |
| (0.0183) | (0.0198) | (0.0198) | (0.0199) | (0.0201) | (0.0210) | (0.0201) | |
| Year fixed | Yes | Yes | Yes | Yes | Yes | No | Yes |
| City fixed | Yes | Yes | Yes | Yes | Yes | Yes | Yes |
| Obs | 3102 | 3102 | 3102 | 3102 | 3102 | 3102 | 3102 |
| R2 | 0.6960 | 0.6975 | 0.6988 | 0.6989 | 0.6989 | 0.6604 | 0.6989 |
| Variable | GD | |||||||
|---|---|---|---|---|---|---|---|---|
| (1) | (2) | (3) | (4) | (5) | (6) | (7) | (8) | |
| −0.0193 *** | −0.0848 ** | −0.1620 *** | −0.0132 ** | −0.0190 *** | −0.0194 *** | −0.0141 ** | −0.0146 ** | |
| (0.0069) | (0.0371) | (0.0460) | (0.0058) | (0.059) | (0.0059) | (0.0062) | (0.0062) | |
| LCcity | −0.0017 | −0.0011 | ||||||
| (0.0066) | (0.0067) | |||||||
| Scity | −0.0109 ** | −0.0111 ** | ||||||
| (0.0052) | (0.0052) | |||||||
| CTcity | −0.0144** | −0.0147 ** | ||||||
| (0.0059) | (0.0059) | |||||||
| GESE | −0.9215 *** | −7.7279 *** | 4.4546 ** | −0.4449 * | −0.9018 *** | −0.9165 *** | −0.9001 *** | −0.9148 *** |
| (0.2601) | (1.4693) | (1.8235) | (0.2656) | (0.2329) | (0.2328) | (0.2327) | (0.2327) | |
| INFO | 0.2196 ** | 0.8653 * | 1.4063 ** | 0.1935 ** | 0.2461 *** | 0.2446 *** | 0.2457 *** | 0.2434 *** |
| (0.0859) | (0.4554) | (0.5651) | (0.0834) | (0.0722) | (0.0721) | (0.0721) | (0.0721) | |
| MA | 0.0024 | −0.0026 | 0.0133 | 0.0021 | 0.0021 | 0.0021 | 0.0016 | 0.0016 |
| (0.0019) | (0.0117) | (0.0146) | (0.0023) | (0.0019) | (0.0019) | (0.0019) | (0.0019) | |
| FINA | −0.0071 | −0.0327 * | −0.0127 | 0.0003 | −0.0012 | −0.0013 | −0.0016 | −0.0018 |
| (0.0058) | (0.0183) | (0.0228) | (0.0028) | (0.0029) | (0.0029) | (0.0029) | (0.0029) | |
| IS | 0.0032 | 0.0179 | −0.2658 *** | 0.0032 | 0.0029 | 0.0026 | 0.0022 | 0.0019 |
| (0.0061) | (0.0335) | (0.0416) | (0.0054) | (0.0053) | (0.0053) | (0.0053) | (0.0053) | |
| cons | 0.0931 *** | 12.3980 *** | 0.1328 | 0.0587 *** | 0.0783 *** | 0.0746 *** | 0.0782 *** | 0.0742 *** |
| (0.0217) | (0.1270) | (0.1576) | (0.0208) | (0.0201) | (0.0202) | (0.0201) | (0.0202) | |
| Year fixed | Yes | Yes | Yes | Yes | Yes | Yes | Yes | Yes |
| City fixed | Yes | Yes | Yes | Yes | Yes | Yes | Yes | Yes |
| Obs | 2820 | 3102 | 3102 | 2791 | 3102 | 3102 | 3102 | 3102 |
| R2 | 0.6913 | 0.9075 | 0.8458 | 0.7234 | 0.6989 | 0.6994 | 0.6996 | 0.7001 |
| Variable | (1) | (2) | (3) | (4) |
|---|---|---|---|---|
| Special City | Ordinary Cities | Large Cities | Small Cities | |
| −0.0001 | −0.0210 *** | −0.0145 *** | −0.0206 ** | |
| (0.0084) | (0.0066) | (0.0045) | (0.0096) | |
| GESE | 0.7063 | −0.9137 *** | −0.3073 | −1.2143 *** |
| (0.5334) | (0.2507) | (0.2222) | (0.3437) | |
| INFO | 0.8896 *** | 0.1595 ** | −0.0175 | 0.4094 *** |
| (0.0973) | (0.0812) | (0.0569) | (0.1150) | |
| MA | 0.0039 | 0.0022 | 0.0006 | 0.0063 |
| (0.0047) | (0.0020) | (0.0011) | (0.0040) | |
| FINA | −0.0055 | −0.0031 | 0.0059 | −0.0026 |
| (0.0054) | (0.0032) | (0.0058) | (0.0037) | |
| IS | 0.0117 | 0.0064 | −0.0096 * | 0.0080 |
| (0.0078) | (0.0060) | (0.0059) | (0.0074) | |
| cons | 0.0516 * | 0.0792 *** | 0.1043 *** | 0.0769 *** |
| (0.0278) | (0.0211) | (0.0195) | (0.0261) | |
| Year fixed | Yes | Yes | Yes | Yes |
| City fixed | Yes | Yes | Yes | Yes |
| Obs | 385 | 2717 | 1276 | 1826 |
| R2 | 0.8960 | 0.6860 | 0.6174 | 0.6948 |
| Variable | (1) | (2) | (3) | (4) | (5) | (6) | (7) |
|---|---|---|---|---|---|---|---|
| GD | DED | GD | RGIC | GD | DEA | GD | |
| −0.0189 *** | 0.0057 ** | −0.0180 *** | 0.3437 *** | −0.0177 *** | 0.1128 *** | −0.0136 ** | |
| (0.0059) | (0.0025) | (0.0059) | (0.1294) | (0.0059) | (0.0137) | (0.0059) | |
| DED | −0.1649 *** | ||||||
| (0.0436) | |||||||
| RGIC | −0.0036 *** | ||||||
| (0.0009) | |||||||
| DEA | −0.0476 *** | ||||||
| (0.0081) | |||||||
| GESE | −0.9020 *** | 0.0398 | −0.8954 *** | 8.4198 | −0.8716 *** | 3.0257 *** | −0.7578 *** |
| (0.2329) | (0.1008) | (0.2323) | (5.1318) | (0.2323) | (0.5427) | (0.2328) | |
| INFO | 0.2466 *** | −0.0002 | 0.2465 *** | 0.0595 | 0.2467 *** | −0.0384 | 0.2447 *** |
| (0.0722) | (0.0312) | (0.0720) | (1.5904) | (0.0720) | (0.1682) | (0.0717) | |
| MA | 0.0021 | −0.0003 | 0.0021 | −0.0546 | 0.0019 | −0.0069 | 0.0018 |
| (0.0019) | (0.0019) | (0.0019) | (0.0410) | (0.0019) | (0.0043) | (0.0019) | |
| FINA | −0.0012 | 0.0016 | −0.0010 | −0.0624 | −0.0015 | −0.0035 | −0.0014 |
| (0.0029) | (0.0013) | (0.0029) | (0.0640) | (0.0029) | (0.0068) | (0.0029) | |
| IS | 0.0029 | 0.0089 *** | 0.0044 | −0.5558 *** | 0.0009 | −0.0692 *** | −0.0004 |
| (0.0053) | (0.0023) | (0.0053) | (0.1169) | (0.0053) | (0.0124) | (0.0053) | |
| Cons | 0.0784 *** | 0.1386 *** | 0.1013 *** | −0.2400 | 0.0776 *** | −0.0647 | 0.0754 *** |
| (0.0201) | (0.0087) | (0.0210) | (0.4435) | (0.0201) | (0.0469) | (0.0200) | |
| Year fixed | Yes | Yes | Yes | Yes | Yes | Yes | Yes |
| City fixed | Yes | Yes | Yes | Yes | Yes | Yes | Yes |
| Obs | 3102 | 3102 | 3102 | 3102 | 3102 | 3102 | 3102 |
| R2 | 0.6989 | 0.9187 | 0.7005 | 0.6969 | 0.7008 | 0.9595 | 0.7026 |
Disclaimer/Publisher’s Note: The statements, opinions and data contained in all publications are solely those of the individual author(s) and contributor(s) and not of MDPI and/or the editor(s). MDPI and/or the editor(s) disclaim responsibility for any injury to people or property resulting from any ideas, methods, instructions or products referred to in the content. |
© 2025 by the authors. Licensee MDPI, Basel, Switzerland. This article is an open access article distributed under the terms and conditions of the Creative Commons Attribution (CC BY) license (https://creativecommons.org/licenses/by/4.0/).
Share and Cite
Lin, S.; Lin, Q.; Wang, Q.; Shi, C.; Ausloos, M. Driving Green Transformation Through the National Digital Economy Innovation Pilot: A Quasi-Experimental Study on Reducing Urban Energy Intensity in 282 Chinese Cities. Sustainability 2025, 17, 5687. https://doi.org/10.3390/su17135687
Lin S, Lin Q, Wang Q, Shi C, Ausloos M. Driving Green Transformation Through the National Digital Economy Innovation Pilot: A Quasi-Experimental Study on Reducing Urban Energy Intensity in 282 Chinese Cities. Sustainability. 2025; 17(13):5687. https://doi.org/10.3390/su17135687
Chicago/Turabian StyleLin, Shoufu, Quan Lin, Qian Wang, Chenyong Shi, and Marcel Ausloos. 2025. "Driving Green Transformation Through the National Digital Economy Innovation Pilot: A Quasi-Experimental Study on Reducing Urban Energy Intensity in 282 Chinese Cities" Sustainability 17, no. 13: 5687. https://doi.org/10.3390/su17135687
APA StyleLin, S., Lin, Q., Wang, Q., Shi, C., & Ausloos, M. (2025). Driving Green Transformation Through the National Digital Economy Innovation Pilot: A Quasi-Experimental Study on Reducing Urban Energy Intensity in 282 Chinese Cities. Sustainability, 17(13), 5687. https://doi.org/10.3390/su17135687