Abstract
Natural disasters in the United States frequently wreak havoc on critical infrastructure, affecting energy, water, transportation, and communication systems. To address these disruptions, the use of mobile power solutions like PowerKiosk trailers is a partial solution during recovery periods. PowerKiosk is a trailer equipped with renewable energy sources such as solar panels and biogas generators, offering a promising strategy for emergency power restoration. With a daily power output of 12.1 kWh, PowerKiosk trailers can support small lift stations or a few homes, providing a temporary solution during emergencies. Their key strength lies in their mobility, allowing them to quickly reach disaster-affected areas and deliver power when and where it is most needed. This flexibility is particularly valuable in regions like Florida, where hurricanes are common, and power outages can cause widespread disruption. Although the PowerKiosk might not be suitable for long-term use because of its limited capacity, it can play a critical role in disaster recovery efforts. In a community-wide power outage, deploying the PowerKiosk to a lift station ensures essential services like wastewater management, benefiting everyone. By using this mobile power solution, community resilience can be enhanced in the face of natural disasters.
1. Introduction
Natural disasters are occurring more than twice as frequently compared with 50 years ago [1]. Natural disasters in the United States significantly impact critical infrastructure, causing widespread disruptions. As a core component of national infrastructure, the power grid is both highly interconnected and vulnerable. Disruptions to electricity services during disasters can cascade across transportation, healthcare, communication, and water systems, undermining overall community resilience. Events such as hurricanes, floods, wildfires, and earthquakes can damage energy infrastructure along with other critical systems like transportation, communication, and water supply. Similarly, wildfires threaten power lines and communication towers, affecting essential services. A summary of billion-dollar events that affected the United States from 1980 to 2024 is shown in Table 1 [2]. These disaster cost estimates have been adjusted for inflation using the Consumer Price Index (CPI), following the methodology outlined by Smith and Matthews [3]. The exposure of critical infrastructure to such hazards underscores the importance of proactive planning and building adaptive capacity to support recovery, reduce community risk, and enhance disaster resilience.

Table 1.
Billion-dollar natural disaster events in the United States, 1980–2024 [2] (CPI-adjusted using Smith and Matthews method [3]; from ncei.noaa.gov/access/billions/summary-stats (accessed on 11 May 2025).
Natural disasters vary in frequency depending on the region and the type of event. The rate of billion-dollar natural disasters in the United States is increasing (Table 2; [2]). According to the Federal Emergency Management Agency (FEMA), in the United States, there is an average of 10 to 12 named tropical storms per year, with about 6 becoming hurricanes [4]. Additionally, there are approximately 1200 tornadoes annually, mainly occurring in the central region of the country known as “Tornado Alley.” Furthermore, floods are the most common and widespread natural disaster in the United States, with flash floods and river flooding affecting different regions throughout the year. These statistics highlight the recurring nature of natural disasters in the United States, posing constant challenges to communities and critical infrastructure. In 2023, there were five major natural disasters, one of them being hurricane Idalia in Florida which caused roughly USD 5 billion in damages and 7 deaths. Recently, a major hurricane strike has occurred almost every year in the United States.
Table 2.
Select time comparisons of United States billion-dollar disaster statistics (CPI-adjusted) (from NCEI [2]).
Hurricanes are natural disasters that can leave communities devastated, businesses ruined, homes destroyed, and communication and power systems down. Southwest Florida was recently impacted by Hurricane Ian in September of 2022. The area experienced detrimental flooding in places along the coast and left most residents without power for at least a week—some areas remained without power for up to seven months afterwards [5]. With hurricane season falling in the summer months, power is an essential need [6]. It is common for residents to have a generator for personal use after a hurricane, but there is not a common solution for providing multiple homes or even communities with power after an event like a hurricane.
One major impact of power outages is the operation of wastewater lift stations, particularly when water service has been restored but electric power is still off. Lift stations are distributed throughout communities where a home sewer line is connected to flow to a wastewater treatment plant. Lift stations must remain operational during power outages from a natural disaster to prevent sewage backups and environmental contamination [7,8]. For example, the largest city in southwest Florida is Cape Coral with a current estimated population of about 234,132 [9]. The city has approximately 300 master and duplex stations with about 277 lift stations without stationary bypass pumps or standby generators.
Hurricanes and tropical storms pose significant challenges to restoring electricity to affected areas quickly. In response to this urgent need, innovative solutions are being explored, including the feasibility of utilizing PowerKiosk trailers powered by renewable energy sources such as solar panels and a biogas generator. Having a resilient energy source as an option would be very beneficial to the United States, specifically the hurricane-prone state of Florida. These mobile units offer a promising approach to restoring power not only to homes but also to essential facilities such as lift stations. Due to the sunny conditions that persist after a storm passes, the PowerKiosk trailers would be equipped with both solar electric generation and biogas electric generation.
Solar energy production and harvesting, though not a new concept, has in recent history become increasingly popular. From 2010 to 2020 the global cumulative installed solar photovoltaic (PV) capacity grew nearly 1850% from around 40 GW to 775 GW [10]. This can be attributed in part to new research advancements, reduced production and capital costs, as well as the desire to move away from fossil fuels as a means of energy production [11]. Solar energy production is a well-studied science. Simply put, PV cells produce an electric current after the semiconductor material that they are made of is hit by light from the Sun [10]. Due to the relatively small output from individual PV cells, solar PV panels are a series of PV cells strung together until a desired power output is achieved, with solar arrays being the same concept for larger applications [12]. Since solar panels produce direct current power, an inverter is needed to convert the output to alternating current power, as most applications require it in that form [12].In addition, batteries are also used in most solar energy systems to store energy for use at times when the system may not be producing energy such as in the night or during cloudy weather conditions [13]. A longstanding point of contention with solar energy systems, PV in particular, is the efficiency of the system. Though an increase in PV system efficiency has been noted in recent years and is continuing to rise, it still does not compare to some other traditional energy production methods, and often works best in tandem with other renewable energy production methods [14]. The concept of the PowerKiosk trailer for emergency electric generation uses both solar and biogas electric generation.
Biogas production via anaerobic digestion (AD) can come with other benefits which would satisfy both the need for tandem energy production, as well as the criteria needed for something to be a true Water–Energy–Food (WEF) system. AD can take on many forms given the many variables that go into it. There are three main categories of AD based on biomass substrate and total solids content, that being wet with <15%, dry with <25%, and solid state with up to 40% total solids [15]. Regardless of the categories, the biological process of AD follows the same general path, hydrolysis, acidogenesis, acetogenesis, and methanogenesis, which are conducted by various groups of microorganisms found in the biomass [16]. Since the production of this biogas relies on the growth rate of the microorganisms digesting the waste, it is important to maintain them. Some variables which affect the growth rate of anaerobic microorganisms and the overall efficiency of an AD can be the type of biomass, pH, ratio of water to solids, temperature, mixing, retention time, and more [17]. Anaerobic digestion primarily yields biogas and water. The biogas is predominantly composed of methane (40–75%) and carbon dioxide (25–60%) [18,19]. Additional byproducts, though present in smaller quantities, include hydrogen, hydrogen sulfide, and water vapor. Singh et al. [17] reviewed studies which compared the methane production rates of AD that were mixed versus not mixed, citing mixing as a way to achieve a uniform consistency between nutrients and microorganisms as well as to avoid the build up of substrate and trapped biogas. The studies showed that non mixed digesters experienced uniform biogas production and mixed digesters showed lower yields; however the opposite was also noted within the same study [17]. The substrate is usually biomass from manure and food waste; however other things can be added to aid in biogas production. Rabii et al. explained that biogas production may also be enhanced by feeding the digester and subsequently the microorganisms metallic nutrient elements. Studies have been conducted in which other substrate supplementation was practiced, such as wheat straw and paper products including cardboard and tissue, both with effective outcomes [20,21]. Retention time is also an important factor at play in AD. A new AD system should be provided enough time to achieve a concentration of microorganisms that can produce the needed amount of biogas, which can be up to three months; however, an established system may only require a retention time of 10–30 days [22]. If significant amounts of biogas can be produced by an AD system, it can be used in a few ways. Biogas can be used directly for cooking or as a fuel source for an internal combustion engine or generator to produce power, though the conversion efficiency is around 25% [17,23]. The use of an internal combustion engine may require some modifications. Ambarita explored two methods of conversions to engines for biogas use: one required spark ignition modifications for biogas use only and the other required dual fuel use between biogas and diesel. Both methods resulted in increases in power generation and efficiency [24]. For use in the PowerKiosk trailer, the produced biogas must be pressurized and placed in a tank on the trailer.
The primary objective of this paper is to assess the feasibility of utilizing PowerKiosk trailers as a reliable source of energy for households and/or lift stations during natural disasters. We hypothesize that deploying mobile PowerKiosk units—integrating solar and biogas systems—can provide a cost-effective, resilient energy solution for homes and critical infrastructure during natural disasters. By examining the practicality and effectiveness of deploying these mobile units equipped with renewable energy sources, we aim to evaluate their potential to provide resilient power solutions in areas prone to natural disasters.
2. Methods and Materials
2.1. Demand and Supply Analysis
To assess the feasibility of utilizing a PowerKiosk to meet the emergency energy demands of homes and lift stations in disaster-affected areas, a demand–supply analysis was conducted. The demand aspect focused on estimating the energy requirements of residential households and lift stations. The households were assessed to determine the minimal amount of electricity by only powering the essential elements (lights, refrigerator, A/C, and microwave oven). Data collection for this analysis involved gathering information on the average energy consumption of households in Florida, as well as the power of typical wastewater lift stations in the Southwest Florida area.
On the supply side, the analysis involved evaluating the capacity of a mobile PowerKiosk trailer to meet the identified energy demands. This assessment considered factors such as the power output of the mounted renewable energy sources (solar panels and biogas generators), the mobility and deployment capabilities of the trailers, and the duration of power supply they could sustain. Data collection for this aspect of the analysis involved obtaining technical specifications from the manufacturers of the solar panels and bioreactor systems installed in the PowerKiosk, supplemented by field observations. By comparing the estimated demand for energy during disasters with the supply capacity of the PowerKiosk, the feasibility of using these mobile units as a reliable energy source in disaster recovery efforts was evaluated.
The project framework starts with collecting data on the energy needs of homes and lift stations, and the capabilities of the PowerKiosk with solar panels and a biogas reactor. Then, an assessment was made of the electric energy required and if the PowerKiosk could meet that demand. This analysis will aid in determining if using PowerKiosk trailers during disasters is feasible for either lift stations or communities. By examining these aspects, the goal was to understand if this solution could effectively provide power to homes and critical facilities during emergencies. A diagram of the framework is shown in Figure 1.
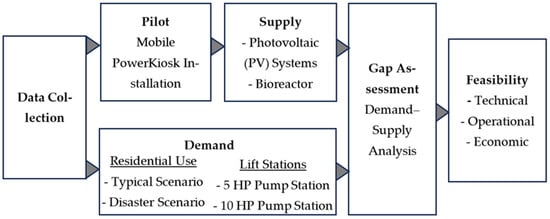
Figure 1.
Schematic of the framework for this study.
2.2. Case Study
The PowerKiosk is a compact, trailer-mounted system that integrates renewable technologies, including solar photovoltaic (PV) panels, battery storage, and a biogas digester. These components work together to convert sunlight and organic waste into usable electrical energy and are well suited for deployment in areas where conventional infrastructure has been compromised. A detailed description of the system’s components and configuration is provided in Section 2.4.
To evaluate its operational potential, this study estimates the daily energy production of the solar PV and biogas systems and compares it to the calculated energy demands of a single-family household and two types of wastewater lift stations (5 and 10 horsepower (HP)) under post-disaster conditions. By conducting this demand–supply analysis, this study seeks to identify the most effective use case for the PowerKiosk and offer guidance on its strategic deployment to enhance community resilience during power outages.
2.3. Site Information
The pilot PowerKiosk system is located at the Florida Gulf Coast University (FGCU) Emergent Technologies Institute (ETI) in Fort Myers, Florida. This site served as the construction and testing ground for the PowerKiosk prototype. Multiple evaluations were conducted at ETI to assess system performance under local conditions. The decision to develop and test the unit in Southwest Florida was intentional, as the region’s high solar irradiance makes it particularly well suited for solar energy applications. Since solar energy output varies by geographic location, energy production estimates in this study are based on local solar conditions specific to Southwest Florida. The PowerKiosk is intended for local deployment, where its renewable energy systems—particularly the solar panels—can operate at optimal efficiency. The location of the FGCU Emergent Technologies Institute is shown in Figure 2.
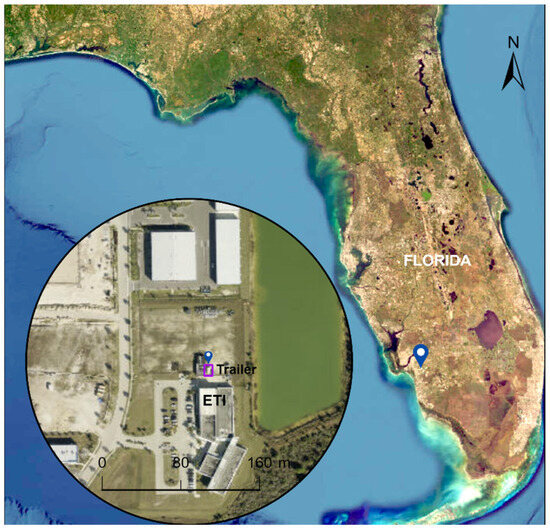
Figure 2.
Location of Emergent Technologies Institute in Southwest Florida.
2.4. Description of the PowerKiosk
A 1.8 m wide by 3.7 m long enclosed cargo trailer was outfitted with external solar panels and an internal inverter and battery, as well as a biodigester with a toilet attachment, biogas cooktop burner, and generator. The PV modules utilized in this study are Canadian Solar CS3W-440MB-AG with a single-sided module efficiency of 19.7%. The single-sided rating is 440 watts each. With a bifacial gain of 20%, the efficiency is 23.6%. The trailer had four of these PV modules mounted to the roof using an IronRidge Tilt Mount System that leads to a SI32 Series Switch Disconnector, GroWatt Off Grid Solar Inverter (SPF 3000 TL LVM manufactured by Shenzhen Growatt New Energy Technology Co., Ltd., Shenzhen, China,), and a 48 V 100 AH LiFePOWER4 battery (manufactured by EG4 Electronics, LLC, Sulphur Springs, TX, USA). The single-line diagram for the solar PV system is shown in Figure 3. The data for the inverter and battery can be found on the Growatt and EG4 websites [25,26]. The data sheets for the solar panels can be found from RaySolar, and the information on the switch disconnector can be viewed on the Solar Electric website. The solar panels were mounted at a 10° slope and the orientation of the panels at the time of assessment was to the east. AC losses for the system were estimated at 10% due to the inverter efficiency of 95%, the battery starting at 99%, and other stand-by electrical use within the system. It should be noted that an additional solar panel was added to the side of the trailer. For the purposes of this study, it was not included in the evaluation.
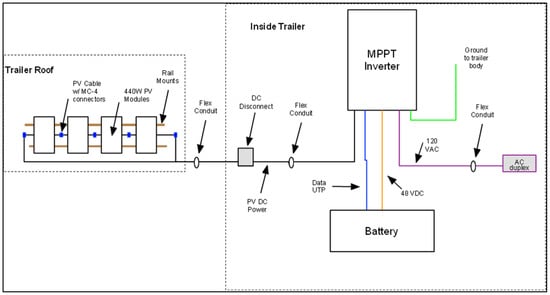
Figure 3.
Schematic diagram of mobile PowerKiosk.
For the digester system, the HomeBiogas Bio-Toilet and HBG2 were installed inside the trailer which included the two-part digester and biogas tank, toilet, and burner and associated appurtenances [27,28]. A generator was added inside the trailer as well. An image of the system is shown in Figure 4. Since this is a manufactured AD system, the specifications of the products are used for estimating purposes.
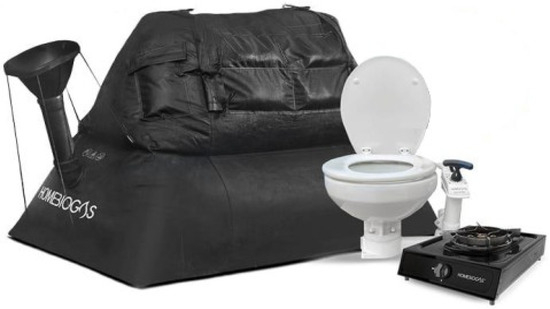
Figure 4.
The HomeBiogas Bio-Toilet and HBG2 with burner [27,28].
The HomeBiogas bioreactor is a large system with a capacity to hold approximately 1200 L of liquid, making it ideal for managing significant amounts of organic waste. Beyond its energy producing capabilities, the bioreactor serves multiple practical functions, especially in disaster recovery scenarios. It can be used as a toilet, providing a sanitary waste management solution in areas where traditional infrastructure may be unavailable. It also functions as a trash bin for food scraps, which is especially valuable in situations where food spoilage occurs due to power outages, such as during hurricanes or other natural disasters. The bioreactor is also useful for disposing of organic waste such as leaves and damaged plants, which are common after severe weather events like hurricanes. By providing a place to manage these types of waste, the system helps communities recover by supporting waste management, cooking, and energy needs, all in one. Table 3 below shows the specifications of the HomeBiogas 2 unit.
Table 3.
HomeBiogas 2 specifications [27,28].
The bioreactor has a maximum capacity of 4.4 kilowatt-hours (kWh), which helps power the PowerKiosk. It also provides up to 2 h of cooking on a burner. It serves as a waste management system, generates energy, and the outflow from the reactor can be used as a nutrient-rich liquid for gardening.
3. Results
3.1. Energy Demand Calculation
Data for home usage was collected from Silicon Valley Power [29]. The company tabulated estimated energy use based on average operating conditions. The tabulation of data can be found on the Silicon Valley Power website in the reference section [29]. In a disaster situation, only essential appliances need to be powered to maintain basic living conditions. The appliances that are considered essential are fans, lighting, a microwave oven, and a refrigerator. These were tabulated along with their daily energy usage in kWh and can be found in Table 4.
Table 4.
Home energy demand during natural disasters.
The total daily home usage during a natural disaster was calculated to be roughly 4.1 kWh, which is minimal compared with a regular daily home usage of 29 kWh [30,31]. The power assumptions were having three ceiling fans on for 10 h because the climate in Florida is very hot. In a northern climate the usage could be lower or higher based upon the temperature; if it is a cold climate, more energy would be required for a heater. The lighting is six 20-watt lights that stay on for 4 h. A 1000 W microwave oven is considered for heating food for 10 min each day, whereas a refrigerator operates continuously, consuming approximately 1.2 kWh per day. All these values were engineering estimations in the case of a natural disaster where a home needs to use the absolute minimum amount of energy.
A common wastewater lift station, also known as a pump station, is typically equipped with either 5 or 10 HP motors in a community depending on the size and location. Commonly, wastewater lift stations can require higher or lower HP values depending on the design criteria used based on system modeling [7,8]. There are usually many lift stations in a large community, which are essential in moving wastewater away from homes and to a wastewater treatment facility. The daily energy consumption for the lift stations under normal conditions is presented in Table 5. Converting this usage to kilowatt-hours allows for a direct comparison with household energy consumption and helps assess how much energy the PowerKiosk can realistically supply. The two types of lift stations and their power consumption under regular conditions are included in Table 5. The same types of lift stations powered during a disaster situation are shown in Table 6. The usage is lowered to only 1 h a day because the operator typically needs to conserve all the energy possible during a situation where power is at a minimum.
Table 5.
Lift station energy demand (regular conditions).
Table 6.
Lift station energy demand (disaster situation).
3.2. Energy Production Calculations
The estimation of the irradiance values for the solar panels started with the development of the input values required to make the calculations. The input values used for input into the solar calculator to find the average monthly irradiance of the Sun per day are given in Table 7. Using irradiance and other inputs, the energy of the solar panels was calculated using the PVWatts® Calculator developed by the National Renewable Energy Laboratory (NREL) (Golden, CO, USA) [32] (NREL 2025). The PVWatts® Calculator inputs are included in Table 7. The calculated monthly irradiance values and total average daily energy output for each month are shown in Table 8.
Table 7.
Solar inputs for energy calculation.
Table 8.
Monthly irradiance values and average daily energy harvest of solar panels (gray highlighting reflects hurricane season).
The irradiance was calculated from the tilt and azimuth angle of the solar panel and the irradiance provided by the weather-modified Southwest Florida Sun. The results would have different values if the location, tilt, and azimuth were changed. The solar panel energy and irradiance were calculated monthly, with the highlighted months showing the natural disaster-prone months in Florida. For the natural disaster months (June to November) the average daily PV output is about 7.7 kWh/day. The HomeBiogas 2 provides 4.4 kWh of energy for cooking, as specified by the manufacturer’s data [27,28,33] and shown in the HomeBiogas 2 specifications in Table 1.
4. Discussion
4.1. Energy Comparison
Using the collected data and energy calculations, a decision was made on whether the mobile PowerKiosk was more effective at powering homes or lift stations during a natural disaster. Table 9 shows the comparison of the supply and demand. The demand for a lift station was split for the 5 HP and the 10 HP pumps. All power demands were calculated and compared exclusively for the disaster scenario, where the consumption estimates for a 5 HP lift station, a 10 HP lift station, and a typical household were based on minimal operational conditions. For the household load estimation, only essential appliances were considered, including fans, basic lighting, a microwave oven, and a refrigerator. This approach ensures that the calculated demands represent a conservative baseline for critical power supply planning under emergency conditions. The comparison column describes the number of homes, 5 HP, and 10 HP lift stations the PowerKiosk can supply in a day. Also, the amount of time the PowerKiosk could support a single 5 or 10 HP lift station was calculated.
Table 9.
Supply and demand energy comparison.
The demand and supply analysis shown in Table 9 indicates that the PowerKiosk would be able to power 3 single-family homes, 2 lift stations with 5 HP, or 1.15 lift stations with 10 HP. This calculation is for daily outputs due to the supply calculations of the PowerKiosk to be per day only. Overall, the PowerKiosk is the best where it is needed most, because of its mobility, allowing deployment to lift stations or multiple homes. Providing backup power to lift stations is especially critical, as these facilities typically serve more than 200 homes. The PowerKiosk can supply electricity to a lift station for approximately one to two hours during a disaster, ensuring continued wastewater discharge for this large number of homes. Additionally, it can support the basic electricity needs of up to three homes following disaster recovery.
The energy supply calculations are based on the daily energy output of our existing 1.8 m by 3.7 m trailer, which provides a specific amount of power based on its equipment and solar panel capacity. The energy generation is directly linked to the trailer’s size and the associated infrastructure, including the solar panels, battery storage, and other components. The current design has been optimized for this size, but if the trailer were larger, additional PV modules would contribute to an increase in the overall power output.
4.2. Cost Comparison
A different issue to consider with the mobile power station is its cost effectiveness. Would integrating this renewable energy source into daily life be an advantage? To understand the costs associated with powering a lift station or a residential home, several calculations were made. These calculations assume that the mobile PowerKiosk has a lifespan of 20 years and includes the energy costs for the two types of lift stations and a typical household under normal conditions. The daily energy cost was calculated using Florida Power and Light (FPL) residential and business rates in cents/kWh. The tables from FPL for residential and business rates can be found on the FPL website [34,35]. The results are shown below in Table 10. This estimate assumes that the trailer is deployed daily to supply the units outlined in Table 9.
Table 10.
Energy cost comparison.
The total cost of the PowerKiosk trailer system comprises several essential components required to establish a functional, off-grid solar–biogas-powered unit. Key elements include the base trailer structure, which serves as the physical platform for mounting all equipment, photovoltaic (PV) panels with a tilt mount system for optimized solar energy capture, an off-grid inverter and battery for energy storage and conversion, and a bioreactor kit for biogas generation. Together, these components form a compact, self-sufficient mobile unit suitable for deployment in remote locations or disaster-prone areas. A detailed breakdown of the PowerKiosk trailer cost is provided in Table 11.
Table 11.
PowerKiosk material costs.
The trailer itself represents the largest portion of the overall cost. However, this expense can be significantly reduced by opting for a used trailer, typically priced around USD 3000. An annual operation and maintenance (O and M) cost of USD 200 was also included and factored into the Net Present Value (NPV) analysis for the PowerKiosk. To enable a meaningful comparison between the 20-year costs of the PowerKiosk and conventional grid electricity, an NPV calculation was conducted using an interest rate of 5%. This analysis was performed using Equation (1).
where C is the initial cost, r is the interest rate, and n is the year.
Currently, there are no specific studies estimating the costs of disaster-related sewage damage for households in the study area. Moderate sewage cleanup and restoration services typically range from USD 500 to USD 1500 per household [36]. For the purposes of this study, a conservative estimate of USD 500 per household is used. A 5 HP lift station generally serves about 200 homes, while a 10 HP lift station serves roughly 400 homes. Therefore, powering a 5 HP lift station with a PowerKiosk system could potentially avoid costs of around USD 100,000, and for a 10 HP lift station, the avoided costs could reach approximately USD 200,000. These figures reflect only the immediate cleanup costs and do not include more extensive structural repairs, such as damage to flooring, drywall, or insulation, or potential health impacts, which would further increase the economic burden.
Southwest Florida has been impacted by five hurricanes of category 3 or higher over the past two decades. Assuming that a similar pattern continues, with five major flooding events leading to wastewater backups in the next 20 years, the total avoided cleanup cost (NPV) for a 5 HP lift station powered by the PowerKiosk system is estimated at approximately USD 325,535. For a 10 HP lift station, the cumulative avoided cost over the same period could reach USD 651,069.
At the individual household level, one of the most common consequences of power outages is the loss of perishable food stored in freezers. Although the monetary loss from food spoilage is relatively minor compared with cleanup and repair expenses, it still contributes to the overall impact. Homeowners insurance in Florida often offers up to USD 500 in coverage for spoiled food. Assuming USD 500 loss in grocery items, covering both fridge and freezer contents, the avoided cost of food spoilage per home is estimated at USD 1628 (NPV).
When a single trailer is utilized to serve either 2.0 units of 5 HP lift stations, 1.13 units of 10 HP lift stations, or 3.0 households, the total 20-year avoided costs are estimated at approximately USD 651,069 for 5 HP systems, USD 735,708 for 10 HP systems, and USD 4883 for households. Including energy savings, the combined total of avoided costs and energy savings reaches approximately USD 666,158 for a 5 HP lift station, USD 743,965 for a 10 HP lift station, and USD 29,934 for households. The net savings are calculated to be around USD 654,956 for 5 HP systems, USD 732,763 for 10 HP systems, and USD 18,732 for households. A detailed breakdown of the 20-year Net Present Value (NPV) calculations is presented in Table 12.
Table 12.
NPV 20-year cost saving.
The PowerKiosk functions as both a renewable energy solution and a vital tool for disaster recovery and resilience. It provides essential services by powering wastewater lift stations and homes during grid outages caused by hurricanes and other extreme events. A 20-year cost analysis shows it delivers significant savings in energy costs and avoids disaster-related damages. The downside of the 20-year cost comparison is that the PowerKiosk would need to remain stationary to serve the selected applications, which limits one of its greatest advantages—mobility. While it may not be the ideal long-term energy solution for large areas, it is highly effective as a rapid response energy provider during emergencies. Operating independently from the grid, the PowerKiosk helps prevent costly sewage backups and reduces food spoilage during disaster-related power outages. Its self-sustaining design makes it especially valuable in remote or disaster-prone areas where maintaining basic services is critical. Additional benefits may include reduced structural damage and lower public health risks, highlighting the need for further research and wider adoption.
Several strategies have been developed to enhance energy resilience using mobile or portable solutions. Mobile distributed generators and energy storage systems are often optimally pre-positioned within distribution networks ahead of extreme events to sustain critical loads [37]. Mobile energy storage systems, such as truck-mounted batteries, can significantly bolster grid resilience by deploying ad hoc microgrids during outages to reduce customer load loss [38], and the rolling optimization of mobile ESS fleets further accelerates post-disaster service restoration when coordinated with microgrids [39,40]. Electric-vehicle-integrated microgrids leverage vehicle-to-grid (V2G) functionality to buffer intermittent renewable generation and support peak demand in both islanded and grid-connected modes [41]. Moreover, hybrid microgrids combining solar PV, batteries, diesel, or renewables like biogas outperform diesel-only configurations in off-grid settings, offering improved reliability, emissions reductions, and flexible islanding capabilities [42]. Our mobile PowerKiosk builds on this foundation by uniquely coupling solar harvesting with on-site waste-to-biogas conversion creating a transportable, hybrid micro-energy system particularly suited for disaster resilience. While a comprehensive performance comparison with these systems is beyond this paper’s scope, these approaches highlight valuable directions for future study.
Although the PowerKiosk offers a promising mobile power solution during disaster recovery, several challenges and limitations should be acknowledged. The maintenance requirements can be significant, especially in harsh post-disaster environments where access to skilled technicians and spare parts may be limited. The variability of biogas production, which is largely dependent on the availability and consistency of feedstock, can affect the reliability of the system’s energy output. Furthermore, logistical challenges in deploying and positioning the trailers quickly and effectively in disaster zones may hinder their immediate impact. These factors highlight the need for ongoing operational support and contingency planning to ensure optimal performance during critical times.
5. Limitations and Recommendations
This study does not include a comparative evaluation of other mobile renewable energy systems, microgrids, or broader energy resilience strategies, which would be essential for contextualizing the relative strengths and limitations of the proposed approach. The analysis relies on the manufacturer’s stated maximum energy output for the HomeBiogas 2 system, without incorporating the real-world biogas-to-electricity conversion efficiency, which could substantially reduce the actual usable energy. Furthermore, this study adopts a simplified “what-if” scenario, based on minimum energy production and essential consumption, and does not account for the stochastic nature of disaster events or the variability in energy supply and demand. To enhance the robustness and practical relevance of such assessments, future research should implement a more comprehensive probabilistic framework that incorporates uncertainty in system performance, disaster frequency and intensity, and economic factors.
6. Conclusions
The PowerKiosk can be very beneficial in specific scenarios, but using it as a long-term solution for large areas may not be sustainable due to its limited power capacity, as demonstrated in the 20-year calculation. With a maximum power output of 12.1 kWh per day, the PowerKiosk can support specific needs, but its capabilities fall short for larger energy requirements. It can power up to three homes each day for essential needs or operate a 5 or 10 HP lift station during disaster conditions—requiring about 6.2 kWh or 10.7 kWh per day when run for one hour—but lacks the capacity for larger or continuous energy demands. However, the PowerKiosk’s strength lies in its mobility and ability to be transported to specific locations quickly. In a scenario where a large community loses power, and there is a choice between using the PowerKiosk to energize three homes or a lift station that serves the entire community, it would be more beneficial to allocate it to the lift station. This decision maximizes the PowerKiosk’s impact by restoring essential services that benefit everyone in the community, such as wastewater management.
The PowerKiosk costs approximately USD 8700, with only minor operation and maintenance expenses. For its primary application in disaster recovery, it prevents sewage backflow into homes and provides a basic energy supply during outages. When a single trailer serves either 2.0 units of 5 HP lift stations, 1.13 units of 10 HP lift stations, or 3.0 households, the total 20-year net savings are estimated to be approximately USD 654,956 for 5 HP systems, USD 732,763 for 10 HP systems, and USD 18,732 for households. The PowerKiosk offers far greater savings when used for lift stations, making it a better choice than using it for individual households. However, in certain cases—such as with a homeowner with financial resources and multiple properties—the investment could still be worthwhile. This investment could be valuable in a disaster recovery situation, allowing the PowerKiosk to move between properties to provide emergency power. Such flexibility could be a lifesaver during a disaster when conventional power sources are compromised, helping to maintain basic services or support crucial operations until permanent power is restored. Ultimately, the PowerKiosk can be utilized in emergency situations or for short-term energy needs, where its mobility and flexibility offer significant advantages. Furthermore, it can continue to supply energy for basic household needs following disaster recovery.
Author Contributions
Conceptualization, T.H.C. and S.T.; methodology, S.T., T.H.C. and J.L.P.; validation, S.T. and P.R.M.; formal analysis, M.L. and A.A.; investigation, M.L., A.A. and P.R.M.; resources, S.T. and T.M.M.; data curation, M.L., A.A. and P.R.M.; writing—original draft preparation, S.T., M.L. and A.A.; writing—review and editing, S.T., T.M.M. and J.L.P.; supervision, S.T. and T.M.M.; project administration, S.T. All authors have read and agreed to the published version of the manuscript.
Funding
The first and fifth authors received partial support from the U.A. Whitaker College of Engineering Head-Start Program and the Backe Chair Foundation Fund (GF00895). Additionally, the Backe Chair Fund was used to install the pilot PowerKiosk at the ETI.
Institutional Review Board Statement
No applicable.
Informed Consent Statement
No human subjects were involved in this study.
Data Availability Statement
All data used in the analysis are given in the published paper.
Acknowledgments
We would like to express our sincere gratitude to Huan Long, Research Laboratory Manager, for securing the trailer and facilitating the installation of the PowerKiosk system at the ETI.
Conflicts of Interest
The authors declare no conflicts of interest.
References
- United Nations. Natural Disasters Occurring Three Times More Often Than 50 Years Ago: New FAO Report. UN News, 2021. Available online: https://news.un.org/en/story/2021/03/1087702 (accessed on 20 July 2024).
- National Centers for Environmental Information (NCEI), Billion-Dollar Natural Disaster Events in The United States, 1950–2024 (CPI-Adjusted). 2024. Available online: https://www.ncei.noaa.gov/access/billions/summary-stats (accessed on 11 May 2025).
- Smith, A.B.; Matthews, J.L. Quantifying uncertainty and variable sensitivity within U.S. billion-dollar weather and climate disaster cost estimates. Nat. Hazards 2015, 77, 1829–1851. [Google Scholar] [CrossRef]
- Federal Emergency Management Agency (FEMA). Natural Disasters. 2024. Available online: https://www.ready.gov/natural-disasters (accessed on 5 April 2024).
- Kase, J. 4 Months After Ian, Indian Creek RV Resort Telling Residents to Leave Without Power or Water. WINK News, 9 February 2023. Available online: https://www.winknews.com/news/lee/4-months-after-ian-indian-creek-rv-resort-telling-residents-to-leave-without-power-or/article_e3da7097-12f9-525a-b669-6362adc600d2.html (accessed on 10 July 2024).
- University of Utah, Hurricanes: Interesting Facts and F.A.Q. 2024. Available online: https://nhmu.utah.edu/sites/default/files/attachments/Hurricane%20FAQs.pdf (accessed on 8 April 2024).
- Tchobanoglous, G. Wastewater Engineering: Collection and Pumping of Wastewater by Metcalf & Eddy, 3rd ed.; McGraw-Hill: New York, NY, USA, 1981. [Google Scholar]
- Vallabhaneni, S. Wastewater collection systems. Water Environ. Res. 2017, 89, 10. [Google Scholar] [CrossRef] [PubMed]
- U. S.; Census, Estimated population of Cape Coral, Florida, USA in May 2024. 2024. Available online: https://worldpopulationreview.com/us-cities/florida/cape-coral (accessed on 20 August 2024).
- University of Michigan. Photovoltaic Energy Factsheet. Center for Sustainable Systems. 2021. Available online: https://css.umich.edu/publications/factsheets/energy/photovoltaic-energy-factsheet (accessed on 20 November 2023).
- University of Central Florida, Solar Electricity Basics. 2014. Available online: http://www.fsec.ucf.edu/en/consumer/solar_electricity/basics/index.htm (accessed on 20 July 2024).
- Arizona State University, Solar PV Panels Linked Together. 2024. Available online: https://cores.research.asu.edu/solar-fab (accessed on 24 January 2024).
- University of Central Florida. How a PV System Works. FSEC Energy Research Center. 2024. Available online: https://energyresearch.ucf.edu/consumer/solar-technologies/solar-electricity-basics/how-a-pv-system-works/ (accessed on 20 July 2024).
- Han, A. Efficiency of Solar PV, Then, Now and Future—Solar Photovoltaic. 2014. Available online: https://sites.lafayette.edu/egrs352-sp14-pv/technology/history-of-pv-technology/ (accessed on 20 July 2024).
- Rabii, A.; Aldin, S.; Dahman, Y.; Elbeshbishy, E. A Review on anaerobic co-digestion with a focus on the microbial populations and the effect of multi-stage digester configuration. Energies 2019, 12, 1106. [Google Scholar] [CrossRef]
- Zieminski, K.; Frac, M. Methane fermentation process as anaerobic digestion of biomass: Transformations, stages and microorganisms. Afr. J. Biotechnol. 2012, 11, 4127–4139. [Google Scholar] [CrossRef]
- Singh, B.; Szamosi, Z.; Siménfalvi, Z. Impact of mixing intensity and duration on biogas production in an anaerobic digester: A review. Crit. Rev. Biotechnol. 2020, 40, 508–521. [Google Scholar] [CrossRef] [PubMed]
- Darwesh, M.R.; Ghoname, M.S. Experimental studies on the contribution of solar energy as a source for heating biogas digestion units. Energy Rep. 2021, 7, 1657–1671. [Google Scholar] [CrossRef]
- Souza, S.N.M.; Werncke, I.; Marques, C.A.; Bariccatti, R.A.; Santos, R.F.; Nogueira, C.E.C.; Bassegio, D. Electric energy micro-production in a rural property using biogas as primary source. Renew. Sustain. Energy Rev. 2013, 28, 385–391. [Google Scholar] [CrossRef]
- Shahbaz, M.; Ammar, M.; Korai, R.M.; Ahmad, N.; Ali, A.; Khlid, M.S.; Zou, D.; Li, X. Impact of C/N ratios and organic loading rates of paper, cardboard and tissue wastes in batch and CSTR anaerobic digestion with food waste on their biogas production and digester stability. SN Appl. Sci. 2020, 2, 1436. [Google Scholar] [CrossRef]
- Shamurad, B.; Sallis, P.; Petropoulos, E.; Shamas, T.; Ospina, C.; Leary, P.; Dolfing, J.; Gray, N. Stable biogas production from single stage anaerobic digestion of food waste. Appl. Energy 2020, 263, 114609. [Google Scholar] [CrossRef]
- Mirmohamadsadeghi, S.; Karimi, K.; Tabatabaei, M.; Aghbashlo, M. Biogas production from food wastes: A review on recent developments and future perspectives. Bioresour. Technol. Rep. 2019, 7, 100202. [Google Scholar] [CrossRef]
- Kabeyi, M.J.B.; Olanrewaju, O.A. Technologies for biogas to electricity conversion. Energy Rep. 2022, 8, 774–786. [Google Scholar] [CrossRef]
- Ambarita, H. Performance and emission characteristics of a small diesel engine run in dual-fuel (diesel-biogas) mode. Case Stud. Therm. Eng. 2017, 10, 179–191. [Google Scholar] [CrossRef]
- Signature Solar. Growatt 48V 3KW 250VDC Stackable Off-Grid Inverter. Available online: https://signaturesolar.com/growatt-48v-3kw-250vdc-stackable-off-grid-inverter/ (accessed on 29 April 2024).
- Signature Solar, EG4-LiFePower4 Lithium Battery 48V 100Ah. Available online: https://signaturesolar.com/eg4-lifepower4-lithium-battery-48v-100ah/ (accessed on 20 April 2024).
- HomeBiogas. Connecting HomeBiogas to the Stove. 2024. Available online: https://intercom.help/homebiogas/en/articles/1418839-connecting-homebiogas-to-the-stove (accessed on 21 April 2024).
- HomeBiogas. Bio-Toilet Kit 2. Available online: https://www.homebiogas.com/shop/bio-toilets/bio-toilet-kit-2/ (accessed on 20 April 2024).
- Silicon Valley Power. Appliance Energy Use Chart (August 28th, 2023). Available online: https://www.siliconvalleypower.com/residents/save-energy/appliance-energy-use-chart (accessed on 15 April 2024).
- Agway Energy. What Is the Average kWh Per Day for a Home? December 16, 2022. Available online: https://www.agwayenergy.com/blog/average-kwh-per-day/ (accessed on 17 April 2024).
- Energy.gov. Estimating Appliance and Home Electronic Energy Use. Available online: https://www.energy.gov/energysaver/estimating-appliance-and-home-electronic-energy-use (accessed on 25 April 2024).
- NREL (National Renewal Energy Lab), U.S. Department of Enginery PVWatt Solar Resource Data Calculator. Calculated with Test Site Location Zip Code 33965. Available online: https://pvwatts.nrel.gov/ (accessed on 10 June 2025).
- HomeBiogas, FAQ (Frequently Asked Questions). Available online: https://www.homebiogas.com/support/?srsltid=AfmBOooCKUTdcCvya1xL6Js4Zq2KZz1t5KPnSHlWgnB-erR-dW7NpLAP (accessed on 15 April 2024).
- Florida Power & Light (FPL). Residential Energy Efficiency Tips—May 2024. Available online: https://www.fpl.com/content/dam/fplgp/us/en/rates/pdf/res-eff-may-2024.pdf (accessed on 20 April 2024).
- Florida Power & Light (FPL). Business Energy Efficiency Tips—May 2024. Available online: https://www.fpl.com/content/dam/fplgp/us/en/rates/pdf/bus-eff-may-2024.pdf (accessed on 20 April 2024).
- Restoration Operators. The Complete Guide to Sewage Cleanup: Steps, Costs, and Safety Measures. Available online: https://restorationoperators.com/blog/the-complete-guide-to-sewage-cleanup-steps-costs-and-safety-measures/ (accessed on 5 July 2024).
- Liu, G.; Jiang, T.; Ollis, T.B.; Li, X.; Li, F.; Tomsovic, K. Resilient distribution system leveraging distributed generation and microgrids: A review. IET Energy Syst. Integr. 2020, 2, 289–304. [Google Scholar] [CrossRef]
- Dugan, J.; Mohagheghi, S.; Kroposki, B. Application of mobile energy storage for enhancing power grid resilience: A review. Energies 2021, 14, 6476. [Google Scholar] [CrossRef]
- Yao, S.; Wang, P.; Liu, X.; Zhang, H.; Zhao, T. Rolling Optimization of Mobile Energy Storage Fleets for Resilient Service Restoration. Available online: https://arxiv.org/abs/1905.06599 (accessed on 10 December 2023).
- Yao, S.; Gu, J.; Wang, P.; Liu, X. Resilient Load Restoration in Microgrids Considering Mobile Energy Storage Fleets: A Deep Reinforcement Learning Approach. Available online: https://arxiv.org/abs/1911.02206 (accessed on 24 May 2024).
- Smith, J.; Doe, A. Systematic review of the effective integration of storage systems and electric vehicles in microgrid networks: Innovative approaches for energy management. Processes 2022, 6, 102. [Google Scholar] [CrossRef]
- Ali, M. Renewable energy sources-based hybrid microgrid system for off-grid electricity solution for rural communities. Energy Sci. Eng. 2023, 11, 3486–3499. [Google Scholar] [CrossRef]
Disclaimer/Publisher’s Note: The statements, opinions and data contained in all publications are solely those of the individual author(s) and contributor(s) and not of MDPI and/or the editor(s). MDPI and/or the editor(s) disclaim responsibility for any injury to people or property resulting from any ideas, methods, instructions or products referred to in the content. |
© 2025 by the authors. Licensee MDPI, Basel, Switzerland. This article is an open access article distributed under the terms and conditions of the Creative Commons Attribution (CC BY) license (https://creativecommons.org/licenses/by/4.0/).