Abstract
Indoor environmental quality (IEQ) of higher education (HE) buildings significantly impacts the built environment sector. This research aimed to optimize learning environments and enhance student comfort, especially post-COVID-19. The study adopts the principles of Post-occupancy Evaluation (POE) to collect and analyze various quantitative and qualitative data through environmental data monitoring, a user perceptions survey, and semi-structured interviews with professionals. Although the environmental conditions generally met existing standards, the findings indicated opportunities for further improvements to better support university communities’ comfort and health. A significant challenge identified by this research is the inability of the facility management to physically manage and operate the vast and complex spaces within HE buildings with contemporary IEQ standards. In response to these findings, this research developed a BIM-based prototype for the real-time monitoring and automated control of IEQ. The prototype integrates a BIM model with Arduino-linked sensors, motors, and traffic lights, with the latter visually indicating IEQ status, while motors automatically adjust environmental conditions based on sensor inputs. The outcomes of this study not only contribute to the ongoing discourse on sustainable building management, especially post-pandemic, but also demonstrate an advancement in the application of BIM technologies to improve IEQ and by extension, occupant wellbeing in HE buildings.
1. Introduction
In contemporary society, the push for sustainable practices within the built environment has become increasingly important. Buildings are expected to not only adhere to the required standards for an indoor environment but also to cater to occupants’ needs, ensuring their satisfaction and wellbeing, which includes social, environmental, and economic aspects [1,2]. Given that individuals spend approximately 90% of their time indoors, the role of indoor environmental conditions in buildings is more crucial than ever [3]. The efficacy of these environments is often gauged by occupant satisfaction, which, when above 80%, indicates a well-performing built environment [4,5].
However, the attainment of desirable indoor environmental conditions within buildings remains a significant challenge, with poor IEQ having a negative impact on the occupants [6]. The prevalence of these situations is especially important in public spaces such as educational buildings, where a significant portion of daily life is spent by students and staff. Within this context, studies show that students in primary and secondary schools spend roughly a third of their time in the school environment, representing a level of time spent that is second only to their homes [7,8]. Higher education (HE) students, by comparison, are typically found in classroom settings for shorter durations, averaging around three hours daily, which is less than the time spent by students in earlier educational phases [9]. This could explain the prevalent existing research into IEQ centering around primary and secondary educational settings.
Furthermore, unlike the other educational settings, HE buildings present unique challenges due to their diverse and complex architecture, which includes large lecture halls, laboratories, and other spaces such as PC rooms and studios. Yet, the pursuit of maintaining an optimum IEQ remains equally critical for the health, wellbeing, comfort, and productivity of student in HE environments. The factors associated with IEQ, i.e., thermal, acoustic, and visual comforts alongside indoor air quality, are influenced by indicators including temperature, relative humidity, CO2, light, and noise [10,11,12]. These factors shape the IEQ outlook, with previous studies showing that poor IEQ in HE institutions can have negative effects on student’s concentration, performance, and health [13].
For instance, ref. [14] evaluated user perceptions of IEQ in a Malaysian secondary school using both objective measurements and subjective surveys, concluding that acoustics had the most significant impact on perceived environmental quality and learning outcomes. In the HE context, ref. [15] analyzed studios and classrooms at the University of Baghdad and reported elevated CO2 levels alongside user dissatisfaction and symptoms of sick building syndrome, calling for improved monitoring and air quality interventions. Ref. [16], in a study at the University of Minnesota, used path analysis to link IEQ variables with student satisfaction and perceived learning. Their findings revealed that thermal comfort, air quality, lighting, and furnishings were all significantly associated with academic and perceptual outcomes. These studies collectively reinforce the importance of integrating both objective and subjective data when assessing IEQ in educational settings. While objective measurements ensure quantifiable compliance with standards, subjective feedback captures the nuanced experiences of occupants, which are often shaped by perceptual and contextual factors that instruments alone cannot detect [17]. However, the studies also highlight a recurring challenge: the reliance on static or manually collected data, which may not capture real-time variations or offer dynamic control mechanisms.
Additionally, the recent COVID-19 pandemic has further underscored the importance of optimal IEQ, where strategies to minimize viral transmission have included increased ventilation rates being introduced by various governments [18]. Importantly, facilities management in HE plays a pivotal role in ensuring the sustainability of built environments. However, numerous barriers hinder the successful implementation of sustainable practices in these settings, despite the considerable benefits they offer. Effective facilities management can lead to improved energy efficiency, reduced operating and maintenance costs, greater value for money, and a reduction in greenhouse gas emissions [19]. Additionally, it enhances health and safety within the built environment, boosts occupant comfort, and helps minimize issues such as sick building syndrome [20]. Unfortunately, traditional facility management approaches in many HE environments remain largely manual and outdated, resulting in inefficient IEQ control. These outdated systems are prone to delays and errors, which in turn negatively impact both occupant comfort and health [21,22].
In response to these challenges, the architecture, engineering, construction, and operation (AECO) sector has been exploring innovative methodologies such as BIM. Due to BIM’s capabilities, it has presented opportunities and has presented a paradigm shift in the design, construction, and maintenance of buildings. BIM, extending through all phases of the building lifecycle, has demonstrated its potential for application during the operational phase thereby offering a digital platform for integrating and analysing building data more effectively [23,24,25]. Studies have explored the use of BIM in various contexts, from monitoring IEQ in subway stations to managing maintenance systems, assessing occupant comfort probabilistically [26,27].
Building on this foundation, this research aims to study and develop a mechanism with the latest BIM technologies to monitor, control, and improve the IEQ in HE buildings. It explores how BIM can be leveraged not just for the visualization of IEQ data but also for the real-time monitoring and management of these conditions within HE buildings. The integration of sensor data directly into a BIM framework allows facility managers to potentially forecast, analyze, and mitigate IEQ issues more efficiently, ultimately enhancing the comfort, health, and productivity of building occupants.
2. Materials and Methods
This research made use of the principles of Post-Occupancy Evaluation (POE) to meticulously assess the IEQ in HE buildings, with two universities in London serving as the principal case studies (for the purposes of this research and to adhere to ethical standards, these institutions will be referred to as University A and University B). The diverse range of room types across these universities, their respective capacities, and the types of ventilation systems present, which are important variables that have been shown to impact IEQ, are detailed in Table 1.

Table 1.
Summary of surveyed rooms and ventilation strategies (Source: Authors’ own work).
University A occupies a post-war concrete-framed building retrofitted for energy efficiency. Originally constructed with uninsulated single-block concrete walls and single-glazed windows, the building underwent substantial thermal upgrades in 2012, including the installation of double-glazed windows and external wall insulation. A central heating system, supported by Ground Source Heat Pumps (GSHPs) and a solar thermal photovoltaic thermal (PVT) system, distributes heat via traditional radiators. While some rooms are equipped with mechanical ventilation systems, these are manually controlled by facilities management. Most spaces rely on natural ventilation through operable windows as the primary strategy for air exchange.
University B, established in the 1960s, is an HE institution comprising a mix of refurbished and traditional building stock. The case study spaces were in a teaching block characterized by externally insulated walls and a central heating system that supplies heat through wall-mounted radiators. The selected rooms included Lecture Hall (B), which is equipped with mechanical ventilation, and Classroom (B), which relies on natural ventilation via multiple operable windows. Environmental measurements in these rooms followed the same POE protocol applied at University A.
The POE process comprehensively approached the multifaceted nature of assessing IEQ by involving both quantitative and qualitative perspectives. It involved the continuous monitoring and measuring of environmental data, the collection of subjective feedback through questionnaire surveys and interviews with facilities management (FM) professionals. The process of environmental data measuring involved the collection of certain IEQ parameters that are attributed to the different factors associated with IEQ. This was conducted in line with the CIBSE: TM68—Monitoring Indoor Environmental Quality guideline [28] for the monitoring of temperature (°C), relative humidity (%), carbon dioxide (CO2—PPM), total volatile organic compounds (TVOCs—μg/m3), formaldehyde (HCHO—μg/m3), particulate matter (PM2.5—μg/m3), indoor ambient noise levels (IANLs—dBA), and light levels (lux). It was carried out using a set of equipment with proven accuracy and reliability in capturing key environmental parameters, with all the elements of the set being factory-calibrated and compliant with typical accuracy thresholds as outlined in TM68 for indoor environmental monitoring. The equipment catalogue involved is illustrated in Figure 1a–d as Tinytag dataloggers (a–b), Temtop M2000C & LKC 1000s+ (c), and an ATP 4-in-1 environment meter (d).
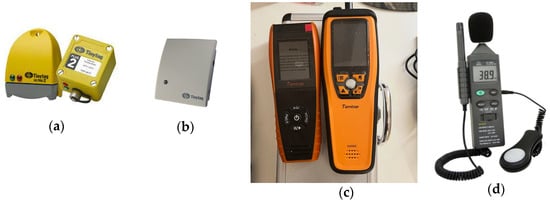
Figure 1.
(a–d) Environmental monitoring and measuring equipment (Source: Authors’ own work). (a) Tinytag indoor & outdoor temperature and humidity data loggers (Manufacturer—Gemini Data Loggers (UK) Ltd., Hampshire, UK), sourced from RS Components Ltd. (Northamptonshire, UK). (b) Tinytag indoor CO2 data logger (Manufacturer—Gemini Data Loggers (UK) Ltd.), sourced from RS Components Ltd. (c) Temtop Air Quality Monitors (Manufacture—Temtop Inc., Shenzhen, China), sourced from Temtop. (d) Multi-Function 4-in-1 Environmental Meter, sourced RS Components Ltd.
In evaluating thermal comfort, this study measured air temperature as the primary thermal parameter. Although operative temperature is the more comprehensive index—being a function of both air and mean radiant temperatures—the prior literature and professional standards suggest that in well-insulated buildings, the difference between air temperature and mean radiant temperature is often minimal [28,29,30]. As such, air temperature was deemed a reliable proxy for thermal assessment in this context. Furthermore, ventilation rates (e.g., ACH), mean radiant temperature, and air velocity were not directly measured due to equipment limitations. However, CO2 concentrations were monitored to provide indirect insights into ventilation effectiveness. This approach aligns with practical POE practices in large-scale HE buildings, where the installation of advanced HVAC monitoring instruments may not always be feasible.
The environmental data monitoring was systematically conducted during the winter months, spanning from November to March. This period was strategically chosen because of the potential for significant variations in the indoor environment, which are primarily driven by the increased challenges associated with heating and maintaining comfortable indoor temperatures during colder weather. The monitoring equipment was programmed to record environmental data at five-minute intervals following the TM68 guidelines as well as drawing from methodologies adopted in similar studies. Furthermore, consistent with the TM68 recommendations, and to ensure an accurate representation of the occupants’ exposure, the equipment was strategically placed at heights of 0.8 and 1.1 m (illustrated in Figure 2a,b, respectively). These heights are considered to approximate the breathing zones of seated or standing individuals depending on the typical usage of each monitored space. This placement strategy was crucial for capturing data that truly reflects the environmental conditions experienced by building occupants, thereby providing a robust foundation for subsequent analyses of IEQ dynamics. Additionally, while ISO 7726 [31] recommends multi-point vertical averaging for detailed thermal comfort analyses, this study prioritized capturing occupant-relevant exposure in real-world HE spaces, where stratification effects were expected to be minimal due to standard room heights and mixing. Moreover, for parameters such as CO2, VOCs, and RH, vertical variation is negligible in occupied zones and a single-point reading within the breathing zone reliably reflects occupant exposure [32]. Therefore, the placement strategy used here reflects both methodological precedent and practical field constraints typical of POE studies.
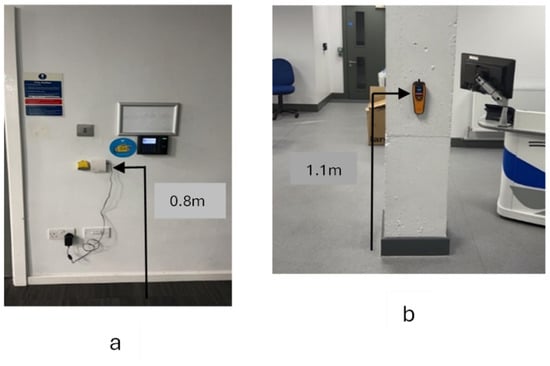
Figure 2.
(a,b) Instrumentation placement for data collection (Source: Authors’ own work).
The questionnaire survey process, which was conducted concurrently with the environmental data collection, represents the second part of the POE process. It was conducted to effectively gauge the perception of the IEQ using students as a target group, following previous studies and research, as students’ daily engagement with these environments places them in a unique position to offer valuable insights into how IEQ factors affect their comfort and learning experience. To effectively capture these perceptions, a web-based survey was developed using Google Forms and distributed via QR codes to ensure widespread participation. The survey questions incorporated Likert scale, open-ended, and mixed-type questions designed to gather the participants’ immediate perceptions and responses regarding various IEQ factors, which allowed for a concrete understanding of the multiple factors that contribute to the overall IEQ. These questions were designed to reflect participants’ real-time experiences and preferences, aligning with the perceptual scales and semantic anchors outlined in ISO 10551 [33] and other related IEQ studies such as [34]. A total of 163 valid responses were collected exclusively from students at University A, due to access restrictions at the second institution. The participants were not required to provide identifying information, and their responses reflected real-time perceptions within the spaces they occupied.
To complement the quantitative and qualitative data gathered from the environmental monitoring and student surveys, semi-structured interviews were conducted with five facilities management professionals working in the UK HE sector. Each interview was conducted in person and lasted approximately 45 min, thereby providing ample time to explore in depth the management practices, challenges, and priorities of HE facilities. These discussions covered a broad spectrum of topics essential to managing educational institutions, including IEQ, energy efficiency initiatives, and the integration of sustainability practices within the HE built environment. The interviewees were anonymized using alpha codes (e.g., FM-A to FM-E) to ensure ethical compliance and maintain institutional confidentiality.
Additionally, the research also involved the development of a prototype system aimed at improving IEQ management, which served as the BIM-based solution. This phase included the application of software engineering principles to create a system framework (Figure 3) that incorporates various technologies and programming tools to enable seamless integration of real-time sensor data with the BIM environment. The prototype system consists of the following technical components:
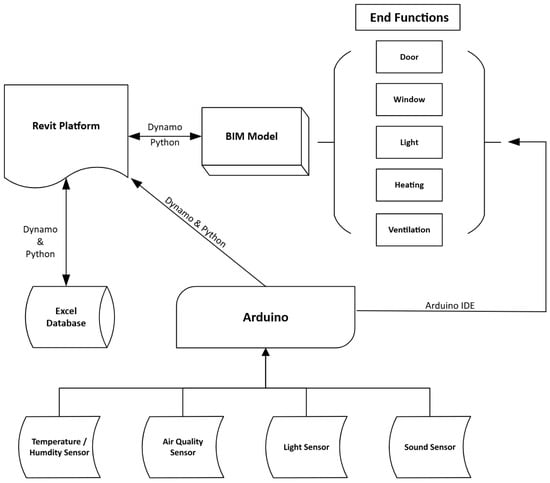
Figure 3.
Prototype framework (Source: Authors’ own work).
- An Arduino Uno R3 microcontroller, which serves as the core control unit that connects the environmental sensors to the system by facilitating the collection of data from various sensors, including those measuring temperature, humidity, and other IEQ parameters. It also enabled real-time communication between the sensors and the central processing unit, which makes the system highly responsive to changing indoor conditions.
- Autodesk Revit v2024, which serves as the core BIM software environment within which the entire system primarily operates. Revit provides a robust platform for creating detailed 3D models of the built environment, thereby allowing the prototype to integrate spatial data with real-time environmental metrics.
- The visual programming tool within Revit v2024, Dynamo v2.17, provides the avenue for the automation of workflows and integration of real-time sensor data into the BIM model. By using custom-built Dynamo scripts, the collected data is processed and spatially linked to the relevant building components, which ensures that each space’s environmental metrics are accurately reflected within the BIM model.
- Python 3.11 scripts, embedded within Dynamo, handle the complex data analysis and processing tasks, including the storage of the real-time storage of sensor data in an Excel database, the interval storage of this data, and the synthesis of the raw data as it is received from sensors.
- An Excel database, which serves as the central repository where the real-time data is logged, organized, and made accessible for further analysis. This database allows for historical trend analysis and provides a foundation for automated control decisions based on accumulated data.
- A traffic light system to visually indicate the real-time status of the indoor environment based on the sensor data. Through Arduino, the traffic light provides a clear, immediate understanding of IEQ conditions by changing colors according to IEQ parameters.
- Motor actuators mimic the physical control of environmental conditions within the building. These actuators are connected to the system via Arduino and are responsible for enacting changes such as adjusting window openings, controlling shades, or modifying HVAC settings by reacting to the real-time environmental data, thus providing an automated response to maintain optimal IEQ.
The conceptual framework, as illustrated in Figure 3, structures the prototype into several functional modules that work together to ensure the effective monitoring, analysis, and control of IEQ in HE buildings. The key function modules include:
- Data Acquisition Module: Responsible for gathering real-time environmental data from sensors connected to the Arduino microcontroller. This data is continuously collected and stored in the centralized Excel database for further processing.
- Data Processing and BIM Implementation Module: This module processes the raw environmental data to ensure accuracy before it is integrated into the Revit BIM model using Dynamo and Python scripts. This enables users to visualize environmental conditions in each space and analyze data within the context of the building model.
- Visualization and Monitoring Module: Through the Revit environment, this module presents real-time environmental data in a user-friendly format. It includes visual indicators such as color-coded compliance checks against IEQ standards, thus enabling immediate feedback on the building’s performance. Additionally, the traffic light system visually represents the IEQ status, where the green, yellow, and red lights indicate whether environmental conditions are within acceptable limits or if intervention is needed.
- Control and Feedback Module: The control module reacts to the data collected and triggers alerting systems such as ventilation or lighting in the form of actuator motors to maintain optimal indoor conditions.
- User Interaction Module: This module enhances user engagement by providing an intuitive interface built using the pyRevit plugin, thereby allowing users to navigate through the IEQ data effortlessly. The system’s interaction functions ensure that users can easily access, interpret, and respond to the displayed environmental information, which enables proactive management of the IEQ within individual spaces.
3. POE Results
The POE conducted across the two university campuses provided insightful data that highlighted the variability in IEQ conditions across different spaces. The mean evaluation of the environmental data recorded across the various rooms demonstrated compliance in most of the IEQ parameters as outlined in Table 2. To provide a clearer representation of the continuous monitoring process, Figure 4 presents the continuous temperature data recorded in the Architectural Studio, one of the naturally ventilated spaces included in the study. This chart illustrates typical diurnal fluctuations and responses to both external and internal conditions, capturing the room’s thermal behaviour over an extended period (5–10 December 2022). While only one room is shown in detail for practicality and clarity, this trend was generally consistent across the other naturally ventilated spaces in the study, with comparable profiles observed. The data presented in Figure 4 demonstrates clear fluctuations in indoor temperature across the monitored period, reflecting dynamic interactions between internal heat gains, external weather conditions, and the limited control afforded by natural ventilation. Peaks above 25 °C were observed particularly on 5 December, exceeding the BB101 upper threshold for teaching spaces, which observations showed coincided with sustained heating. Conversely, dips below 20 °C occurred during early morning and evening hours, indicating periods when heating was relatively inactive. The variability reinforces the susceptibility of naturally ventilated rooms like the Architectural Studio to environmental swings, particularly in winter.
Table 2.
Temperature and occupant density correlation.
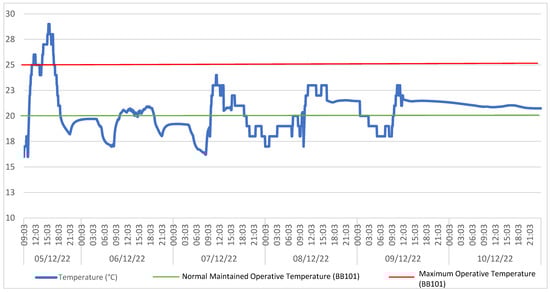
Figure 4.
Continuous temperature monitoring data for the Architectural Studio (Source: Authors’ own work).
To highlight specific instances of non-compliance and thermal stress, Figure 5 displays selected data representing the worst-performing temperature periods across each monitored room. These days were identified based on the frequency and magnitude of exceedances above the upper operative temperature limit of 25 °C, as defined by BB101. This standard was selected for its direct applicability to UK educational institutions and is consistent with local regulatory expectations. While European standards such as EN 16798-2 [35] provide valuable categorizations (e.g., Category I–III), BB101 offers space-specific guidance tailored to classroom settings in the UK, thereby serving as a more contextually relevant reference point for this research. Notably, spaces such as the PC Room (A) and Classroom (A), both naturally ventilated, recorded prolonged periods above this threshold. Observations indicated that the heating systems in these rooms were constantly on and while the windows were open occasionally, with the outdoor air temperature being between 3 and 8 °C, the natural ventilation system may not suffice for maintaining thermal comfort, particularly when the internal heat gains are factored. The excessive temperatures in naturally ventilated spaces such as these tend to compromise the learning environment, thereby causing discomfort to students [36,37,38].
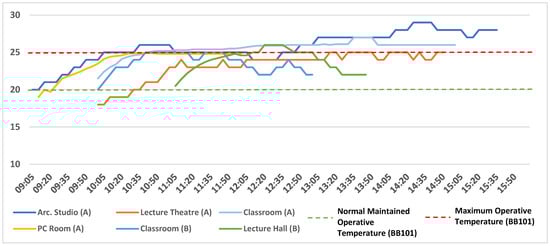
Figure 5.
Temperature (°C) data (Source: Authors’ own work).
A Pearson correlation analysis across four monitored rooms, as displayed in Table 2, examined the relationship between the temperature and occupant density. The correlations ranged from −0.266 to 0.4163, which indicates generally weak positive correlations between occupant density and room temperature, and in some instances, weak negative correlations. This observation suggests that the presence and density of occupants in the respective rooms have a minimal impact on the temperature fluctuations. This reinforces the notion that other factors likely play more significant roles in determining indoor temperature levels. These findings align with studies conducted by [39], who explored the interactions between occupant density, ventilation, and indoor environmental quality. Their research concluded that while occupant density can influence CO2 levels, its effect on temperature is often mitigated by the building’s HVAC systems’ efficiency and the external climatic conditions.
Similarly, the CO2 concentration levels were also continuously recorded across the selected spaces, with a particular focus on understanding how different ventilation strategies impacted indoor air quality. As with temperature, a continuous monitoring chart for CO2 concentration in the Architectural Studio is provided in Figure 6, which offers a broader perspective of IAQ variation over time. This room was selected as a representative example due to its combination of high occupancy, natural ventilation, and observed exceedances. The data shows that concentration peaks were consistently recorded during occupied periods, particularly on 5 and 8 December, with values surpassing the 1500 ppm threshold set by BB101. This underscores insufficient ventilation effectiveness under higher occupant loads. Nighttime readings dropped significantly, confirming reduced activity and natural dilution. The pattern of repeated exceedances during peak hours highlights a recurring IAQ issue in naturally ventilated learning spaces, reinforcing the need for improved ventilation strategies or supplemental mechanical systems to maintain CO2 levels within acceptable limits during teaching hours.
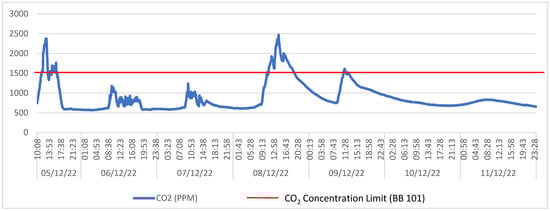
Figure 6.
Continuous CO2 monitoring data for the Architectural Studio (Source: Authors’ own work).
Figure 7 presents a comparative data snapshot of the worst-performing periods across the monitored rooms, and it shows that the naturally ventilated rooms often recorded CO2 levels beyond the 1500 ppm limit, with the highest recordings around 2360 ppm during peak occupancy times in Architectural Studio (A). In such instances, while the occupant density may be a factor, the natural ventilation present in such rooms also may not be sufficient to maintain CO2 concentration levels within acceptable limits. Importantly, studies have shown that a high level of CO2 concentration can adversely affect the cognitive functions and decision-making capabilities of occupants, as elevated CO2 levels have been linked to decreased productivity and increased discomfort [40,41,42]. As such, this highlights the importance of optimizing ventilation strategies such as increasing ventilation rates, ensuring a sufficient supply of fresh air, managing CO2 concentrations and sustaining healthy indoor environments, especially in naturally ventilated spaces like this studio [43]. Conversely, the rooms characterized with mechanical ventilation such as the Lecture Theatre (A) consistently recorded optimum CO2 levels within acceptable limits, as is evident in its average CO2 reading, which is the lowest. This points to the efficacy in mechanically ventilated rooms in maintaining lower and more stable CO2 levels throughout the day, aligning with findings that mechanical systems can more effectively manage air quality [44].

Figure 7.
CO2 (ppm) data (Source: Authors’ own work).
The holistic average data for all the monitored environmental parameters is outlined in Table 3. Average relative humidity levels were within the 40–70% range, thus indicating suitable moisture content in the air for occupant comfort and wellbeing. Concentrations of TVOCs and formaldehyde (HCHO) remained well below the thresholds of 0.3 mg/m3 and 0.1 mg/m3, respectively, which indicates good air quality with regard to chemical contaminants. Particulate matter (PM2.5) levels were consistently lower than the 25 µg/m3 limit, and average noise levels in majority of the rooms were within the acceptable bounds of 40 dBA, indicating a conducive acoustic environment. Furthermore, illuminance levels generally met or exceeded the 500 lux benchmark, thereby indicating adequate lighting for educational activities. However, Lecture Hall (B), located on the lower ground level, registered relative humidity outside the ideal range, which could have been potentially influenced by its unique underground environmental conditions. Additionally, the illuminance in Classroom (B) did not reach the 500 lux standard, likely due to the types of light fixtures, the use of blinds that restrict natural light, and overcast conditions at the time of measurement. Despite these exceptions, the overall findings reflect a positive overall alignment with IEQ standards and recommendations conducive to teaching and learning.
Table 3.
Average IEQ parameter measurements across various rooms in Universities A and B compared with relevant standards. (Source: Authors’ own work).
The qualitative feedback from the surveys reinforced these findings, with many students reporting that variations in thermal comfort significantly affected their concentration and overall satisfaction. This feedback was particularly profound in spaces with poor ventilation, where respondents reported feelings of discomfort related to opening windows and doors. Regarding sound levels, the majority of the monitored spaces maintained acceptable noise levels. However, there were instances where traffic noise occasionally pushed sound levels beyond the recommended limits, particularly in rooms facing busy streets. While these occurrences were infrequent, they did contribute to moments of distraction and discomfort among the students. Lighting conditions were generally satisfactory, with most areas achieving adequate illumination [43]. However, the study identified issues with unbalanced and uneven lighting in certain zones, leading to visual discomfort for some occupants. Interviews with the facilities management professionals highlighted the complexities of manually adjusting environmental controls within these large, diverse spaces. They expressed a need for more automated systems that could dynamically adjust settings based on real-time data to more effectively manage IEQ holistically.
POE Summary
The comprehensive POE conducted across the institutions has culminated in a nuanced understanding of the intricate challenges associated with managing IEQ in HE buildings. The environmental data monitoring revealed instances where the temperature and CO2 levels exceeded recommended standards, directly affecting student comfort and concentration. However, most of the other environmental parameters such as TVOC and HCHO largely complied with the standards. The survey feedback outlined various responses, for instance, regarding the perception of deteriorating air quality throughout class sessions, which indicated a slightly worsening of the air quality, as reported by 17% of the respondents, and with over 25% of respondents describing temperature in the rooms as “warm“ or “hot”, which highlights the need for real-time air quality monitoring [43]. Furthermore, the interviews with facilities management professionals highlighted some issues, ranging from the diverse IEQ needs of a large student and staff population to the physical constraints of the manual management by the FM professionals of the vast complex spaces associated with HE buildings. The POE outcomes clearly demonstrate the complexity of delivering a consistent, comfortable, and sustainable environment within the dynamic and multifaceted spaces of HE buildings. In response to these findings, the proposed solution is the development of a BIM-based system designed to monitor and control IEQ in real time. The solution would encapsulate a dynamic and automated approach to managing IEQ by integrating real-time sensor data with a BIM framework. The system’s capacity for automation would enable a more responsive and tailored approach to maintaining optimal conditions in each unique space, thereby addressing the individualized comfort requirements expressed by the building occupants.
4. BIM-Based Prototype Development
The framework of the BIM-based prototype, as illustrated in Figure 8, involves the synergy of functions or modules, including the integration of sensor systems, advanced data processing using Dynamo and Python within Autodesk Revit for the storage of IEQ data in the BIM model and the subsequent implementation of the IEQ data into the BIM model, and a responsive control system. Each component plays a vital role in the continuous cycle of data collection, analysis, and environment adjustment, thereby ensuring that the indoor conditions are consistently aligned with the recommended standards for the wellbeing and comfort of building occupants.

Figure 8.
BIM-based prototype framework (Source: Authors’ own work).
4.1. Room Sensor System
The room sensor system (the real live set-up and framework shown in Figure 9 and Figure 10, respectively) forms a crucial part of the BIM-prototype framework with its major task being the continuous monitoring of environmental parameters. This system utilizes a variety of sensors, each designed to detect specific environmental indicators which are crucial for maintaining optimal indoor conditions. The process of environmental data monitoring, as explained in previous sections, measured these different environmental indicators and thus, some of these form the core of the sensor system.
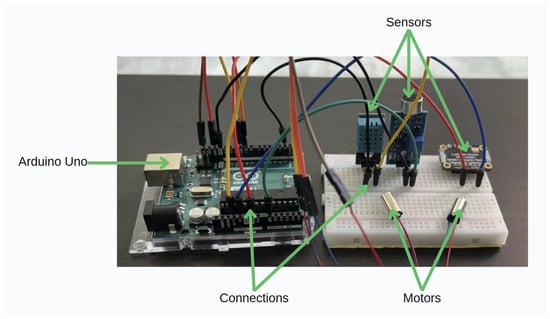
Figure 9.
Live setup of the room sensor system (Source: Authors’ own work).
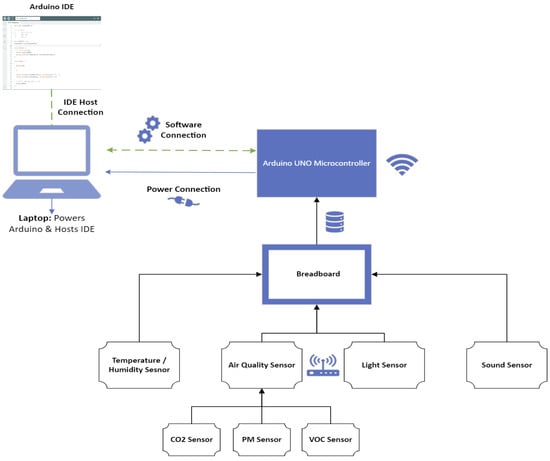
Figure 10.
Room sensor system framework (Source: Authors’ own work).
The other core part of the sensor system is the connection of the environmental sensors to an Arduino UNO microcontroller, as depicted in Figure 7 and Figure 8, which is a versatile open-source electronics platform that combines robust hardware with user-friendly software [49]. The sensors are connected to the Arduino UNO via a breadboard, which provides a convenient platform for constructing an electronic interface between the Arduino and the sensors as well as easy adjustments and additions of sensors as required. The system is also capable of incorporating wireless technology, which allows for more flexible sensor placement and real-time data transmission to the Arduino Uno. This feature reduces the clutter and limitations associated with wired connections, thereby making the installation and scalability of the sensor system more efficient.
Once connected, the sensors are programmed for use via the Arduino Integrated Development Environment (IDE), which is an application that supports both the writing of new code and the uploading of it to the Arduino board. This process thereby allows for the programming of the Arduino device to manage the interaction between the microcontroller and the connected sensors. The IDE is hosted on a laptop, which also provides power to the Arduino, which allows for the creation of a compact and efficient workstation for sensor management. Once the environmental sensors are connected and the Arduino is programmed using the IDE, which is shown in Figure 11 with a sample DHT sensor, the system begins to monitor the IEQ parameters continuously. The data from the sensors is read by uploading the code into the IDE, which can then be viewed through the serial monitor or serial plotter options in the menu bar. This comprehensive integration of hardware and software enables the room sensor system to provide reliable and real-time data that is crucial for effective IEQ management in HE buildings.
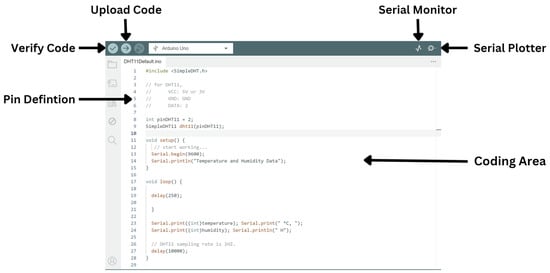
Figure 11.
Arduino IDE with DHT sensor (Source: Authors’ own work).
4.2. Sensor Data Management with BIM Integration
The next process in the framework involves the process of storing the sensor data in an Excel database, as illustrated in Figure 12. After integrating the environmental sensors with the Arduino Microcontroller, Autodesk Revit is used to serve as the central location for data processing, synthesis, and application. Within Revit lies Dynamo, which provides a visual programming interface that allows users to define custom functions without writing extensive code. This integration is especially beneficial for handling tasks that involve data from various sources, such as environmental sensors in a building.
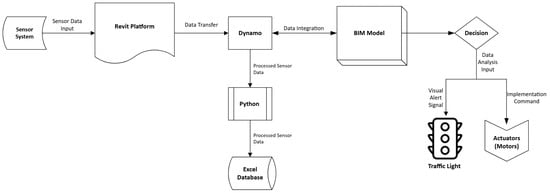
Figure 12.
Sensor data management and BIM integration framework (Source: Authors’ own work).
Dynamo is a crucial part of the prototype, as it allows for the automation of repetitive tasks in Revit, which enhances efficiency, sophisticated data manipulation, and conditional operations within the Revit environment. Furthermore, Dynamo has the capability to incorporate Python programming language scripts, which allows for data analysis and database operations, thus making it an ideal choice for processing environmental data. The process begins with the Firefly package in Dynamo, which is instrumental in interfacing directly with Arduino and other sensors to capture real-time data. Firefly provides a bridge between physical computing and the virtual modeling environment of Dynamo, thus enabling the direct import of sensor readings into the BIM software ecosystem.
Once the data is imported into Dynamo, it undergoes processing and synthesis using both Dynamo’s built-in nodes and custom Python scripts, which are represented in Figure 13. This step is critical for preparing the data for storage and ensuring it meets the necessary standards for accuracy and compatibility with the database structure. In this process, the retrieved data from the sensors is processed to ensure data integrity and synthesized to separate the data extracted from different sensors, as the node responsible for receiving the sensor data receives all sensor data simultaneously. The data is subsequently forwarded into the Python scripts for data storage in a specified Excel database. This database serves as a central repository where all the environmental data is stored, which allows for historical data analysis, trend identification, and informed decision making regarding building management. Python’s powerful data-handling capabilities further allow for the setting up of automated routines within Dynamo, which triggers data storage actions at predefined intervals, thereby making sure that the database is regularly updated without manual intervention.

Figure 13.
Dynamo overview for sensor data management and BIM integration (Source: Authors’ own work).
Furthermore, Dynamo provides a robust platform for not only processing data but also for mapping and integrating this data with the BIM model maintained in Revit. This integration is essential for associating real-time environmental data with specific physical spaces within the building. The figure below (Figure 14) shows the Revit model with the floor plan and the room spaces corresponding to the sensor locations. Revit spaces are essentially designated areas within a BIM model that can be related to specific physical environments or zones within a building and are typically named within the model for easy identification and data association. They are defined by the boundaries of the building’s physical structure, such as walls and floors, and each space can be assigned specific IEQ parameters, which help in simulating real-life conditions and evaluating building performance under various conditions.
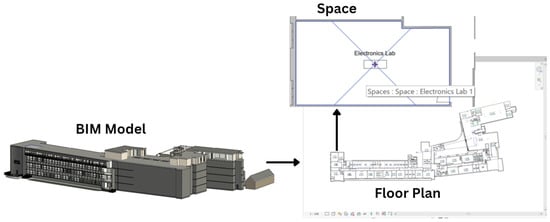
Figure 14.
BIM model with embedded floor plan detailing specific spaces (Source: Authors’ own work).
Following the sensor data integration into the BIM model, Revit and Dynamo can also be utilized to create visualizations, for instance, using color schemes. Utilizing color schemes to visualize different parameter performance within Revit spaces provides a visually intuitive method to analyze and communicate data directly in the BIM environment. This approach uses color coding to distinguish various environmental conditions whereby each parameter is assigned a specific color range. Specifically, CO2 levels, for instance, as shown in Figure 15, are represented through a color gradient, where green signifies CO2 concentrations within safe limits (up to 1000 ppm), yellow indicates moderate levels (1000 to 1500 ppm), and red indicates higher concentrations that exceed 1500 ppm, which suggests inadequate ventilation due to factors such as high occupant density that may compromise air quality. This method not only enhances the interpretability of the data but also integrates it visually into the BIM environment for immediate analysis.

Figure 15.
Color coding visualization (Source: Authors’ own work).
Consequently, the framework advances to a decision-making process (depicted in Figure 10) where the conditions are evaluated against predefined thresholds. The decisions resulting from this analysis lead to direct actions through actuators for environment adjustments and also trigger visual alerts. A traffic light system is integrated at this stage to provide visual signals that reflect the current status directly aligned with the BIM model’s data. This addition provides a straightforward, color-coded visual feedback consisting of similar colors found in the Revit color coding scheme (green, yellow, and red). The traffic light changes colors in response to the environmental data detected by the sensors, as shown in Figure 16, which demonstrates the real-time operation of the traffic light system, showing how changes in the sensor data are reflected in both the BIM model and traffic light simultaneously. This integration highlights the practical application of processed sensor data in real-time environmental management.

Figure 16.
Showing the synchronization of color changes in the BIM model and traffic light (Source: Authors’ own work).
4.3. Automated Control System Overview
Beyond data visualization and analysis, the integration of sensor data into the BIM model via Dynamo also facilitates the automation of environmental adjustments, which represents the final function or module of the framework referred to as the control system. As illustrated in Figure 17, this system utilizes the real-time data integrated into the BIM to optimize the IEQ, thus guaranteeing that building operations are both efficient and responsive to the immediate needs of occupants. It is centralized around the Arduino microcontroller that functions as the control unit, managing various environmental control mechanisms based on the data processed and the commands generated. In this setup, Arduino, through the Arduino IDE, receives these data insights and based on predefined conditions, sends out control signals to various actuators that are responsible for adjusting environmental conditions. For instance, when the ventilation control signal is sent, the HVAC actuators are engaged to adjust the airflow, which allows for the optimization of the air quality and temperature. Expanding this capability, motor actuators are integrated to the prototype via Arduino, as shown in Figure 14, to physically enact these changes, such as opening windows or adjusting shades, thus mimicking real-world operations based on the automated decisions. These actuators transform electronic commands into mechanical actions, facilitating the adjustments made by the control system to have a direct and effective impact on the building’s environment.
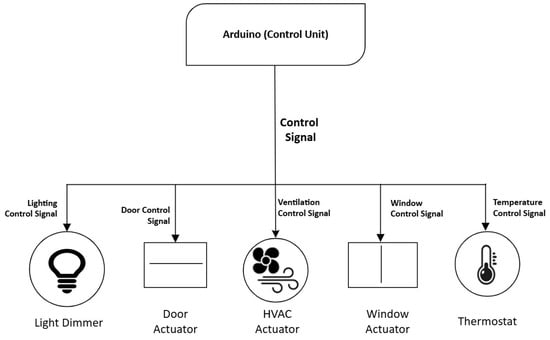
Figure 17.
Control system framework (Source: Authors’ own work).
4.4. Custom Revit IEQ Interface
To further enhance the practical application of the BIM-based IEQ management prototype, a custom IEQ interface was developed within Revit using pyRevit and Python scripting. This custom interface, which is accessible under a dedicated “IEQ” tab, integrates multiple functionalities for visualizing, analyzing, and managing IEQ metrics such as temperature, CO2 levels, and relative humidity. The interface tab, as illustrated in Figure 18, enables users to dynamically monitor real-time data collected through the system and make informed decisions on environmental adjustments.
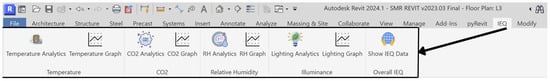
Figure 18.
IEQ custom interface tab (Source: Authors’ own work).
Integrated within the custom IEQ tab button are different pushbuttons, as outlined in Figure 18. The “Show IEQ Data” button serves as a critical tool for the real-time visualization of IEQ metrics within specific building spaces. Figure 19 presents the Python script used to develop the button, which integrates with the Revit API to retrieve sensor data associated with the building elements. When selected, the button through the Python script fetches data from the corresponding element in the BIM model. It then extracts the parameters and displays them in a user-friendly dialog box. The script makes use of Revit’s “TaskDialog” to present this data to the user in a format that is easy to interpret; as such this functionality allows users to assess the current conditions of individual spaces instantly, thereby providing an intuitive way to monitor and view real-time IEQ data. Furthermore, the script incorporates “Unicode” to include special characters, such as temperature in “°C”, which ensures that the data is clearly and precisely represented. Accessing this live data directly within the BIM model enables users to navigate through different spaces in the building to quickly identify areas that may require immediate adjustments or optimization, allowing for informed decision making for building operations.
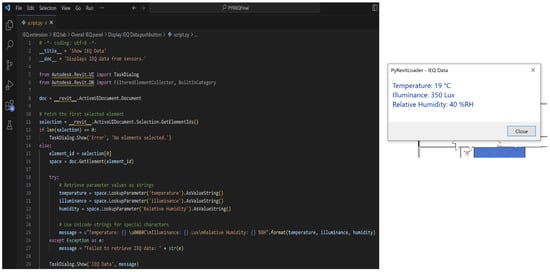
Figure 19.
Python script and Revit user interface for real-time IEQ data visualization using the “Show IEQ Data” pushbutton (Source: Authors’ own work).
Furthermore, integrated within the IEQ tab are the respective IEQ parameters associated with the “Analytics” and “Graph” pushbuttons, as shown in Figure 18. The respective “Graph” buttons for each IEQ parameter are designed to provide a detailed graphical representation of the collected data over time, with a sample illustrated in Figure 20. When activated, this button displays real-time and historical data trends in an easily interpretable visual format, which allows users to track fluctuations in environmental conditions. Also included in the graph is the compliance standards relevant to each IEQ parameter, which aids in creating a clear visual reference for tracking whether the measured values fall within the acceptable thresholds. This functionality is particularly useful for identifying trends, anomalies, and potential issues in building performance. For instance, users can quickly assess how CO2 levels, as shown in the Figure 20 below, fluctuate throughout the day and compare them against recommended maximum limits to determine if ventilation systems need adjustments.
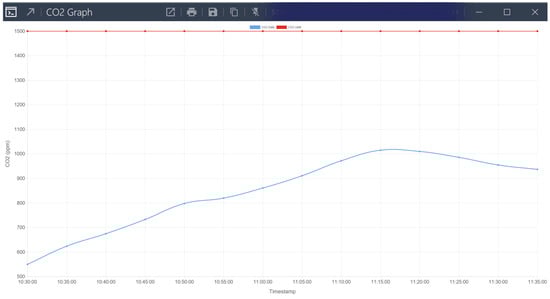
Figure 20.
Sample IEQ graph from the interface (Source: Authors’ own work).
The Analytics pushbutton, on the other hand, is a feature that allows users to access a detailed analysis of the environmental data through multiple tabs, as shown in Figure 21. The “CSV Data” tab presents a comprehensive time-stamped record of respective IEQ parameter measurements captured at regular intervals. This straightforward visualization provides users with a clear and organized log of environmental conditions over time. The “Compliance Check” tab evaluates each recorded metric against established IEQ standards to ascertain any deviating conditions. This feature empowers facility managers to proactively address potential environmental concerns by providing immediate feedback on whether specific parameters, such as CO2 or temperature levels, are within acceptable thresholds. Finally, the “Colour Scheme” tab adds another layer of intuitive data representation by implementing a color-coded system that corresponds to the recorded IEQ metric’s performance. As mentioned above, for instance, the temperature levels are displayed with a gradient or distinct colors to indicate acceptable, borderline, and critical thresholds. This visual aid allows for the quick assessment of environmental quality, thus enabling more efficient decision making in real time.
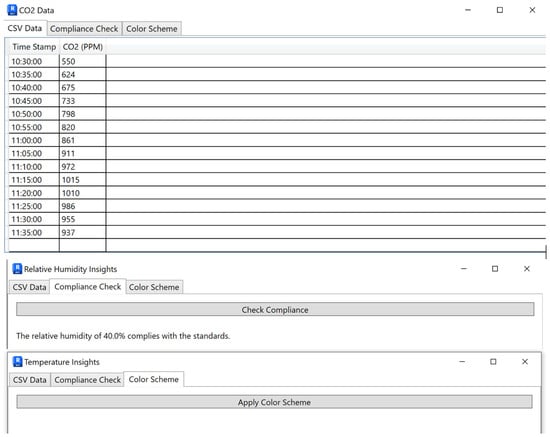
Figure 21.
The IEQ analytics interface (Source: Authors’ own work).
5. Discussion
The BIM-based prototype developed in this research represents a step forward in addressing the complexities of managing IEQ in HE buildings. This prototype not only demonstrates the potential for real-time monitoring and control but also lays the foundation for further development of a more comprehensive IEQ management system.
Integrating sensors with the BIM model, the prototype provides an efficient solution to the manual oversight of vast and complex building spaces, which is a common challenge in traditional HE facilities. The system’s current capabilities can be expanded to include extended equipment that further automates building operations. For instance, automatic window openers and ventilation switches can be incorporated into the system to regulate airflow, thus responding to real-time environmental data. Similarly, integrating automatic thermostats and lighting dimmers will enhance the system’s ability to maintain optimal conditions without the need for human intervention. Solar lighting systems could also be introduced to improve indoor lighting, especially in areas that receive insufficient natural light. This would further contribute to energy efficiency while also enhancing visual comfort [50].
Comparable efforts have recently emerged in the field. Ref. [51] developed an autonomous mobile robotic system equipped with IoT sensors to map indoor conditions using the authors’ laboratory as a case study. Their prototype used a microcontroller to collect environmental data at different points within BIM-based layouts to improve spatial resolution and awareness. However, unlike the approach presented in this study, their system relied on external robotic navigation and dashboards rather than embedding sensor feedback within the BIM environment itself. Similarly, ref. [52] explored the integration of Revit, Arduino, and Dynamo for indoor environmental monitoring, using an IoT platform to visualize the sensor readings. Yet, their data was displayed externally, with fewer built-in BIM visualization and compliance tools.
By contrast, the system developed in this research provides real-time sensor feedback, visualized directly within Revit using color-coded indicators and compliance zones, facilitating an intuitive and immediate understanding of spatial IEQ conditions. This streamlined integration marks a distinct advancement in usability and potential for adoption, particularly within HE institutions seeking to align FM operations with digital twin strategies.
Furthermore, the modular structure of this prototype has the potential for seamless expansion. Equipment such as motorized actuators for windows, switches for ventilation and air conditioning (AC) systems, and dimmable lighting controls can be linked to the control system, which respond to sensor data inputs. For example, when sensors detect elevated indoor temperatures or poor air quality, the system could automatically open windows or activate AC units to maintain ideal conditions. The inclusion of solar lighting systems would also complement natural light sources by adjusting indoor lighting levels to align with real-time illuminance readings, which guarantees that indoor environments are energy efficient while also improving occupant comfort.
Practically, the prototype requires minimal initial investment beyond the existing BIM infrastructure and low-cost sensors, which makes it accessible to HE institutions looking to improve their building management practices. Furthermore, the use of widely available and open-source components, such as Arduino and Dynamo, makes the prototype adaptable to various building types and sizes, without the need for extensive customization or high-end technology investments. Although this is an early-stage prototype, its framework can evolve into a more complex, fully autonomous IEQ management system that will address both current and future challenges in building operation and occupant health.
Future iterations could also integrate more advanced Internet of Things (IoT) capabilities, which can enhance the system’s ability to communicate between devices and further automate the environmental management process. Additionally, machine learning algorithms can be incorporated to predict future IEQ conditions based on historical data, in turn enhancing the system’s proactive capabilities. For instance, ref. [53] developed a Deep Q-Learning algorithm to optimize thermal comfort and CO2 levels in university classrooms. Their system, trained in a simulated environment, reduced energy use by 43% and CO2 levels by 24% compared to conventional systems. Similarly, ref. [54] used a deep reinforcement learning (DRL) algorithm trained on a decade of data to maintain thermal comfort and reduce CO2 while lowering energy consumption by up to 5%. These studies underscore the practical viability of AI-driven IEQ management, further supporting the direction of this research’s proposed future enhancements.
On the academic front, the study expands the existing body of knowledge on IEQ by providing empirical insights into the integration of sensor data with BIM to improve environmental monitoring and control. The research also contributes to the state of the art in IEQ management by demonstrating the potential for real-time feedback and automated control systems. This not only advances theoretical knowledge but also offers practical implications for facility managers and decision-makers in HE institutions. By leveraging BIM’s capabilities for spatial visualization and data integration, this research highlights the importance of digital twins and smart building technologies in optimizing the health, comfort, and wellbeing of building occupants.
6. Conclusions
This research investigated the IEQ within HE buildings by utilizing a robust POE to assess both the physical conditions and occupant perceptions as well as professional insights from facilities managers. The findings reveal that while many spaces remained within general IEQ compliance thresholds, key challenges persist, particularly with temperature and CO2 control. For example, temperature readings in naturally ventilated rooms such as the Architectural Studio and PC Room exceeded the 25 °C upper threshold for more than 3 h, and CO2 concentrations in some spaces peaked at 2500 ppm, surpassing the recommended 1500 ppm limit for extended periods. These trends directly influenced occupant discomfort, with over 25% of survey respondents in these rooms describing the temperature as “warm” or “hot” and 17% reporting worsening air quality. Additionally, the POE process highlighted operational challenges within the FM domain, particularly the difficulty of maintaining consistent IEQ across large and complex HE buildings using traditional manual methods. Facilities managers emphasized the impracticality of tracking fluctuating conditions across multiple rooms and floors without automated support. These findings underscore the need for scalable, responsive IEQ management strategies in HE environments.
In response to these findings, this study proposes a feasible and technically sound solution through the development of a BIM-based prototype. The integration of BIM technology with real-time sensor data, processed using Dynamo and Python scripts within the Revit environment, allows for a more automated and responsive approach to IEQ management. The system is designed to actively monitor and respond to changes in environmental parameters, thereby facilitating immediate adjustments to maintain optimal conditions. Through this approach, the BIM-based system not only enhances occupant comfort, health, and productivity but also alleviates the burden on facility managers by reducing the reliance on manual interventions.
A practical conclusion arising from this work is that future implementations can further improve system scalability and flexibility by incorporating wireless sensor networks and IoT architectures. This would allow for easier deployment across existing HE campuses without relying on intrusive rewiring or hardware retrofitting. Additionally, there is strong potential to explore mobile robotic platforms as part of a dynamic sensing network that is capable of mapping real-time IEQ across zones, aligning with recent research into BIM-integrated robotics and autonomous FM systems.
Nonetheless, a key limitation of the research lies in the bespoke nature of the proposed solution, whereby any practical implementation would need to be tailored to suit the unique characteristics and requirements of individual buildings, limiting its direct transferability across different institutional settings. Despite this, the proposed system provides a strong foundation for developing smarter, more efficient building management solutions that prioritize both human wellbeing and operational effectiveness across HE environments.
Ultimately, this research contributes to a growing body of knowledge on the intersection of IEQ, BIM, and smart building technologies and highlights a promising pathway for the future of facility management in educational environments.
Author Contributions
Conceptualization, M.M. and C.F.; methodology, M.M.; software, M.M.; validation, M.M., C.F. and E.B.; formal analysis, M.M.; investigation, M.M.; resources, C.F., P.K. and S.S.; data curation, M.M. and E.B.; writing—original draft preparation, M.M.; writing—review and editing, C.F., E.B., M.S., P.K. and S.S.; visualization, M.M. and E.B.; supervision, C.F. and M.S. All authors have read and agreed to the published version of the manuscript.
Funding
This research received no external funding.
Institutional Review Board Statement
Ethics approval for the study was granted by the University of West London Ethics Committee (Approval Date is 4 October 2022. Reference id.: UWL/REC/SCT-01183), and all procedures were conducted in accordance with institutional guidelines and the UK Data Protection Act.
Informed Consent Statement
Informed consent was obtained from all the interview participants via signed consent forms, while the questionnaire responses were anonymous and voluntary, with all the data securely stored and handled in compliance with ethical standards.
Data Availability Statement
The original contributions presented in this study are included in the article. Further inquiries can be directed to the corresponding author(s).
Conflicts of Interest
The authors declare no conflicts of interest.
Abbreviations
The following abbreviations are used in this manuscript:
| ACH | Air Changes per Hour |
| BIM | Building Information Modeling |
| CO2 | Carbon Dioxide (ppm) |
| FM | Facilities Management |
| HCHO | Formaldehyde (µg/m3) |
| HE | Higher Education |
| IANL | Indoor Ambient Noise Level (dBA) |
| IEQ | Indoor Environmental Quality |
| PM2.5 | Particulate Matter (µg/m3) |
| POE | Post-occupancy Evaluation |
| RH | Relative Humidity (%) |
| TVOC | Total Volatile Organic Compound (µg/m3) |
References
- Bernstein, S. The United Nations and the Governance of Sustainable Development Goals; Kanie, N., Biermann, F., Eds.; The MIT Press: Cambridge, MA, USA, 2017; pp. 213–240. [Google Scholar]
- Dimitrios, K. Built environment and indoor air quality: The case of volatile organic compounds. AIMS Environ. Sci. 2021, 8, 135–147. [Google Scholar]
- ASHRAE. Guideline 10P, Interactions Affecting the Achievement of Acceptable Indoor Environments; Second Public Review; ASHRAE: Atlanta, GA, USA, 2010. [Google Scholar]
- Chen, C.F.; Yilmaz, S.; Pisello, A.L.; De Simone, M.; Kim, A.; Hong, T.; Bandurski, K.; Bavaresco, M.V.; Liu, P.L.; Zhu, Y. The impacts of building characteristics, social psychological and cultural factors on indoor environment quality productivity belief. Build. Environ. 2020, 185, 107189. [Google Scholar] [CrossRef]
- Altomonte, S.; Schiavon, S.; Kent, M.G.; Brager, G. Indoor environmental quality and occupant satisfaction in green-certified buildings. Build. Res. Inf. 2019, 47, 255–274. [Google Scholar] [CrossRef]
- Kamaruzzaman, S.N.; Egbu, C.O.; Mahyuddin, N.; Zawawi, E.M.A.; Chua, S.J.L. Effect of Indoor Environmental Quality (IEQ) to the Human Occupation Health and Performance in Buildings. In University of East London (UEL) Repository. 2019. Available online: https://core.ac.uk/download/pdf/228124676.pdf (accessed on 21 May 2025).
- Ackley, A.; Donn, M.; Thomas, G. The Influence of Indoor Environmental Quality in Schools. In Back to the Future: The Next 50 Years, Proceedings of the 51st International Conference of the Architectural Science Association (ANZAScA), Wellington, New Zealand, 29 November–2 December 2017; Schnabel, M.A., Ed.; Architectural Science Association: Australia, 2017; pp. 625–634. [Google Scholar]
- Sadrizadeh, S.; Yao, R.; Yuan, F.; Awbi, H.; Bahnfleth, W.; Bi, Y.; Cao, G.; Croitoru, C.; de Dear, R.; Haghighat, F.; et al. Indoor air quality and health in schools: A critical review for developing the roadmap for the future school environment. J. Build. Eng. 2022, 57, 104908. [Google Scholar] [CrossRef]
- Nasrullah, S.; Khan, M.S. The Impact of Time Management on the Students’ Academic Achievements. J. Lit. Lang. Linguist. 2015, 11, 66–71. [Google Scholar]
- Kamaruzzaman, S.N.; Razali, A.; Zawawi, A.; Riley, M. Factors affecting Indoor Environmental Quality and potential health risks of housing residents. In Proceedings of the National Invention and Innovation Through Exhibition Competition Conference, Jitra Kedah, Malaysia, 20–23 March 2017. [Google Scholar]
- Weerasinghe, A.S.; Rasheed, E.O.; Rotimi, J. Occupants’ Decision-Making of Their Energy Behaviours in Office Environments: A Case of New Zealand. Sustainability 2023, 15, 2305. [Google Scholar] [CrossRef]
- Claysen, G.; Wyon, D.P. The combined effects of many different indoor environmental factors on acceptability and office work performance. HVAC R Res. 2008, 14, 103–113. [Google Scholar] [CrossRef]
- Abdulaali, S.; Usman, I.; Hanafiah, M.; Abdulhasan, M.; Hamzah, M.; Nazal, A. Impact of poor Indoor Environmental Quality (IEQ) to Inhabitants’ Health, Wellbeing and Satisfaction. Int. J. Adv. Sci. Technol. 2020, 29, 1284–1296. [Google Scholar]
- Awang, N.; Mahyuddin, N.; Kamaruzzaman, S. Indoor Environmental Quality Assessment and Users Perception in Meru Secondary School (SMK Meru). J. Build. Perform. 2015, 6, 1–11. [Google Scholar]
- Khalil, N.A.; Kamoona, G.M.I. The Effect of Indoor Air Quality in University Classrooms on the Immunity of Its Occupants. Int. J. Sustain. Dev. Plan. 2022, 17, 2453–2461. [Google Scholar] [CrossRef]
- Choi, S.; Guerin, D.; Kim, H.; Brigham, J.; Bauer, T. Indoor Environmental Quality of Classrooms and Student Outcomes: A Path Analysis Approach. J. Learn. Spaces 2014, 2, 2013–2014. [Google Scholar]
- Bluyssen, P.M. The Healthy Indoor Environment: How to Assess Occupants’ Wellbeing in Buildings, 1st ed.; Routledge: London, UK, 2013. [Google Scholar]
- Burridge, H.C.; Bontitsopoulos, S.; Brown, C.; Carter, H.; Roberts, K.; Vouriot, C.; Weston, D.; Mon-Williams, M.; Williams, N.; Noakes, C. Variations in classroom ventilation during the COVID-19 pandemic: Insights from monitoring 36 naturally ventilated classrooms in the UK during 2021. J. Build. Eng. 2022, 63, 105459. [Google Scholar] [CrossRef] [PubMed]
- Hodges, C.P. A facility manager’s approach to sustainability. J. Facil. Manag. 2005, 3, 312–324. [Google Scholar] [CrossRef]
- Lee, S.Y.; Kang, M. Innovation characteristics and intention to adopt sustainable facilities management practices. Ergonomics 2013, 56, 480–491. [Google Scholar] [CrossRef]
- Brink, H.W.; Loomans, M.G.L.C.; Mobach, M.P.; Kort, H.S.M. Classrooms’ indoor environmental conditions affecting the academic achievement of students and teachers in higher education: A systematic literature review. Indoor Air 2021, 31, 405–425. [Google Scholar] [CrossRef]
- Amaral, A.R.; Rodrigues, E.; Gaspar, A.R.; Gomes, Á. A review of empirical data of sustainability initiatives in university campus operations. J. Clean. Prod. 2020, 250, 119558. [Google Scholar] [CrossRef]
- Hoang, G.; Vu, D.; Le, N.; Nguyen, T. Benefits and challenges of BIM implementation for facility management in operation and maintenance face of buildings in Vietnam. IOP Conf. Ser. Mater. Sci. Eng. 2020, 869, 022032. [Google Scholar] [CrossRef]
- Du, J.; Hoeft, M. Use of BIM in Building Operations and Maintenance: An Approach to Identifying Sustainable Value, KTH Royal Institute of Technology, KTH DiVA. 2020. Available online: https://urn.kb.se/resolve?urn=urn:nbn:se:kth:diva-277036 (accessed on 21 May 2025).
- Condotta, M.; Scanagatta, C. BIM-based method to inform operation and maintenance phases through a simplified procedure. J. Build. Eng. 2023, 65, 105730. [Google Scholar] [CrossRef]
- Marzouk, M.; Abdelaty, A. BIM-based framework for managing performance of subway stations. Autom. Constr. 2014, 41, 70–77. [Google Scholar] [CrossRef]
- Alavi, H.; Bortolini, R.; Forcada, N. BIM-based decision support for building condition assessment. Autom. Constr. 2022, 135, 104117. [Google Scholar] [CrossRef]
- CIBSE. Monitoring Indoor Environmental Quality (TM68); Knowledge Series; Chartered Institution of Building Services Engineers: London, UK, 2022. [Google Scholar]
- CIBSE. Guide A, Environmental Design; Chartered Institution of Building Services Engineers: London, UK, 2021. [Google Scholar]
- Walikewitz, N.; Jänicke, B.; Langner, M.; Meier, F.; Endlicher, W. The difference between the mean radiant temperature and the air temperature within indoor environments: A case study during summer conditions. Build. Environ. 2015, 84, 151–161. [Google Scholar] [CrossRef]
- ISO 7726:1998; Ergonomics of the Thermal Environment—Instruments for Measuring Physical Quantities. International Organization for Standardization: Geneva, Switzerland, 1998.
- WHO. Methods for Sampling and Analysis of Chemical Pollutants in Indoor Air; World Health Organization: Copenhagen, Denmark, 2020. [Google Scholar]
- ISO 10551:2019; Ergonomics of the Physical Environment—Subjective Judgement Scales for Assessing Physical Environments. International Organization for Standardization: Geneva, Switzerland, 1998.
- Ali, S.M. Measured and Perceived Conditions of Indoor Environmental Qualities (IEQ) of University Learning Environments in Semi-arid Tropics: A Field Study in Kano-Nigeria. Ph.D. Thesis, University of Portsmouth, Portsmouth, UK, 2018. Available online: https://pure.port.ac.uk/ws/portalfiles/portal/13075145/Sani_s_Thesis_up_713220_.pdf (accessed on 21 May 2025).
- EN 16798-2:2019; Energy Performance of Buildings—Ventilation for Buildings—Part 2: Interpretation of the Requirements in EN 16798-1. European Committee for Standardization: Brussels, Belgium, 2019.
- Jiang, J.; Wang, D.; Liu, Y.; Xu, Y.; Liu, J. A study on pupils’ learning performance and thermal comfort of primary schools in China. Build. Environ. 2018, 134, 102–113. [Google Scholar] [CrossRef]
- Elnaklah, R.; Ayyad, Y.; Alnusairat, S.; AlWaer, H.; AlShboul, A. A Comparison of Students’ Thermal Comfort and Perceived Learning Performance between Two Types of University Halls: Architecture Design Studios and Ordinary Lecture Rooms during the Heating Season. Sustainability 2023, 15, 1142. [Google Scholar] [CrossRef]
- Geng, Y.; Ji, W.; Lin, B.; Zhu, Y. The impact of thermal environment on occupant IEQ perception and productivity. Build. Environ. 2017, 121, 158–167. [Google Scholar] [CrossRef]
- Mendell, M.J.; Heath, G.A. Do indoor pollutants and thermal conditions in schools influence student performance? A critical review of the literature. Indoor Air 2005, 15, 27–52. [Google Scholar] [CrossRef]
- Greene, R.; Eftekhari, M.; Clements–Croome, D.; Georgiou, G. Measurements of CO2 Levels in a Classroom and its Effect on the Performance of the Students; CIBSE ASHRAE Technical Symposium; Imperial College: London, UK, 2012; Loughborough Institutional Repository. [Google Scholar]
- Satish, U.; Mendell, M.J.; Shekhar, K.; Hotchi, T.; Sullivan, D.; Streufert, S.; Fisk, W.J. Is CO2 an Indoor Pollutant? Direct Effects of Low-to-Moderate CO2 Concentrations on Human Decision-Making Performance. Environ. Health Perspect. 2012, 120, 1671–1677. [Google Scholar] [CrossRef]
- Lama, S.; Fu, C.; Lee, A. Indoor Air Quality (IAQ) Evaluation of Higher Education Learning Environments. J. Smart Build. Constr. Technol. 2022, 4, 1–14. [Google Scholar] [CrossRef]
- Maigari, M.; Fu, C.; Deng, J.; Bahadori-Jahromi, A. Indoor Environmental Quality Study for Higher Education Buildings. In Advancements in Indoor Environmental Quality and Health; IntechOpen: Bevilacqua, Piero, 2023. [Google Scholar]
- Seppanen, O.A.; Fisk, W.J.; Mendell, M.J. Association of ventilation rates and CO2 concentrations with health andother responses in commercial and institutional buildings. Indoor Air 1999, 9, 226–252. [Google Scholar] [CrossRef]
- Building Bulleting (BB) 101; Ventilation, Thermal Comfort and Indoor Air Quality of School Buildings. Education and Skills Funding Agency: Coventry, UK, 2018.
- CIBSE. Guide A—Design Guide; Knowledge Series; Chartered Institution of Building Services Engineers: London, UK, 2017. [Google Scholar]
- Building Bulleting (BB) 93; Acoustic Design of Schools: Performance Standards. Education and Skills Funding Agency: Coventry, UK, 2014.
- BS EN 12464-1: 2021; Light and Lighting-Lighting of Work Places. British Standard (BS): London, UK, 2021.
- Octopart. Arduino Uno. 2014. Available online: https://datasheet.octopart.com/A000066-Arduino-datasheet-38879526.pdf (accessed on 21 May 2025).
- Nicoletti, F.; Carpino, C.; Cucumo, M.A.; Arcuri, N. The Control of Venetian Blinds: A Solution for Reduction of Energy Consumption Preserving Visual Comfort. Energies 2020, 13, 1731. [Google Scholar] [CrossRef]
- Hu, X.; Assaad, R.H. A BIM-enabled digital twin framework for real-time indoor environment monitoring and visualization by integrating autonomous robotics, LiDAR-based 3D mobile mapping, IoT sensing, and indoor positioning technologies. J. Build. Eng. 2024, 86, 108901. [Google Scholar] [CrossRef]
- D’UVa, D.; Bolognesi, C. Low-cost Real-Time monitoring with BIM Integration in a Polluted Urban Environment. ISPRS-Int. Arch. Photogramm. Remote. Sens. Spat. Inf. Sci. 2024, XLVIII-2/W, 133–138. [Google Scholar] [CrossRef]
- Yu, K.-H.; Chen, Y.-A.; Jaimes, E.; Wu, W.-C.; Liao, K.-K.; Liao, J.-C.; Lu, K.-C.; Sheu, W.-J.; Wang, C.-C. Optimization of thermal comfort, indoor quality, and energy-saving in campus classroom through deep Q learning. Case Stud. Therm. Eng. 2021, 24, 100842. [Google Scholar] [CrossRef]
- Valladares, W.; Ortiz, M.A.; Sebastián, R.; Coronas, A.I. Energy optimization in air conditioning systems using a deep reinforcement learning approach. Energy Build. 2019, 199, 372–380. [Google Scholar] [CrossRef]
Disclaimer/Publisher’s Note: The statements, opinions and data contained in all publications are solely those of the individual author(s) and contributor(s) and not of MDPI and/or the editor(s). MDPI and/or the editor(s) disclaim responsibility for any injury to people or property resulting from any ideas, methods, instructions or products referred to in the content. |
© 2025 by the authors. Licensee MDPI, Basel, Switzerland. This article is an open access article distributed under the terms and conditions of the Creative Commons Attribution (CC BY) license (https://creativecommons.org/licenses/by/4.0/).