Article

Habitat Quality Evolution and Multi-Scenario Simulation Based on Land Use Change in the Tacheng Region

1
College of Geography and Remote Sensing Science, Xinjiang University, Urumqi 830046, China
2
Key Laboratory of Oasis Ecology, Ministry of Education, Xinjiang University, Urumqi 830046, China
*
Author to whom correspondence should be addressed.
Sustainability 2025, 17(13), 6113; https://doi.org/10.3390/su17136113
Submission received: 26 May 2025 / Revised: 24 June 2025 / Accepted: 2 July 2025 / Published: 3 July 2025

Abstract

Habitat quality functions as a critical metric for evaluating regional ecological health and the capacity of ecosystem services. Understanding its temporal dynamics is critical for advancing ecological civilization sustainability. Focusing on the Tacheng region, this study analyzes the evolution characteristics of land use based on long-term sequential land use data from 2003 to 2023. By coupling the PLUS and InVEST models, it predicts land use change trends under three distinct scenarios for the year 2033 and assesses the spatiotemporal evolution characteristics of habitat quality in the Tacheng region from 2003 to 2033. Findings reveal: (1) The land use types in the Tacheng region are dominated by grassland and unutilized land. During 2003–2023, the area of grassland and water showed a decreasing trend, while the areas of cultivated land and unutilized land significantly increased. Among them, NDVI was identified as the primary driver influencing the expansion of cultivated land, grassland, and unutilized land in the Tacheng region, addressing the gap in quantitative contribution analysis of specific drivers in arid region studies. (2) Overall, habitat quality in the Tacheng region significantly deteriorated during 2003–2023, with areas of high habitat quality continuously decreasing and transitioning to medium and relatively low habitat quality zones. This degradation is primarily attributed to the unidirectional conversion of grassland and water into cultivated land and unutilized land. (3) Under different scenario simulations, land use and habitat quality in the Tacheng region exhibit marked differences, with habitat quality showing significant improvement, particularly under the ecological protection scenario. Compared to existing research, this study pioneers the coupling of PLUS and InVEST models in the typical arid region of the Tacheng region, implements localization of model parameters, quantifies future evolution trends of land use and habitat quality under multiple scenarios, and reveals core drivers of land use change in arid regions. This work addresses the research gap regarding habitat quality simulation and driving mechanisms in the Central Asian arid-semiarid transition zone.

1. Introduction

Land, functioning as the primary spatial matrix for human socioeconomic activities, sustains ecosystem stability through its material foundation and resource provision capacities [1]. Land use change directly characterizes the process features of human-land system interactions. It influences material cycling and energy flow pathways among habitat patches by altering surface cover patterns, thereby triggering cascading responses in ecosystem structure and function [2,3]. With economic development and population surge, the continuously intensifying scope and intensity of human activities have driven drastic transformations in land use structure, exacerbating human-land conflicts. Land use transitions from water and grassland to construction land and cultivated land have progressively fragmented biodiversity habitats. This unidirectional land use transformation not only exacerbates human-land conflicts but also undermines the self-regulating capacity of ecosystems [4]. Habitat quality, serving as a key indicator characterizing regional ecological health, essentially reflects the ability of specific ecosystems to sustain biodiversity levels [5,6]. Presently, habitat quality deterioration driven by land use imbalance poses significant threats to biodiversity conservation efforts. Therefore, elucidating the interrelationships between land use dynamics and habitat quality variations enhances comprehension of ecological impacts from human-land interactions and provides theoretical foundations for optimizing territorial spatial patterns and formulating ecological restoration strategies.
Current research prioritizes evaluating regional habitat quality dynamics through the lens of land use transformations. Dominant habitat assessment frameworks include the SolVES model [7], MaxEnt model [8], RSEI model [9], and InVEST model [10]. As a widely adopted framework for habitat quality valuation, the InVEST model demonstrates distinctive advantages compared with other assessment approaches, including lower research costs, broader research scales [11], enhanced result visualization, higher evaluation accuracy, and a more robust theoretical framework. Widely utilized in multi-scale habitat quality evaluations, including county-level [12], municipal-level [13], provincial-level [14], watershed [15], and nature reserve contexts. Chaplin-Kramer et al. [16] estimated global habitat quality variations by InVEST model resulting from cultivated land expansion, investigating trade offs between agricultural production and biodiversity preservation in tropical zones; Liu et al. [17] assessed the water conservation function and its spatial distribution characteristics in Anding District, Dingxi City for 2017 using the InVEST model and they found that imbalanced precipitation redistribution caused by topographic relief within the watershed exacerbates local soil erosion, consequently influencing habitat degradation processes; Chen et al. [18] evaluated habitat quality trends across China over the past four decades, coupling FLUS and InVEST frameworks to simulate land use scenarios through 2050 and assess their implications for habitat quality. In summary, the InVEST model exhibits maturity in both theoretical framework and operational systems [19]. Characterized by multi-scale applicability, high precision, and low cost, it has been extensively applied in habitat quality research.
Habitat quality evaluation exhibits a direct correlation with land use dynamics. The InVEST model has been integrated with simulation frameworks for land use dynamics (e.g., CA-Markov [20], FLUS [21], CLUE-S [22], Logistic-CA [23], PLUS [24]) to analyze and project habitat quality trends. Among these, the PLUS model exhibits superior performance in land-use simulations owing to its capabilities for large-scale, high-precision, and long-term sequential modeling [25,26]. Shi et al. [27] examined the projected spatial-temporal dynamics of ESV under varied 2035 scenarios in Jiuquan City by using the PLUS framework. Eduardo et al. [28] assessed the impact of future land use changes on habitat quality in Lithuania under different scenarios. The findings indicate that protecting existing forests, controlling urban sprawl, and implementing sustainable agricultural practices are crucial for mitigating habitat quality degradation and conserving biodiversity in Lithuania. Extensive research has examined habitat quality dynamics interrelated with land use transitions across various regions [29]. Although the PLUS-InVEST model has been applied in other regions, research on the evolution characteristics and multi-scenario predictions of habitat quality in Tacheng, a region characterized by a “mountain-oasis-desert” vertical zonation [30,31], still remains unexplored. This study innovatively couples multiple methods, including the IM, InVEST, and PLUS models. Integrating the arid region characteristics of Tacheng and relevant policies, we establish natural development, cultivated land protection, and ecological protection scenarios while improving threat factor weights. This enhances model applicability in arid-semiarid transition zones and achieves parameter localization. This study marks the first comprehensive evaluation and analysis of land use and habitat quality within Tacheng’s “mountain-oasis-desert” composite ecosystem, significantly enhancing the accuracy of land use change and habitat quality assessments in arid regions. This study achieves high-accuracy simulation and prediction of land use and habitat quality changes under three future scenarios in the Tacheng region, quantifying the response differences in habitat quality to varying policy orientations. Innovatively incorporating multiple factors, including NDVI, into the analysis of land use type expansion contributions based on the unique geographical positioning of Tacheng within the arid region enables a more comprehensive examination of land use expansion drivers in conjunction with the arid zone’s environmental attributes.
As a representative area of the Central Asian arid-semiarid transition zone in northwestern Xinjiang, the Tacheng region features a fully developed three-dimensional mountain-oasis-desert composite ecosystem. This system exhibits unique ecological sensitivity traits and biodiversity conservation functions, constituting a critical component of China’s northwestern ecological security barrier. Under the synergistic drivers of intensified climatic aridification and agricultural reclamation expansion in recent years, the land transformation process in the Tacheng region has markedly accelerated, leading to severe threats to ecosystem stability. Revealing the spatiotemporal differentiation patterns and evolution mechanisms of land use and habitat quality in the Tacheng region under dual pressures of economic development and ecological conservation is crucial for optimizing territorial spatial arrangements and land use structures. This thereby protects the integrity of the mountain-oasis-desert composite ecosystem.
Therefore, this study simulates and predicts land use change trends in the Tacheng region under different scenarios, assesses the impacts of varying development pathways on habitat quality, offers a scientific basis for formulating targeted ecological conservation strategies in arid regions, facilitates the optimization of Tacheng’s territorial spatial pattern, balances economic development with ecological protection, and promotes sustainable development within its three-dimensional composite ecosystem of “mountain-oasis-desert”. Particularly under the ecological protection scenario, simulation results demonstrate a significant improvement in habitat quality, highlighting both the importance and feasibility of implementing ecological protection measures within the “mountain-oasis-desert” composite ecosystem. By applying multiple models, this study not only enhances the accuracy and reliability of the assessment results but also offers a novel methodological framework for research in similar arid regions with unique geographical settings, thereby enriching the theoretical and methodological systems of the relevant field.

2. Materials and Methods
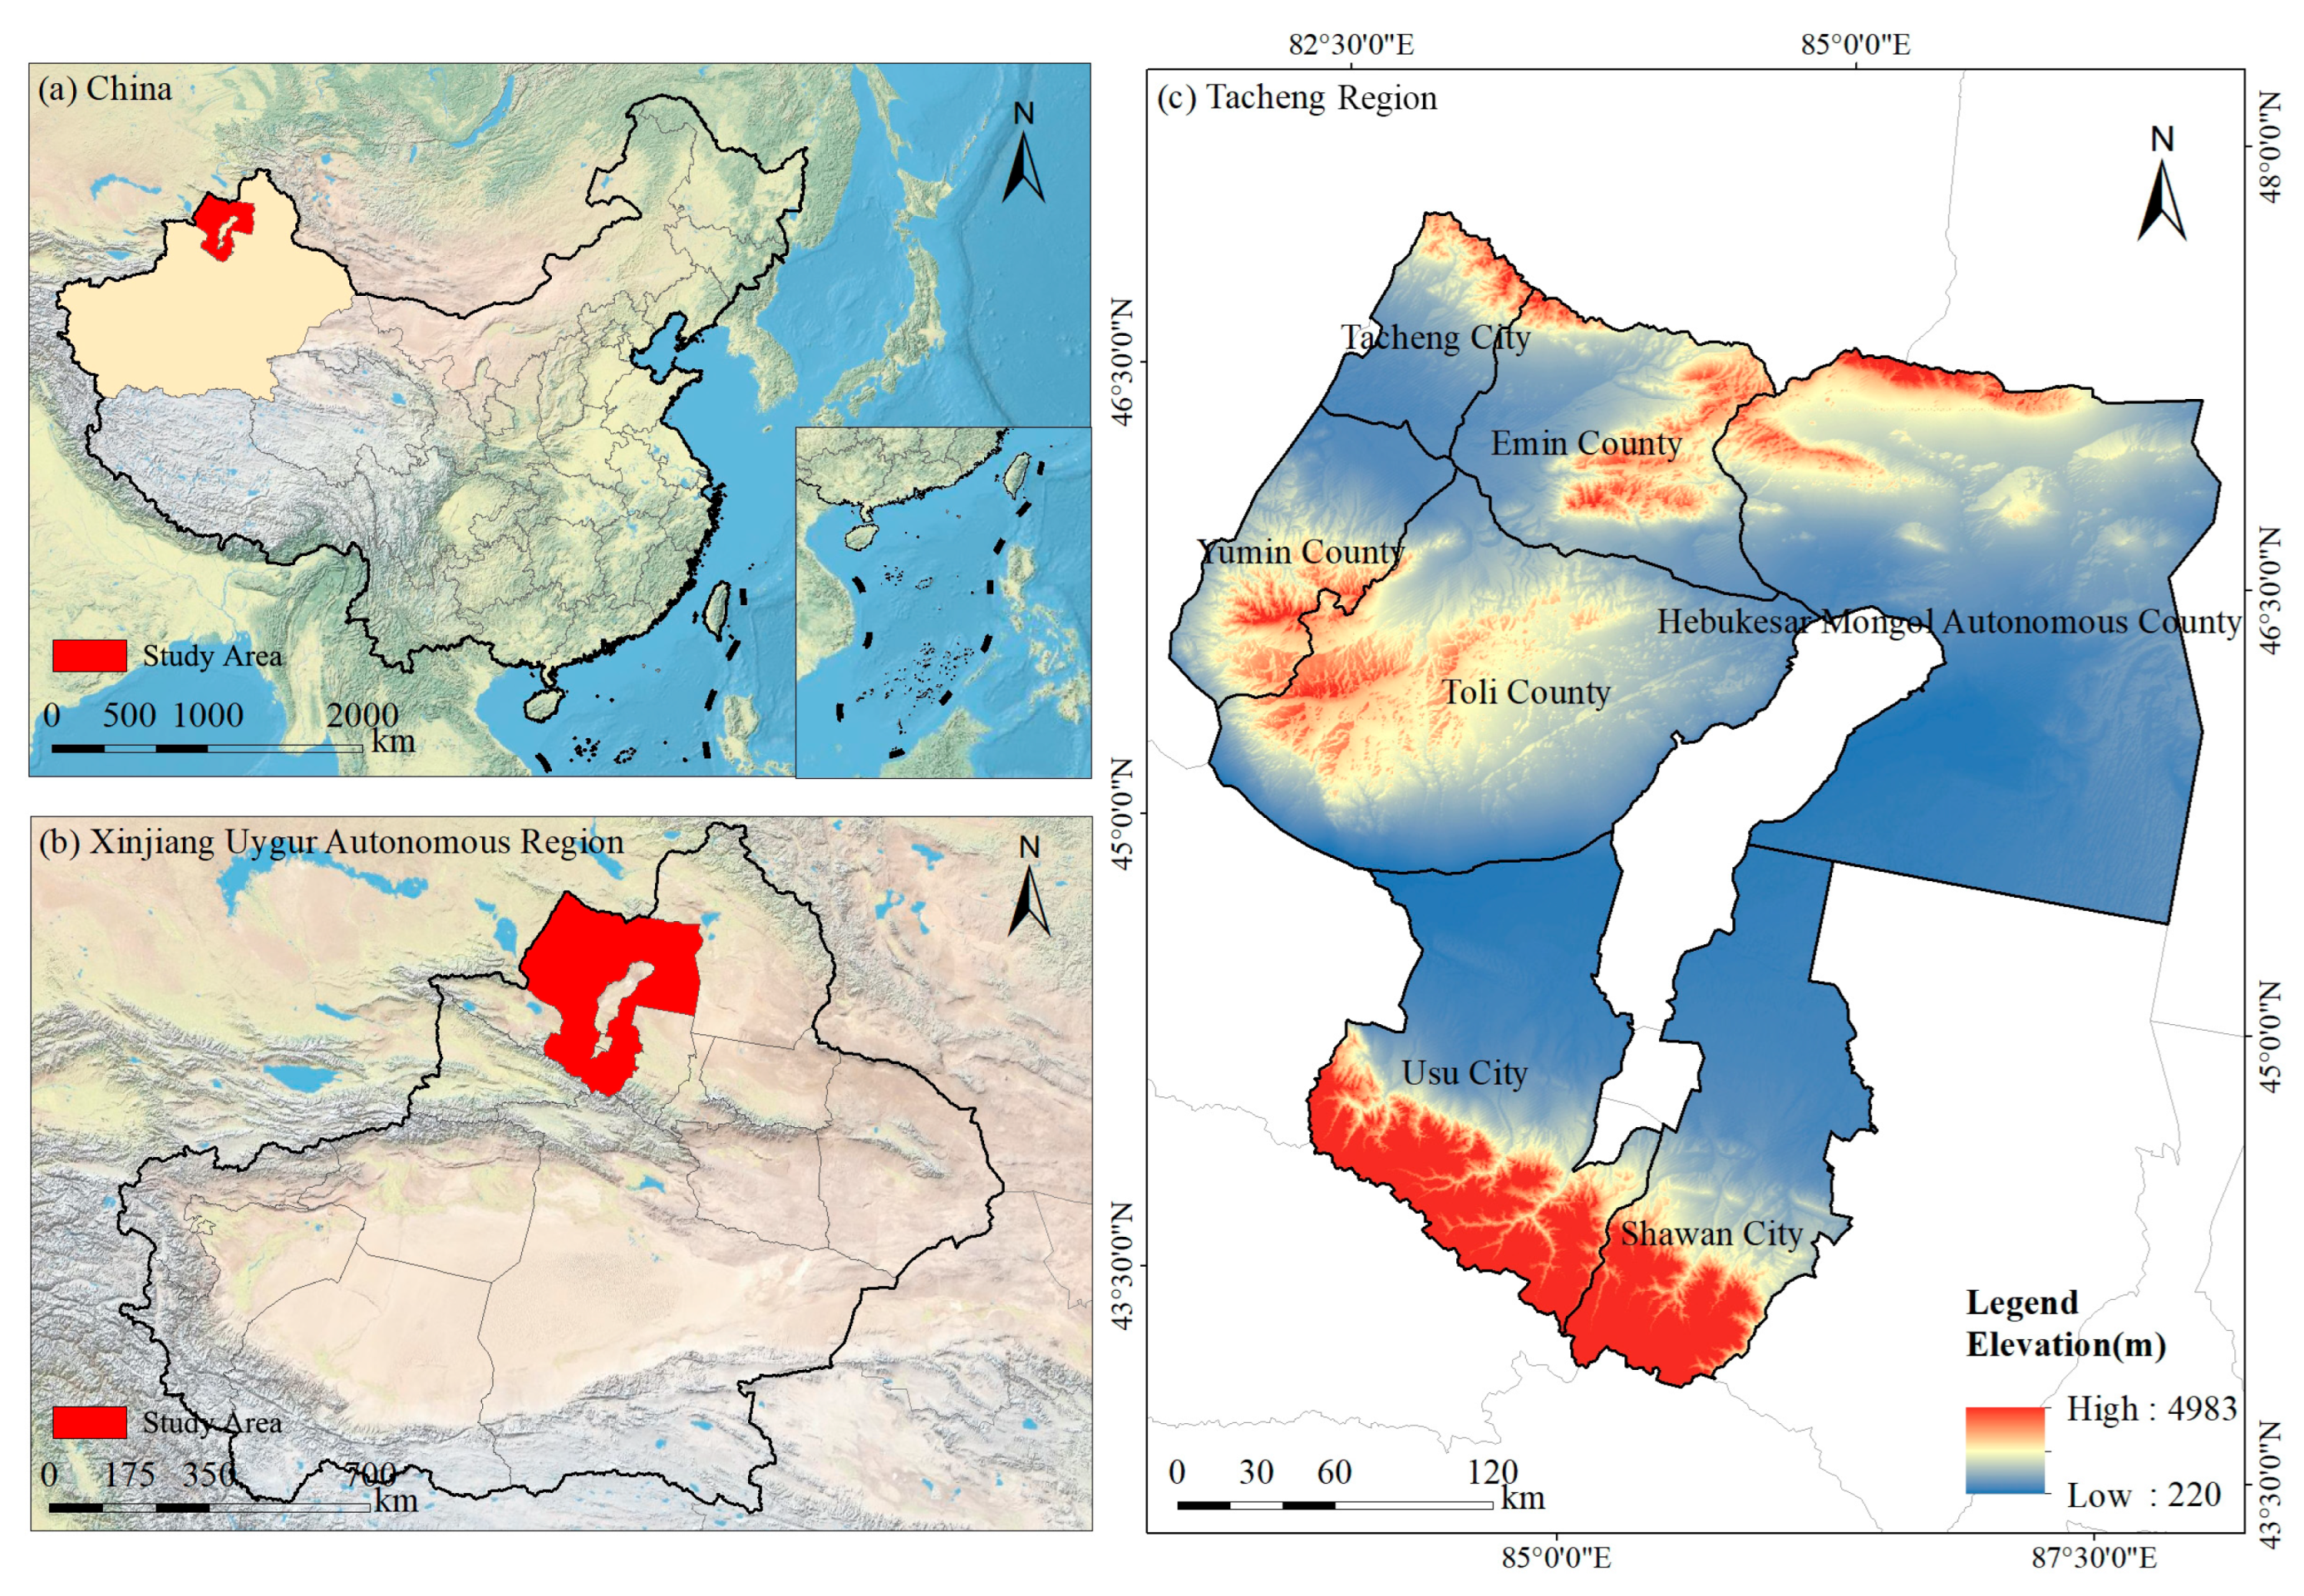
2.1. Study Area

The Tacheng region, geographically spanning latitudes 43°25′ N to 47°15′ N and longitudes 82°16′ E to 87°21′ E, occupies a strategic position in the Xinjiang Uygur Autonomous Region’s northwest sector, embedded within the Eurasian continental interior. And spans 94,800 km2 in geographical extent, administers 7 counties and cities, and had a permanent population of 936,000 as of 2023 (Figure 1). The Tacheng region is geographically bounded by the southern slopes of the Altai Mountains to the north and the northern periphery of the Junggar Basin to the south, with an overall terrain sloping from northeast to southwest. Spanning the transition zone between the Central Asian arid region and the temperate climate zone of northern Xinjiang, the Tacheng region exhibits typical temperate continental climate conditions, with mean annual temperatures spanning between 5.3 °C and 7.8 °C and pronounced spatiotemporal variation in annual precipitation (150–400 mm). This environment supports a fully developed “mountain-oasis-desert” composite ecosystem [32]: The Sawuer and Barluk Mountains in the north form a water conservation area with distinct elevation gradients; the alluvial fan complexes in the central region sustain the largest agro-pastoral ecotone situated along the northern aspect of the Tianshan Mountain range; and the Gurbantunggut Desert in the south hosts unique temperate desert biomes. This vertical zonality differentiation not only shapes regional landscape heterogeneity but also sustains rare hydrothermal redistribution mechanisms and biological corridor functions within the Central Asian inland arid region. As a critical node of the New Eurasian Land Bridge, the Tacheng region bears the dual mission of cross-border ecological security maintenance and Silk Road Economic Belt development. Studying the spatiotemporal dynamics of land use patterns and habitat quality in this region is critical for informing ecological preservation initiatives and sustainable socio-economic advancement strategies [33].

2.2. Data Sources

The research dataset encompasses elevation and slope information of the Tacheng region, along with land cover and road datasets across five phases in 2003, 2008, 2013, 2018, and 2023. The 30 m spatial resolution elevation and DEM were sourced from the Geospatial Data Cloud Platform of the Computer Network Information Center, Chinese Academy of Sciences “https://www.gscloud.cn/ (accessed on 22 November 2024)”. Land use raster datasets were sourced from the Resource and Environmental Science Data Center, Chinese Academy of Sciences “https://www.resdc.cn (accessed on 15 December 2024)”. Using ArcGIS, the original land categories were reclassified into six types: cultivated land, forestland, grassland, water, construction land, and unutilized land. Distances to water bodies and road networks were derived from OpenStreetMap. “https://www.openstreetmap.org (accessed on 28 December 2024)”.

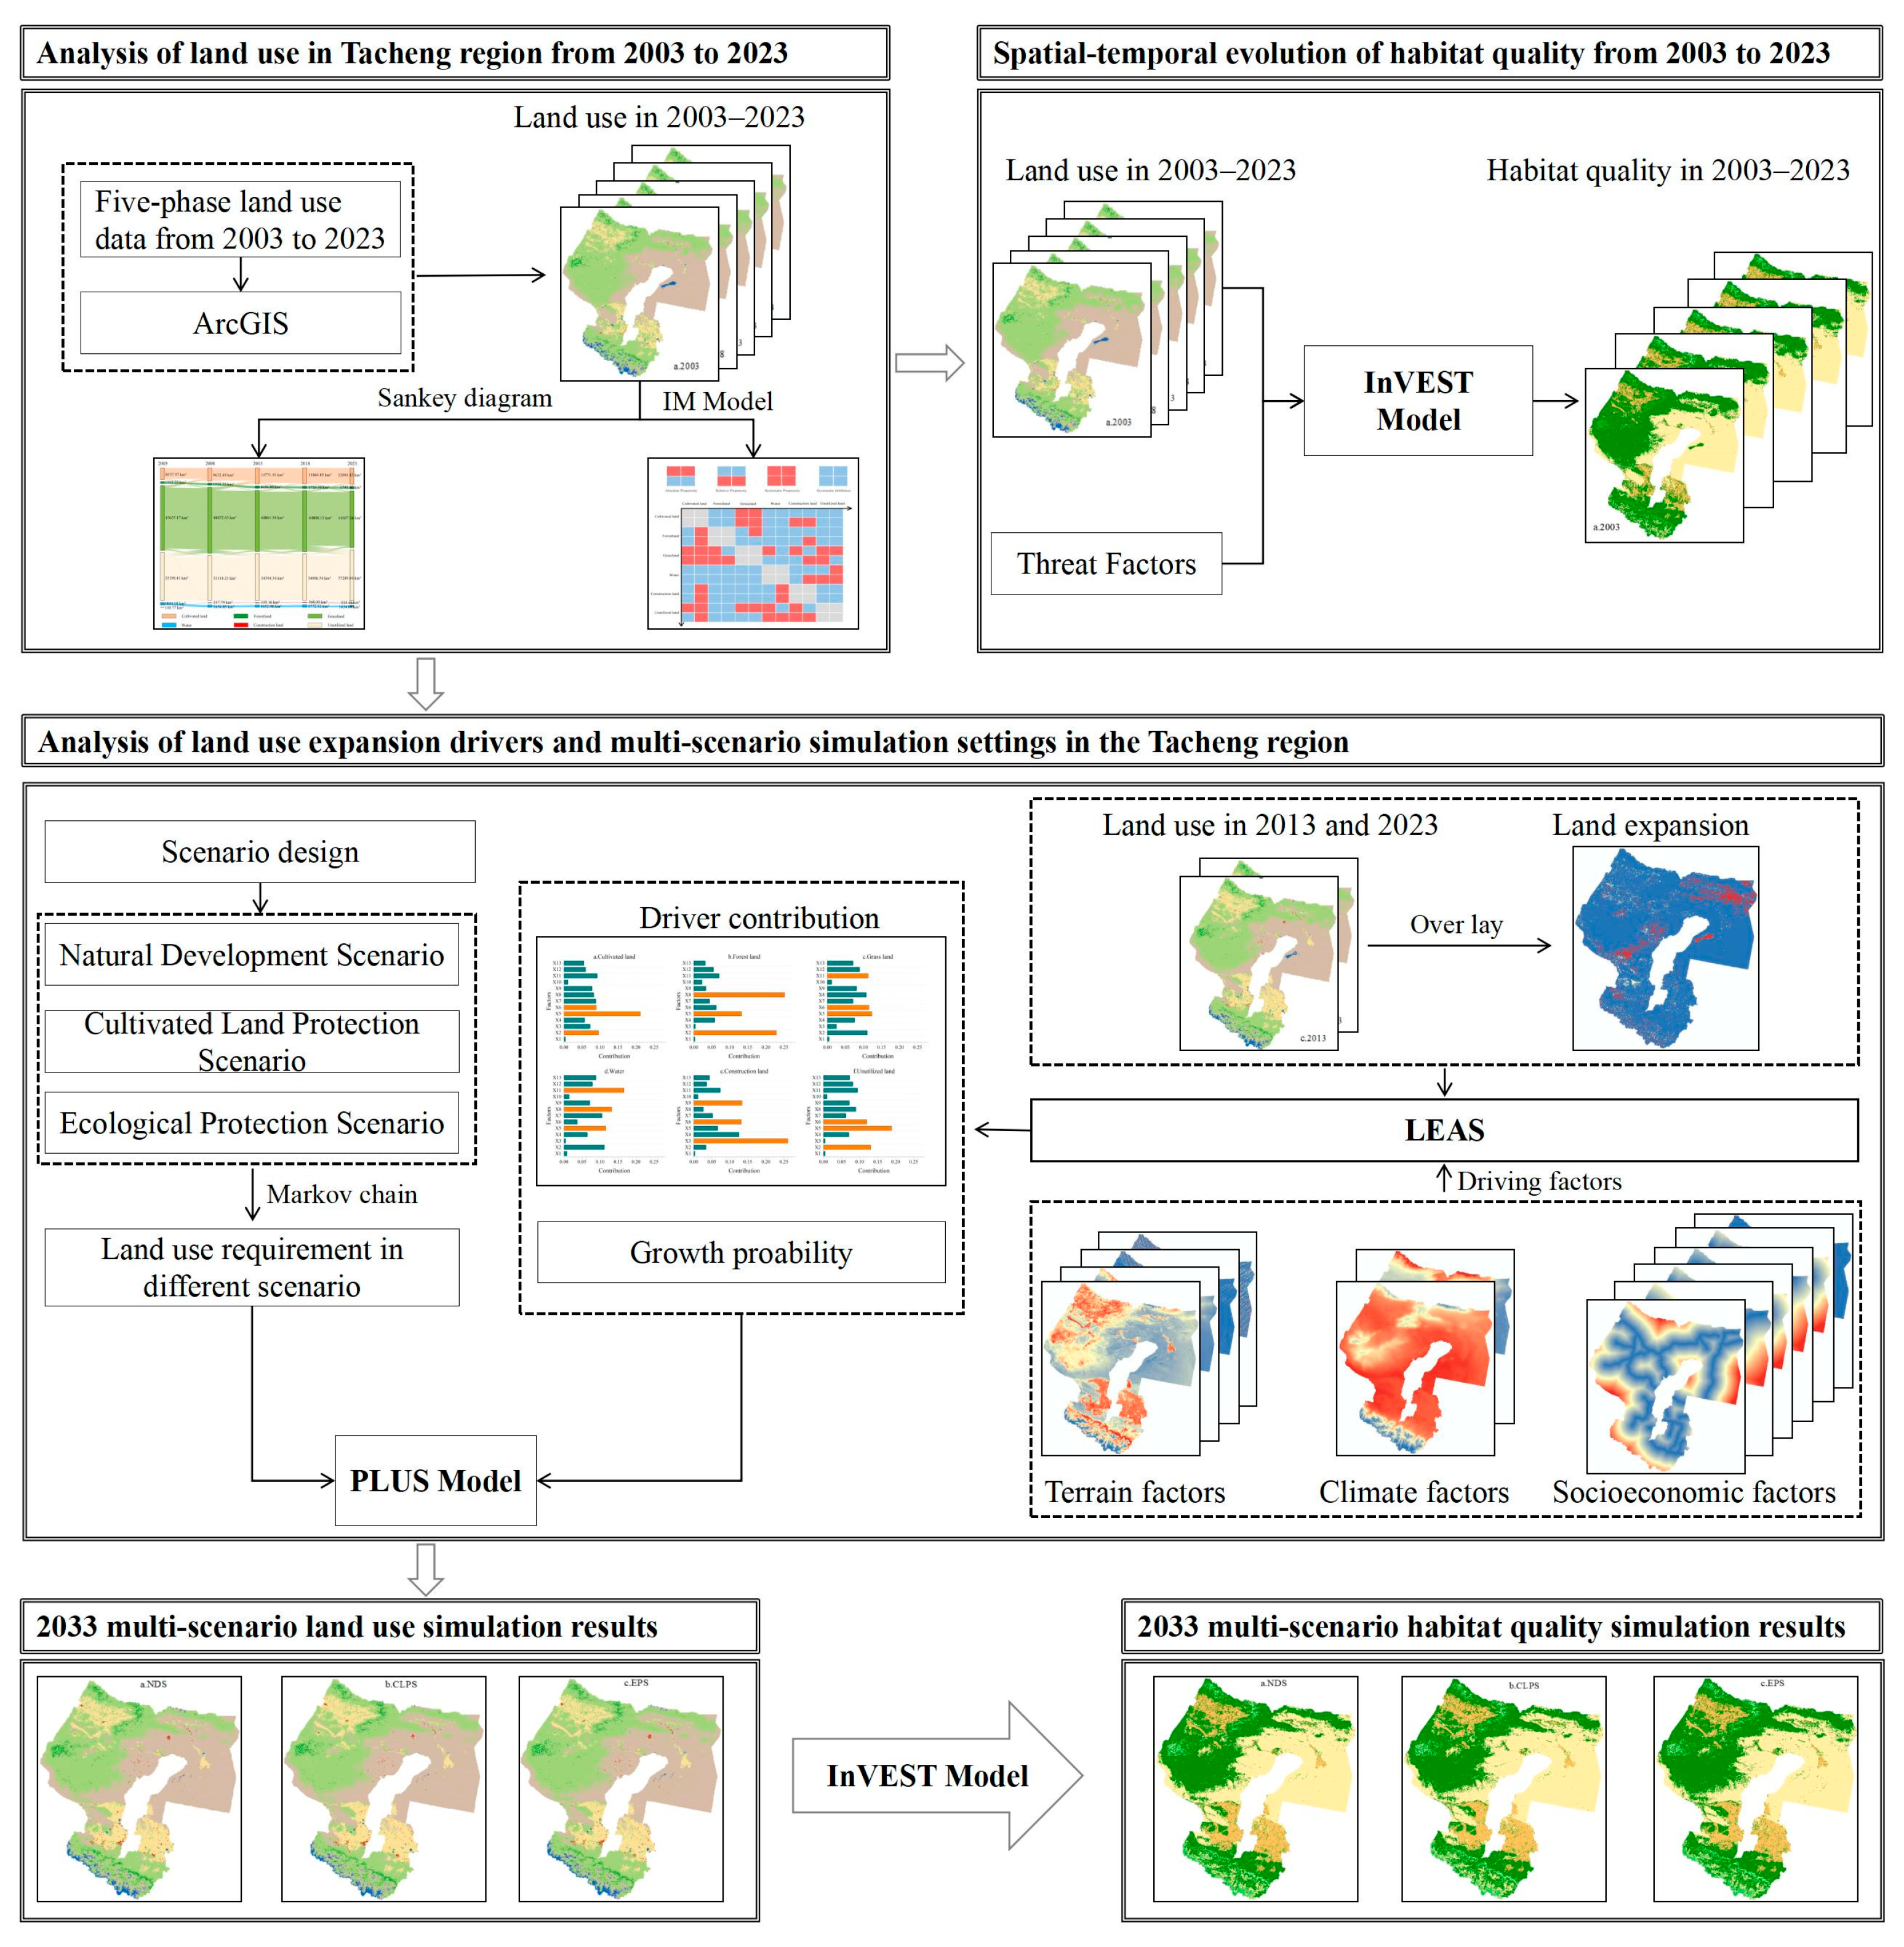
2.3. Method of Analysis
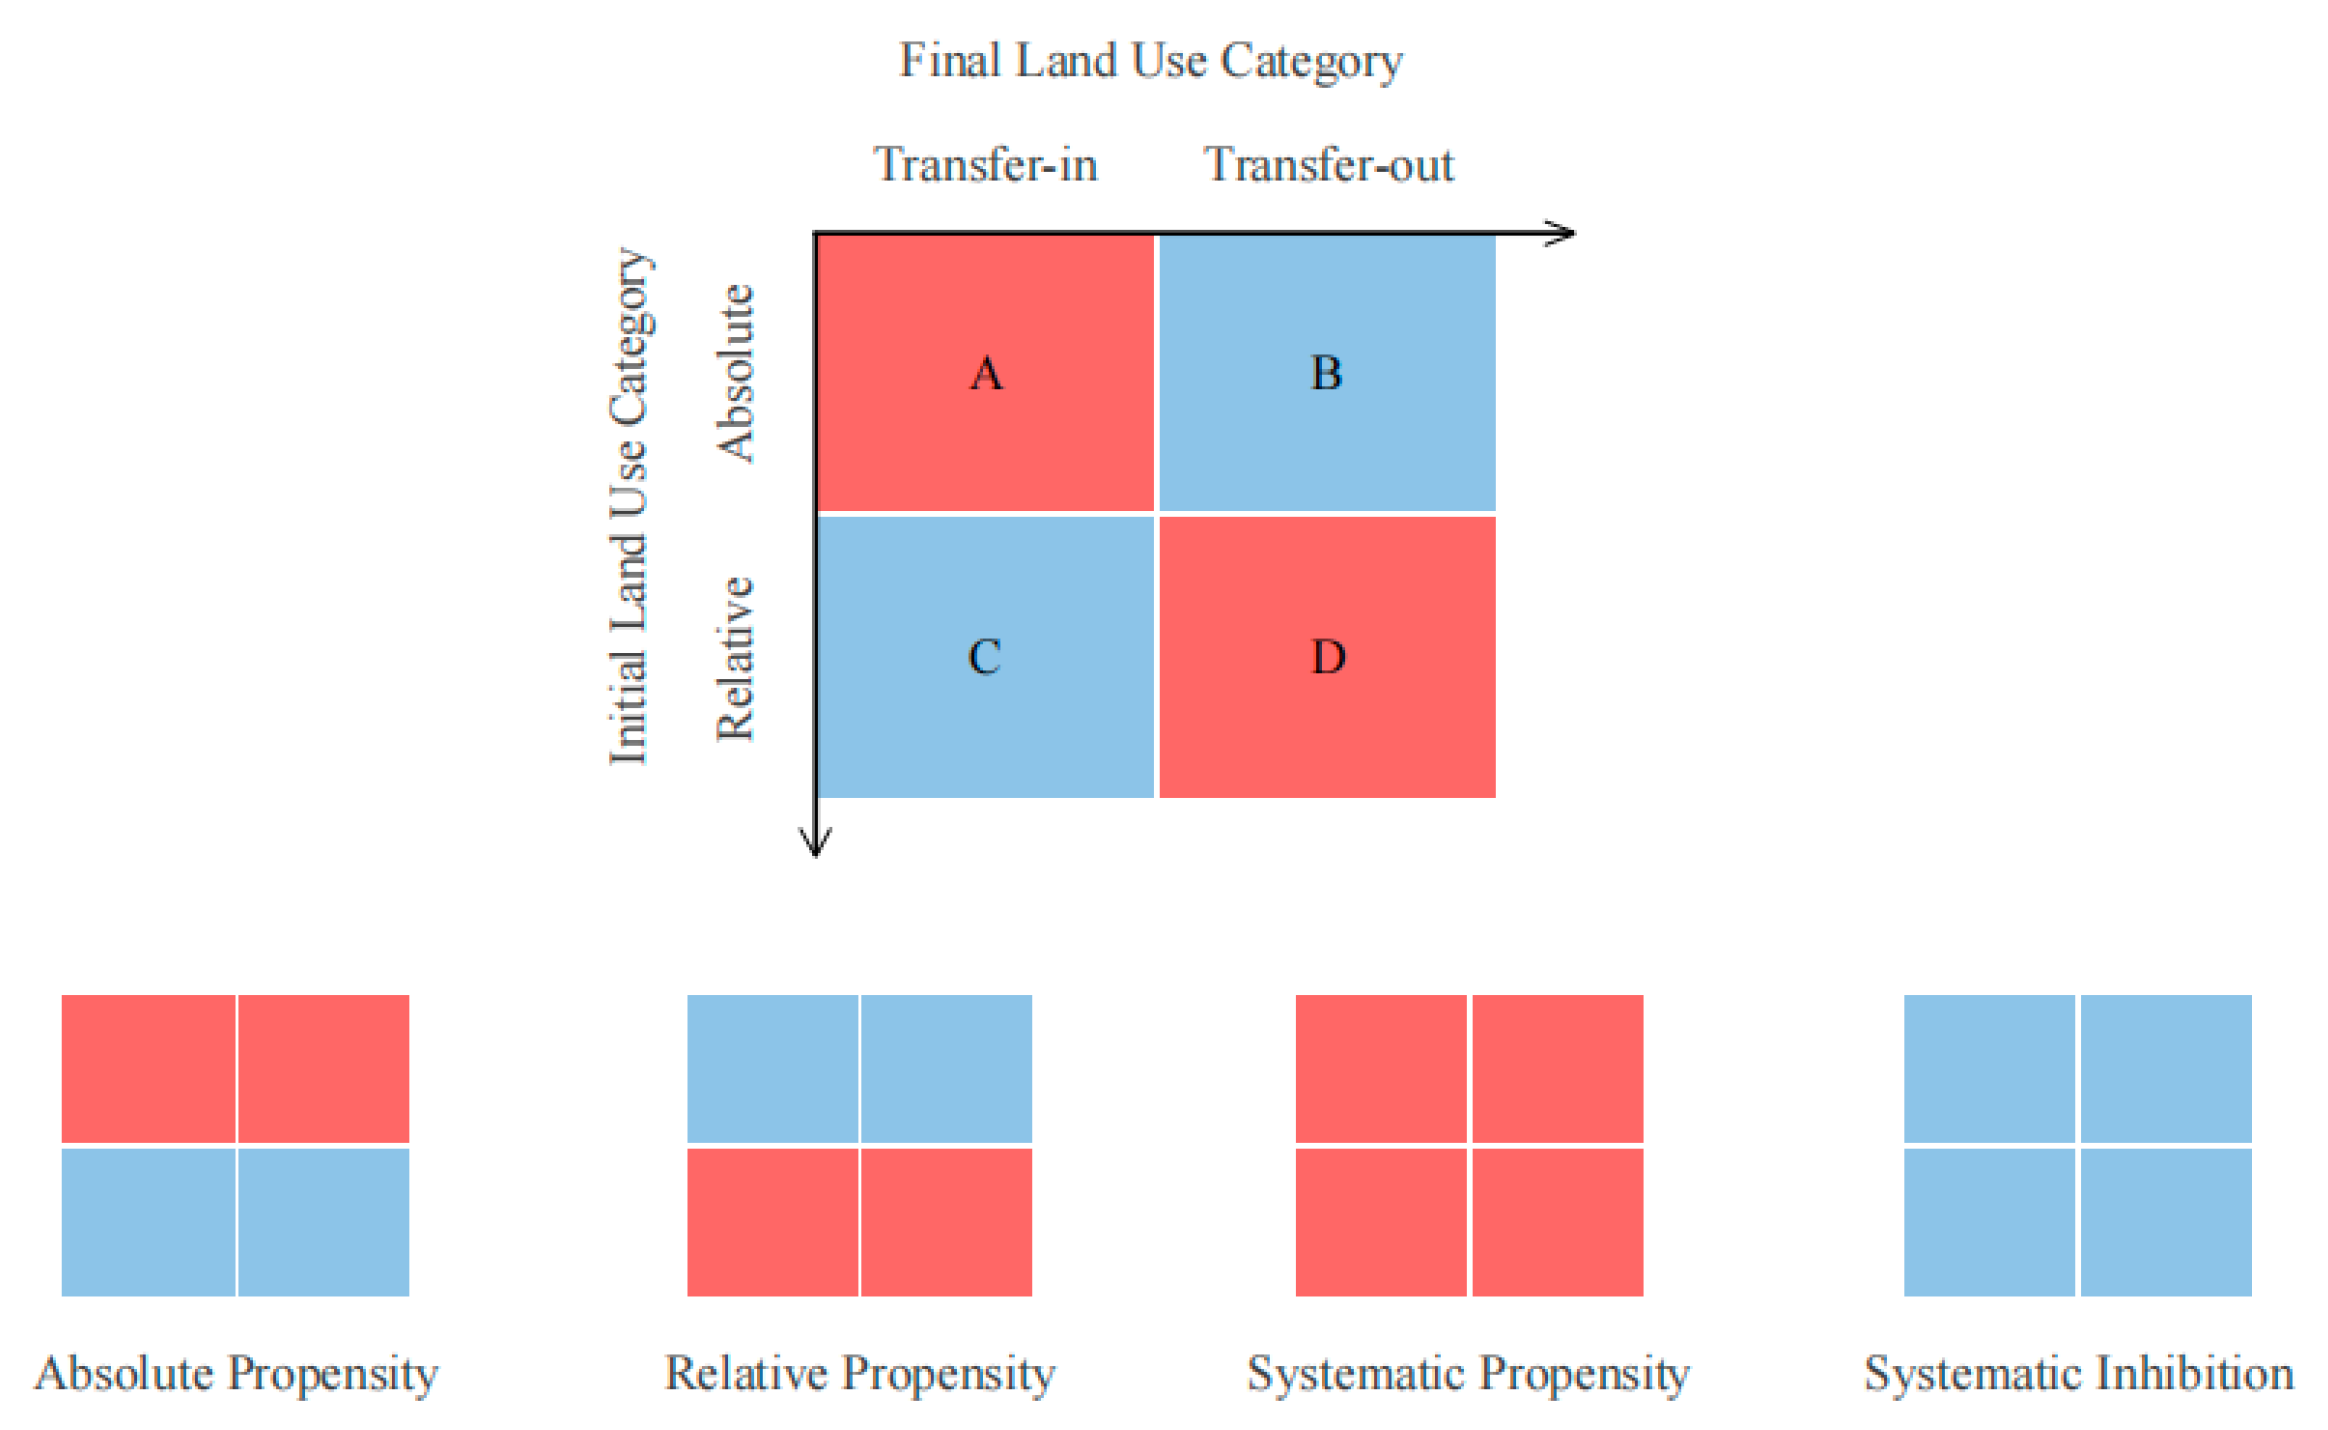
The research framework and flowchart are depicted in Figure 2. Initially, based on land use data from 2003 to 2023 in the Tacheng region, this study analyzes the evolution characteristics of land use in the Tacheng region and inputs natural and socioeconomic factor datasets into the LEAS module to analyze the contributions of various factors to land use expansion and relevant transition probabilities. Subsequently establishes three distinct development scenarios, utilizing the PLUS model to simulate and predict land use demand and spatial distribution under different scenarios in the Tacheng region for 2033. Finally, input the land use changes from 2003 to 2023 and the multi-scenario simulation results for 2033 into the InVEST model to assess habitat quality in the Tacheng region. This framework leverages the strengths of the PLUS-InVEST model coupling to reveal the cascading effects of “land use–habitat quality” interactions, providing reference pathways for ecological governance in arid regions.

2.3.1. IM Model

The Intensity Map (IM) model, proposed by Li Shuaicheng et al. [34], serves as a simulation approach grounded in a land use transition matrix. This research investigates land use dynamics and their implications for land system configuration through the dual analytical frameworks of absolute and relative intensity metrics, through visualization of land use intensity dynamics analysis outcomes (Figure 3).

2.3.2. InVEST Model

Habitat quality assessment is quantified through an integrated index that incorporates land use type-specific sensitivity parameters and the spatial intensity of external threat factors [35]. The habitat quality index is standardized within [0, 1], where higher values denote superior habitat conditions and greater biodiversity richness; conversely, lower values indicate ecological degradation.
Q x j = H j 1 D x j Z D x j Z + K Z
In the formula, Q x j denotes the habitat quality metric for grid cell x within habitat category j ; H j is the habitat suitability metric for habitat type j (0 ≤ H j ≤ 1); D x j quantifies the habitat degradation level for grid cell x within habitat type j ; k denotes the half-saturation threshold parameter, configured as 50% of the maximum habitat degradation index (commonly 0.5); and Z denotes the normalization constant, usually standardized at 2.5.
This study references InVEST-related research [36,37] and is grounded in the empirical context of the Tacheng region. To calculate D x j , this process also necessitates defining threat factors (Table 1) alongside habitat-specific sensitivity ratings to these environmental stressors (Table 2).

2.3.3. PLUS Model

The PLUS establishes an analytical architecture for land expansion drivers and an adaptive cellular automata evolution mechanism [38]. Relative to alternative land use models, the PLUS model exhibits a superior spatial fitting degree and landscape morphology restoration accuracy in microscopic unit simulation [39], offering a novel analytical tool for refined land change research.
The LEAS constructs a spatiotemporal prediction model based on historical land use change trajectories [40], employing an ensemble decision tree algorithm to simulate spatial transition probabilities of different land types. By utilizing parameter importance decomposition techniques to evaluate land expansion driving factors, it establishes an analytical framework for land use evolution with integrated spatiotemporal characteristics, expressed as follows:
P i , k ( X ) d = n = 1 M [ I ( h n ( X ) = d ) ] M
In the formula, h n ( X ) denotes the predicted land use type obtained when the decision tree is n ; M represents the number of decision trees; I ( ) serves as the binary indicator function for the decision tree classification model; d takes the value 0 or 1, where d = 1 indicates a transition from other types to type k , d = 0 denotes no transition to land class k ; P i , k ( X ) d denotes the probability of land use type k growth at spatial unit i under the condition that d takes the value 0 or 1.
The CA model incorporates multi-type stochastic patch-seeding mechanisms to simulate landscape patch dynamics, governed by land-use transition probabilities and integrating probabilistic seed initialization with spatially explicit threshold-dependent decay processes [41].
O P i , k d = 1 , t = P i , k d × Ω i , k t × D k t
where O P i , k d = 1 , t denotes the comprehensive transition probability of spatial unit i to land use class k at time t ; P i , k d represents the suitability probability of land use type k development for spatial unit i ; D k t indicates the future demand influence on land class k ; Ω i , k t signifies the neighborhood effect of unit i , defined as the proportional coverage of land use class k within adjacent spatial units. The neighborhood weight of land use types exerts differential influences depending on land use type variations.
The neighborhood weight is constrained within the closed interval [0, 1]. When the weight coefficient approaches 1, it indicates stronger stability of the land type with a lower transition probability, whereas a weight coefficient approaching 0 signifies higher transition flexibility. The neighborhood weight parameters are listed in Table 3.

2.3.4. Accuracy Validation

The Kappa statistic was applied to quantify model validation outcomes, with coefficient values constrained within the closed interval [0, 1]. A Kappa value less than 0.75 denotes poorer simulation accuracy with lower reliability and credibility, whereas a Kappa value exceeding 0.75 signifies superior simulation performance [42]. Leveraging land-use datasets from 2013 to 2018 across the Tacheng region, this research projected 2023 land-use patterns through the Markov transition mode embedded within the PLUS model framework. Validation of simulated land use patterns against observed 2023 data yielded a Kappa statistic of 0.86 and an overall accuracy rate of 0.91, indicating strong spatial correspondence between modeled and empirical land use patterns and confirming the methodological robustness of the simulation framework.

2.3.5. Scenario Settings

This research established three scenarios [43,44]—natural development scenario (NDS); cultivated land protection scenario (CLPS); and ecological protection scenario (EPS)—based on previous studies [45] and current land use conditions to investigate multi-scenario land use changes. These scenarios were applied to simulate land use change dynamics in the Tacheng region through 2033 and develop a scenario-specific transition cost matrix (Table 4).
Natural development scenario (NDS). Using the 2003–2023 land use transition matrix as the baseline, this scenario extends the land use change trends observed in the Tacheng region during 2003–2023. It maintains original transition probabilities and neighborhood weights without considering additional constraints or policy interventions, reflecting spontaneous evolution under non-intervention conditions. The core assumption is that existing socioeconomic drivers—such as GDP growth and population density—and natural factors; including NDVI and precipitation; will continue to follow historical patterns; driving the ongoing conversion of grassland to unutilized land and cultivated land. The core assumption is that existing socioeconomic drivers—such as GDP growth and population density—and natural factors; including NDVI and precipitation; will continue to follow historical patterns; driving the ongoing conversion of grassland to unutilized land and cultivated land. The natural development scenario serves as a control baseline to assess exacerbation trends of ecological risks—including habitat quality degradation and desertification expansion—under non-regulation conditions; highlighting the necessity of policy interventions.
Cultivated land protection scenario (CLPS). The Tacheng region is a vital agricultural zone in Xinjiang. To implement the High-Standard Farmland Construction Plan for Tacheng Region (2021–2030) [46], strict execution of the “storing grain in land and technology” strategy is required. Accelerate the promotion of high-standard cultivated land construction, enhance cultivated land quality and utilization efficiency, ensure food security and sustainable agricultural development, strengthen support for grain production, strictly control the conversion of prime cultivated land to other land types, effectively implement the balance of cultivated land occupation and compensation, firmly safeguard the red line for cultivated land protection, and maintain the total area of prime cultivated land. Building upon the linear development scenario and referencing relevant research, this study modifies the land transition probability matrix by reducing the transition probability from cultivated land to construction land by 60%, increasing the transition probability from unutilized land to cultivated land by 60%, and increasing the transition probability from grassland and forestland to cultivated land by 30% while strictly implementing cultivated land protection policies. The parameter adjustments for the cultivated land protection scenario referenced typical PLUS model applications in arid regions, with the magnitude of transition probability modifications for each land use type based on historical land conversion rate sensitivity analysis.
Ecological protection scenario (EPS). The Tacheng region is situated in the arid-semiarid transition zone and possesses a critical ecological barrier function. To strengthen the principles proposed in the Territorial Spatial Master Plan of Tacheng Region (2021–2035) [47] and the Ecological Conservation Red Line Management Measures of Xinjiang Uygur Autonomous Region [48]—which emphasize territorial spatial planning as the basis; forest-grass resources as the foundation; and national key ecological projects as the cornerstone—this scenario enhances protection of vital ecological functional zones; including the Tarbagatai Mountains ecological barrier in the north and the Kurustay grassland wetland in the south; implements ecological restoration projects; and elevates ecological service functions. This scenario scientifically implements territorial greening, strictly safeguards the ecological conservation red line, optimizes spatial arrangements for afforestation and grass planting, and enhances the quality of afforestation and grass planting. Based on the current land use status in the Tacheng region and relevant policies [49], this study designates portions of forestland, grassland, and water as restricted conversion zones. It modifies the land transition probability matrix by reducing transition probabilities from grassland, forestland, and water to construction land by 40%; reducing transition probability from cultivated land to construction land by 30%; and increasing transition probability from unutilized land to forestland, grassland, and water by 60% while enhancing protection of ecological nodes and improving ecosystem quality and stability.

3. Results and Analysis

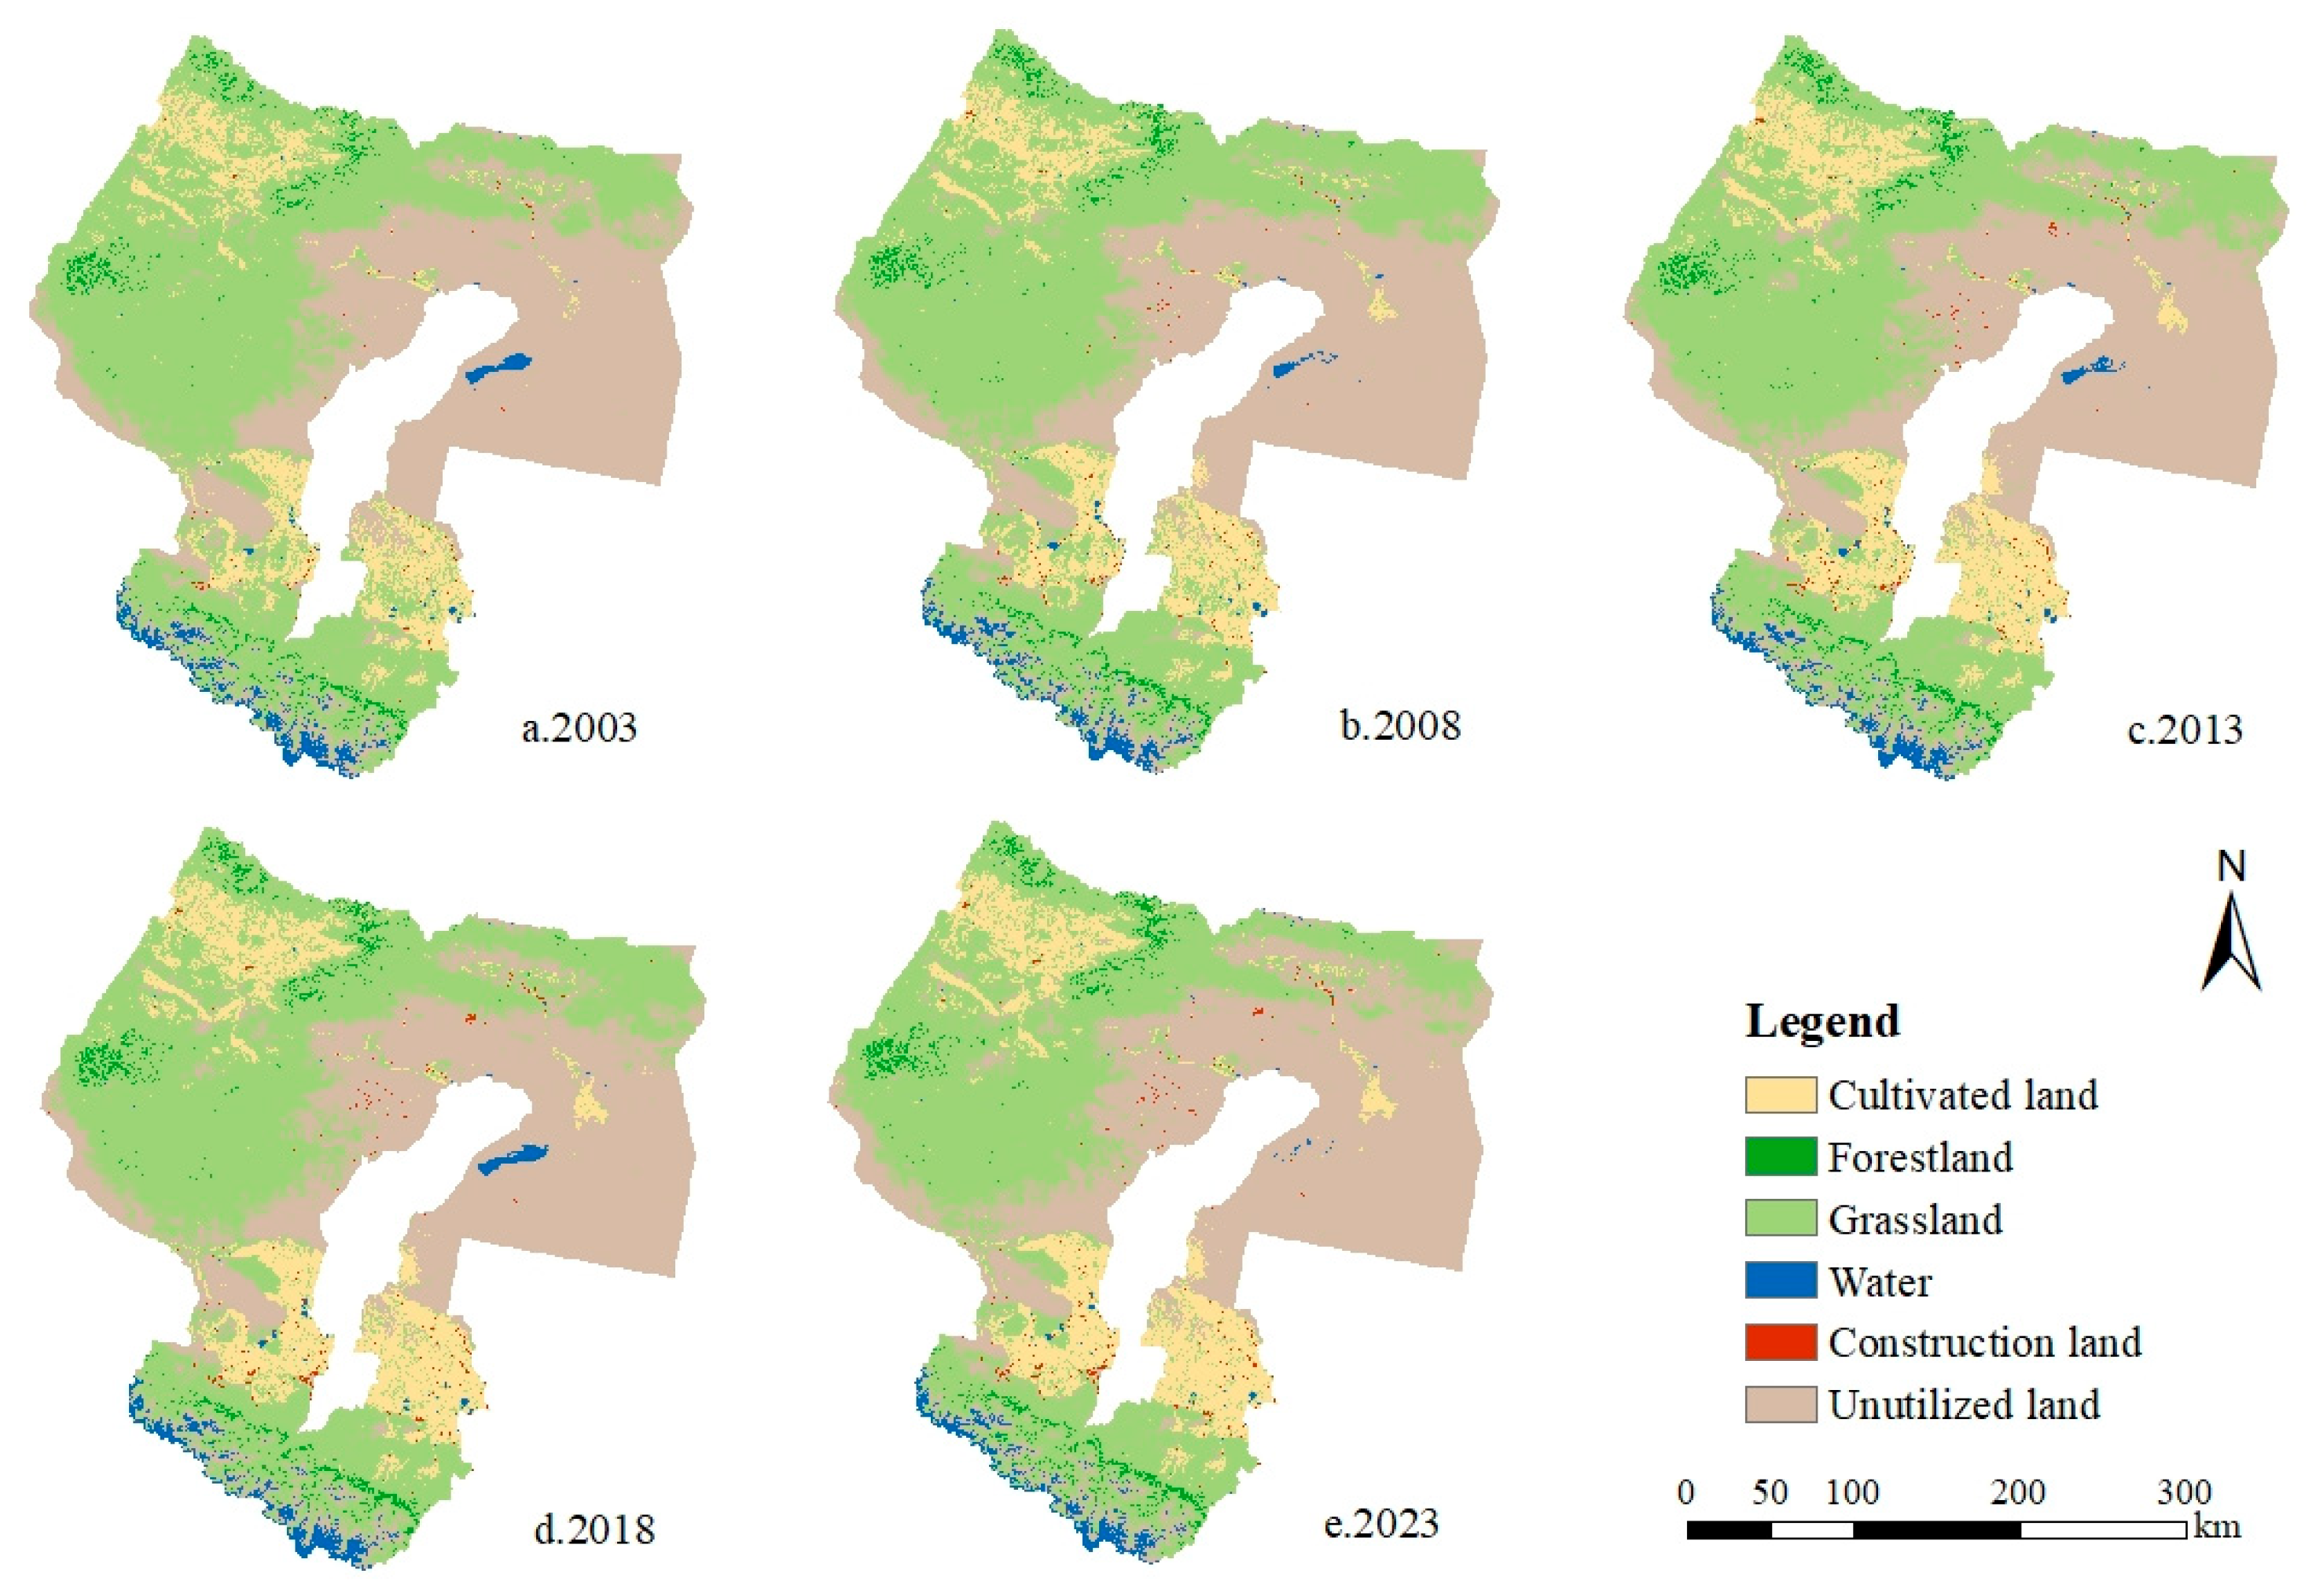
3.1. Spatiotemporal Pattern Analysis of Land Use Change

3.1.1. Land Use Change

Multi-temporal satellite imagery of the Tacheng region was analyzed using ArcGIS 10.8 to obtain land use for the years 2003, 2008, 2013, 2018, and 2023 (Figure 4). Quantitative assessments of land use category areas across temporal intervals are consolidated within the spatiotemporal distribution of land use dynamics (Table 5 and Figure 5). Grassland serves as the predominant land category in the Tacheng region. Forestland, unutilized land, construction land, and cultivated land areas showed continuous increases from 2003 to 2023, whereas water and grassland exhibited persistent reduction trends. Intense mutual conversions occurred among cultivated land, grassland, and unutilized land (Figure 6).
As detailed in Table 5, grassland constitutes the predominant land use type, accounting for approximately 45%, followed by unutilized land, water, construction land, and forestland, with cultivated land being the smallest. From 2003 to 2008, grassland, cultivated land, construction land, cultivated land, and forestland areas showed an increasing trend. Cultivated land exhibited the most pronounced transformation, which expanded by approximately 1104.92 km2, followed by grassland, forestland, and construction land, which exhibited an expansion of 835.46 km2, 188.13 km2, and 137.02 km2. Both unutilized land and water exhibited downward trends, with unutilized land experiencing the most significant decrease, declining by 2076.2 km2. From 2008 to 2013, grassland area decreased dramatically by 3611.1 km2. The decline rate of water area slowed compared to the 2003–2008 period, while unutilized land showed an upward trend, increasing by approximately 1280.13 km2. All other land categories exhibited expansion trends, with cultivated land demonstrating the most substantial increase of about 2139.02 km2. From 2013 to 2018, the decline rate of grassland area significantly slowed, and unutilized land exhibited a declining tendency, contracting by 53.42 km2 and 297.8 km2, respectively. All other land categories exhibited moderate increases in area. From 2018 to 2023, grassland and unutilized land underwent the most substantial changes. Grassland area plummeted once again, decreasing by 3200.45 km2, while water area also showed a marked decline of 338.44 km2. Concurrently, the expansion rate of unutilized land accelerated, with its area increasing by 3192.5 km2. Cultivated land, forestland, and construction land all experienced modest growth trends. Comprehensively, grassland in the Tacheng region exhibited the most substantial decline from 2003 to 2023, with its area decreasing by 6029.51 km2, followed by water area reduction of 410.1 km2. Cultivated land, forestland, and construction land demonstrated steady growth during this period, with cultivated land showing a pronounced increase of 3564.26 km2 over the two decades, while forestland and construction land expanded by 473.08 km2 and 303.64 km2, respectively. Unutilized land exhibited marked fluctuations, characterized by intense mutual conversions with grassland, ultimately increasing by 2098.63 km2 during 2003–2023, a trend significantly influenced by grassland dynamics.
As illustrated in the Sankey diagram (Figure 5) and land use transition matrix (Table 6), spatiotemporal analyses of land use dynamics in the Tacheng region from 2003 to 2023 reveal grassland demonstrated the highest transfer-out volume during this period, reaching 8641.38 km2. The transfer-out of grassland primarily involved cultivated land and unutilized land, with transfers of 3491.45 km2 and 4501.1 km2 to these categories, respectively. The next highest transfer-out volumes were observed in unutilized land, cultivated land, and water, with 2916.14 km2, 857.52 km2, and 616.41 km2 transferred out, respectively. Grassland constituted significant proportions of the transfers from unutilized land and cultivated land, with 1729.62 km2 and 792.06 km2 transferred to grassland from these categories, respectively. Unutilized land received the highest transfer-in area during 2003–2023, primarily sourced from grassland and water, with transfer-in areas of 4501.1 km2 and 499.39 km2. Cultivated land exhibited the next highest transfer-in volume, with an area of 4421.78 km2, primarily sourced from grassland. Construction land and forestland were dominated by transfer-in over the two decades, with transfers of 304.04 km2 and 478.52 km2, respectively. Comprehensively, driven by economic development and eco-environmental changes, land use transitions in the Tacheng region during 2003–2023 predominantly involved mutual conversions among grassland, unutilized land, and cultivated land, with grassland experiencing the most substantial reduction.

3.1.2. Land Use Intensity

The land utilization transfer matrix data of the Tacheng region from 2003 to 2023 were imported into the Intensity Map model. By inputting land categories, the land use change intensity map for 2003–2023 was generated. As evidenced by Figure 7, during 2003–2023, there were distinct absolute propensity transition characteristics, particularly in the conversions from grassland to unutilized land, unutilized land to grassland, and unutilized land to cultivated land. Conversely, a series of transitions, including forestland to cultivated land, grassland to forestland and construction land, and water to unutilized land, exhibited relative propensity characteristics. Additionally, conversions from cultivated land to grassland and subsequent reconversions from grassland to cultivated land demonstrated systematic propensity characteristics. Alternatively, transitions, particularly from cultivated land to water and unutilized land, exhibited systematic inhibition characteristics.
Comprehensively, the Land Use Intensity Map reveals common patterns in land use types within the Tacheng region while also aligning with land change dynamics observed in relevant studies. As derived from Table 6, grassland, cultivated land, and unutilized land exhibited substantial transfer-in areas during 2003–2023 in the Tacheng region, consistent with the propensity characteristics in the Intensity Map. This further confirms pronounced propensity characteristics in land use intensity changes for these three land categories. The transfer-in of water, construction land, and forestland predominantly exhibited inhibition characteristics in the Land Use Intensity Map, aligning with the pattern of lower transfer-in areas demonstrated in Table 6.

3.1.3. Land Use Expansion Driving Analysis

As demonstrated in Figure 8, NDVI as a primary factor influenced alterations in cultivated land, grassland, and unutilized land, with these categories showing strong correlations with vegetation coverage. Forestland, grassland, and water exhibited greater susceptibility to natural factors, including precipitation, elevation, and temperature, within their original ecological contexts. The extension of construction land was predominantly influenced by GDP, population density, and distance to primary/secondary roads, exhibiting gradual outward expansion from existing built-up areas, with its dynamics being predominantly influenced by socioeconomic factors. Aspect and slope factors accounted for minor proportions in all land category changes, indicating that slope and aspect exerted limited effects on land use expansion.

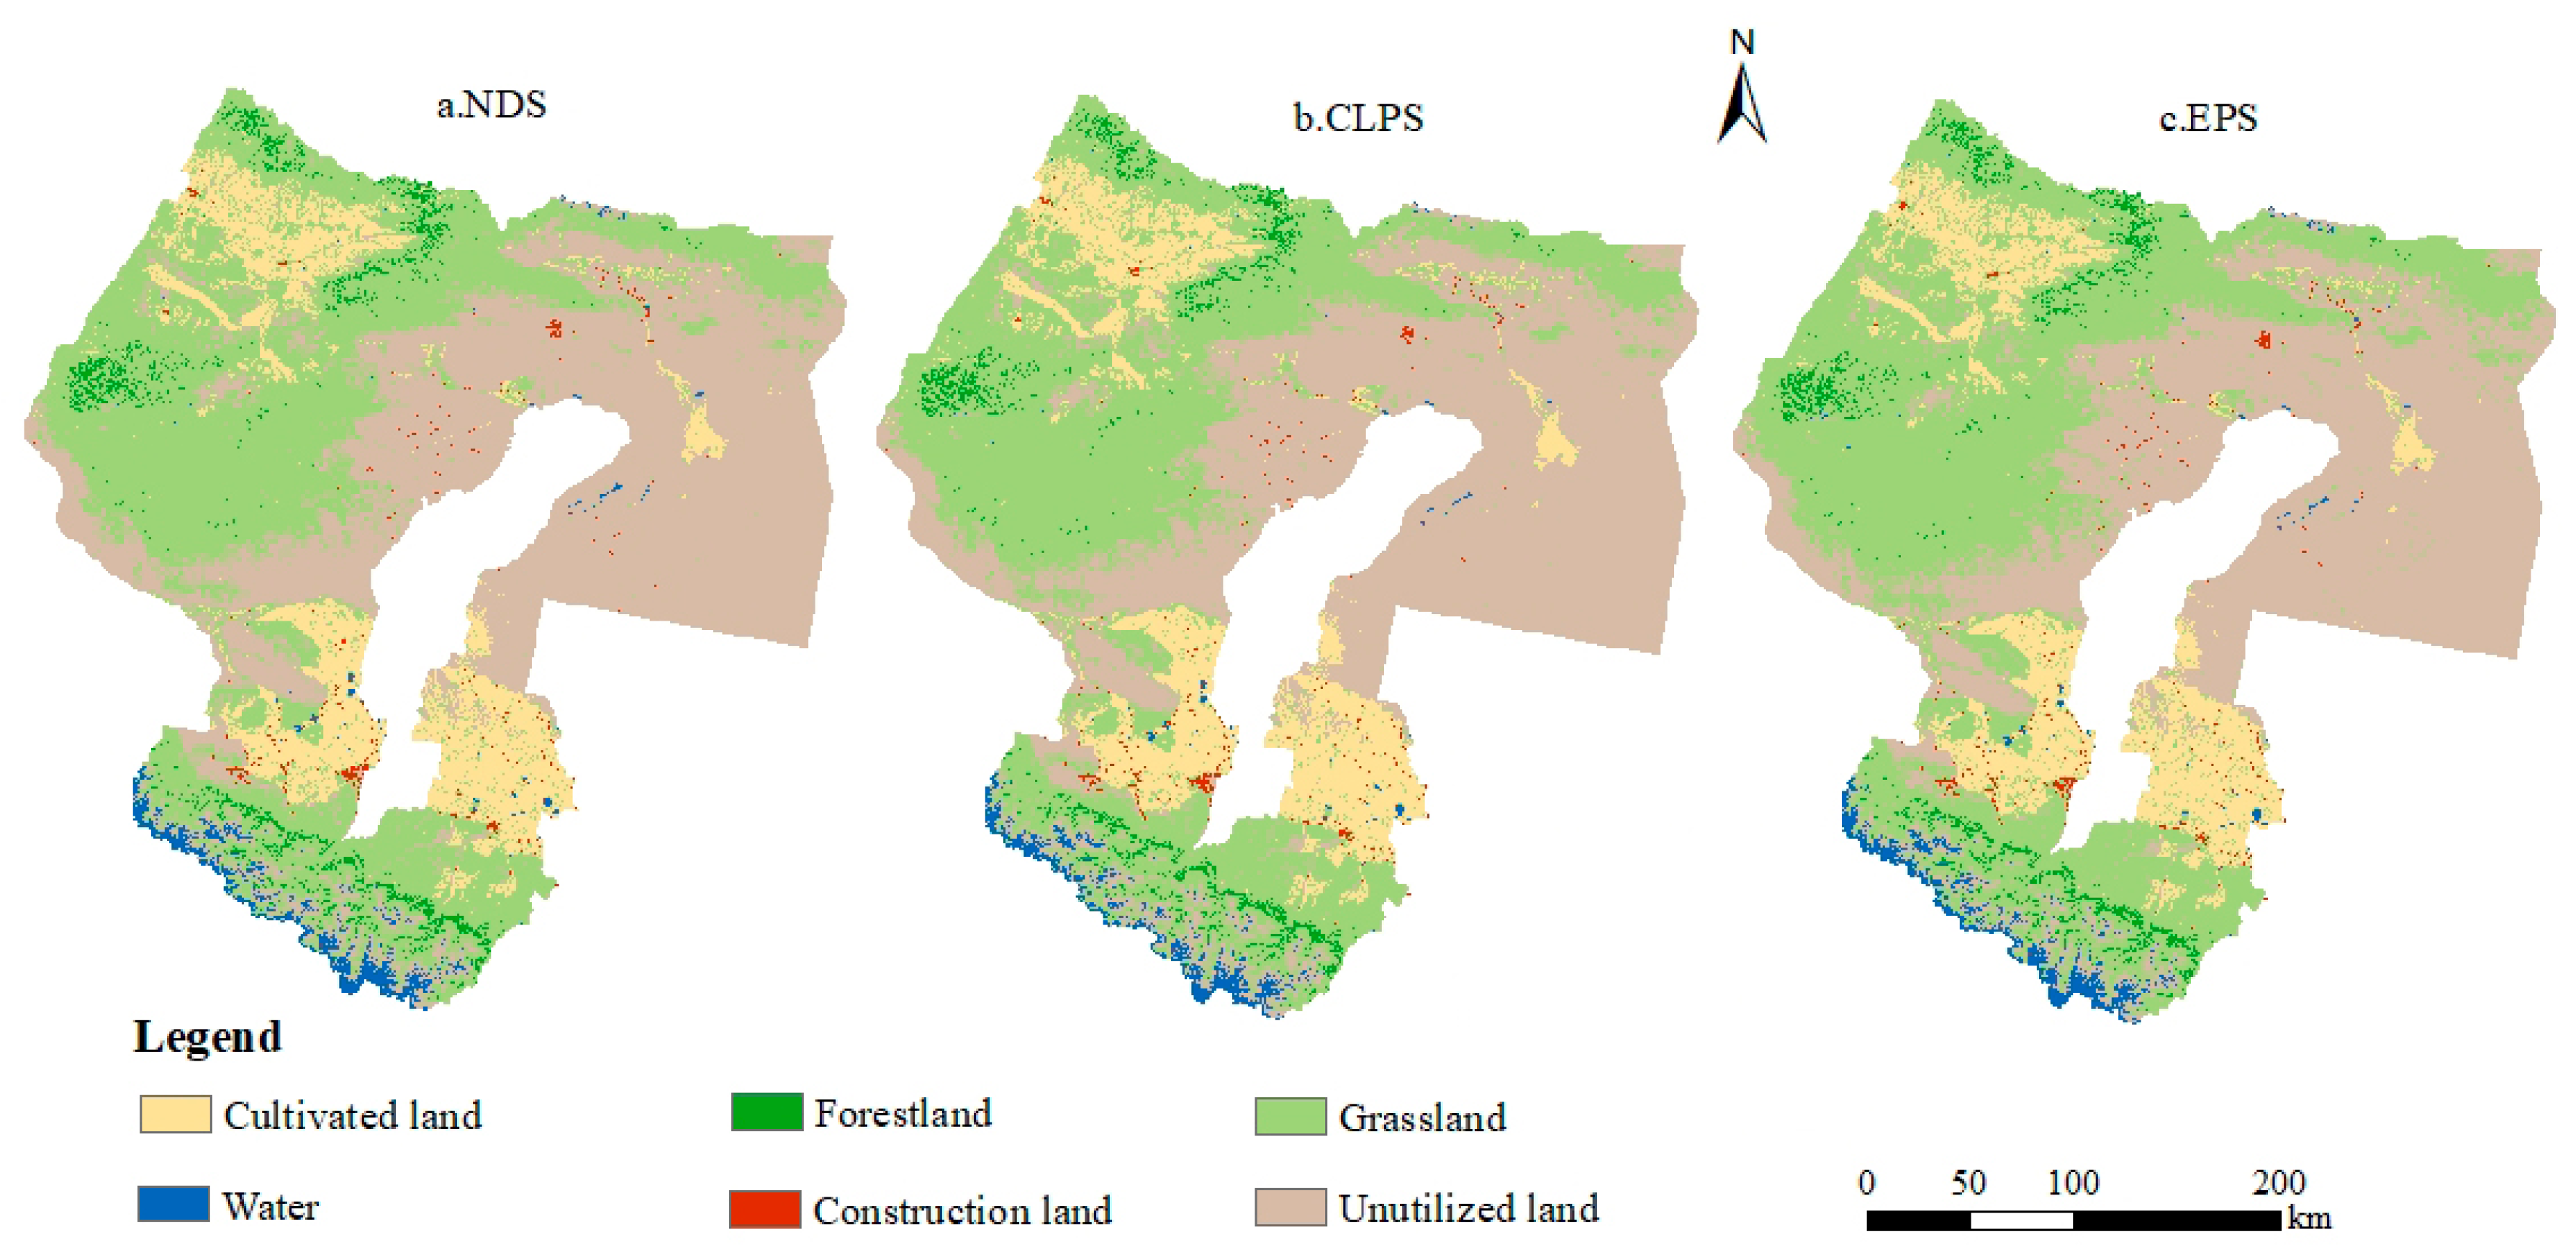
3.2. Multi-Scenario Land Use Simulation and Prediction

Drawing on spatiotemporal land use data for the Tacheng region from 2003 to 2023, three scenarios—NDS; CLPS; and EPS—were established according to current land use status and policy documents [50]. The PLUS model was employed with neighborhood weights and transition cost matrices configured following relevant studies [51,52]; projected land use patterns across multiple scenarios were simulated for the Tacheng region by 2033 (Figure 9).
As projected by multi-scenario land use simulations for the Tacheng region targeting 2033 (Figure 9 and Table 7), the NDS reveals marked expansion of forestland, cultivated land, and unutilized land, alongside substantial declines in water and grassland areas. Specifically, cultivated land, unutilized land, and forestland increased by 224.41 km2, 145.97 km2, and 2384.6 km2 compared to 2023 levels, representing increments of 1.86%, 8.13%, and 6.39%, respectively. Water and grassland declined by 138.37 km2 and 2694.99 km2, experiencing declines of 9.65% and 6.48%, with grassland demonstrating significant transfer-out to other land categories. Construction land area reached 492.79 km2, increasing by 78.38 km2 compared to 2023 levels, representing an increase of 18.91%. Under the CLPS, cultivated land and unutilized land exhibited marked expansion, while grassland and water areas experienced further reductions compared to the NDS. Construction land and forestland also showed moderate increases. Unutilized land and cultivated land areas grew by 622.09 km2 and 2278.27 km2 compared to 2023 levels, representing growth rates of 5.14% and 6.11%, respectively. Water and grassland areas declined by 2972.33 km2 and 138.9 km2, with declines of 7.14% and 9.69%. Under the EPS, the eco-environment showed marked improvement, with grassland, water, and forestland areas increasing by 793.37 km2, 93.01 km2, and 143.45 km2, respectively. Compared to NDS and CLPS, grassland and water exhibited more pronounced increases in area. Unutilized land and cultivated land areas declined by 210.07 km2 and 877.58 km2, with the expansion of these categories being effectively curbed. Construction land expansion was constrained by ecological protection measures, showing a smaller increase compared to the NDS and CLPS.
Comprehensively, the most pronounced and intense mutual conversions occurred between grassland and unutilized land in the Tacheng region, highlighting the vulnerability of its eco-environment. Future development necessitates balancing these two land categories while prioritizing grassland and forestland conservation. Concurrently, measures must be implemented to prevent further desertification and sandy desertification expansion of unutilized land. The reciprocal transitions between grassland and unutilized land constitute a long-term trajectory in land use changes across the Tacheng region.

3.3. Habitat Quality Change Analysis

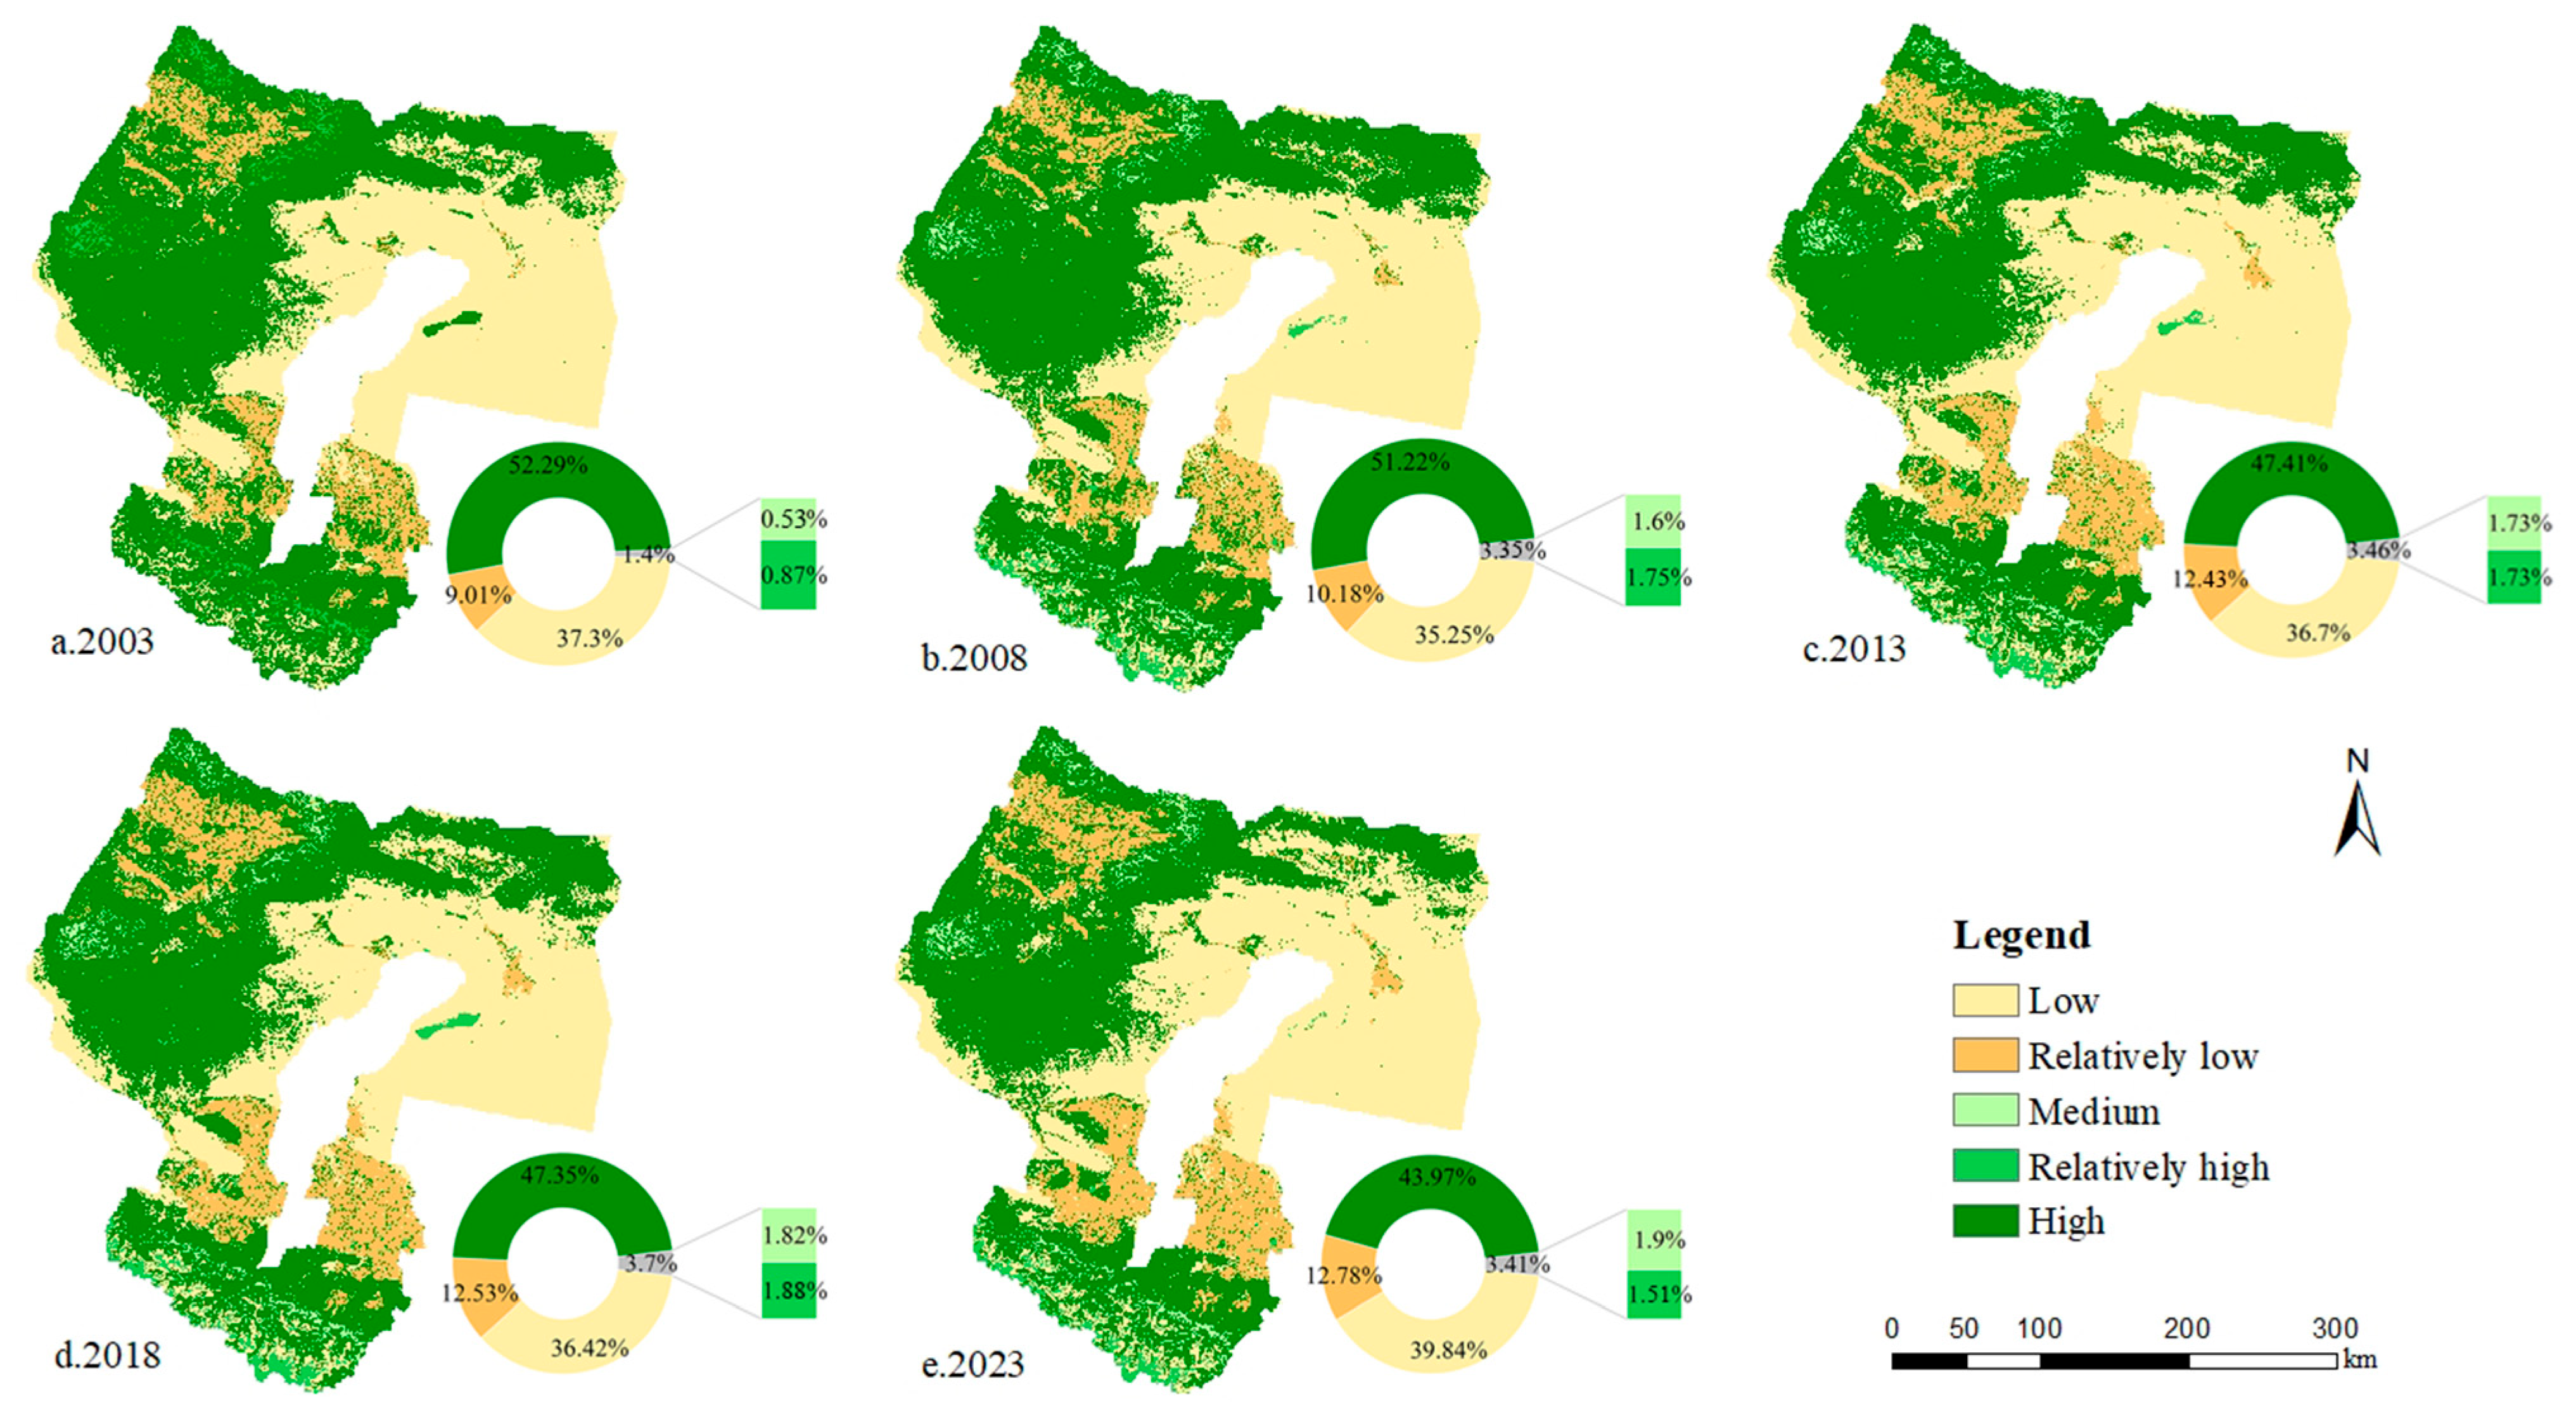
3.3.1. Spatiotemporal Evolution of Habitat Quality

Habitat quality is evaluated on a scale spanning 0 to 1, with increasing values corresponding to higher habitat quality. In ArcGIS software, habitat quality was classified into five hierarchical classes through the natural breaks classification: Low (0–0.3), Relatively Low (0.3–0.5), Medium (0.5–0.7), Relatively High (0.7–0.9), and High (0.9–1). The area proportions and change trends of each habitat quality grade were calculated (Figure 10 and Table 8).
From a temporal perspective (Table 8), during 2003–2023, areas of low habitat quality in the Tacheng region continued to expand, with their proportion increasing from 37.30% in 2003 to 39.84% in 2023; areas of high habitat quality manifested a declining trend, decreasing from 52.29% in 2003 to 43.97% in 2023. Over the two decades, substantial transfer-out of high habitat quality areas occurred in the Tacheng region, while relatively high, medium, relatively low, and low habitat quality areas exhibited annual increases. Overall habitat quality in the Tacheng region deteriorated.
Spatial pattern analysis (Figure 10) reveals that habitat quality distribution in the Tacheng region exhibits a higher pattern in the west and lower in the east and higher in the north and medium-to-low in central areas. The landscape is predominantly characterized by high and low habitat quality zones, with minimal areas classified as relatively high, medium, or relatively low habitat quality. High- and relatively high-habitat quality zones are predominantly located in the northwestern and southern parts of the region. These areas are primarily characterized by forestland, grassland, and water, with a significant presence of nature reserves, playing a vital role in enhancing and conserving habitat quality in the Tacheng region. Certain areas are predominantly characterized by cultivated land and construction land, where human disturbances have contributed to declined habitat quality. These zones are primarily composed of medium and relatively low habitat quality regions. Low habitat quality areas are primarily distributed in the eastern, southern, and central parts of the Tacheng region. These regions are primarily characterized by deserts, mountains, and medium-low hillocks. The undulating terrain and sparse vegetation cover in this region have resulted in diminished soil and water conservation capacity. Under the combined effects of topography and surface vegetation, severe water and soil loss occurs, weakening the ecological regulation capacity of the “mountain-oasis-desert” system and further exacerbating habitat quality degradation.
In summary, during 2003–2023, agricultural and pastoral development and construction land expansion in the Tacheng region encroached extensively on grassland and water. Concurrently, frequent extreme climatic events disrupted vegetation growth environments, causing pasture degradation, water source reduction, and intensified soil desertification and sandy desertification. Substantial areas of high habitat quality progressively transitioned to medium or relatively low levels, resulting in an overall degrading trend of habitat quality in the Tacheng region.

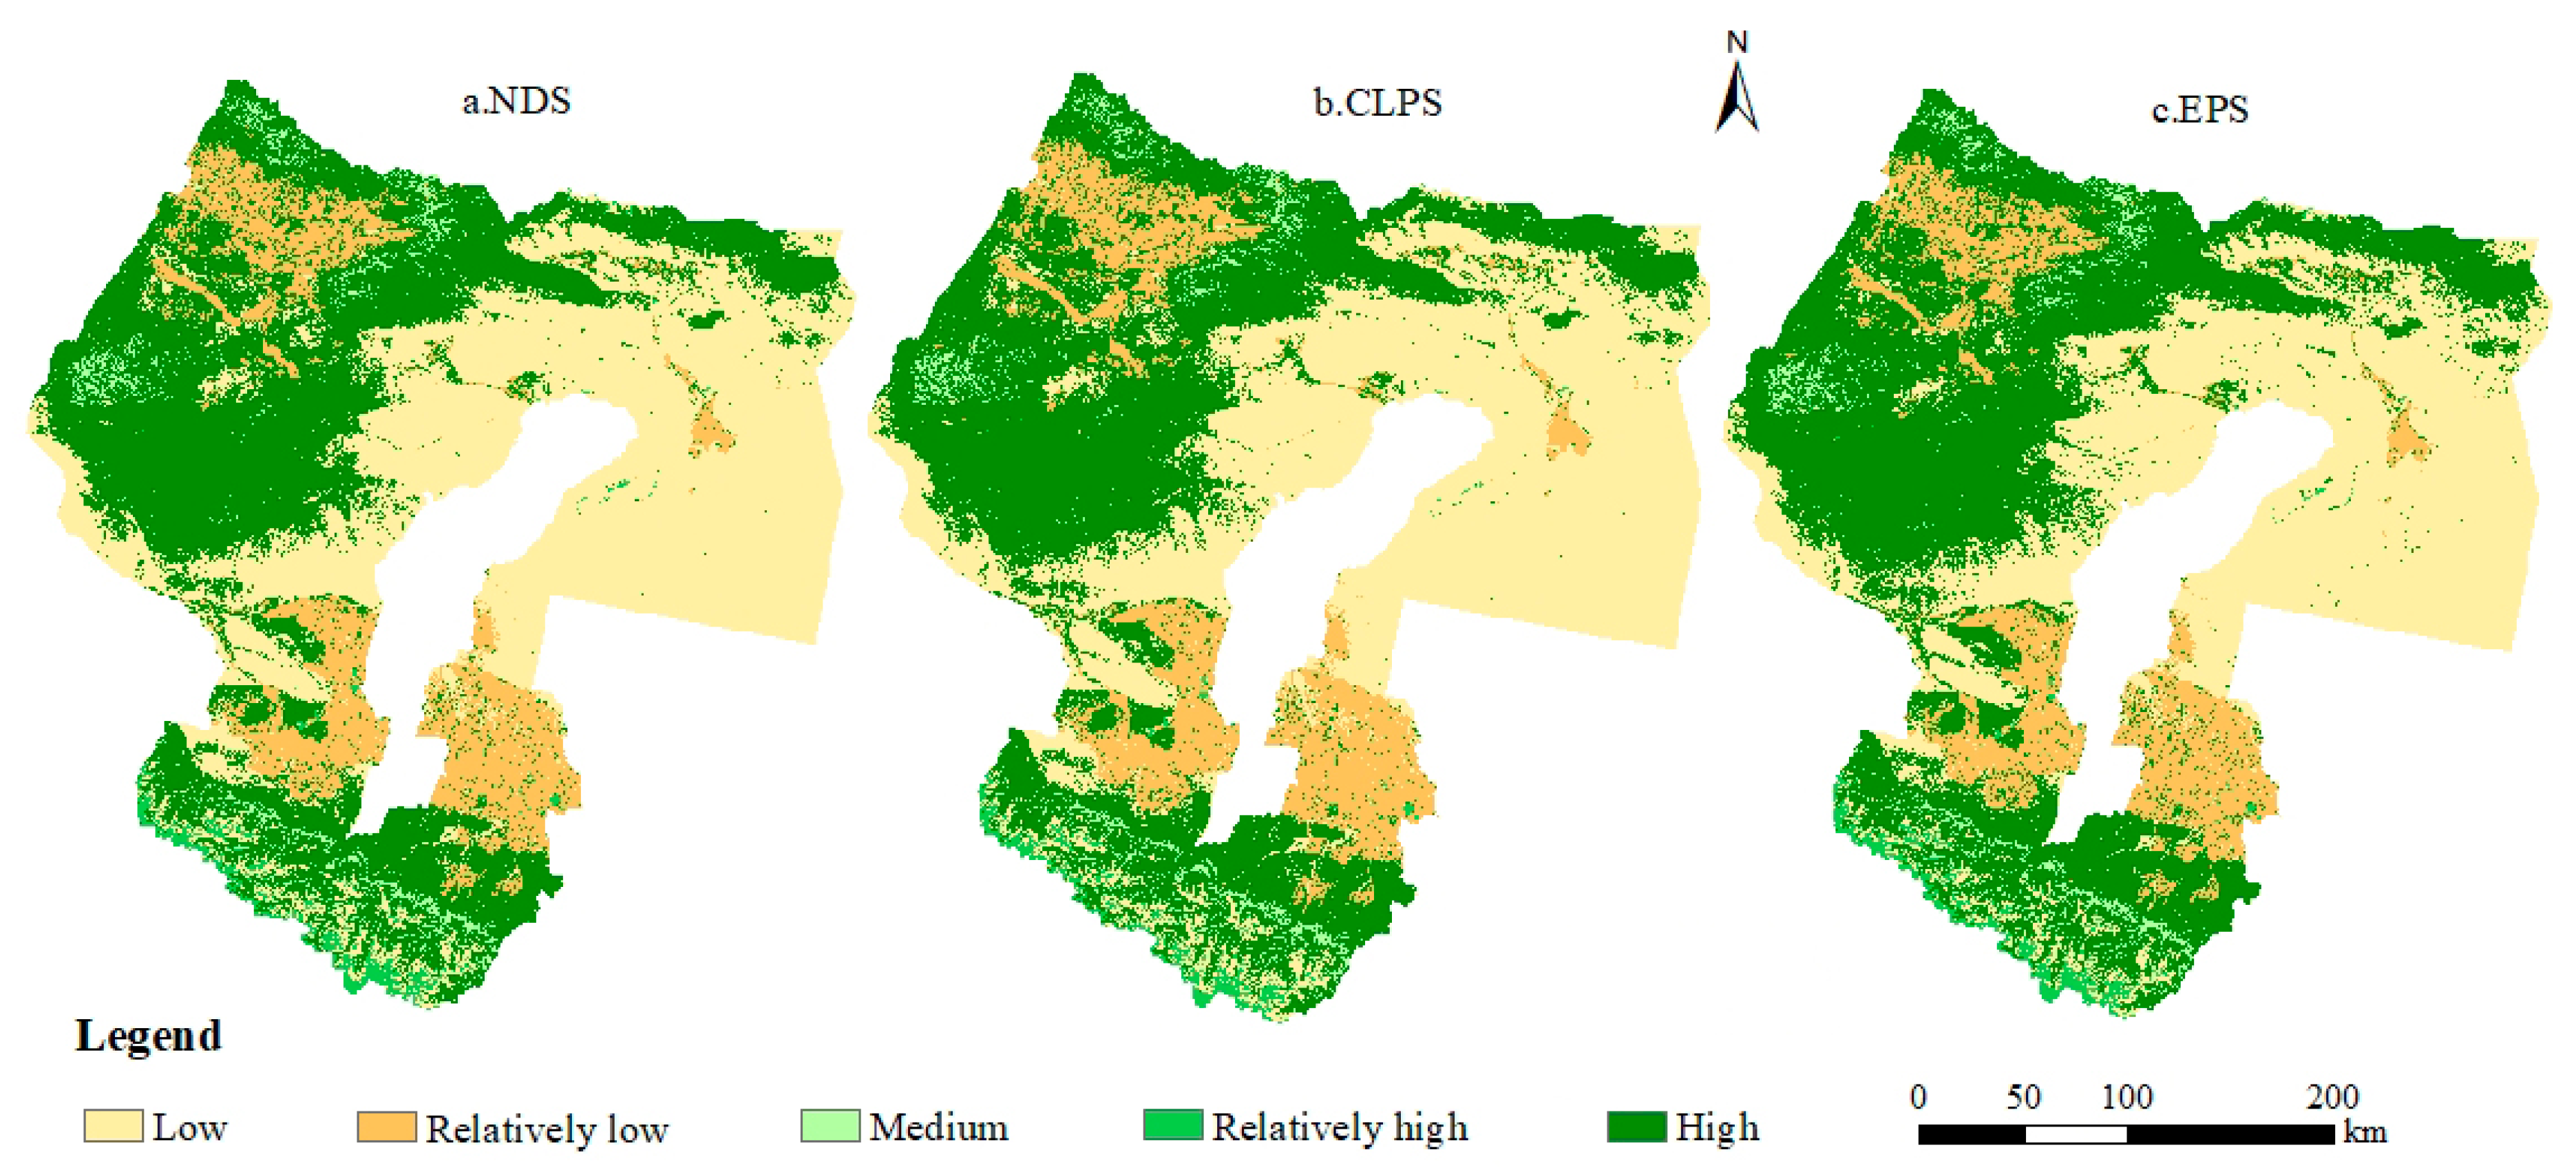
3.3.2. Multi-Scenario Habitat Quality Simulation

Results under different scenarios reveal that in the NDS in Figure 11 and Table 9, low, relatively low, and medium habitat quality areas expand by 2033, while high habitat quality zones substantially shrink, primarily concentrated in central Tacheng. Concurrently, unutilized land markedly expands and grassland significantly contracts, driving extensive transfer-out of high-habitat quality areas and pronounced habitat quality degradation.
Under the CLPS, habitat quality patterns in the Tacheng region exhibit trends similar to the natural development scenario. Low and relatively low habitat quality areas substantially expand, primarily concentrated in the northwestern and southern parts of the region, while high and relatively high habitat quality zones noticeably contract. Compared to the natural development scenario, habitat quality in the Tacheng region still demonstrates a declining trend. Under the cultivated land protection scenario, cultivated land area significantly increased, with substantial conversion of grassland and water to cultivated land. Human activities have impacted surrounding vegetation growth, resulting in grassland and wetland degradation and further habitat quality deterioration.
Under the EPS, low and relatively low habitat quality areas substantially decrease, while medium, relatively high, and high habitat quality zones exhibit growth trends. Partially cultivated land and unutilized land transition to forestland, grassland, and water, increasing vegetation coverage. Notably, the high habitat quality area demonstrates marked growth compared to both natural development and cultivated land protection scenarios, resulting in significantly enhanced habitat quality in the Tacheng region.
Multi-scenario simulation results indicate that by 2033, habitat quality in the Tacheng region demonstrates a declining trend under both NDS and CLPS, with more pronounced degradation occurring under the CLPS. This primarily stems from pasture degradation induced by cultivated land expansion, threatening the ecological environment. Under the NDS, the extremely fragile ecosystem of the Tacheng region—attributable to its unique geographical location—experiences substantial conversion of grassland and water to unutilized land; alongside expanding soil salinization and desertification; posing serious threats to regional habitat quality. Under the EPS, habitat quality in the Tacheng region significantly improves. Guided by the principles of ecological civilization advancement, this scenario facilitates coordinated ecological and socioeconomic development by converting partially cultivated land to forestland and grassland, curbing the expansion of unutilized land. Consequently, high and relatively high habitat quality areas substantially increase, yielding significant ecological improvement.

4. Discussion

4.1. Factors of Land Use Change

The research analyzed the influences of factors on land use expansion (Figure 8). The findings demonstrate that NDVI serves as the primary driver for cultivated land and grassland expansion, with cultivated land and grassland expansion favoring areas of higher NDVI values. Elevated NDVI zones indicate dense vegetation cover, offering superior suitability for crop cultivation and pasture growth [53,54]. Conversely, low-NDVI areas predominantly feature barren land and gobi, characterized by fragile ecological conditions that constrain vegetation and agricultural productivity. This finding aligns with prior research [55,56]. In typical arid regions, NDVI exerts the most significant influence on unutilized land expansion [57], which manifests as vegetation degradation, desertification, or increased barren land. As a vegetation index, lower NDVI values correspond to sparser vegetation, heightening susceptibility to salinization and desertification. Consequently, unutilized land progressively expands into low-NDVI zones. Precipitation and elevation are the primary factors for the extension of water, forestland, and grassland. Forestland, water, and grassland are predominantly distributed in medium-high altitude zones such as the Tarbagatay Mountains and Northern Tianshan Mountains. With increasing elevation, temperatures decrease while precipitation rises, creating a humid and cool climate. The combination of higher altitudes and greater precipitation meets the accumulated temperature and moisture requirements for glacier formation, arboreal growth, and pasture development. The extension of construction land is driven by GDP and population density. Economic development drives regional industrial expansion and infrastructure upgrades while creating additional employment opportunities. The land demand from economic growth and the land pressure from population agglomeration form a bidirectional driving force, thereby compelling continuous outward expansion of construction land. Therefore, investigating the role of multifactorial drivers in shaping land cover dynamics provides essential guidance for enhancing spatial efficiency in land resource utilization and advancing biodiversity preservation measures across the Tacheng region.

4.2. Impact of Land Use Change on Habitat Quality

The results of this study demonstrate that from 2003 to 2023, cultivated land and unutilized land underwent marked expansion, while grassland area decreased substantially. Concurrently, the areas of low and relatively low continued to increase, whereas high habitat quality areas declined significantly, reflecting an overall downward trend in habitat quality. These changes are closely associated with the contraction of water and grassland areas, alongside the extension of unutilized land, cultivated land, and construction land. A comparative evaluation of land use transitions (Figure 4) and spatial variations in habitat quality (Figure 10) is presented that from 2003 to 2023, habitat quality trends demonstrated strong consistency with land use changes, aligning with findings in arid regions from prior studies [58,59]. These investigations concurrently suggest that low and relatively low habitat quality zones in typical arid regions are predominantly characterized by unutilized land, construction land, and cultivated land. The expansion of construction land and cultivated land necessitates the removal of native vegetation, directly destroying the structure and functions of original ecosystems. This induces progressive degradation of forestland, grassland, and water areas, causing habitat loss and ecological fragmentation [60]. Unutilized land, predominantly comprising deserts and barren land, exhibits severe soil moisture deficits, acute desertification and salinization, and extremely limited vegetation growth potential. Consequently, sparse vegetation cover and fragile ecological conditions prevail. Across a two-decade span, water and grassland areas decreased substantially, accompanied by a significant reduction in high-habitat-quality areas. Variations in grassland and water areas exhibit high consistency with the spatial dynamics of high zones. The land use transition matrix (Table 6) reveals that, between 2003 and 2023, vast grassland underwent conversion to unutilized land and construction land. While water and grassland areas were transferred out, high habitat quality areas also decreased, indicating an overall degradation trend. Since the beginning of the 21st century, urban expansion, animal husbandry, and agricultural development in the Tacheng region have occupied extensive areas of water and grassland, disrupting the ecological environment. Soil fertility has declined, grassland degradation has intensified, and desertification has worsened. Therefore, land use transitions exert direct effects on the spatial dynamics of regional habitat quality, and improper land use practices lead to a decline in habitat quality, exacerbating the tension between economic development and ecological conservation.

4.3. Challenges and Countermeasures for Future Habitat Quality

According to the simulation outcomes, the findings were derived under the NDS; if current land use patterns persist, land degradation will intensify—particularly in areas with intensive agricultural husbandry and concentrated unutilized land—with desertification and salinization continuing to expand. As low habitat quality areas continue to grow, habitat quality will further deteriorate. Under the CLPS, the habitat quality distribution pattern exhibits an evolution trend similar to the NDS. Cultivated land expansion will further encroach upon ecological land, particularly water and grassland. Human activities disturb surrounding vegetation growth, leading to degradation of grasslands and wetlands, expansion of soil salinization and desertification, and further deterioration of habitat quality. Under the EPS, by strengthening ecological conservation and restoration measures in the Tacheng region (e.g., enhancing vegetation coverage and restricting cultivated land expansion), the ecological environment has improved significantly. Portions of unutilized land and cultivated land have been transformed to forestland, grassland, and water, accompanied by increased vegetation cover. Notably, high habitat quality areas exhibit substantial growth compared to the NDS and CLPS, significantly enhancing habitat quality and ecosystem service provision. These findings offer clear guidance for optimizing regional ecological governance frameworks.
To prevent further deterioration of the ecological environment in the Tacheng region, referencing existing research findings and relevant government planning documents, this study proposes optimized recommendations for zoned management tailored to the ecological and environmental characteristics of the Tacheng region.
Ecological Conservation Zones: During 2003–2023, high habitat quality areas consistently exceeded 50% coverage in the Sawur Mountains, Balruk Mountains, Emin River Basin, and Kurtus Grassland confluence zone of northwestern Tacheng. These areas, featuring extensive glacial water sources, forests, and meadows, provide critical water conservation, windbreak and sand fixation, and soil-water conservation functions. Future territorial spatial planning should strictly enforce ecological protection redlines to maintain ecosystem integrity [61]. Simultaneously, areas including northern parts of Toli County, Yumin County, and Hoboksar Mongol Autonomous County in central Tacheng contain concentrated national nature reserves. Predominantly composed of forestland and grassland, these regions exhibit effective soil-water conservation and a high proportion of high and relatively high habitat quality areas, therefore serving as critical zones for sustaining elevated habitat quality and biodiversity in the Tacheng region. Given its unique “mountain-oasis-desert” composite ecosystem, future development in this region should prioritize the EPS, further upholding the ecological protection development philosophy. This entails enhancing forest quality and stability without reducing existing ecological land, ensuring land use compliance with ecological protection requirements, and maintaining high habitat quality while curbing desertification expansion.
Coordinated Agro-Pastoral Development Zones: The southern Wusu City and Shawan City, along with northern Tacheng City and Emin County in the Tacheng region, are predominantly characterized by grassland, cultivated land, and construction land. These areas exhibit relatively high population density, elevated urbanization, and economic development levels, representing key agro-pastoral zones in Tacheng. In recent years, agro-pastoral expansion and urban sprawl have triggered substantial grassland loss and a discernible degradation trend in habitat quality. Under the guiding principle of ecological civilization construction, this region faces the dual pressures of economic development and ecological protection. Future development planning should prioritize integrating EPS and CLPS, rationally controlling cultivated and construction land areas while simultaneously preventing degradation of ecological land. Promoting environmentally friendly agricultural technologies to mitigate negative environmental effects of farming and cultivate new drivers for green agriculture, while concurrently leveraging forest-grassland resources to develop eco-tourism initiatives, not only strengthens local habitat quality but also fosters sustainable economic development.
Desert Restoration Zones: Southern Hoboksar Mongol Autonomous County, eastern Toli County, and northern Shawan City in the Tacheng region are predominantly characterized by unutilized land, featuring barren mountains, gobi, and saline-alkali land. These areas exhibit low vegetation cover, fragile ecological conditions, and extensive distribution of low habitat quality areas. Future territorial spatial planning for Tacheng should prioritize the EPS. In desertification frontlines, implementing straw checkerboard barriers, alongside conducting restoration of degraded grasslands and forests, and remediation of salinization and desertification, are essential measures [62]. Strictly enforcing land use regulation systems to curb expansion of unutilized land, increasing its conversion proportion to ecological land types such as forestland, grassland, and water, and preventing further desertification expansion are imperative.

4.4. Limitations and Prospects

The research quantified the spatial-temporal dynamics of land use transitions and ecological habitat quality across the Tacheng region during the 2003–2023. The results offer theoretical underpinnings and empirical evidence to inform ecological conservation and land-use planning. However, this research has certain limitations: (1) Although three distinct development scenarios were established, regional development pathways are significantly influenced by national policy regulation. Particularly, as the Tacheng region serves as a core zone of the Silk Road Economic Belt and a critical ecological barrier in western China, its development models exhibit uniqueness. The existing scenario settings may not fully encompass the actual evolution trajectories, leading to deviations in simulation results. Future research should refine scenario construction by integrating regional policy orientations to bolster the methodological rigor and empirical credibility of simulated results. (2) Land use change and habitat quality exhibit significant uncertainties and are influenced by multiple factors. Future research will incorporate additional factors into simulations, further refining studies to refine the PLUS model to optimize its predictive performance, with the aim of achieving more precise forecasting results. (3) The parameter settings of the InVEST model incorporate inherent subjective components and rely on professional expertise. Future research should optimize the parameter combinations of the model by integrating higher-resolution remote sensing data with field surveys to enhance simulation accuracy.

5. Conclusions

This study addresses the research gap regarding habitat quality in the Central Asian arid-semiarid transition zone, pioneering the coupling of PLUS and InVEST models in the Tacheng region. Centering on the core objectives of elucidating spatiotemporal evolution characteristics, coupling mechanisms, and future trajectories of land use change and habitat quality in Tacheng, we analyzed long-term land use dynamics in 2003–2023 and simulated projected land use patterns and habitat quality configurations under 2033 development scenarios. The principal conclusions are summarized as follows:
(1)
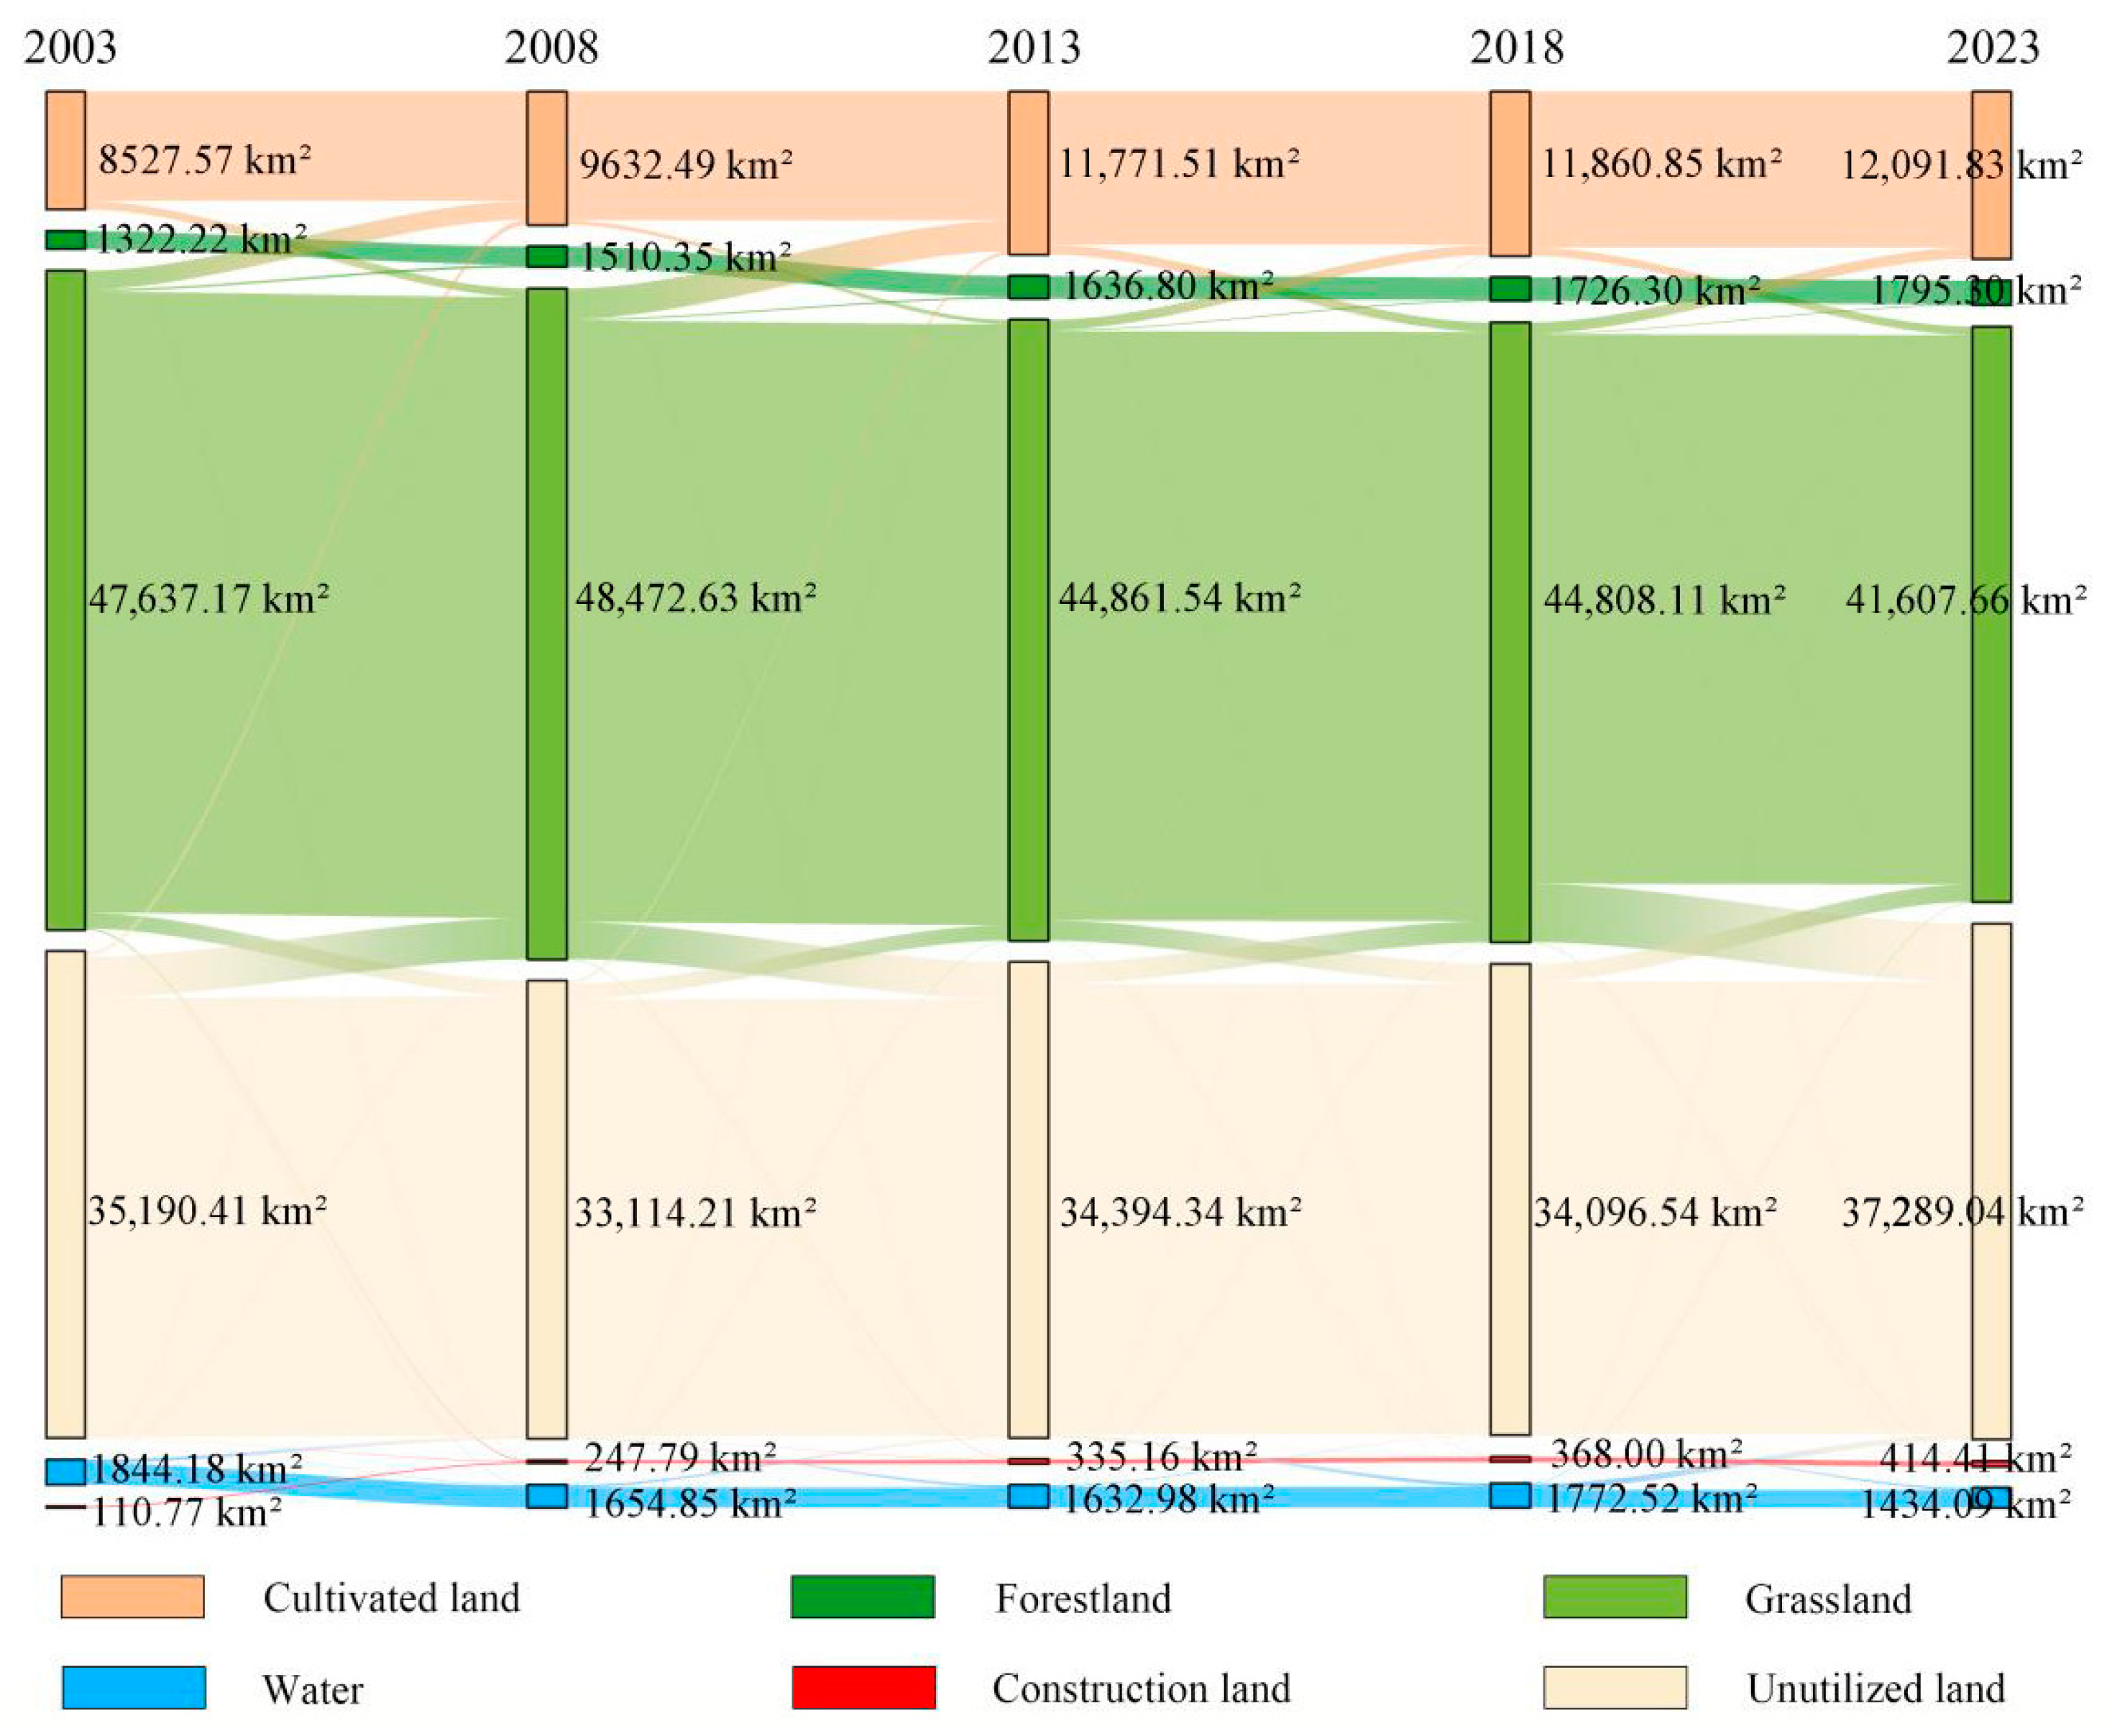
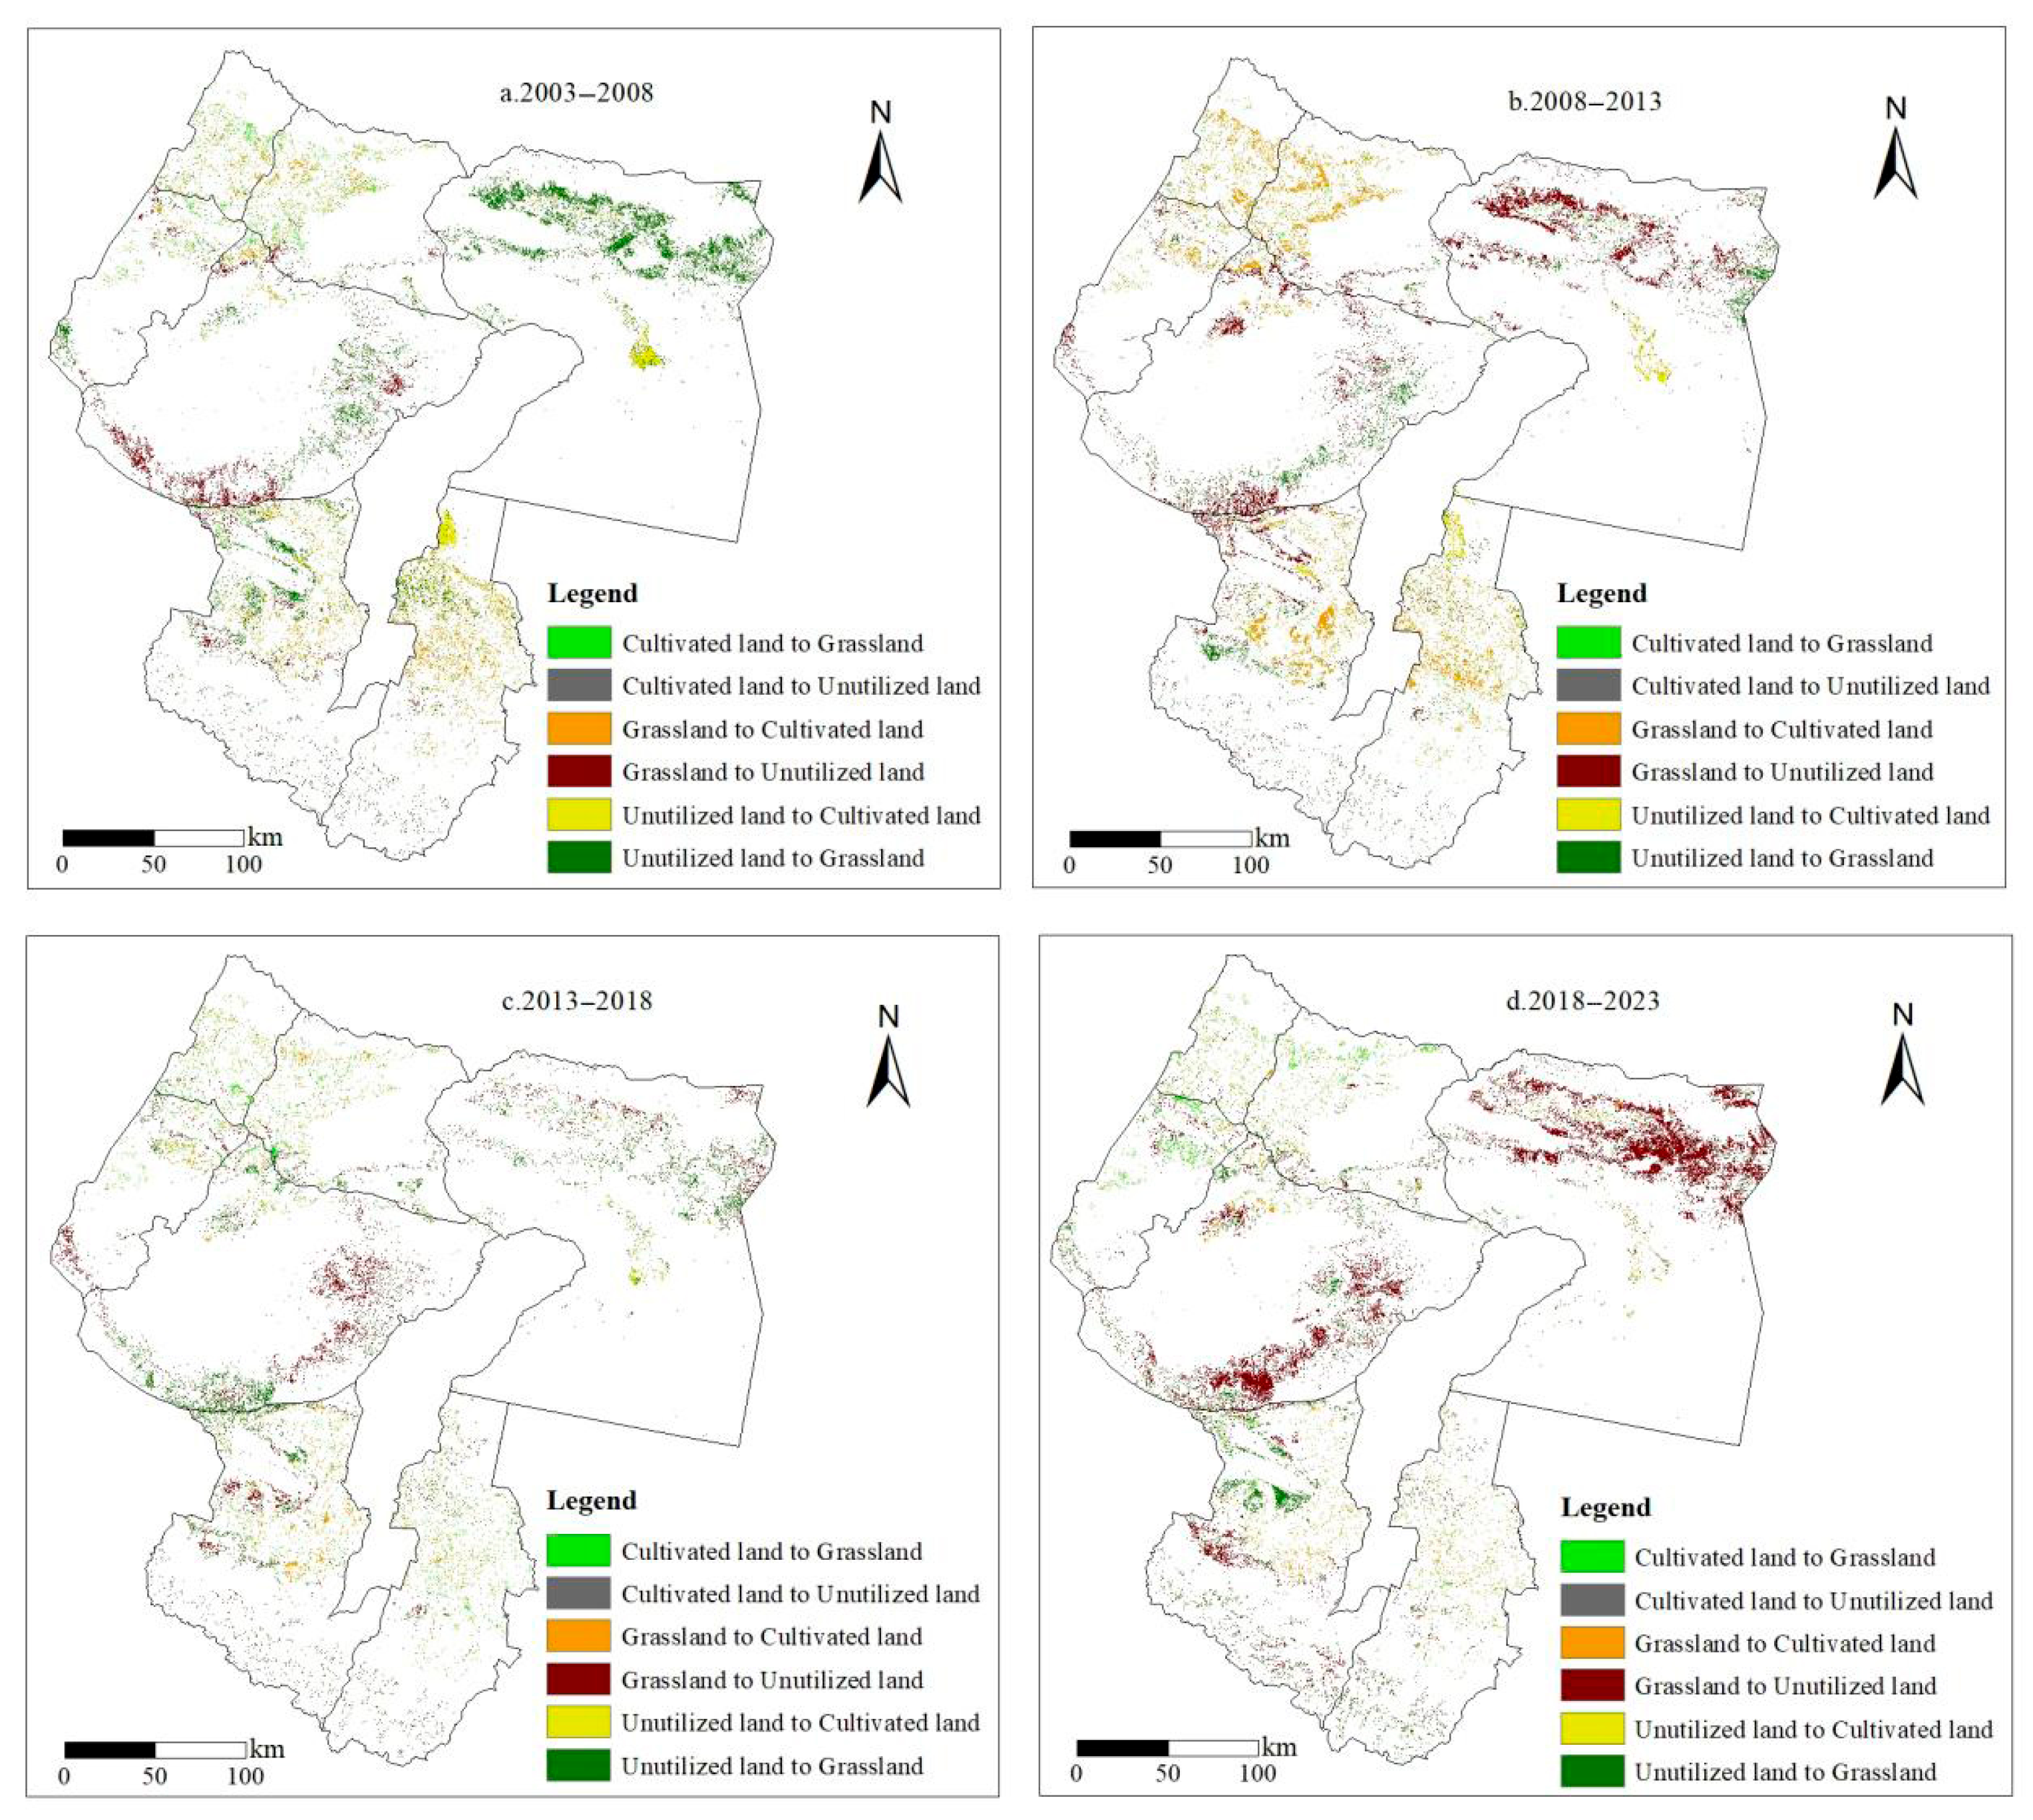
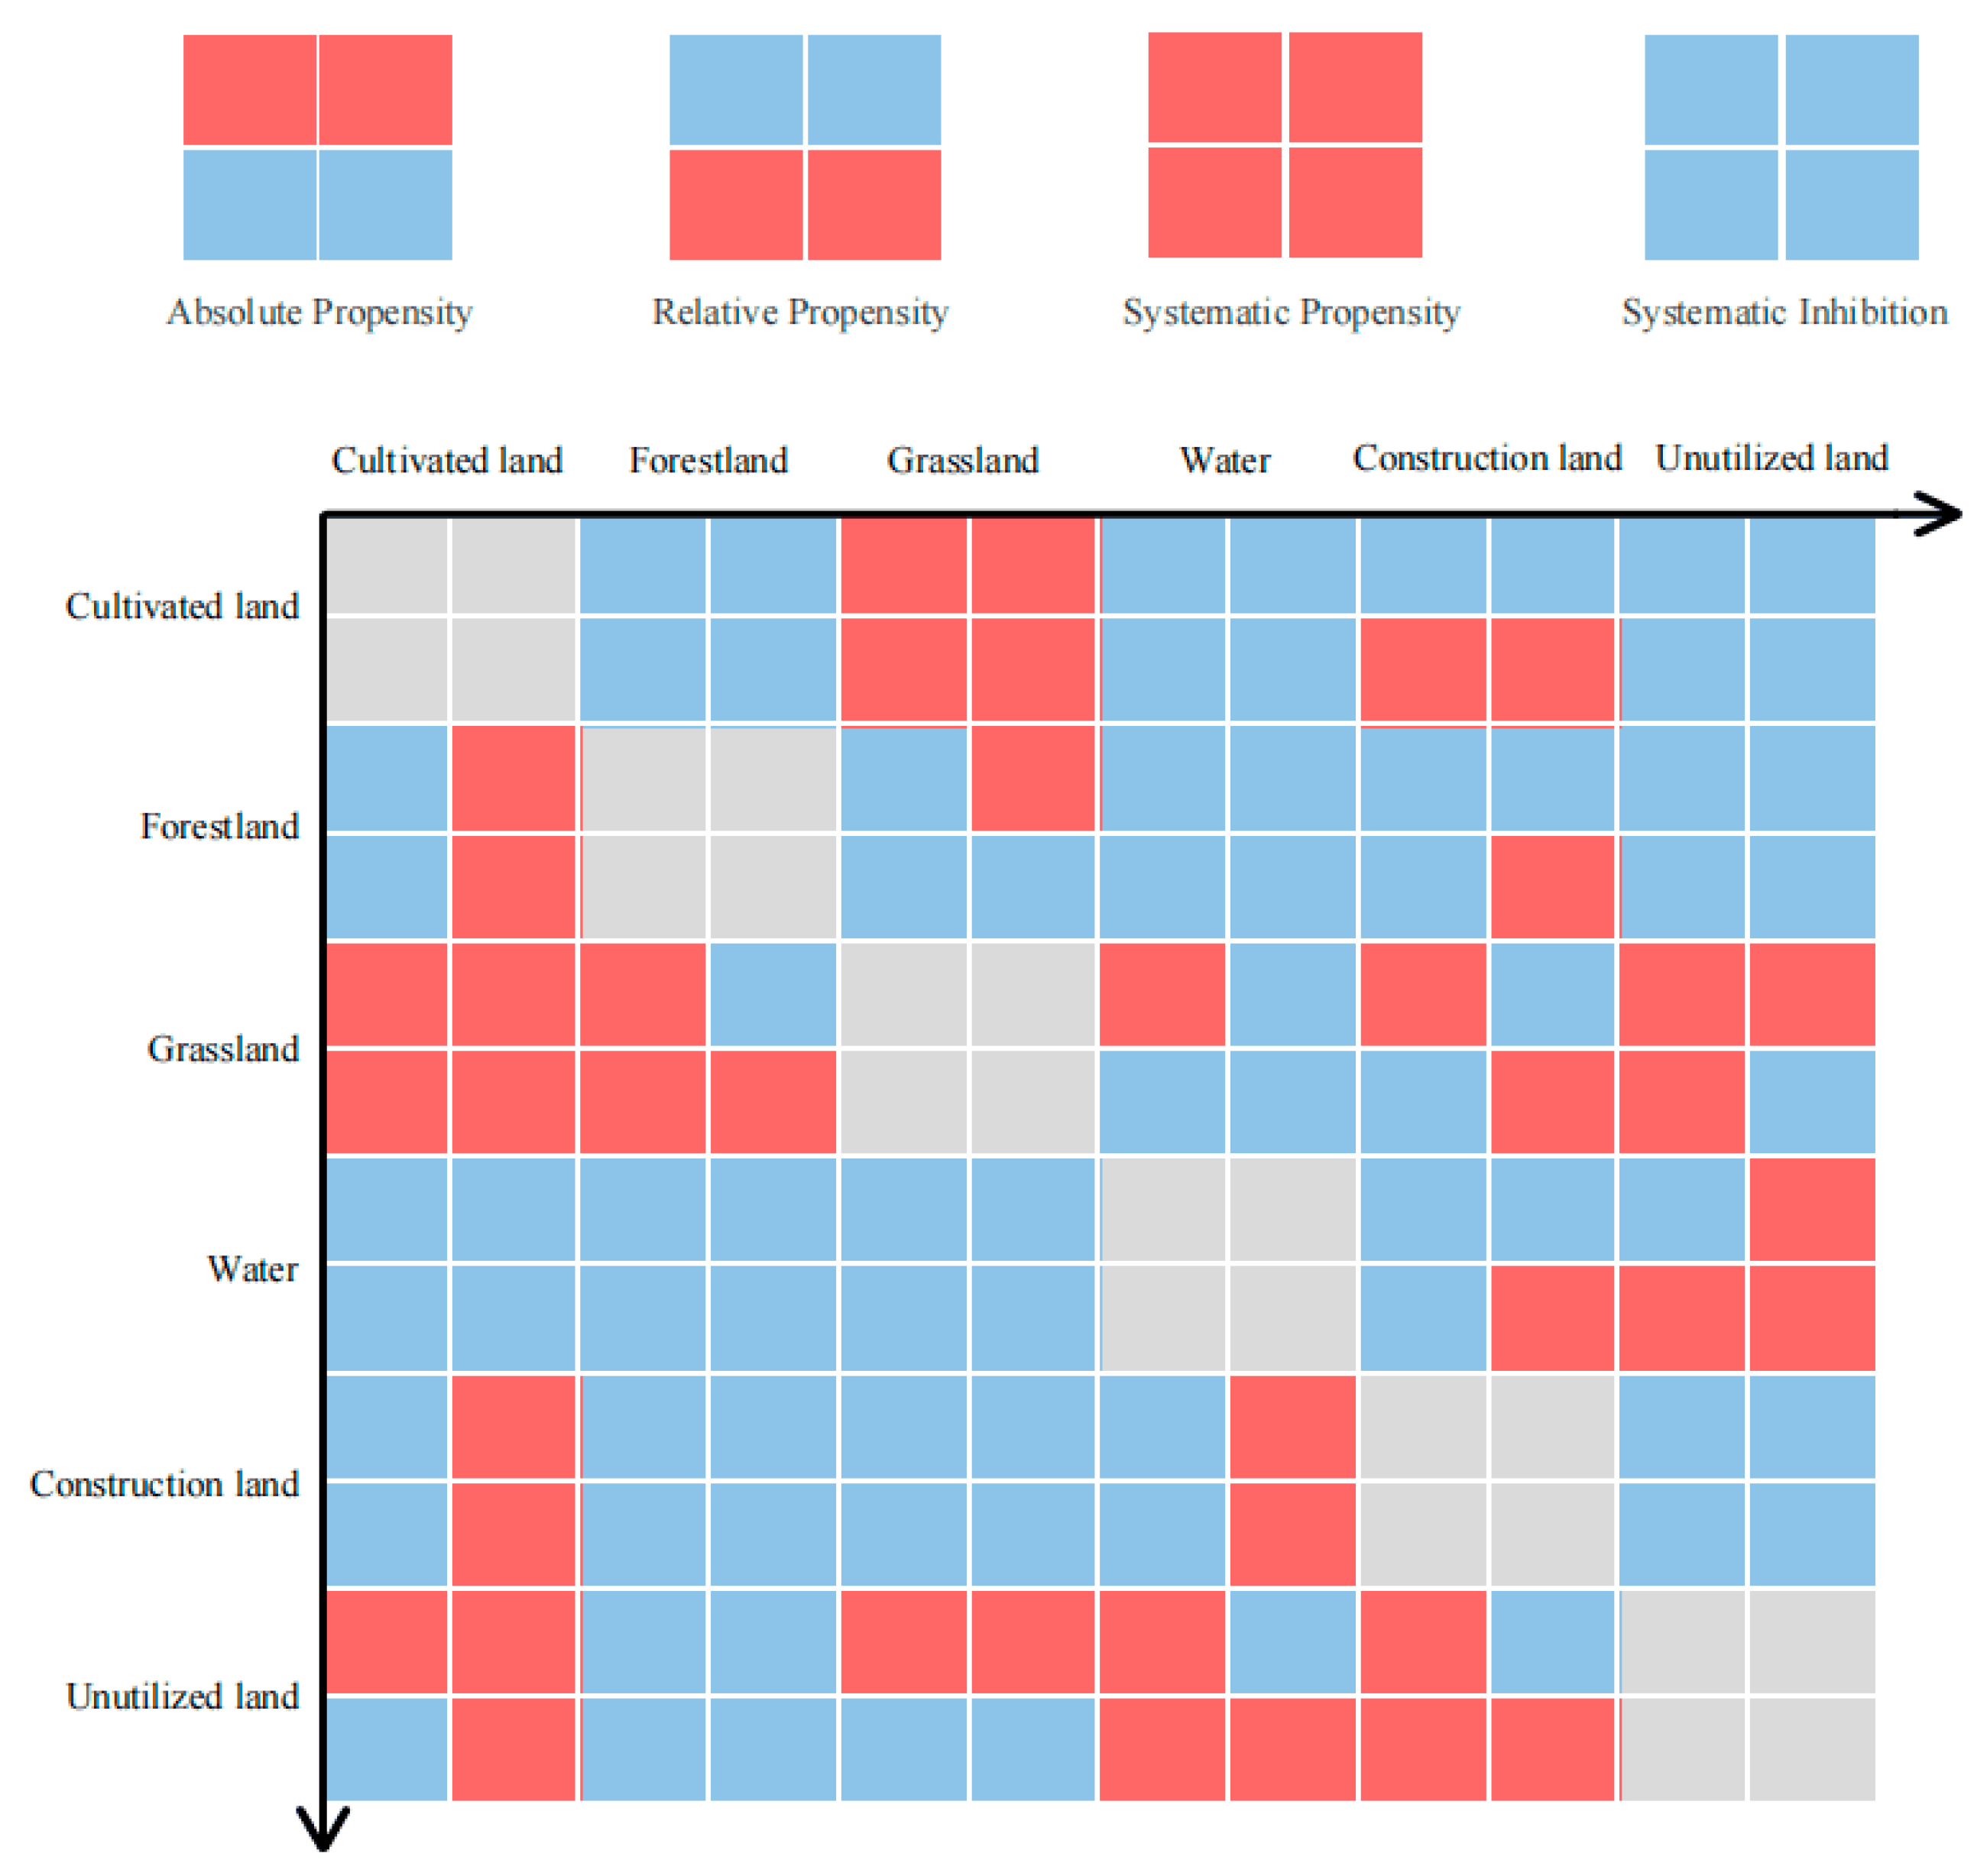
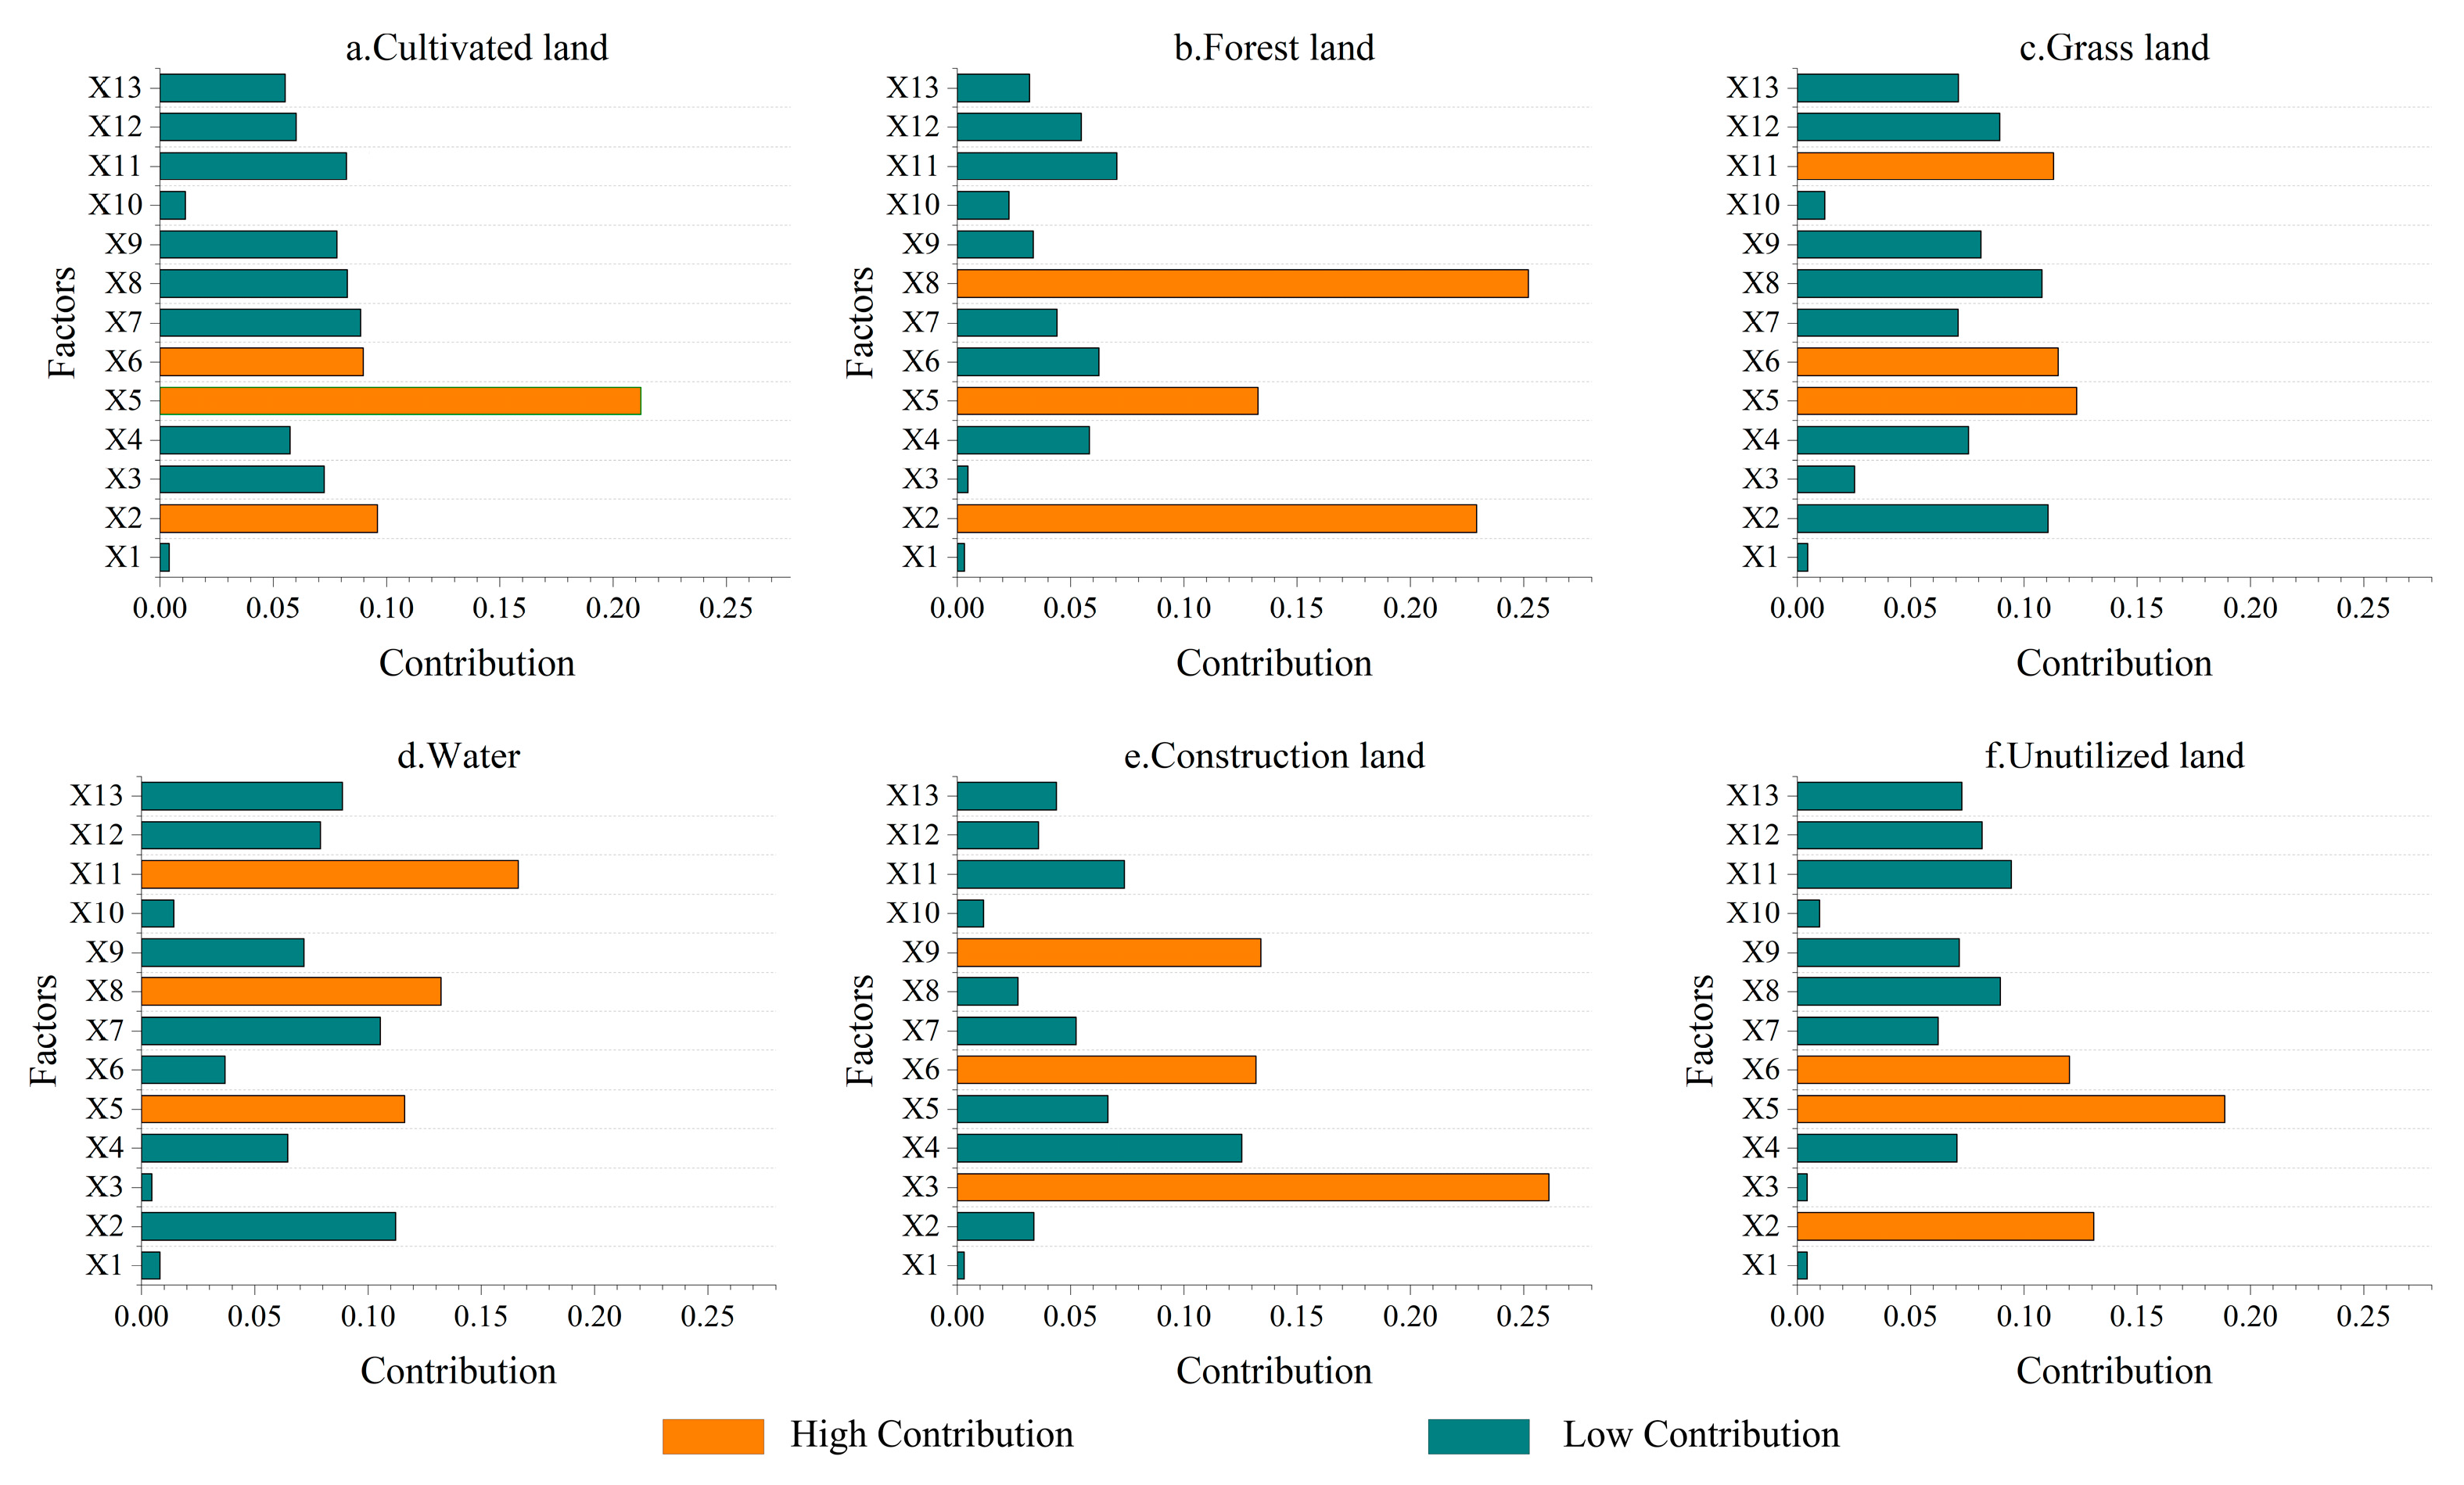
Land use in the Tacheng region is predominantly characterized by grassland and unutilized land, collectively accounting for over 85% of the total area. During 2003–2023, grassland and water areas experienced continuous contraction, whereas cultivated land and unutilized land expanded significantly. Intense bidirectional conversions between grassland and unutilized land and cultivated land constitute the most defining feature of land use change in Tacheng, with large-scale grassland-to-unutilized land conversion being particularly pronounced. After grassland degrades to unutilized land, surface vegetation cover loss reduces soil water retention capacity, exacerbating soil erosion in the Tacheng region and disrupting the topographic water redistribution function. Analysis of land use expansion drivers reveals NDVI as the core natural determinant for unutilized land expansion in arid regions, addressing previous overreliance on climatic and socioeconomic factors. IM model results indicate that water, construction land, and forestland exhibit minimal land use intensity transition areas, predominantly displaying inhibition characteristics. These patterns substantially diminish overall habitat quality in Tacheng, thereby impairing biodiversity and ecological equilibrium.
(2)
From 2003 to 2023, the overall habitat quality in the Tacheng region exhibited a significant declining trend. Spatially, the distribution pattern was characterized by “high in the west and low in the east, high in the north and low in the south,” while temporally, the area of high habitat quality regions continuously and substantially decreased, accompanied by a significant expansion of low and relatively low habitat quality regions. This degradation trend is directly linked to the continuous loss of grassland and water ecological land during the study period, as well as habitat destruction, fragmentation, and weakening of ecosystem functions resulting from the expansion of cultivated land, construction land, and unutilized land. The habitat quality deterioration in the Tacheng region primarily stems from the unidirectional conversion of grassland and water areas into cultivated land and unutilized land.
(3)
Under the NDS and CLPS, habitat quality will continue to deteriorate. Both scenarios will result in a further reduction of grassland and water areas in the Tacheng region by 2033, accompanied by sustained expansion of cultivated land and unutilized land, thereby intensifying the decline in habitat quality. The EPS serves as an effective approach to improve habitat quality. By limiting the expansion of cultivated land, controlling the growth of unutilized land, and enhancing the protection and restoration of ecological land, this scenario leads to an increase in grassland, water, and forest areas while curbing the expansion of unutilized land and cultivated land, resulting in a significant improvement in habitat quality. Furthermore, a “zoning management and control” strategy was proposed based on habitat quality grades across different regions of the Tacheng region, offering a new paradigm for balancing cultivated land protection and ecological restoration in the ecological barrier areas of Northwest China. The EPS represents the key to maintaining regional ecological security barrier functions and achieving sustainable development in the Tacheng region, with ecosystem service functions expected to improve. This validates the positive effects of proactive ecological intervention measures in reversing degradation trends.
In summary, this study addresses the research gap on land use and habitat quality changes in the Tacheng region by analyzing long-term sequential land use data, combining multiple models, and focusing on the arid-semiarid transition zone. In future planning for the Tacheng region, core measures under the EPS should be prioritized to curb habitat quality degradation and ensure regional ecological security and sustainable development. This study provides a critical scientific basis for optimizing the territorial spatial pattern of the Tacheng region, coordinating ecological protection with agricultural development demands, and formulating region-specific ecological restoration strategies for arid regions, while also offering decision-making references for sustainable development in similar arid regions.

Author Contributions

Conceptualization, Z.Z. and S.Q.; methodology, Z.Z.; software, Z.Z.; validation, Z.Z. and S.Q.; formal analysis, Z.Z.; investigation, Z.Z.; resources, Z.Z.; data curation, Z.Z. and S.Q.; writing—original draft preparation, Z.Z.; writing—review and editing, Z.Z.; visualization, Z.Z.; supervision, Z.Z. and S.Q.; project administration, Y.Z.; funding acquisition, A.A. and Y.Z. All authors have read and agreed to the published version of the manuscript.

Funding

This research was supported by the Third Xinjiang Scientific Expedition Program (Grant No. 2022xjkk1100).

Institutional Review Board Statement

Not applicable.

Informed Consent Statement

Not applicable.

Data Availability Statement

The original materials and data supporting this research are available within this article; additional information requests may be addressed to the corresponding author.

Acknowledgments

The authors wish to acknowledge the constructive comments provided by peer reviewers, which contributed to improving the quality of this study.

Conflicts of Interest

The authors declare no conflicts of interest.

Abbreviations

The following abbreviations are used in this manuscript:
IMIntensity Map
GDPGross Domestic Product
NDSNatural Development Scenario
EPSEcological Protection Scenario
CLPSCultivated Land Protection Scenario
NDVINormalized Difference Vegetation Index
PLUSPatch-generating Land Use Simulation Model
LESALand Expansion Analysis Strategy
CARSCA based on Adaptive Random patch Seeds
InVEST Integrated Valuation of Ecosystem Services and Tradeoffs

References

  1. Poniatowski, D.; Stuhldreher, G.; Löffler, F.; Fartmann, T. Patch occupancy of grassland specialists: Habitat quality matters more than habitat connectivity. Biol. Conserv. 2018, 225, 237–244. [Google Scholar] [CrossRef]
  2. Aguilar, R.; Cristóbal-Pérez, E.J.; Balvino-Olvera, F.J.; Aguilar-Aguilar, M.D.J.; Aguirre-Acosta, N.; Ashworth, L.; Lobo, J.A.; Martén-Rodríguez, S.; Fuchs, E.J.; Sanchez-Montoya, G.; et al. Habitat fragmentation reduces plant progeny quality: A global synthesis. Ecol. Lett. 2019, 22, 1163–1173. [Google Scholar] [CrossRef] [PubMed]
  3. Krauss, J.; Bommarco, R.; Guardiola, M.; Heikkinen, R.K.; Helm, A.; Kuussaari, M.; Lindborg, R.; Öckinger, E.; Pärtel, M.; Pino, J.; et al. Habitat fragmentation causes immediate and time-delayed biodiversity loss at different trophic levels. Ecol. Lett. 2010, 13, 597–605. [Google Scholar] [CrossRef]
  4. Miller, J.R.; Groom, M.; Hess, G.R.; Steelman, T.; Stokes, D.L.; Thompson, J.; Bowman, T.; Fricke, L.; King, B.; Marquardt, R. Biodiversity conservation in local planning. Conserv. Biol. 2009, 23, 53–63. [Google Scholar] [CrossRef] [PubMed]
  5. Fu, B.J.; Chen, L.D.; Ma, K.M. The effect of land use Chang on the regional environment in the Yangjuangou catchment in the loess plateau of China. Acta Geogr. Sin. 1999, 54, 241–246. [Google Scholar] [CrossRef]
  6. Costa, G.C.; Nogueira, C.; Machado, R.B.; Colli, G.R. Sampling bias and the use of ecological niche modeling in conservation planning: A field evaluation in a biodiversity hotspot. Biodivers. Conserv. 2010, 19, 883–899. [Google Scholar] [CrossRef]
  7. Sherouse, B.C.; Semmens, D.J.; Clement, J.M. An application of social values for ecosystem services (SolVES) to three national forests in Colorado and Wyoming. Ecol. Indic. 2014, 36, 68–79. [Google Scholar] [CrossRef]
  8. Steenderen, V.J.C.; Sutton, F.G. Climate covariate selection influences MaxEnt model predictions and predictive accuracy under current and future climates. Ecol. Model. 2024, 498, 110872. [Google Scholar] [CrossRef]
  9. Li, Y.; Xie, W.; Zhang, J.; Zhang, D. Spatiotemporal changes and driving factors of ecological environmental quality in the Yongding-Luan River Basin based on RSEI. Front. Environ. Sci. 2024, 12, 1494098. [Google Scholar] [CrossRef]
  10. Terrado, M.; Sabater, S.; Chaplin-Kramer, B.; Mandle, L.; Ziv, G.; Acuña, V. Model development for the assessment of terrestrial and aquatic habitat quality in conservation planning. Sci. Total. Environ. 2016, 540, 63–70. [Google Scholar] [CrossRef]
  11. Van Dessel, W.; Van Rompaey, A.; Szilassi, P. Sensitivity analysis of logistic regression parameterization for land use and land cover probability estimation. Int. J. Geogr. Inf. Sci. 2011, 25, 489–508. [Google Scholar] [CrossRef]
  12. Ma, S.; Wang, L.; Wang, H.; Zhang, X.; Jiang, J. Spatial heterogeneity of ecosystem services in response to landscape patterns under the Grain for Green Program: A case-study in Kaihua County, China. Land Degrad. Dev. 2022, 33, 1901–1916. [Google Scholar] [CrossRef]
  13. Li, C.; Zhao, J.; Thinh, N.X.; Xi, Y. Assessment of the Effects of Urban Expansion on Terrestrial Carbon Storage: A Case Study in Xuzhou City, China. Sustainability 2018, 10, 647. [Google Scholar] [CrossRef]
  14. Hailu, T.; Assefa, E.; Zeleke, T. Urban expansion induced land use changes and its effect on ecosystem services in Addis Ababa, Ethiopia. Front. Environ. Sci. 2024, 12, 1454556. [Google Scholar] [CrossRef]
  15. Gashaw, T.; Tulu, T.; Argaw, M.; Worqlul, A.W. Modeling the hydrological impacts of land use/land cover changes in the Andassa watershed, Blue Nile Basin, Ethiopia. Sci. Total. Environ. 2018, 619–620, 1394–1408. [Google Scholar] [CrossRef]
  16. Chaplin-Kramer, R.; Sharp, R.P.; Mandle, L.; Sim, S.; Johnson, J.; Butnar, I.; Milà i Canals, L.; Eichelberger, B.A.; Ramler, I.; Mueller, C.; et al. Spatial patterns of agricultural expansion determine impacts on biodiversity and carbon storage. Proc. Natl. Acad. Sci. USA 2015, 112, 7402–7407. [Google Scholar] [CrossRef]
  17. Liu, Y.Y.; Liu, X.Y.; Zhang, B. Spatial features analysis of water conservation function in the hilly areas of the Loess Plateau based on InVEST model. Acta Ecol. Sin. 2020, 40, 6161–6170. [Google Scholar] [CrossRef]
  18. Chen, Y.; Zhang, F.; Lin, J. Projecting Future Land Use Evolution and Its Effect on Spatiotemporal Patterns of Habitat Quality in China. Appl. Sci. 2025, 15, 1042. [Google Scholar] [CrossRef]
  19. Varga, O.G.; Pontius, R.G., Jr.; Singh, S.K.; Szabó, S. Intensity Analysis and the Figure of Merit’s components for assessment of a Cellular Automata—Markov simulation model. Ecol. Indic. 2019, 101, 933–942. [Google Scholar] [CrossRef]
  20. Aburas, M.M.; Ho, Y.M.; Ramli, M.F.; Ash’aAri, Z.H. Improving the capability of an integrated CA-Markov model to simulate spatio-temporal urban growth trends using an Analytical Hierarchy Process and Frequency Ratio. Int. J. Appl. Earth Obs. Geoinf. 2017, 59, 65–78. [Google Scholar] [CrossRef]
  21. Siabi, E.K.; Kabo-Bah, A.T.; Anornu, G.; Akpoti, K.; Mortey, E.M.; Incoom, A.B.M.; Yeboah, K.A. Future land use simulation modeling for sustainable urban development under the shared socioeconomic pathways in West African megacities: Insights from Greater Accra Region. J. Environ. Manag. 2025, 376, 124300. [Google Scholar] [CrossRef] [PubMed]
  22. Verburg, P.H.; Soepboer, W.; Veldkamp, A.; Limpiada, R.; Espaldon, V.; Mastura, S.S.A. Modeling the Spatial Dynamics of Regional Land Use: The CLUE-S Model. Environ. Manag. 2002, 30, 391–405. [Google Scholar] [CrossRef]
  23. Rong, Y.J.; Zhang, H.; Wang, Y.S. Assessment on Land Use and Biodiversity in Nanjing City Based on Logistic-CA-Markov and InVEST Model. Res. Soil Water Conserv. 2016, 23, 82–89. [Google Scholar] [CrossRef]
  24. Zhao, H.; Guo, B.; Wang, G. Spatial–Temporal Changes and Prediction of Carbon Storage in the Tibetan Plateau Based on PLUS-InVEST Model. Forests 2023, 14, 1352. [Google Scholar] [CrossRef]
  25. Hu, F.; Zhang, Y.; Guo, Y. Spatial and temporal changes in land use and habitat quality in the Weihe River Basin based on the PLUS and InVEST models and predictions. Arid Area Geogr. 2022, 45, 1125–1136. [Google Scholar] [CrossRef]
  26. Liu, J.; Liu, B.; Wu, L.; Miao, H.; Liu, J.; Jiang, K.; Ding, H.; Gao, W.; Liu, T. Prediction of land use for the next 30 years using the PLUS model’s multi-scenario simulation in Guizhou Province, China. Sci. Rep. 2024, 14, 13143. [Google Scholar] [CrossRef]
  27. Shi, J.; Shi, P.; Wang, Z.; Wang, L.; Li, Y. Multi-Scenario Simulation and Driving Force Analysis of Ecosystem Service Value in Arid Areas Based on PLUS Model: A Case Study of Jiuquan City, China. Land 2023, 12, 937. [Google Scholar] [CrossRef]
  28. Gomes, E.; Inácio, M.; Bogdzevič, K.; Kalinauskas, M.; Karnauskaitė, D.; Pereira, P. Future scenarios impact on land use change and habitat quality in Lithuania. Environ. Res. 2021, 197, 111101. [Google Scholar] [CrossRef]
  29. McKinney, M.L. Urbanization, Biodiversity, and Conservation. Bioscience 2002, 52, 883–890. [Google Scholar] [CrossRef]
  30. Xing, M.X.; Zheng, J.H.; Li, G.Y. Spatiotemporal dynamics and driving forces of grassland health in Tacheng Prefecture from 2001 to 2020. Arid Land Geogr. 2025, 48, 1–18. [Google Scholar] [CrossRef]
  31. Liu, Y.; Tao, H.; Zhu, J.; Mondal, S.K.; Bakhtiyorov, Z. Assessment of ecological vulnerability in Xinjiang Uygur Autonomous Region, China. Res. Cold Arid. Reg. 2025, in press. [Google Scholar] [CrossRef]
  32. Ding, H.; Xingming, H. Spatiotemporal change and drivers analysis of desertification in the arid region of northwest China based on Geographic Detector. Environ. Chall. 2021, 4, 100082. [Google Scholar] [CrossRef]
  33. Kunwar, R.M.; Evans, A.; Mainali, J.; Ansari, A.S.; Rimal, B.; Bussmann, R.W. Change in forest and vegetation cover influencing distribution and uses of plants in the Kailash Sacred Landscape, Nepal. Environ. Dev. Sustain. 2020, 22, 1397–1412. [Google Scholar] [CrossRef]
  34. Li, S.; Gong, J.; Yang, J.; Chen, G.; Zhang, Z.; Zhang, M. Characteristics of LUCC patterns of the Lanzhou-Xining urban agglomeration:Based on an intensity analysis framework. Resour. Sci. 2023, 45, 480–493. [Google Scholar] [CrossRef]
  35. Fu, Y.; Guo, Y.; Lan, J.; Pan, J.; Chen, Z.; Lin, H.; Liu, G. Study of the Mechanisms Driving Land Use/Land Cover Change and Water Yield in the Ganjiang River Basin Based on the InVEST-PLUS Model. Agriculture 2024, 14, 1382. [Google Scholar] [CrossRef]
  36. González, L.; Zhiña, D.X.; Avilés, A.; Astudillo, A.; Peralta, X.; Verdugo, T. Exploring Habitat Quality Dynamics in an Equatorial Andean Basin Under Scenarios of Land Use Change. Earth 2025, 6, 10. [Google Scholar] [CrossRef]
  37. Monteiro, B.C.G.C.; Garcia, J.R.; Fernandes, M.M.; Ribeiro, A.D.S. Prediction of land use/land cover and environmental estimation of carbon stocks in the Atlantic forest: A study in the state of Sergipe, Brazil. Clean. Circ. Bioeconomy 2024, 9, 100113. [Google Scholar] [CrossRef]
  38. Khanfari, V.; Asgari, H.M.; Dadollahi-Sohrab, A. Forecasting Wetland Transformation to Dust Source by Employing CA-Markov Model and Remote Sensing: A Case Study of Shadgan International Wetland. Wetlands 2024, 44, 96. [Google Scholar] [CrossRef]
  39. Soren, D.D.L.; Roy, K.C.; Biswas, B. Land/use land /cover dynamics and future scenario of Mayurakshi river basin by random forest and CA–Markov model. Int. J. Environ. Sci. Technol. 2024, 22, 7815–7828. [Google Scholar] [CrossRef]
  40. Wang, Z.Y.; Zhang, J.Y.; Li, H.Y. Multi-scale spatiotemporal evolution and multi-scenario simulation of land use conflict in Chongqing. Acta Ecol. Sin. 2024, 44, 1024–1039. [Google Scholar] [CrossRef]
  41. Gebresellase, S.H.; Wu, Z.; Xu, H.; Muhammad, W.I. Scenario-Based LULC Dynamics Projection Using the CA–Markov Model on Upper Awash Basin (UAB), Ethiopia. Sustainability 2023, 15, 1683. [Google Scholar] [CrossRef]
  42. Clerici, N.; Cote-Navarro, F.; Escobedo, F.J.; Rubiano, K.; Villegas, J.C. Spatio-temporal and cumulative effects of land use-land cover and climate change on two ecosystem services in the Colombian Andes. Sci. Total. Environ. 2019, 685, 1181–1192. [Google Scholar] [CrossRef]
  43. Zhang, Q.Y.; Liu, R.Z.; Luan, Z.X. Analysis of driving force and multi-scenario simulation of land use in a typical agro-pastoral ecotone based on the PLUS model. Res. Soil Water Conserv. 2025, 32, 368–378. [Google Scholar] [CrossRef]
  44. Zhang, T.; Hu, Y.-Z.; Hu, H.-H.; Lei, T.-T. Prediction of land use and habitat quality in Harbin City based on PLUS- InVEST model. Environ. Sci. 2024, 45, 4709–4721. [Google Scholar] [CrossRef]
  45. Pouriyeh, A. Identification and prediction of land use changes based on artificial neural network and CA-Markov for sustainable land-use planning. Int. J. Glob. Warm. 2023, 30, 349–366. [Google Scholar] [CrossRef]
  46. Lu, G.Y. The Influence of High Standard Farm Land Construction on Grain Productivity. Ph.D. Thesis, Jiangxi Agricultural University, Nanchang, China, 2022. [Google Scholar] [CrossRef]
  47. Wang, X.D.; Wang, K.L.; Shan, N.N.; Shen, X. Comprehensive Development Regionalization of Territorial Space in Xinjiang Uygur Autonomous Region Under the Background of Territorial Spatial Planning. Econ. Geogr. 2020, 40, 176–185. [Google Scholar] [CrossRef]
  48. Bai, S.; Jing, L.D.; Li, H.; Feng, X. The Demarcation of Ecological Protection Red Line Based on Water Conversation Function. Ecol. Environ. Sci. 2017, 26, 1665–1670. [Google Scholar] [CrossRef]
  49. Wang, C.; Hou, P.; Liu, X.M.; Yuan, J.; Zhou, Q.; Lv, N. Spatiotemporal changes in vegetation cover of the national key ecosystem protection and restoration project areas, China. Acta Ecol. Sin. 2023, 43, 8903–8916. [Google Scholar] [CrossRef]
  50. Eitelberg, D.A.; van Vliet, J.; Doelman, J.C.; Stehfest, E.; Verburg, P.H. Demand for biodiversity protection and carbon storage as drivers of global land change scenarios. Glob. Environ. Change 2016, 40, 101–111. [Google Scholar] [CrossRef]
  51. Birhanu, A.; Adgo, E.; Frankl, A.; Walraevens, K.; Nyssen, J. Modelling spatial relationships between land cover change and its drivers in the Afro-alpine belt of Mount Guna (Ethiopia). Land Degrad. Dev. 2021, 32, 3946–3961. [Google Scholar] [CrossRef]
  52. Azizi, A.; Malakmohamadi, B.; Jafari, H.R. Land use and land cover spatiotemporal dynamic pattern and predicting changes using integrated CA-markov model. Glob. J. Environ. Sci. Manag. 2016, 2, 223–234. [Google Scholar] [CrossRef]
  53. Kumar, B.P.; Babu, K.R.; Sree, P.P.; Rajasekhar, M.; Ramachandra, M. A New Approach for Environmental Modelling of LULC Changes in Semi-arid Regions of Anantapur District, Andhra Pradesh, India Using Geospatial Techniques. Nat. Environ. Pollut. Technol. 2021, 20, 875–880. [Google Scholar] [CrossRef]
  54. Varghese, N.; Singh, N.P. Linkages between land use changes, desertification and human development in the Thar Desert Region of India. Land Use Policy 2016, 51, 18–25. [Google Scholar] [CrossRef]
  55. Mugari, E.; Masundire, H. Consistent Changes in Land-Use/Land-Cover in Semi-Arid Areas: Implications on Ecosystem Service Delivery and Adaptation in the Limpopo Basin, Botswana. Land 2022, 11, 2057. [Google Scholar] [CrossRef]
  56. Maimaiti, B.; Chen, S.; Kasimu, A.; Simayi, Z.; Aierken, N. Urban spatial expansion and its impacts on ecosystem service value of typical oasis cities around Tarim Basin, northwest China. Int. J. Appl. Earth Obs. Geoinf. 2021, 104, 102554. [Google Scholar] [CrossRef]
  57. Li, Y.; Liu, Y.; Qin, Y.; Zhang, K.; Enwer, R.; Wang, W.; Yuan, S. Evolution and Predictive Analysis of Spatiotemporal Patterns of Habitat Quality in the Turpan–Hami Basin. Land 2024, 13, 2186. [Google Scholar] [CrossRef]
  58. Zhang, X.; Tong, H.; Zhao, L.; Huang, E.; Zhu, G. Spatial and Temporal Dynamics and Multi-Scenario Forecasting of Habitat Quality in Gansu–Qinghai Contiguous Region of the Upper Yellow River. Land 2024, 13, 1060. [Google Scholar] [CrossRef]
  59. Akbar, A.; Abulizi, A.; Erken, R.; Yu, T. Driving Mechanisms of Spatial Differentiation in Ecosystem Service Value in Opencast Coal Mines in Arid Areas: A Case Study in the Zhundong Economic and Technological Development Zone. Land 2024, 13, 623. [Google Scholar] [CrossRef]
  60. Dey, S.; Niyogi, J.G.; Das, D. Scenario-based modelling of carbon storage and sequestration using InVEST model in Kolkata, India, and its environs. Arab. J. Geosci. 2025, 18, 68. [Google Scholar] [CrossRef]
  61. Bongaarts, J. Summary for Policymakers of the Global Assessment Report on Biodiversity and Ecosystem Services of the Intergovernmental Science-Policy Platform on Biodiversity and Ecosystem Services. Popul. Dev. Rev. 2019, 45, 680–681. [Google Scholar] [CrossRef]
  62. Pereira, P. Ecosystem Services in a Changing Environment. Sci. Total. Environ. 2020, 702, 135008. [Google Scholar] [CrossRef]
Figure 1. Map of the study area.
Sustainability 17 06113 g001
Figure 2. Research Framework and Flowchart.
Sustainability 17 06113 g002
Figure 3. Land use change intensity map unit. Note: Red and blue grids represent preferential and inhibitory tendencies, respectively; the horizontal axis denotes end-period land classes, and the vertical axis denotes initial-period land classes. A indicates absolute transition-in, B absolute transition-out, C relative transition-in, and D relative transition-out. Different colored grid types represent tendencies of distinct land class transitions.
Sustainability 17 06113 g003
Figure 4. Spatial land use patterns in 2003–2023.
Sustainability 17 06113 g004
Figure 5. Land use transition Sankey diagram for the Tacheng region across five phases (2003–2023).
Sustainability 17 06113 g005
Figure 6. Spatial distribution map of mutual conversions among cultivated land, grassland, and unutilized land.
Sustainability 17 06113 g006
Figure 7. Land use change intensity map of the Tacheng region in 2003–2023. Note: Red and blue grids denote propensity and inhibition, respectively; colored grid types indicate land category conversion tendencies.
Sustainability 17 06113 g007
Figure 8. Importance of various factors to the expansions of different land use types. Note: X1: Aspect; X2: Elevation; X3: GDP; X4: Distance to Highway; X5: NDVI; X6: Population Density; X7: Distance to Primary Road; X8: Precipitation; X9: Distance to Secondary Road; X10: Slope; X11: Temperature; X12: Distance to National Trunk Highway; X13: Distance to Water.
Sustainability 17 06113 g008
Figure 9. Multi-scenario land use change simulation results of the Tacheng region in 2033.
Sustainability 17 06113 g009
Figure 10. Spatial distribution of habitat quality in 2003–2023.
Sustainability 17 06113 g010
Figure 11. Habitat quality prediction under different scenarios in 2033.
Sustainability 17 06113 g011
Table 1. Threat factor parameter.
Threat FactorsMaximum Distance (km)WeightDecay
Cultivated land60.6Linear
Construction land80.8Exponential
Unutilized land40.5Linear
Railway30.4Linear
Highway10.3Linear
Table 2. Threat factor sensitivity.
Land Use TypeHabitat
Suitability
Threat Factors
Cultivated
Land
Construction
Land
Unutilized
Land
RailwayHighway
Cultivated land0.50.20.80.50.40.6
Forestland0.80.50.80.50.60.5
Grassland10.40.60.30.70.6
Water0.90.40.60.40.60.5
Construction land000000
Unutilized land0.20.20.3000
Table 3. Neighborhood weight parameter.
Land Use TypeCultivated LandForestlandGrasslandWaterConstruction LandUnutilized Land
Neighborhood weight0.3750.2850.2160.1820.6830.236
Table 4. Multi-scenario land use transition cost matrix.
Land Use TypeNDSCLPSEPS
abcdefabcdefabcdef
a111111100000111110
b111111111011010000
c111111111111011100
d111111101111000100
e111111000010000010
f111111111111111111
Note: a, b, c, d, e, and f denote cultivated land, forestland, grassland, water, construction land, and unutilized land, respectively. 0 denotes prohibited transitions, and 1 denotes permitted transitions.
Table 5. Area of land categories of the Tacheng region in 2003–2023 (km2).
CategoryYearsLand Use Types
Cultivated LandForestlandGrasslandWaterConstruction LandUnutilized Land
Area of Land Categories20038527.571322.2247,637.171844.18110.7735,190.41
20089632.491510.3548,472.631654.85247.7933,114.21
201311,771.511636.8044,861.541632.98335.1634,394.34
201811,860.851726.3044,808.111772.52368.0034,096.54
202312,091.831795.3041,607.661434.09414.4137,289.04
Land Category Area Changes2003–20081104.92188.13835.46−189.33137.02−2076.20
2008–20132139.02126.45−3611.10−21.8787.371280.13
2013–201889.3489.50−53.42139.5432.84−297.80
2018–2023230.9868.99−3200.45−338.4446.413192.50
2003–20233564.26473.08−6029.51−410.10303.642098.63
Table 6. Land Use Transfer Matrix of the Tacheng Region in 2003–2023 (km2).
20032023
Cultivated LandForestlandGrasslandWaterConstruction LandUnutilized LandTotalTransfer-Out
Cultivated land7670.054.83792.065.9540.4214.268527.57857.52
Forestland4.001316.771.290.020.140.001322.225.45
Grassland3491.45463.9038,995.7943.32141.614501.1047,637.178641.38
Water13.549.1688.841227.775.48499.391844.18616.41
Construction land0.110.000.060.20110.380.01110.770.39
Unutilized land912.680.631729.62156.83116.3932,274.2735,190.412916.14
Total12,091.831795.3041,607.661434.09414.4137,289.04
Transfer-in4421.78478.522611.87206.31304.045014.77
Table 7. Multi-scenario comparison of land use type areas and change rates in the Tacheng Region (comparison with 2023).
Land Use Type2023 AreaNDSCLPSEPS
Area (km2)Change Rate (%)Area (km2)Change Rate (%)Area (km2)Change Rate (%)
Cultivated land12,091.8312,316.241.86%12,713.925.14%11,881.76−1.74%
Forestland1795.301941.278.13%1937.787.94%1938.757.99%
Grassland41,607.6638,912.68−6.48%38,635.33−7.14%42,401.031.91%
Water1434.091295.72−9.65%1295.19−9.69%1527.096.49%
Construction land414.41492.7918.91%482.7916.50%472.2413.95%
Unutilized land37,289.0439,673.646.39%39,567.316.11%36,411.46−2.35%
Table 8. Area and proportion of each habitat quality grade in 2003–2023.
Habitat Quality20032008201320182023
Area
(km2)
Proportion (%)Area
(km2)
Proportion (%)Area
(km2)
Proportion (%)Area
(km2)
Proportion (%)Area
(km2)
Proportion (%)
Low35,301.1837.3033,362.0035.2534,729.5036.7034,464.5436.4237,703.4639.84
Relatively low8527.579.019632.4910.1811,771.5112.4311,860.8512.5312,091.8312.78
Medium495.310.531510.351.601636.801.731726.301.821795.301.90
Relatively high826.910.871654.851.751632.981.731772.521.881434.091.51
High49,481.3552.2948,472.6351.2244,861.5447.4144,808.1147.3541,607.6643.97
Table 9. Area and proportion of habitat quality grades under different scenarios in 2033.
Habitat
Quality
20232033
NDSCLPSEPS
Area (km2)Proportion(%)Area (km2)Proportion (%)Area (km2)Proportion (%)Area (km2)Proportion (%)
Low37,703.4639.8439,973.0942.2440,050.1042.3236,883.7138.98
Relatively low12,091.8312.7812,316.2413.0112,713.9213.4411,881.7612.56
Medium1795.301.901941.272.051937.782.051938.752.05
High1434.091.521489.061.571295.191.371527.091.61
Relatively high41,607.6643.9738,912.6841.1238,635.3340.8342,401.0344.81
Disclaimer/Publisher’s Note: The statements, opinions and data contained in all publications are solely those of the individual author(s) and contributor(s) and not of MDPI and/or the editor(s). MDPI and/or the editor(s) disclaim responsibility for any injury to people or property resulting from any ideas, methods, instructions or products referred to in the content.

