Article

Terrestrial LiDAR Technology to Evaluate the Vertical Structure of Stands of Bertholletia excelsa Bonpl., a Species Symbol of Conservation Through Sustainable Use in the Brazilian Amazon

by
Felipe Felix Costa
1,
Raimundo Cosme de Oliveira Júnior
2,*,
Danilo Roberti Alves de Almeida
3,
Diogo Martins Rosa
4,
Kátia Emídio da Silva
5,
Hélio Tonini
6,
Troy Patrick Beldini
7,
Darlisson Bentes dos Santos
2 and
Marcelino Carneiro Guedes
1,8
1
Graduate Program in Tropical Biodiversity, Federal University of Amapá (UNIFAP), Macapá 68903-419, AP, Brazil
2
Embrapa Eastern Amazonia, Belém 66095-100, PA, Brazil
3
Escola Superior de Agricultura Luiz de Queiroz (ESALQ), Universidade de São Paulo (USP), Piracicaba 13418-900, SP, Brazil
4
Campus Porto Velho, Federal University of Rondônia, Porto Velho 76801-059, RO, Brazil
5
Embrapa Western Amazonia, Manaus 69010-970, AM, Brazil
6
Embrapa Agrossilvipastoril, Sinop 78550-970, MT, Brazil
7
United State of Department of Agriculture (USDA), Washington, DC 20250, USA
8
Embrapa Amapá, Macapá 68903-419, AP, Brazil
*
Author to whom correspondence should be addressed.
Sustainability 2025, 17(13), 6049; https://doi.org/10.3390/su17136049
Submission received: 9 April 2025 / Revised: 9 June 2025 / Accepted: 24 June 2025 / Published: 2 July 2025

Abstract

The Amazon rainforest hosts a diverse array of forest types, including those where Brazil nut (Bertholletia excelsa) occurs, which plays a crucial ecological and economic role. The Brazil nut is the second most important non-timber forest product in the Amazon, a symbol of development and sustainable use in the region, promoting the conservation of the standing forest. Understanding the vertical structure of these forests is essential to assess their ecological complexity and inform sustainable management strategies. We used terrestrial laser scanning (TLS) to assess the vertical structure of Amazonian forests with the occurrence of Brazil nut (Bertholletia excelsa) at regional (Amazonas, Mato Grosso, Pará, and Amapá) and local scales (forest typologies in Amapá). TLS allowed high-resolution three-dimensional characterization of canopy layers, enabling the extraction of structural metrics such as canopy height, rugosity, and leaf area index (LAI). These metrics were analyzed to quantify the forest vertical complexity and compare structural variability across spatial scales. These findings demonstrate the utility of TLS as a precise tool for quantifying forest structure and highlight the importance of integrating structural data in conservation planning and forest monitoring initiatives involving B. excelsa.

1. Introduction

The Brazil nut tree is an iconic and endemic species to the Amazon and occurs in all the countries that make up the pan-Amazon region [1,2]. During recent decades, there has been an intensification of research on the species, touching on diverse aspects such as ecology, health, and the economy [3,4,5,6,7,8]. There has also been a large increase in demand within the Brazilian economy, causing an increase in the price of the Brazil nut on the commodities market [9,10].
As result of this increase in demand, the necessity for more research on this species has arisen, especially on a regional scale. In spite of the existence of a large diversity of studies that have been conducted on the Brazil nut tree, there is still a considerable gap in knowledge of the species, especially with respect to aspects that influence its occurrence and abundance in Amazonian forests, such as the incidence of solar radiation [11,12]. The Brazil nut tree is a heliophyte and needs large clearings in order to establish itself [7,13,14], having difficulty developing in the sub-forest [15]. These facts justify the need to conduct studies examining the forest canopy structure.
However, conducting such studies in forest stands with Brazil nut trees is complicated, since these trees can reach up to 50 m in height [5,6,13,16,17]. The traditional sampling methods such as visual observation are subjective [18,19] and of difficult application, especially in trees with such great height. In addition, obtaining information in the field, such as tree height and canopy stratification, becomes very expensive, especially for large areas and principally in Amazon tropical forests.
In this context, the use of remote sensing technologies in forest ecology studies is becoming more frequent, since these technologies possess greater potential, efficiency, and agility than traditional methods [20]. The Portable Canopy LiDAR (PCL) permits the acquisition of a large quantity of field data with high precision and accuracy in a short interval of time, thus allowing for the estimation of a large range of variables, including height and biomass [21,22,23,24,25,26].
Although LiDAR has been increasingly used to evaluate forest structure in the Amazon, most existing studies have primarily relied on airborne LiDAR data or satellite-derived products to assess canopy height, gap fraction, and biomass distribution [27,28,29,30]. These approaches have yielded important insights into regional-scale forest dynamics but often lack the fine-scale vertical detail and near-ground resolution necessary to fully understand vertical leaf area distribution and its ecological implications. Terrestrial LiDAR, by contrast, offers an unprecedented opportunity to assess vertical stratification and canopy complexity from the forest floor to the emergent layer with high accuracy [21,22,25].
Recent studies have used airborne LiDAR to describe forest height profiles, biomass variation, and canopy roughness across the Amazon Basin (e.g., [22,28,31,32]). However, most of these works have focused on regional-scale mapping or forest productivity, without accounting for how vertical structural variation may be linked to the presence, dominance, or ecological role of key species such as Bertholletia excelsa. Moreover, while some research has examined canopy structure in relation to biodiversity or light penetration (e.g., [33,34]), few have directly quantified how individual species influence vertical canopy profiles across scales.
Additionally, despite the proven capabilities of terrestrial LiDAR for high-resolution structural analysis [21,25], its application in natural tropical forests—especially in connection with species-specific patterns of dominance or regeneration—is still limited. There is a distinct lack of studies integrating terrestrial LiDAR data with multiscale analysis of forest typologies, particularly in transition ecosystems such as savannah–forest mosaics. This study seeks to fill that gap by evaluating how the vertical forest profile, derived from terrestrial LiDAR, correlates with the abundance and distribution of Brazil nut trees in both regional (multi-state) and local (typological) contexts, offering a novel approach to forest monitoring that merges structure, scale, and species-level analysis.
However, few studies have integrated terrestrial LiDAR data with species-specific analyses in Amazonian forests, particularly regarding Bertholletia excelsa, a heliophilous species of high ecological and economic relevance. This study addresses that gap by analyzing vertical structural metrics in forests with differing densities and distributions of Brazil nut trees across multiple spatial scales. By linking LiDAR-derived canopy features to the abundance and vertical position of Brazil nut trees, we provide new insights into how this species shapes forest structure and how such interactions vary between dense ombrophile forests and transitional savannah systems. This cross-scale, species-focused approach distinguishes our work from previous LiDAR studies in the Amazon and underlines its ecological and methodological novelty.
These analyses of the forest canopy can be used in studies of ecological processes and ecosystem services. The height of dominant trees and the biomass of a stand can be used, for example, to describe site quality [35]. Additionally, the profile of the vertical stratification of a tropical forest and the evaluation of structural attributes such as clearings or gaps can be associated with species composition and richness [36], carbon stocks and species coexistence [37], biomass growth and production [22,38], and forest biodiversity [34].
In this context, we acquired LiDAR data from forest stands with Brazil nut trees, on the local scale (two neighboring areas with different typologies) and on the regional scale (four geographically distant areas), to test the hypothesis that forest canopy attributes can be related to the abundance of Brazil nut trees, depending of the scale of data collection and analysis. Sites spread through several states that are part of the Brazilian Amazon were sampled to test if these different forest stands with Brazil nut trees possess a similar pattern of vertical structure, even when in geographically distant areas.

2. Materials and Methods

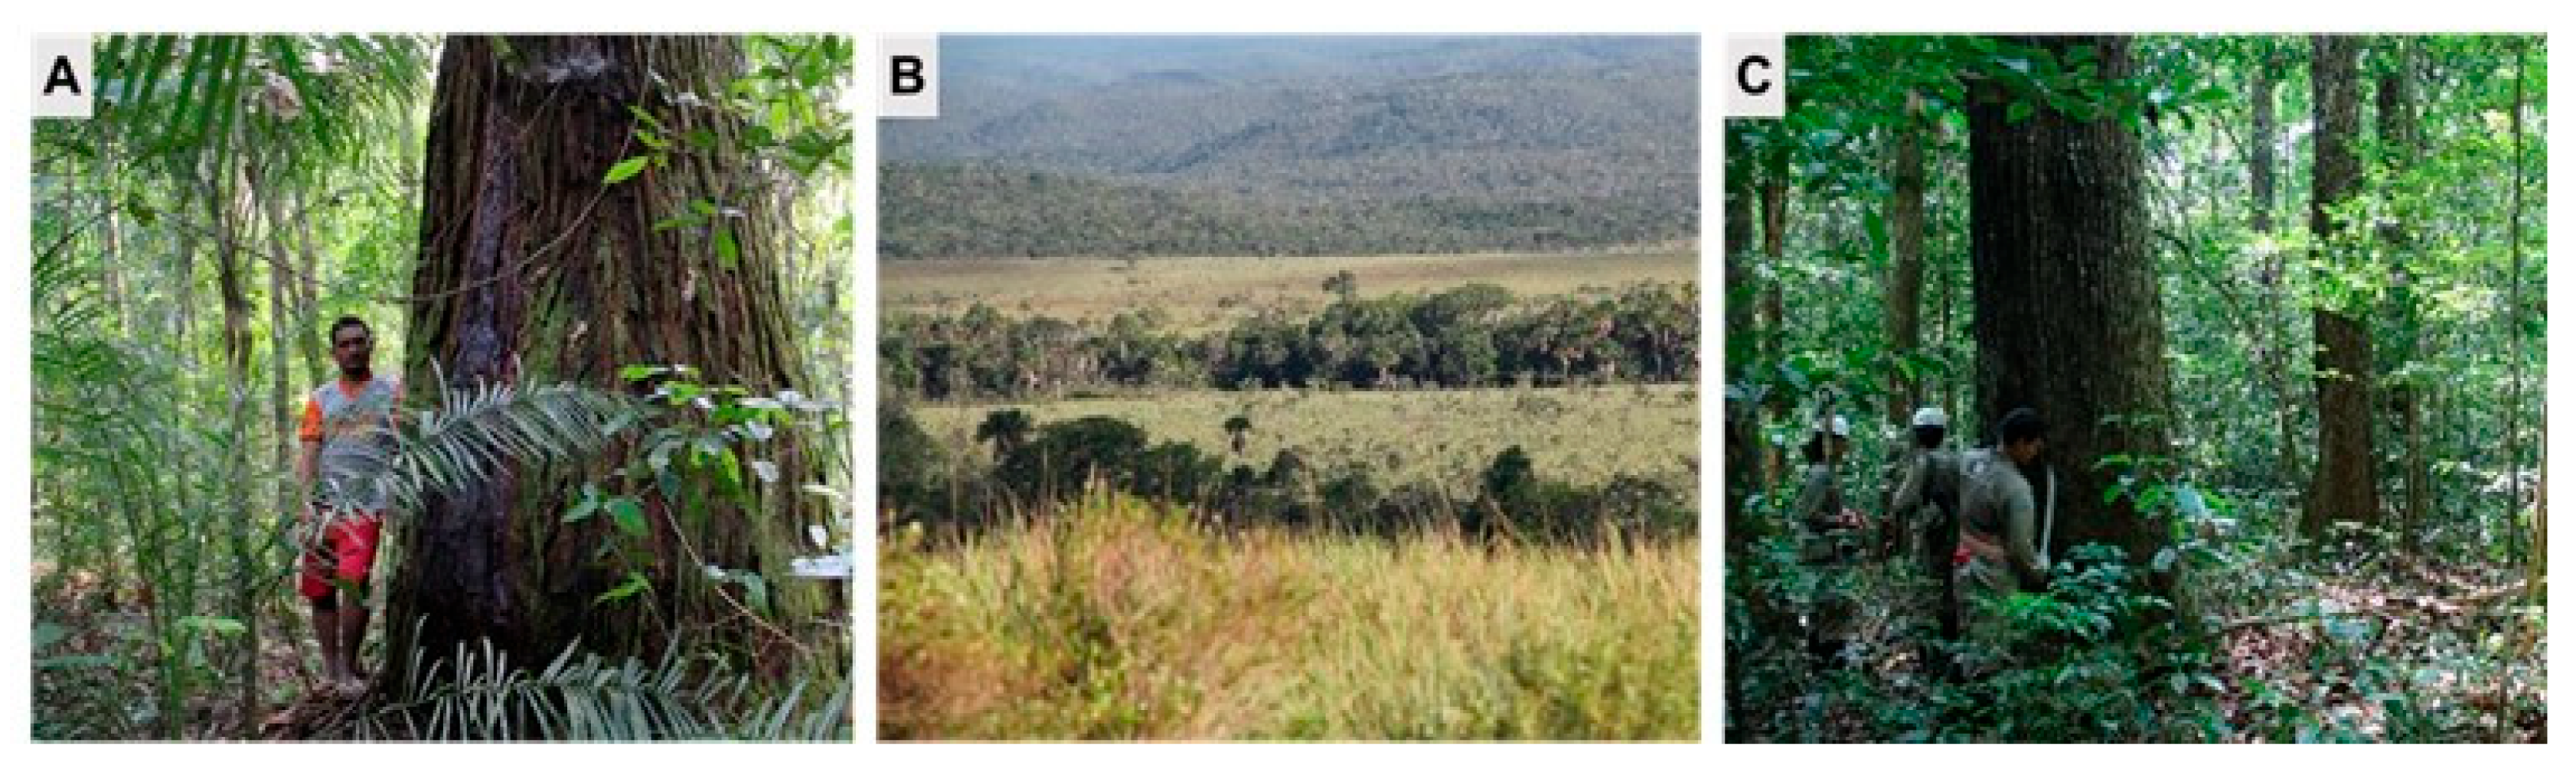
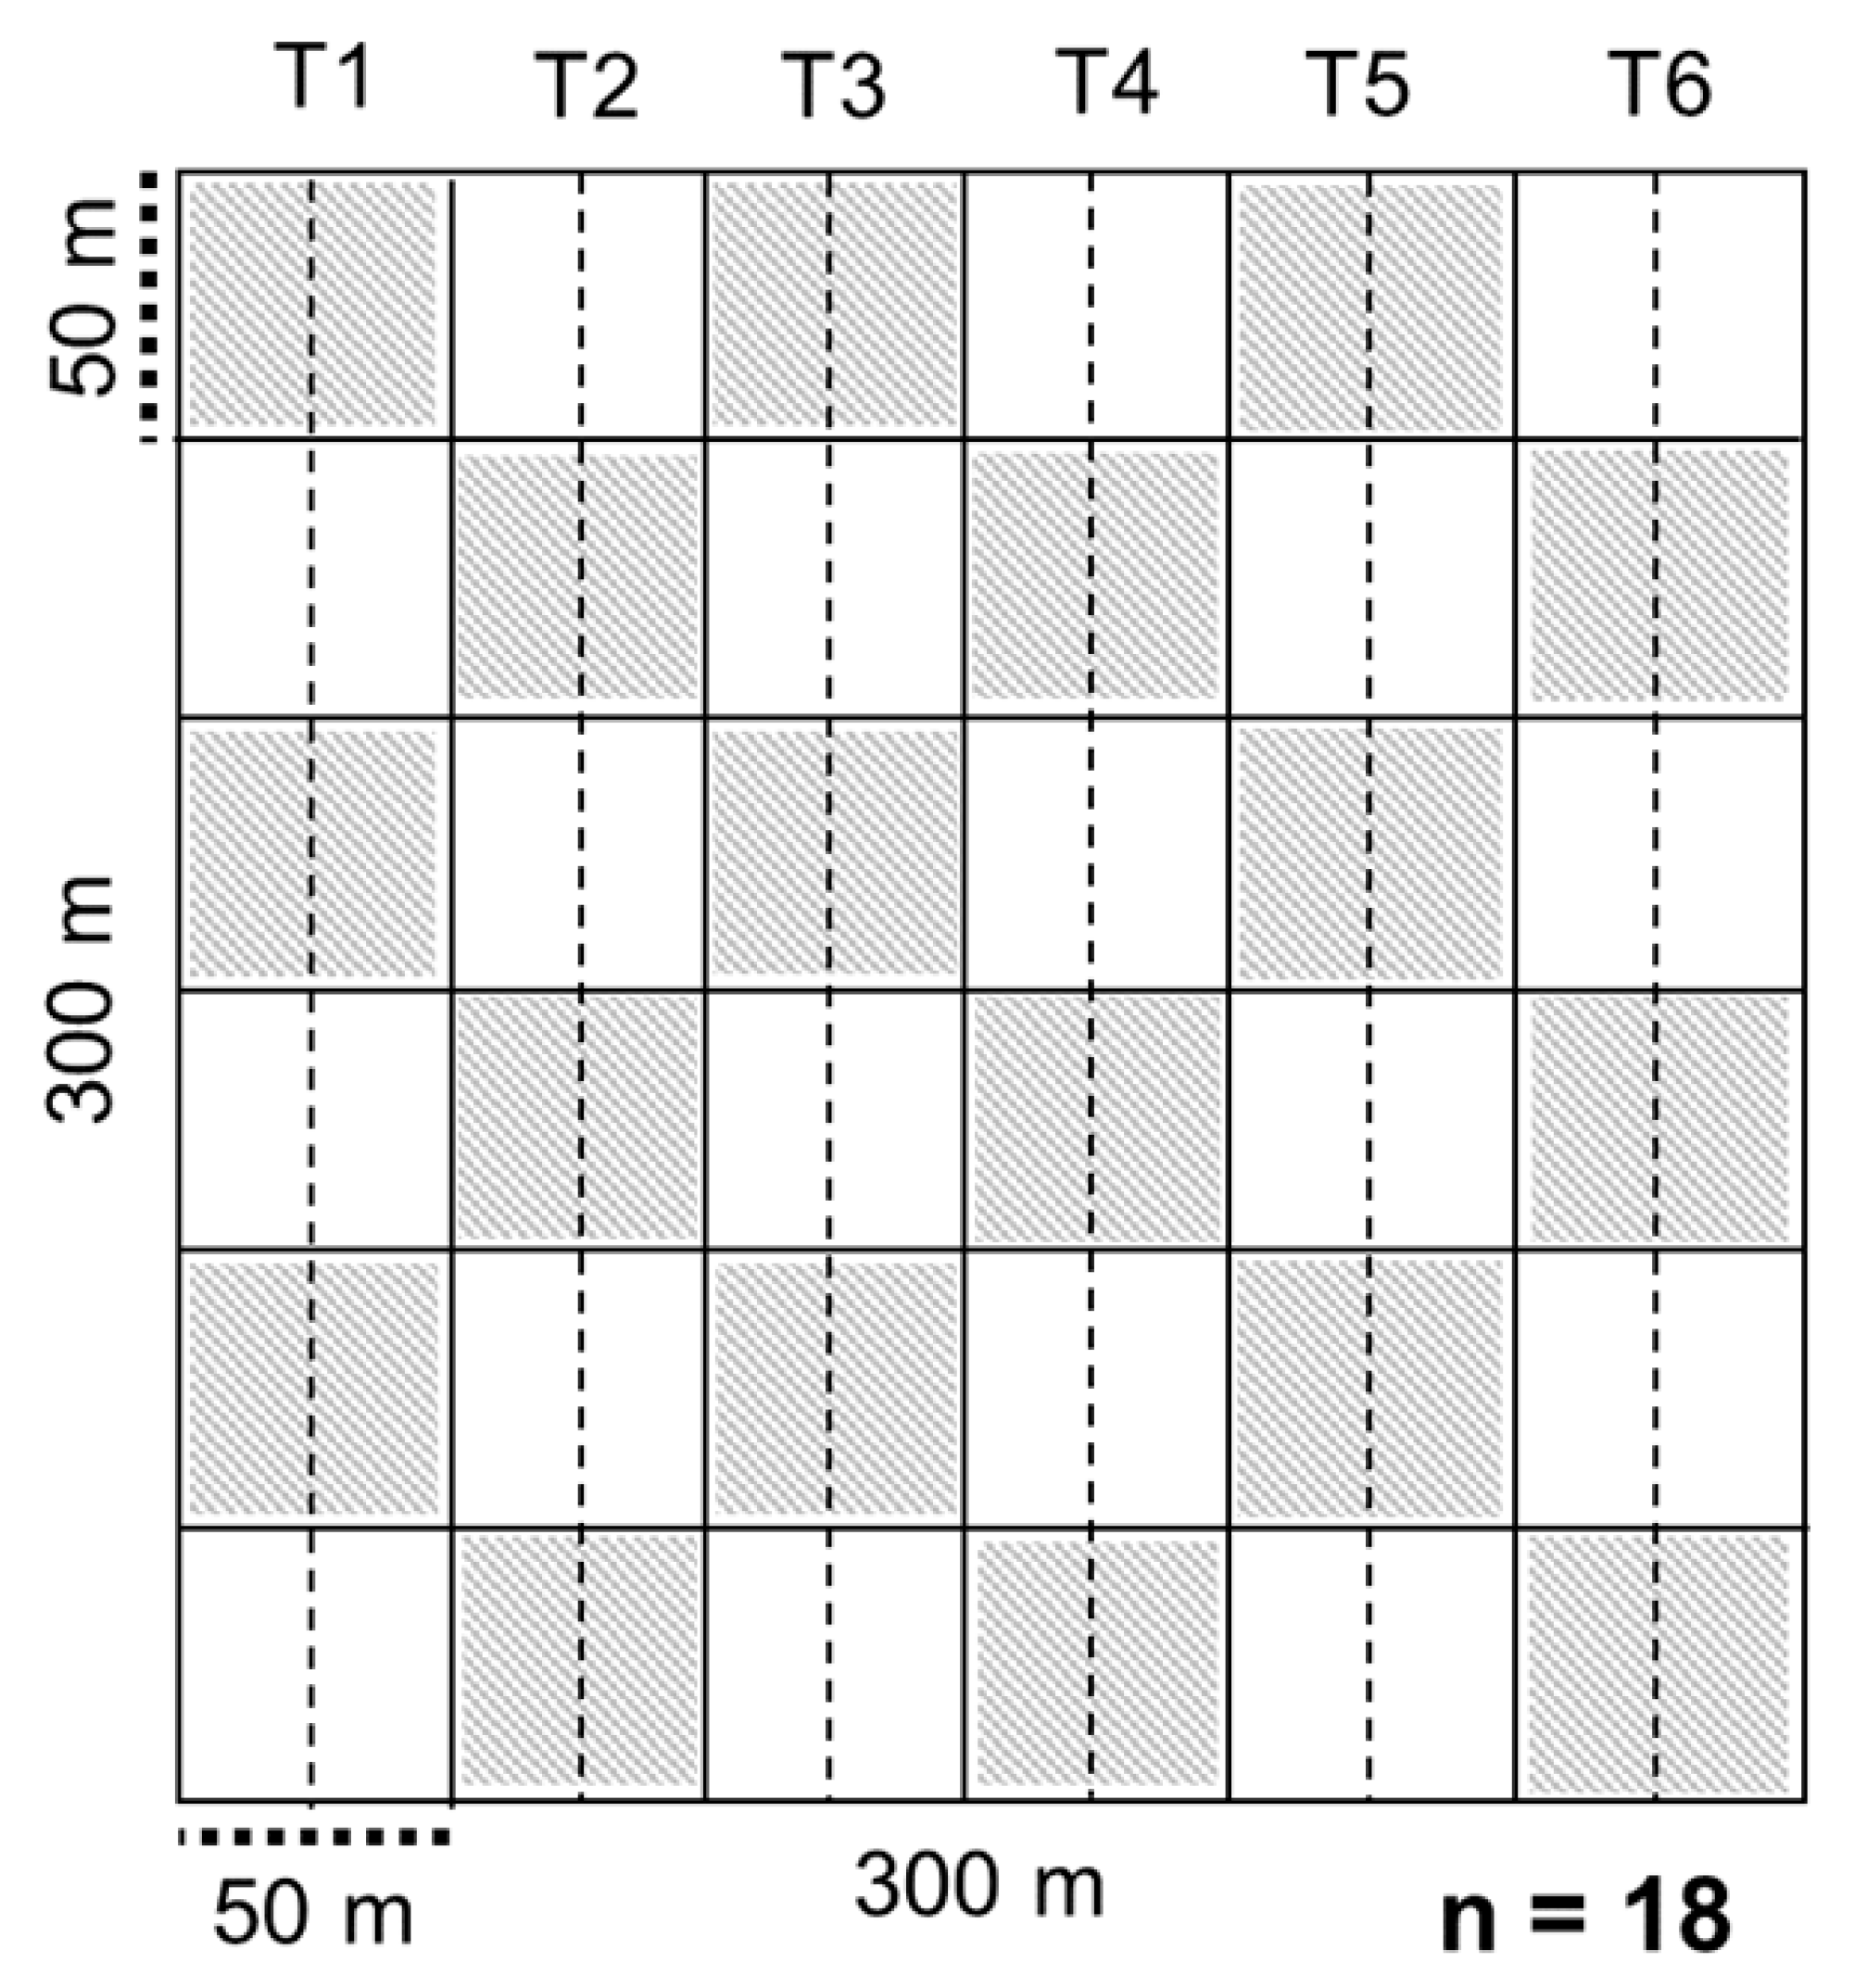
2.1. Study Area and Sampling Design

This study was conducted in forests with Brazil nut trees at two different scales: (1) regional scale, incorporating forest sites in four states of the Brazilian Legal Amazon, one site at each; (2) local scale, in the Rio Cajari Extrativist Reserve (RESEX Cajari), in the southern portion of the state of Amapá, containing two sites with different forest typologies (Figure 1).
At the regional scale, three dense ombrophilous forests and one seasonal forest [39] were sampled on soils classified as Ultisols and dystrophic Oxisols [40], with a tropical climate [41]. At the local scale in the state of Amapá, the study site was a forest island located in an area of Savannah/Forest transition. The detailed description of the study sites is located in Appendix A (Table A1), as well as illustrative pictures of the Savannah/Forest transition site (Figure A1).
At each forest site, a 9 ha area (300 m × 300 m) was sampled, in accordance with the method defined in [42], as part of the standardization of the data collection methods established in the Kamukaia research network. In each area, 18 subplots were created (50 m × 50 m), interspersed every 50 m, as a function of the research objectives (Figure 2).

2.2. Data Collection in the Field

A LiDAR Rangefinder (model LD90-3100VHS-LP-Riegl USA, Inc., Orlando, FL, USA) with a portable terrestrial platform was used for canopy data collection. For more information about the project and method, see [24]. The path with the LiDAR was walked in the middle of the transect from one end and then back to the other using a constant velocity (0.3 m s−1). Every 50 m, the LiDAR operator stopped to save the data collected (Appendix E, Figure A3).
The heights of individual Brazil nut trees in each plot were measured by walking with the LiDAR in 8 radii of 15 m, measured from the trunk of each Brazil nut tree. For the survey of the abundance of Brazil nut stems, an inventory was conducted in 100% of the 9 ha area of each plot in all sites. All Brazil nut stems were identified, tagged, and mapped within the 50 m × 50 m subplots.

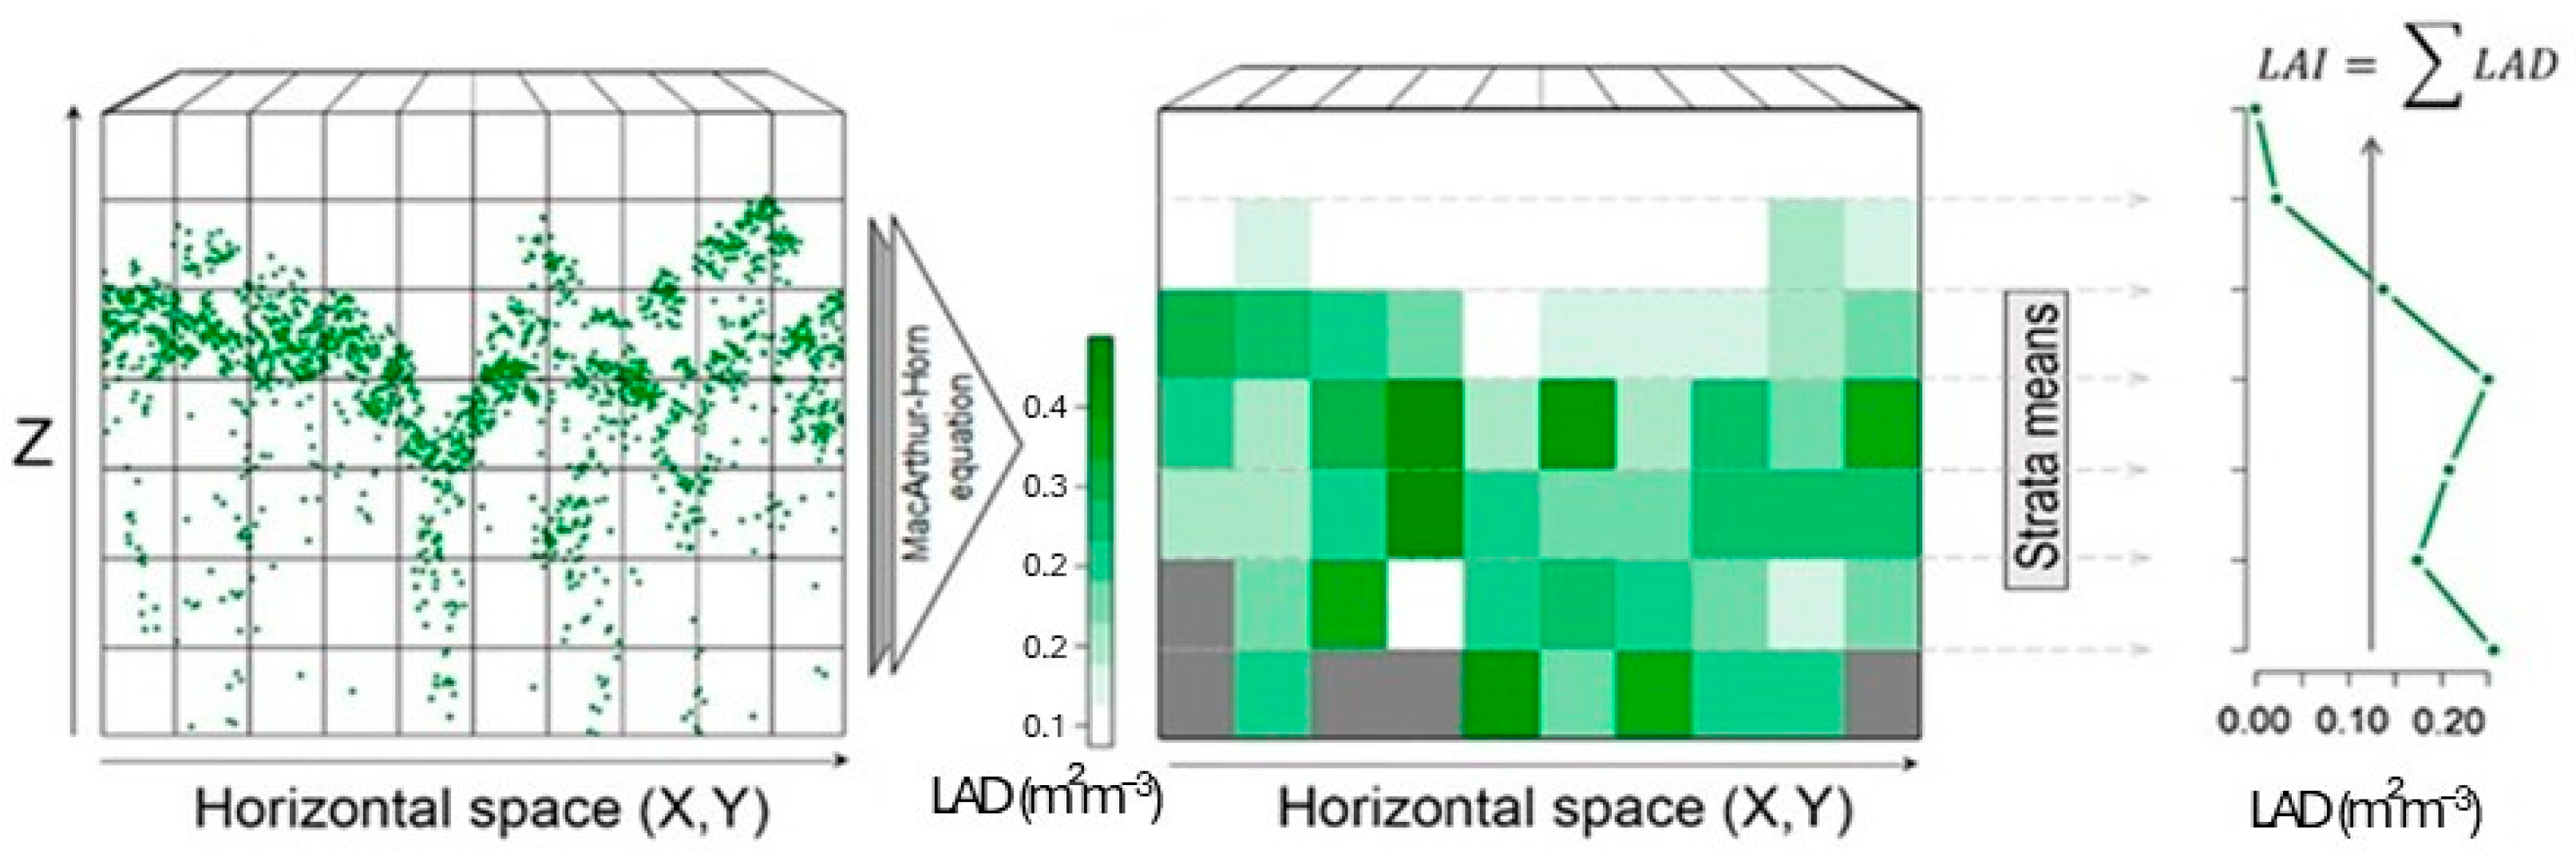
2.3. Lidar Metrics for the Analysis of the Vertical Structure of the Forest

Leaf Area Density (LAD) is derived from the values obtained along a vertical plane in the transect, generating a three-dimensional field of leaf density (Appendix F, Figure A4). An equation was used to calculate LAD [43], according to Equation (1).
LADi,j = ln (pulses.in/pulses.out) × ∆h
where
  • LAD Brazil nut is the leaf area density of a “voxel” of 1 m in height × 2 m in length;
  • i: “voxel” in the vertical plane: 1–2 m, 2–3 m, 3–4 m, etc.;
  • j: “voxel” in the horizontal plane, in intervals of 0–2 m, 2–4 m, 4–6 m, etc.;
  • pulses.in: number of pulses that entered each voxel;
  • pulses.out: number of pulses that passed through that voxel; and
  • ∆h: height of the voxel (∆h = 1 m).
  • Leaf Area Index (LAI): the calculation of LAI was conducted using an equation that sums all the LADs from a pile of voxels in a specific height interval (Equation (2) and Figure A2).
LAI j = Ni i   = 1 LAD i , j
where
  • LAIj: leaf area index of the linear stretch j of the transect;
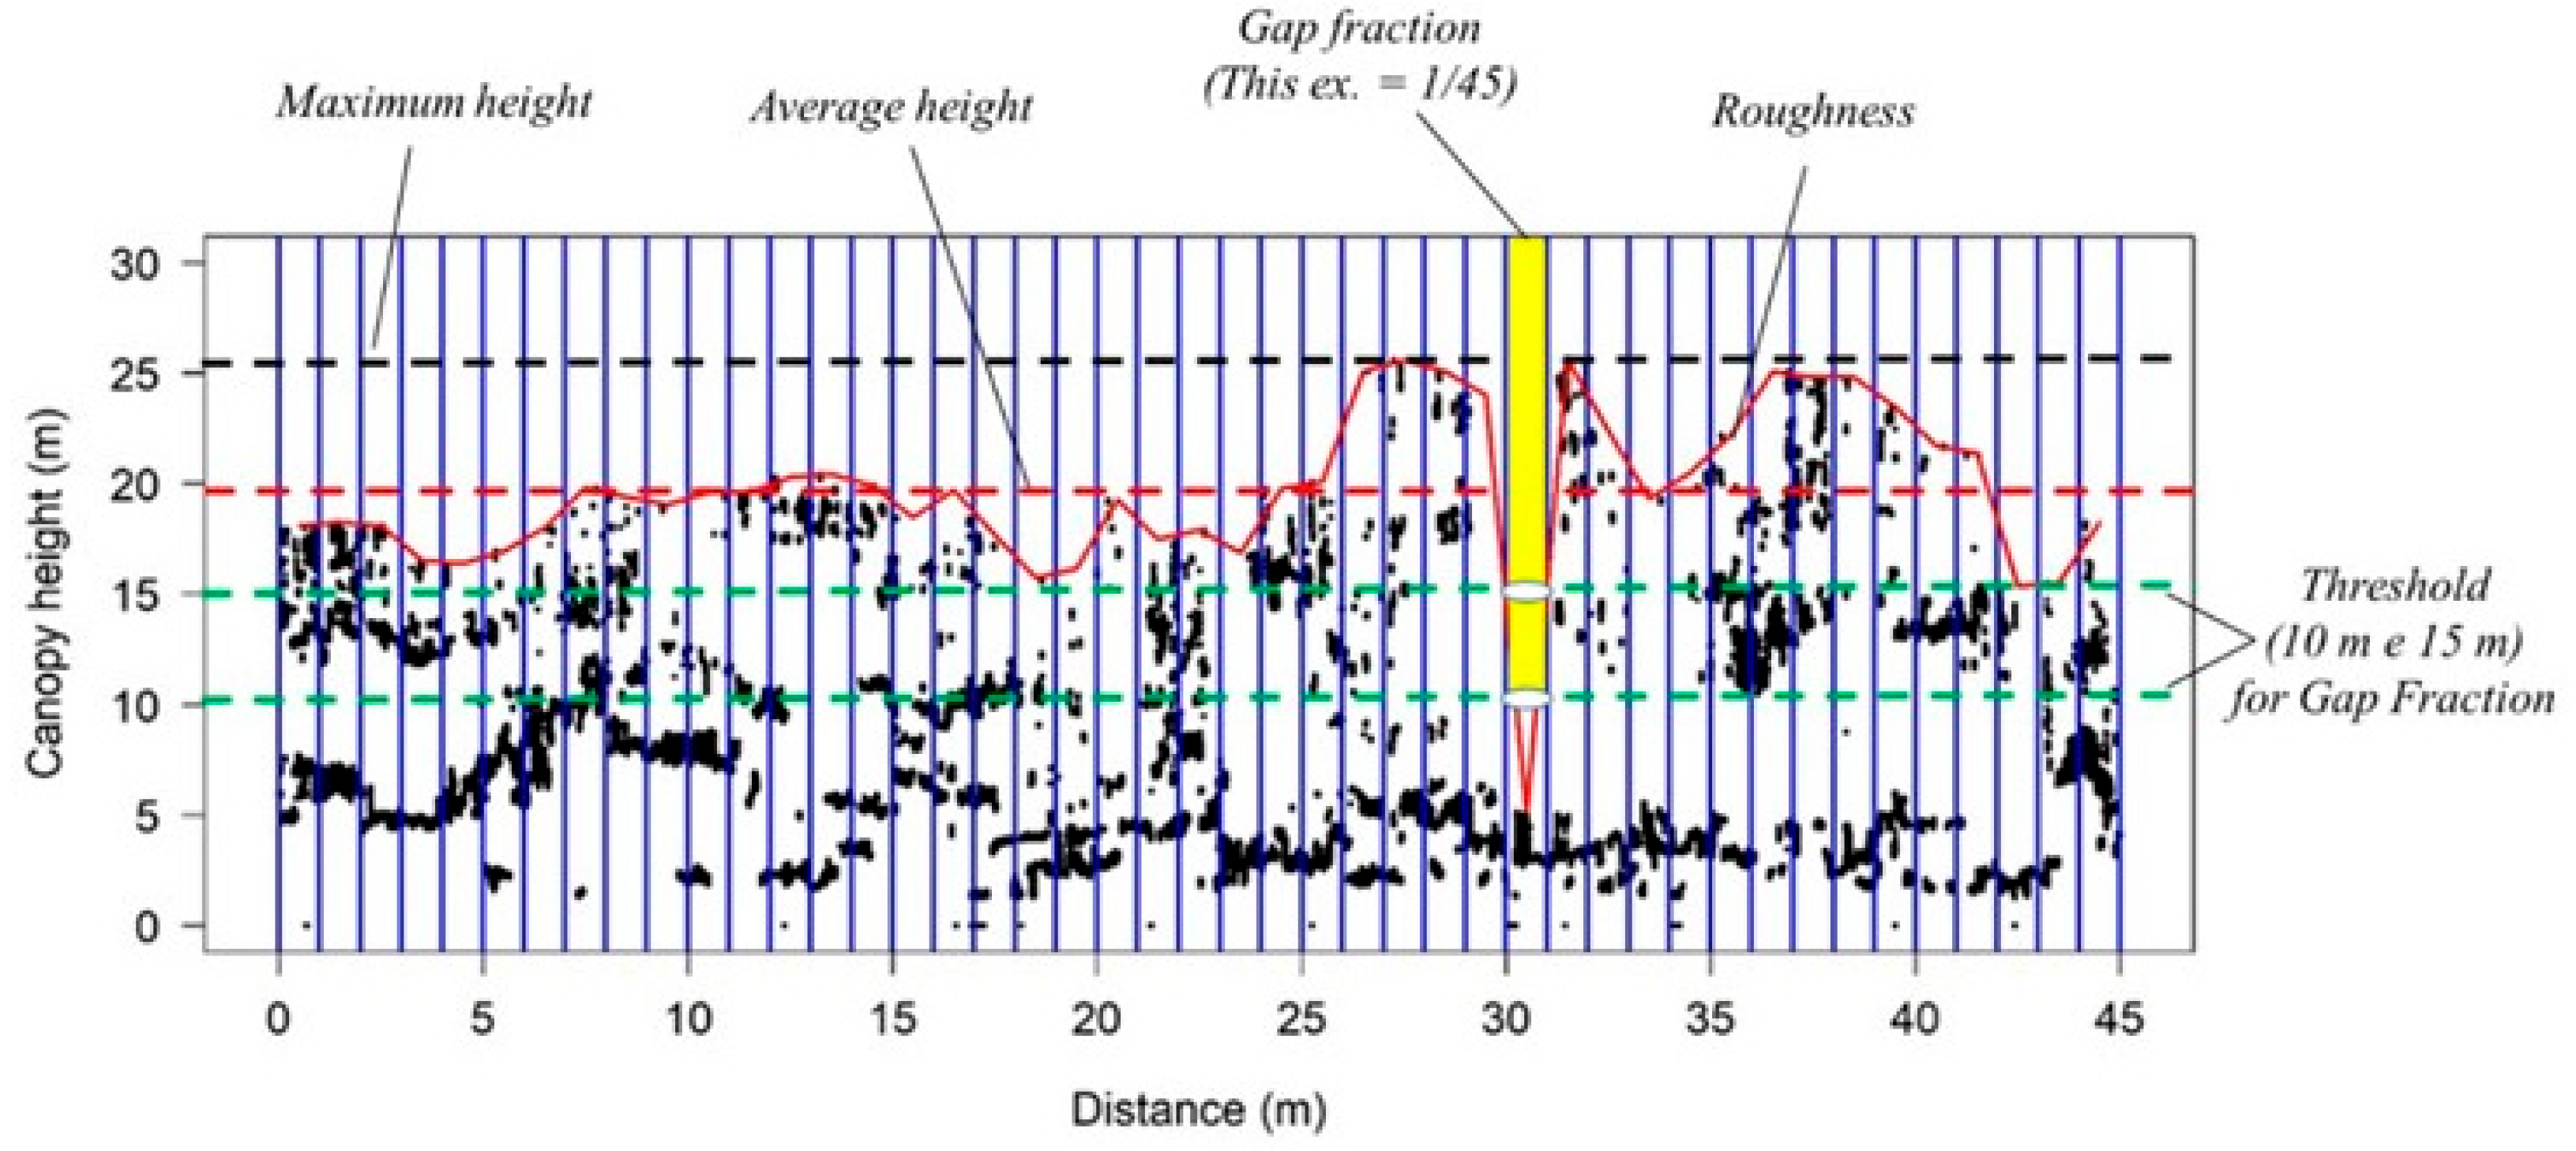
  • Canopy Rugosity (R): standard deviation of maximum heights measured at 1 m horizontal resolution;
  • Maximum height (Hmax): highest value found in the interval of 50 m, considering variations at each meter along the axis of the LiDAR path;
  • Average height (Havg): average value of the highest points, considering variations at each meter in the interval of 50 m;
  • Fraction of clearings (F): opening of the canopy at a specific height (10 m or 15 m), which is calculated using the proportion of columns of 1 m in width along the x-axis, without information about the vegetation starting from the threshold of height, as defined by the total number of columns in the sampled interval (Appendix C, Table A3).
The LAIs were generated for different intervals of height classes in order to represent the profile of vertical stratification of the forest according to the classification adapted [38]. Five height classes were analyzed along the profile: I—understory (1–7 m); II—inferior (8–18 m); III—intermediate (19–26 m); IV—superior (27–35 m); and V—emergents (>35 m). Indices were calculated for each height class (LAI I, LAI II, LAI III, LAI IV, LAI V), for the sum of the upper canopy and emergent (LAI IV + V), and the general LAI for all strata.
The selection of LiDAR-derived metrics such as Leaf Area Index (LAI), Leaf Area Density (LAD), and maximum canopy height (Hmax) was based on their relevance for characterizing vertical forest structure and their ecological relationships with the presence and abundance of emergent tree species such as Bertholletia excelsa. These structural attributes are particularly important in Amazonian forests, where vertical heterogeneity plays a crucial role in determining species composition, resource availability, and competition dynamics.
LAI represents the total leaf area per unit of ground surface and is a key parameter in assessing forest productivity, light interception, and evapotranspiration. Since B. excelsa typically emerges above the main canopy and has a distinctive crown architecture, variations in LAI may indicate forest strata where its crown occupies space or where light conditions favor its establishment and growth. LAD provides insight into the vertical distribution of foliage within the canopy, allowing for finer-scale identification of stratification patterns that may be associated with forest types where B. excelsa is more abundant.
Maximum canopy height (Hmax) is a widely used metric in forest structural studies and serves as a proxy for both forest age and successional stage. In the context of Brazil nut populations, taller canopy structures may signal mature forest conditions, which are typically associated with the presence of old-growth individuals of B. excelsa. Moreover, emergent individuals contribute directly to local increases in Hmax, making this metric particularly useful in detecting areas where Brazil nut trees are present or dominant.
Together, these metrics provide a robust set of structural indicators that support the identification of habitat conditions favorable to B. excelsa, as well as the differentiation of forest typologies in which the species tends to occur with higher abundance. Their selection was therefore guided not only by their availability from TLS data but also by their ecological interpretability in the context of Amazonian forest dynamics and species-specific requirements.

2.4. Data Analysis and Processing

All calculations and analyses were conducted in the software R version 3.4.3 [44]. For the regional scale, the Kruskal–Wallis non-parametric test was used to compare differences between attributes of the vertical profiles of the forests at each sampling site. At the local scale, the Wilcoxon–Mann–Whitney non-parametric test was used to compare the results of the two areas with different typologies. Additionally, the kernel distribution of the probability for heights and the chi-square test were used for the partitions of LAI along the profile.
For the evaluation of the abundance of Brazil nut trees in relation to the LAI, the Spearman correlation was used, and the analyses were conducted for each scale.

3. Results

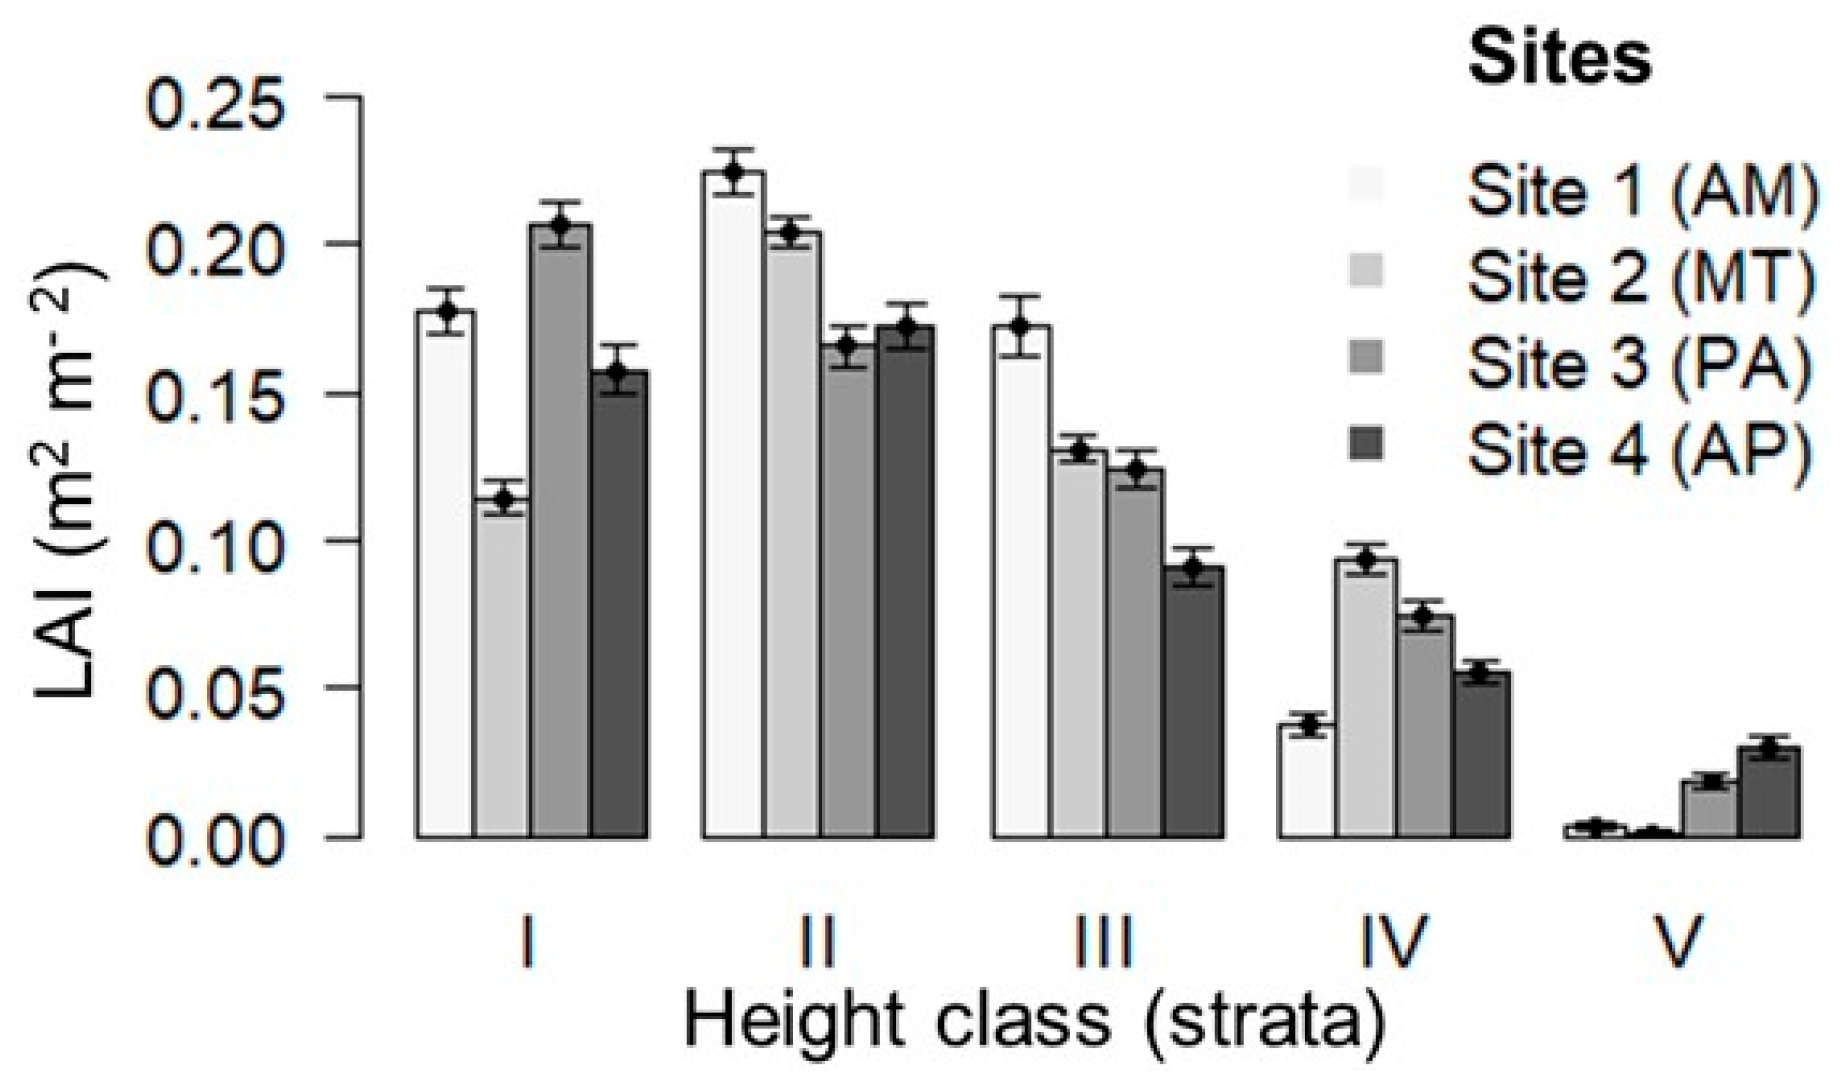
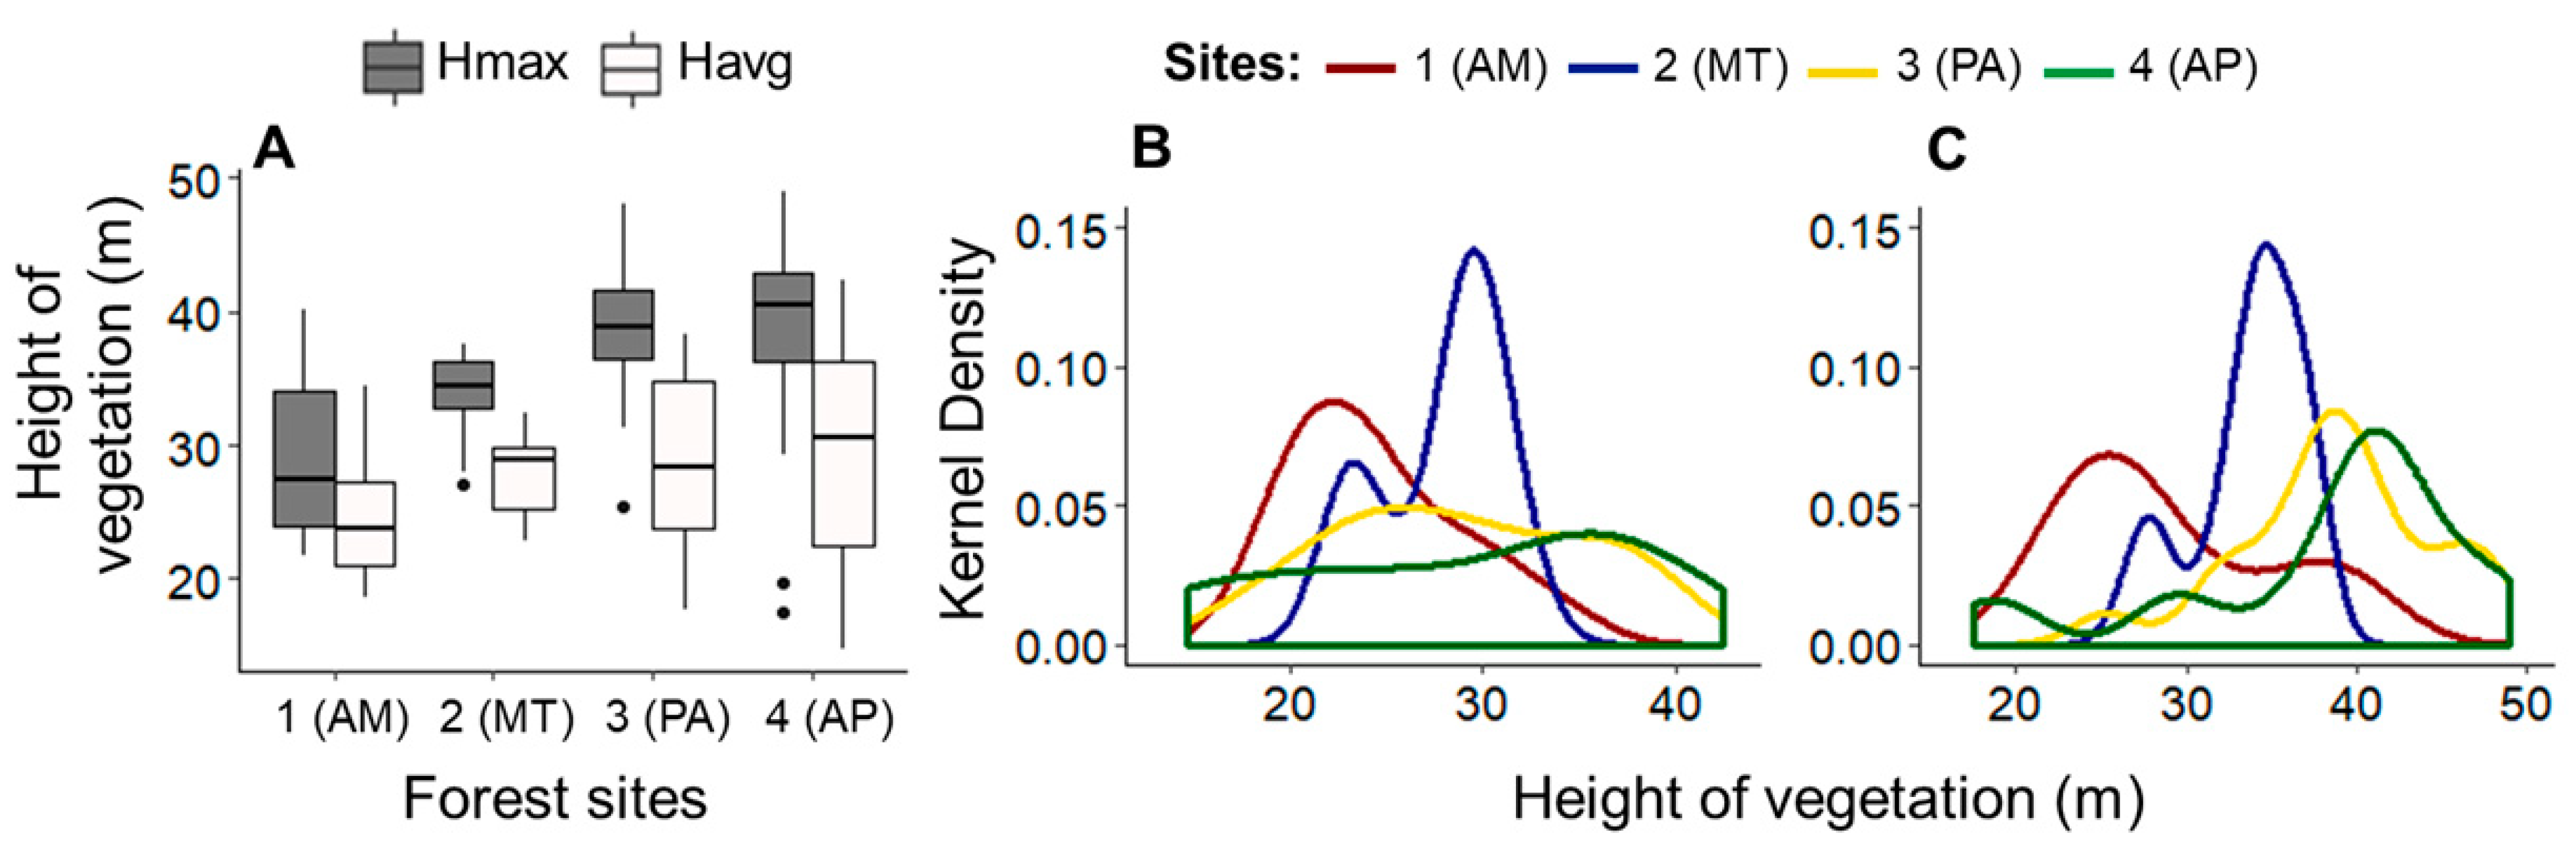
3.1. Vertical Structure of Amazonian Forests with Brazil Nut Trees (Regional Scale)

The forests studied in the Brazilian Amazon have an abundance of Brazil nut trees that is similar in three of the four evaluated forests: in the sites of Amapá, Pará, and Mato Grosso, according to Table 1.
The forest site in Amazonas was the one that presented the least abundance, with a density of 5 ind. ha−1. This site also presented the forest with the lowest height average. The heights of the forest canopies in the northeast region of the Amazon are higher than those in the western region of Amazonas state and in the southeast region of Mato Grosso state (Figure 3A), which is true as well for the comparison of the heights of the Brazil nut stems.
The Kruskal–Wallis test showed a highly significant difference for the heights Hmax, but there was no difference for Havg heights between the forests (Table 2).
The proportion of sky shots is lower in the forest in Pará and higher in the forests in Amapá and Mato Grosso. The roughness of the canopy in the forests in Amazonas and Mato Grosso is less in magnitude, meaning that there is little variation in the height of the upper canopy.
In spite of the differences in the direct comparisons with most of the metrics of LAI between the forests in different sites of the Amazon (Table 2), a pattern was observed for the leaf area density (LAD) in the forests along the vertical profile. In general, in the proportions of each stratum, the accumulated leaf density was similar between the forests in the different sites. LAI II contributes to this pattern, since it was not statistically different, and the cumulative LAI shows that the majority of the vegetation is always concentrated in the inferior strata (Figure 4).
Combining the first and second strata, the LAD was ≥50% of LAI in all forests, demonstrating that there is a pattern of accumulation of leaf area and density in the inferior strata in forests with Brazil nut trees in the different sites. Even in forests with different densities of Brazil nut stems, there is a predominance of leaves of understory vegetation and of dominated trees, in comparison with the other three strata above 18 m. The second stratum (8–18 m) was the one that presented a larger proportion of leaf density in all forests.
The chi-square test for partition showed that, for the proportion that leaf density in each stratum represents of total LAI, only the density in the V stratum of the forest in Amapá was statistically different from the remainder (χ2 = 10.1337, p = 0.0015). At the Amapá site, this stratum (>35 m in height) represented 8.4% of the LAI of the vertical profile, well above the values from the sites from other states.

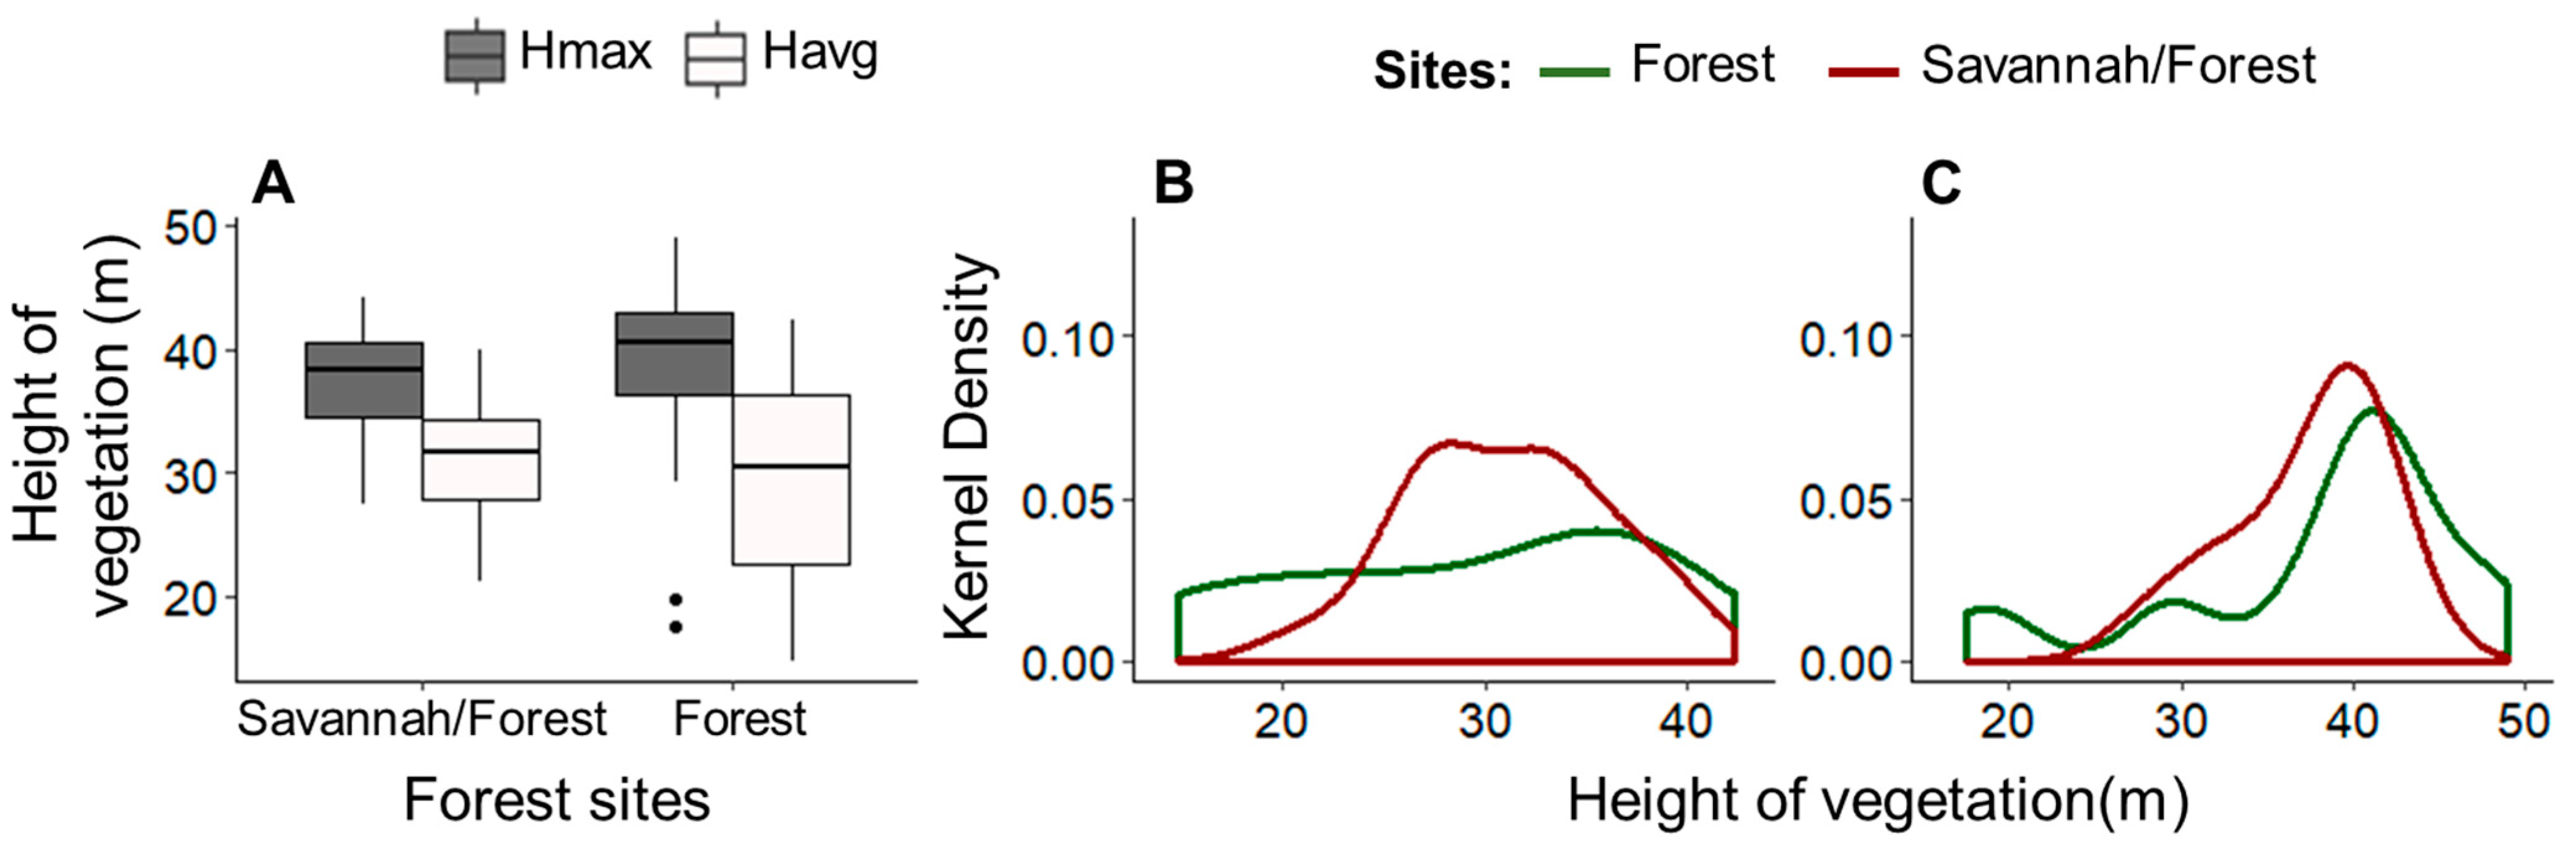
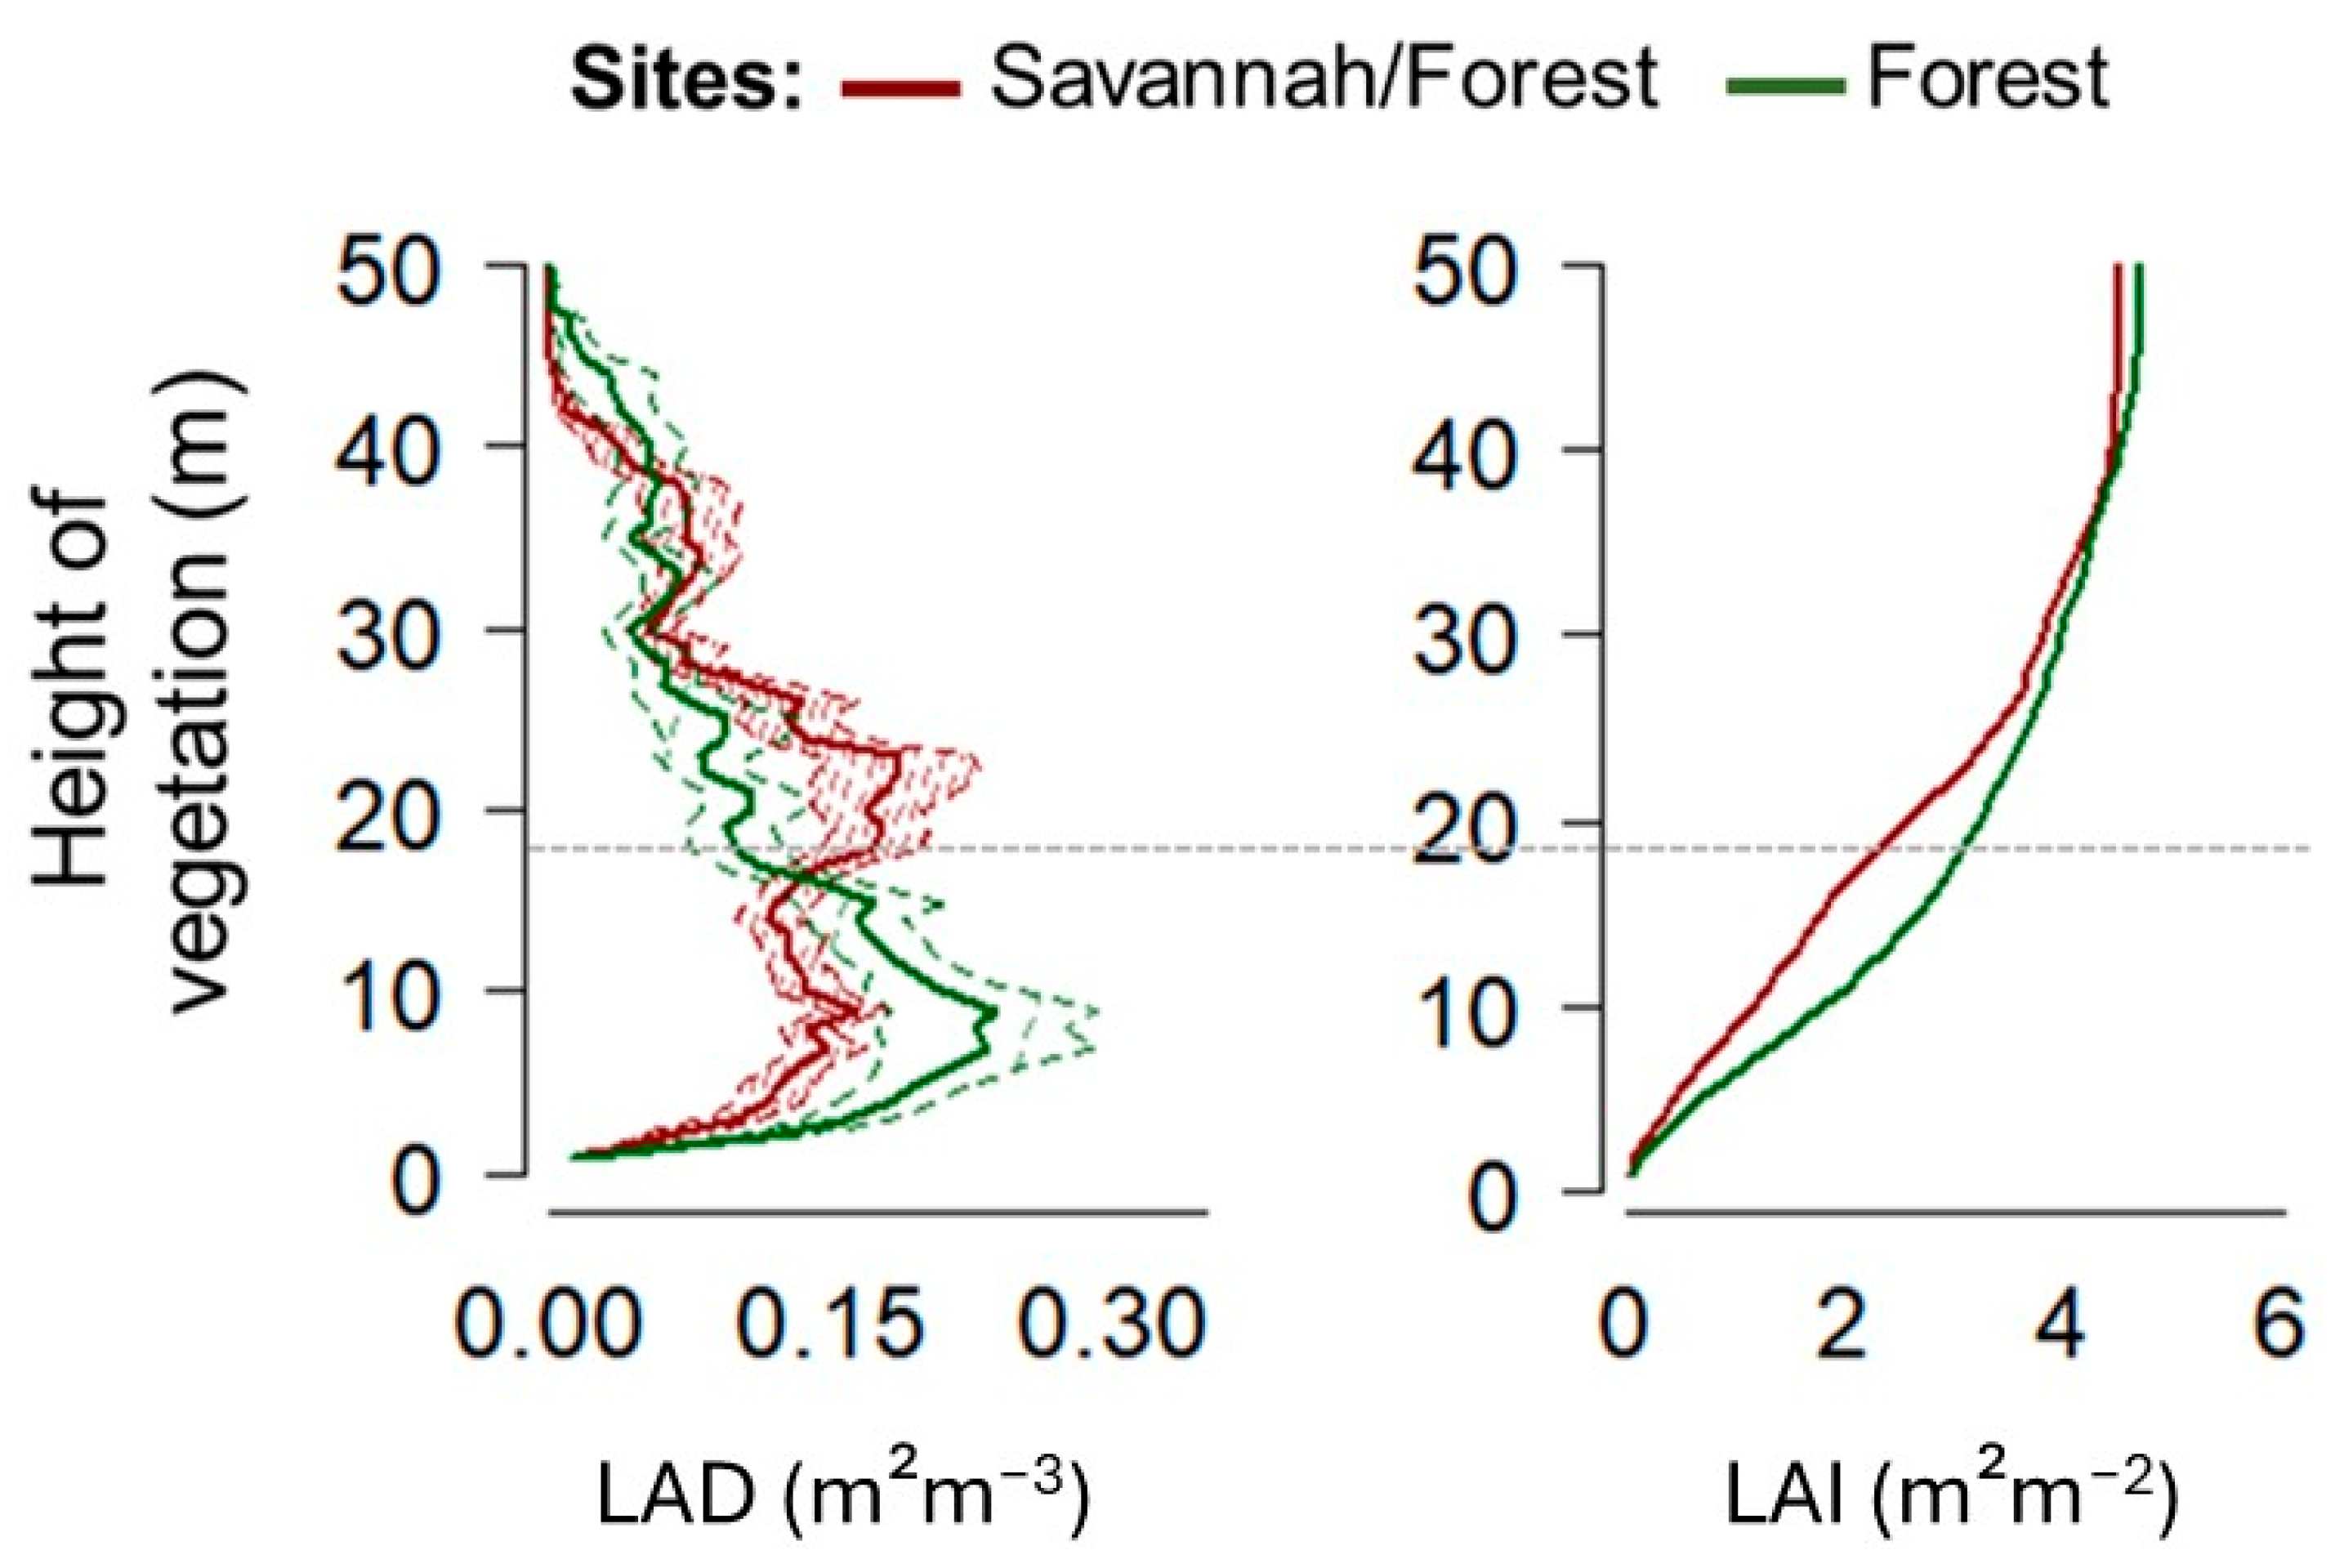
3.2. The Structure of the Canopy in Different Forest Typologies in Sites in the State of Amapá (Local Scale)

The typology transition Savannah/Forest presented an abundance of Brazil nut stems that was superior to the dense forest typology, with 149 stems and a density of 17 ind.ha−1 (Table 3).
There were no significant differences between the maximum (W = 200, p = 0.238) and average (W = 148, p = 0.673) heights of the forest canopies between the two typologies (Appendix C, Table A3; Figure 5A). The density distributions for the average and maximum heights of the vegetation of the Savannah/Forest transition have a lower amplitude, but these were not different from the dense forest typology (Figure 5B,C).
The forest site has greater canopy roughness (R = 7.5 × 5.0 in transition Savannah/Forest; W = 252, p = 0.004) and a larger proportion of gaps (F15 m = 0.15, F10 m = 0.05 × 0.01, 0.00, respectively in transition Savannah/Forest; W = 232, 227; p = 0.012, 0.007), while there is no difference in the quantity of sky shots between sites (Appendix C, Table A3).
The significant differences for leaf area index between the inferior stratum (LAI I: W = 239, p = 0.014; LAI II: W = 231, p = 0.029) and intermediate stratum (LAI III: W = 85, p = 0.014) of the two typologies were confirmed by the analysis of the distribution of foliar density along the vertical profile (Appendix C, Table A3). The two typologies have different LAD structures along the profile, principally in the intermediate and inferior strata near 26 m in height (Figure 6).
In the intermediate stratum, LAI III (W = 85, p = 0.014), the Savannah/Forest transition site has a LAI that is significantly greater than that of the forest (Appendix C, Table A3). The height classes (strata) clearly demonstrate the differences in LAI between the typologies in the different strata, showing a greater LAI for the transition between heights varying from 19 to 35 m (Figure 7). In the superior stratum IV (W = 120, p = 0.189) and emergent V (W = 173, p = 0.725), the differences were not significant.

3.3. Relationship Between Abundance of Brazil Nut Trees and Leaf Area Index in Different Height Strata

In general, for forests with Brazil nut trees located in the four sites in the Amazon, the abundance of this species was more significantly associated with the understory canopy stratum I (rho = −0.25, p = 0.03) and the uppermost strata IV + V (rho = 0.33, p = 0.004 (Figure 8). Figure 8 shows the relationships of LAI and Brazil nut trees with all forest sites.
With respect to the different typologies in the state of Amapá, there was a significant relationship with the abundance of Brazil nut trees with LAI in the dense forest in the uppermost strata IV + V (rho = 0.50, p = 0.03) and emergent stratum V (rho = 0.57, p = 0.01). In the Savannah/Forest transition, there was a significant relationship with intermediate strata III (rho = −0.75, p< 0.01), IV (rho = 0.50, p< 0.04), V (rho = 0.57, p< 0.01), and IV+ V (rho = −0.57, p< 0.01) (Figure 9).
The intermediate stratum of the savannah area showed, besides a significant correlation, a strong negative correlation with the abundance of Brazil nut trees, meaning that as the quantity of Brazil nut trees increases, LAI in this stratum decreases.

4. Discussion

Tropical forests with Brazil nut trees that were evaluated in different sites in the Brazilian Amazon and that were similar with respect to typology, soils, and climate, in general presented differences in the metrics derived from terrestrial LiDAR for variables such as maximum height and roughness of the canopy. A study using PCL reported similar results from the central Amazon [21]. However, these differences were not observed for the fraction of gaps in [33].
The forest sites located in northeastern Amazonia have a larger stature, and this is demonstrated by the maximum average height of approximately 40 m. Additionally, these forests have the tallest Brazil nut stems, reaching heights above 50 m. Studies carried out with airborne LiDAR reported results similar to the current study, in which forests in the northeastern Amazon are taller than those in the central and south regions of the Amazon [27,28].
The forest in the state of Amazonas had the lowest stature, with values for maximum height near 30 m (Figure 3B,C). This forest also presented the lowest value for canopy roughness and an elevated LAI, demonstrating that it is a dense forest with a homogenous and uniform canopy. These results are corroborated by [33], which also found a dominant maximum height in a forest in Amazonas of around 30 m and in a forest in Pará of around 40 m.
In spite of the fact that Amazonia is generally characterized by large-statured forests with a large biomass per hectare, this study demonstrates that there are variations in forest structure across regions. These differences between forests in different sites can be associated with species diversity and dominance, abundance, anthropogenic pressure, age of vegetation, and competition. The variation of abiotic factors in the Amazon was modeled, relating them to the density and diversity of trees, and it was shown that these forest attributes, as well as precipitation, are higher in the central-west region of the Amazon [29], and this region also has a greater amount of biomass per hectare [31,32].
These conditions might explain the differences found in this research, since a greater density of trees will necessarily induce greater inter-species competition and a more closed and denser canopy, as observed in the forest in Amazonas. This could also explain the lower abundance of Brazil nut trees, since this species is a heliophyte and depends on large gaps in order to reach the canopy [7].
Although there were significant differences in the direct comparison of the metrics, a pattern in the vertical distribution of vegetation was identified in the forests in all four sites, wherein there was always a greater concentration of LAD and LAI in the inferior strata (Figure 4 and Figure 5). This pattern showed that there was a greater concentration of leaves up to 18 m in the strata of the understory and dominated trees; similar results in Amazon forests were shown by [22,23]. Therefore, the majority of LAI in the inferior strata of these forests cannot be related to Brazil nut trees, since the canopy of these trees is almost always well above 18 m in height. In spite of the variation in the density of Brazil nut stems in the different study sites, there was always a larger leaf density for stems in the understory and the inferior strata. This could be a result of the reduced solar radiation that these trees receive in the understory, which forces them to develop mechanisms that serve to increase photosynthetic capacity, such as increasing the quantity, size, and position of leaves [12,45,46].
The structural variation observed among forest sites with Brazil nut trees in the Brazilian Amazon aligns with findings from other tropical regions where forest canopy traits vary according to environmental gradients and disturbance history. For instance, studies in Central Africa and Southeast Asia have shown that maximum canopy height and vertical heterogeneity are closely tied to precipitation, soil fertility, and logging intensity, which in turn affect species composition and light regimes (e.g., [47,48]). In the Amazon, our observation that forests in the eastern region (e.g., Pará and Amapá) exhibit greater canopy heights and roughness parallels similar findings in Guyana and French Guiana, where terra firme forests on better-drained soils sustain taller trees and a higher LAI in the upper strata, often dominated by long-lived emergent species.
Furthermore, the distinctive structure of the savanna–forest transition in Amapá mirrors transitional ecotones in other tropical regions, such as the Miombo woodlands in southern Africa, where species like Brachystegia form monospecific stands that influence canopy stratification [49]. The strong influence of Bertholletia excelsa on upper canopy LAI and vertical structure in this transition zone suggests a comparable dynamic, where one dominant species shapes the structural profile. These parallels underscore the importance of considering not only spatial scale but also ecological function and disturbance legacy in interpreting forest structure across tropical biomes.
Considering that the amount of light entering the forest is a determining factor for the regeneration and development of this species [7,11,12], the interaction between LAI and the abundance of Brazil nuts trees, considering all forest sites on a regional scale, showed a negative correlation with the understory stratum and a positive correlation with the upper strata IV + V. Thus, as the abundance of Brazil nuts increases, the LAI in the upper strata also tends to increase, since the crowns of the Brazil nuts increase the number of leaves in the upper canopy. In the lower strata, the opposite occurs: the amount of Brazil nuts decreases as the LAI increases, since the increase in leaf area in the upper canopy hinders the entry of light into the forest, and consequently, the species will have more difficulty developing.
The areas evaluated at a local scale with different forest typologies presented similar patterns of maximum and average heights, around 38 m and 30 m, respectively (Appendix C, Table A3). The fact that these two areas are statistically equal with respect to the upper canopy structure could be related to the quantity of Brazil nut trees in the area of transition, since there is a greater abundance of this species at this site. Consequently, the increase in LAI in the upper and emergent strata would compensate for the low probability for height distribution in the sub-forest and lower strata of the Savannah/Forest transition site.
Although there were no differences between the heights and LAI in the superior strata, the distribution of the leaf density along the vertical profile showed differences between the sites. The typology of the Savannah/Forest transition has most of its vegetation in the intermediate strata, different than in the dense forest, where the leaf area is concentrated in the inferior strata. This supports the hypothesis that the two areas have very different vertical profiles of canopy structure. In the transition area, there is a peak of accumulation of leaf density near 20 m in height that is probably due to the dominated stems in this stratum (Figure 6). This is confirmed by the larger averages of LAI in the III and IV strata (19–35 m) in the Savannah/Forest transition (Figure 7), which also reflects the greater abundance of Brazil nut trees, with an average height of about 30 m.
The canopy of the forest that is in the transition area Savannah/Forest is less rough and is more homogeneous, which may be due to the effect that a great abundance of Brazil nut trees would have in shaping a more uniform canopy height. The Brazil nut tree is one of the few large-sized species of tree that has been able to establish itself and have great abundance in areas of the transition Savannah/Forest, an environment wherein Brazil nut trees generally present a diameter distribution that has only a small amount of variation, thus indicating that these stems might have originated as a consequence of a single disturbance event that occurred in the past [50].
In the evaluation of the relationship between the abundance of the Brazil nut tree and the LAI in the different strata in the areas with different typologies (local scale), there was correlation between the forest vegetation and the V and IV + V strata. Additionally, in the transition area, there was a highly significant correlation with the III, IV, V, and IV + V strata. This indicates that the vertical structure of the upper canopy of these ecosystems is more dependent on the Brazil nut trees, especially in the transition ecosystem, since in the dense forest there are also other large trees.
The stronger relationship of Brazil nut trees with the vertical structure of the forest in the savannah transition area leads to a hypothesis that the forest island in the middle of the savannah was formed through the initial establishment of Brazil nut trees within the savannah vegetation. It is therefore suggested that, in order to test this hypothesis, more specific studies be conducted on the vegetation composition and tree ages in such areas.
The differences observed between regional and local scales underscore the importance of considering scale-dependent ecological processes when interpreting forest structure in Amazonian landscapes. At the regional level, broader climatic gradients, edaphic variability, and historical biogeography appear to be dominant drivers shaping the distribution and structural roles of Bertholletia excelsa [51,52]. These macroecological factors influence forest height, roughness, and species assemblages across the Amazon Basin. In contrast, local-scale patterns are more likely governed by site-specific conditions such as recent disturbance regimes, land use history, and fine-scale topographic variation, which can modulate the tree recruitment, light competition, and stratified leaf area distribution within a relatively homogeneous typological framework [53,54].
Analyzing potential driving mechanisms behind these scale disparities requires a multiscalar framework that incorporates both ecological and anthropogenic factors. For instance, the strong vertical stratification observed in transitional forests may reflect legacy effects of historical land use or selective extraction, leading to synchronous recruitment events and simplified vertical profiles [53,55]. Conversely, dense terra firme forests, despite exhibiting similar canopy heights at the local scale, maintain higher species diversity and vertical heterogeneity, possibly due to longer periods of structural continuity and undisturbed succession [52]. Such differences illustrate that emergent species like B. excelsa may exert varying structural influences depending on the ecological context, highlighting the necessity of integrating LiDAR-based structural assessments with historical, floristic, and functional trait data across scales [54,56].

5. Conclusions

In conclusion, forests with Brazil nut trees, spread across four sites in the Brazilian Amazon, present a pattern of a greater concentration of the distribution of leaf density in the inferior strata along the vertical profile of the canopy. However, the heights of these forests are different between the study sites, with the forests in sites of the Eastern Amazon having taller Brazil nut trees, and also trees of other species from the forest matrix, into which this species is inserted.
Despite the robustness of the terrestrial LiDAR approach and the clarity of the observed patterns, this study presents certain limitations. The comparison between regional and local scales relied on uneven sampling frameworks—entire states versus two adjacent sites—which may have influenced interpretations of scale-dependent effects. Furthermore, the analysis did not incorporate other potentially explanatory variables, such as soil properties, disturbance history, or floristic composition, all of which could provide deeper insights into structural variation. Future research should aim to expand the number of local sampling sites, particularly across a broader range of forest typologies and ecotonal gradients, and incorporate multi-temporal data to better capture forest dynamics. Integrating LiDAR measurements with species composition, functional traits, and environmental data would significantly enhance ecological interpretations of canopy structure and Brazil nut distribution.
The stronger relationship of Brazil nut trees with the vertical structure of the forest in the savannah transition area leads to a hypothesis that the forest island in the middle of the savannah was formed through the initial establishment of Brazil nut trees within the savannah vegetation. It is therefore suggested that, in order to test this hypothesis, more specific studies be conducted on the vegetation composition and tree ages in such areas.

Author Contributions

Conceptualization, D.R.A.d.A.; Methodology, R.C.d.O.J., D.R.A.d.A., D.M.R., H.T. and M.C.G.; Software, D.R.A.d.A., D.M.R., H.T. and M.C.G.; Validation, M.C.G.; Formal analysis, M.C.G.; Investigation, F.F.C., R.C.d.O.J., K.E.d.S. and M.C.G.; Resources, R.C.d.O.J., H.T. and M.C.G.; Data curation, R.C.d.O.J.; Writing – original draft, F.F.C.; Writing – review & editing, F.F.C., R.C.d.O.J., D.R.A.d.A., D.M.R., K.E.d.S., H.T., T.P.B., D.B.d.S. and M.C.G.; Project administration, M.C.G.; Funding acquisition, R.C.d.O.J., K.E.d.S. and M.C.G. All authors have read and agreed to the published version of the manuscript.

Funding

The authors thank the Brazilian Research Council (CNPq Conselho Nacional de Desenvolvimento Científico e Tecnológico) for the scholarship for the lead author, and also the Brazilian Agricultural Research Company (Empresa Brasileira de Pesquisa Agropecuária (EMBRAPA) for MAPCAST (02.13.05.001.03) project funding. D. Almeida was supported by the São Paulo Research Foundation (FAPESP) grant #2016/05219-9. The CNPq funded the project Dendrocronologia e dendroclimatologia aplicadas ao estudo da ecologia histórica da Amazônia e da castanheira (CNPq/MCTI/FNDCT 18/2021, processo 422905/2021-6).

Institutional Review Board Statement

Not applicable.

Informed Consent Statement

Not applicable.

Data Availability Statement

The original contributions presented in the study are included in the article; further inquiries can be directed to the corresponding author.

Conflicts of Interest

The authors declare no conflict of interest.

Appendix A

Table A1. Detailed description of climate, soil, vegetation, and geographical coordinates of the study sites.
Forest SitesClimateSoilVegetationLatitude (S)Longitude (W)
AMAfPVAdDbe3°38′3.6″64°18′37.8″
MTAmLVdFse11°5′55.1″55°2′12.5″
PAAfLAdDbe3°3′18,6″54°55′41.9″
APAmPVAdDse0°33′50.1″52°18′23.8″
AP*AmLAdSpf0°25′15.5″51°57′50.1″
AM = Amazonas, MT = Mato Grosso, PA = Pará, AP = Amapá, AP* = Amapá (transition Savannah/Forest site). Climate: Am = tropical monsoon climate with two well-defined seasons, Af = humid tropical climate with no dry season [41]. Soil: PVAd = predominance of yellow–red dystrophic Ultisols, LAd = yellow dystrophic Oxisol, LVd = red dystrophic Oxisol [40]. Vegetation: Dse = forest-type dense submontane with an emergent canopy, Dbe = forest-type dense lowland forest with an emergent canopy, Fse = forest seasonal semi-deciduous submontane forest with an emergent canopy, Spf = savannah with a gallery forest [39].
Figure A1. Illustrative pictures of the sites Savannah/Forest transition and dense forest in the south of the state of Amapá. (A) Savannah/Forest transition area (within vegetation), (B) Savannah/Forest transition area (without vegetation), and (C) Dense Forest area (within vegetation). Author: Marcelino Guedes.
Sustainability 17 06049 g0a1

Appendix B

Table A2. Multiple comparisons test, Dunn’s post hoc test, applied to website metrics on a regional scale.
MetricsAM-APAM-MTAP-MTAM-PAAP-PAMT-PA
pp.adpp.adpp.adpp.adpp.adpp.ad
Hmax0.0000.0000.1540.9240.0090.0550.0000.0000.9051.000.0120.077
R0.0000.0000.2351.000.0030.0190.0000.0010.6731.000.0110.068
S (%)0.3151.000.9491.000.3471.000.0060.0330.0000.0000.0050.027
LAI I0.3081.000.0050.0330.0780.4700.1410.8440.0130.0760.0000.000
LAI III0.0030.0150.2551.000.0600.3610.1300.7810.1320.7940.7081.00
LAI IV0.1701.000.0010.0050.0480.2880.0050.0270.1420.8550.6101.00
LAI V0.0010.0060.8471.000.0010.0030.0130.0750.4261.000.0070.043
LAI IV + V0.0020.0120.0030.0200.8861.000.0010.0060.8331.000.7221.00
LAI General0.0510.3060.4541.000.2291.000.2051.000.0010.0080.0440.263

Appendix C

Table A3. Descriptive statistics comparing average (M) and standard deviation (SD) for the metrics of the vertical profile of forests with Brazil nut stems, obtained with the terrestrial LiDAR in different forest typologies in the south of the state of Amapá.
MetricsForest Sites (M ± SD)Test Wilcoxon–Mann–Whitney
ForestSavannah/ForestWp-Value
Hmax38.1 ± 8.7737.4 ± 4.552000.239
Hmed28.9 ± 9.0331.2 ± 4.961480.673
R7.54 ± 2.545.08 ± 1.662520.004
S (%)3.71 ± 5.393.15 ± 1.911200.192
F (10m)0.05 ± 0.080.00 ± 0.012270.007
F (15m)0.15 ± 0.200.01 ± 0.032320.012
LAI I1.10 ± 0.570.69 ± 0.282390.014
LAI II1.90 ± 0.571.51 ± 0.292310.029
LAI III0.73 ± 0.611.29 ± 0.69850.014
LAI IV0.49 ± 0.390.65 ± 0.401200.189
LAI V0.44 ± 0.500.31 ± 0.341730.725
LAI IV + V0.94 ± 0.690.92 ± 0.631990.248
LAI General4.65 ± 0.684.45 ± 0.412110.126
Hmax = maximum height; Havg = average height; R = roughness; S = sky shots; F = fraction of clearings; LAI = leaf area index; I, II, III, IV, and V = stratum of vegetation height classes.

Appendix D

Figure A2. Leaf area index (LAI) per height classes (strata) in sites with Brazil nut trees in the Brazilian Amazon. Stratum: I (1–7 m), II (8–18 m), III (19–26 m), IV (27–35 m), and V (>35 m).
Sustainability 17 06049 g0a2

Appendix E

Figure A3. Illustration of canopy structure metrics.
Sustainability 17 06049 g0a3

Appendix F

Figure A4. LAD profile and LAI calculation. Gray voxels indicate no data captured (coded as NA voxels). This NA value is important so that occluded forest voxels are not counted as zeros when obtaining the mean LAD of a transect at each height interval above the ground [21].
Sustainability 17 06049 g0a4

References

  1. Thomas, E.; Caicedo, C.A.; Loo, J.; Kindt, R. The distribution of the Brazil nut (Bertholletia excelsa) through time: From range contraction in glacial refugia, over human-mediated expansion, to anthropogenic climate change. Bol. Mus. Para. Emílio Goeldi 2014, 9, 267–291. [Google Scholar]
  2. Mori, S.A.; Prance, G.T. Taxonomy, ecology, and economy botany of Brazil nut (Bertholletia excelsa Humb. & Bonpl.: Lecythidaceae). Adv. Econ. Bot. 1990, 8, 130–150. [Google Scholar]
  3. Haugaasen, J.M.T.; Haugaasen, T.; Peres, C.A.; Gribel, R.; Wegge, P. Fruit Removal and Natural Seed Dispersal of the Brazil Nut Tree (Bertholletia excelsa) in Central Amazonia, Brazil. Biotropica 2011, 44, 205–210. [Google Scholar] [CrossRef]
  4. Duchelle, A.E.; Guariguata, M.R.; Less, G.; Albornoz, M.A.; Chavez, A.; Melo, T. Evaluating the opportunities and limitations to multiple use of Brazil nuts and timber in Western Amazonia. For. Ecol. Manag. 2012, 268, 39–48. [Google Scholar] [CrossRef]
  5. Scoles, R.; Gribel, R. The regeneration of Brazil nut trees in relation to nut harvest intensity in the Trombetas River valley of Northern Amazonia, Brazil. For. Ecol. Manag. 2012, 265, 71–81. [Google Scholar] [CrossRef]
  6. Zuidema, P.A.; Boot, R.G.A. Demography of the Brazil nut tree (Bertholletia excelsa) in the Bolivian Amazon: Impact of seed extraction on recruitment and population dynamics. J. Trop. Ecol. 2002, 18, 1–31. [Google Scholar] [CrossRef]
  7. Myers, G.P.; Newton, A.C.; Melgarejo, O. The influence of canopy gap size on natural regeneration of Brazil nut (Bertholletia excelsa) in Bolivia. For. Ecol. Manag. 2000, 127, 119–128. [Google Scholar] [CrossRef]
  8. Peres, C.A.; Baider, C. Seed dispersal, spatial distribution and population structure of Brazil nut trees (Bertholletia excelsa) in southeastern Amazonia. J. Trop. Ecol. 1997, 13, 595–616. [Google Scholar] [CrossRef]
  9. Conab. Proposta de Preços Mínimos (safra 2015/16); Conab: Brasília, Distrito Federal, Brazil, 2015; Volume 2, pp. 1–159. [Google Scholar]
  10. Angelo, H.; De Almeida, A.N.; Calderon, R.A.; Pompermayer, R.S.; De Souza, A.N. Determinantes do preço da castanha-do-brasil (Bertholletia excelsa) no mercado interno brasileiro. Sci. For. 2013, 41, 195–203. [Google Scholar]
  11. Engelbrecht, B.M.J.; Herz, H.M. Evaluation of different methods to estimate understory light conditions in Tropical Forests. J. Trop. Ecol. 2001, 17, 207–224. [Google Scholar] [CrossRef]
  12. Jardim, F.C.S.; Serrão, D.R.; Nemer, T.C. Efeito de diferentes tamanhos de clareiras sobre o crescimento e a mortalidade de espécies arbóreas em Moju-PA. Acta Amaz. 2007, 37, 36–48. [Google Scholar] [CrossRef]
  13. Scoles, R.; Gribel, R. Population structure of Brazil nut (Bertholletia excelsa, Lecythidaceae) stands in two areas with different occupation histories in the Brazilian Amazon. Hum. Ecol. 2011, 39, 455–464. [Google Scholar] [CrossRef]
  14. Scoles, R.; Klein, G.N.; Gribel, R. Crescimento e sobrevivência de castanheira (Bertholletia excelsa Bonpl., Lecythidaceae) plantada em diferentes condições de luminosidade após seis anos de plantio na região do rio Trombetas, Oriximiná, Pará. Bol. Do Mus. Para. Emílio Goeldi. Ciências Nat. 2014, 9, 321–336. [Google Scholar] [CrossRef]
  15. Kainer, K.A.; Duryea, M.L.; Costa de Macedo, N.; Williams, K. Brazil nut seedling establishment and autoecology in an extractive reserve in Acre, Brazil. Ecol. Appl. 1998, 8, 397–410. [Google Scholar] [CrossRef]
  16. Salomão, R.P.; Rosa, N.A.; Castilho, A.; Morais, K.A.C. Castanheira-do-brasil recuperando áreas degradadas e provendo alimento e renda para comunidades da Amazônia Setentrional. Bol. Do Mus. Para. Emílio Goeldi 2006, 1, 65–78. [Google Scholar] [CrossRef]
  17. Salomão, R.P. Densidade, estrutura e distribuição espacial de castanheira-do-brasil (Bertholletia excelsa H. & B.) em dois platôs de floresta ombrófila densa na Amazônia setentrional brasileira. Bol. Do Mus. Para. Emílio Goeldi 2009, 4, 11–25. [Google Scholar]
  18. Wilson, J.W. Analysis of the spatial distribution of foliage by two-dimensional point quadrats. New Phytol. 1958, 59, 92–101. [Google Scholar] [CrossRef]
  19. Aber, J.D. A method for estimating foliage-height profiles in broad-leaved forests. J. Ecol. 1979, 67, 35–40. [Google Scholar] [CrossRef]
  20. Lefsky, M.A.; Cohen, W.B.; Parker, G.G.; Harding, D.K. Lidar Remote Sensing for Ecosystem Studies. BioScience 2002, 52, 19–30. [Google Scholar] [CrossRef]
  21. Almeida, D.R.A.; Nelson, B.W.; Schietti, J.; Gorgens, E.B.; Resende, A.F.; Stark, S.C.; Valbuena, R. Contrasting fire damage and fire susceptibility between seasonally flooded forest and upland forest in the Central Amazon using portable profiling LiDAR. Remote Sens. Environ. 2016, 184, 153–160. [Google Scholar] [CrossRef]
  22. Stark, S.C.; Leitold, V.; Wu, J.; Hunter, M.O.; De Castilho, C.V.; Carolina, V.; Costa, F.R.C.; Mcmahon, S.M.; Parker, G.G.; ShimaBukuro, M.T.; et al. Amazon forest carbon dynamics predicted by profiles of canopy leaf area and light environment. Ecol. Lett. 2012, 15, 1406–1414. [Google Scholar] [CrossRef] [PubMed]
  23. Stark, S.C.; Enquist, B.J.; Saleska, S.R.; Leitold, V.; Schietti, J.; Longo, M.; Alves, L.F.; Camargo, P.B.; De Oliveira, R.C. Linking canopy leaf area and light environments with tree size distributions to explain Amazon forest demography. Ecol. Lett. 2015, 18, 636–645. [Google Scholar] [CrossRef] [PubMed]
  24. Parker, G.G.; Harding, D.J.; Berger, M.L. A portable LIDAR system for rapid determination of forest canopy structure. J. Appl. Ecol. 2004, 41, 755–767. [Google Scholar] [CrossRef]
  25. Hardiman, B.S.; Bohrer, G.; Gough, C.M.; Vogel, C.S.; Curtis, P.S. The role of canopy structural complexity in wood net primary production of a maturing northern deciduous forest. Ecology 2011, 92, 1818–1827. [Google Scholar] [CrossRef]
  26. Hardiman, B.S.; Gough, C.M.; Halperin, A.; Hofmeister, K.L.; Nave, L.E.; Bohrer, G.; Curtis, P.S. Maintaining high rates of carbon storage in old forests: A mechanism linking canopy structure to forest function. For. Ecol. Manag. 2013, 298, 111–119. [Google Scholar] [CrossRef]
  27. Sawada, Y.; Rempei, S.; Jindo, K.; Endo, T.; Oki, K.; Sawada, H.; Arai, E.; Shimabukuro, Y.E.; Celes, C.H.S.; Campos, M.A.A.; et al. A new 500-m resolution map of canopy height for Amazon forest using spaceborne LiDAR and cloud-free MODIS imagery. Int. J. Appl. Earth Obs. Geoinf. 2015, 43, 92–101. [Google Scholar] [CrossRef]
  28. Simard, M.; Pinto, N.; Fisher, J.B.; Baccini, A. Mapping forest canopy height globally with spaceborne lidar. J. Geophys. Res. Biogeosci. 2011, 116, G04021. [Google Scholar] [CrossRef]
  29. Ter Steege, H.; Pitman, N.; Sabatier, D.; Castellanos, H.; Hout, P.V.D.; Daly, D.C.; Silveira, M.; Phillips, O.; Vasquez, R.; Andel, T.V.; et al. A spatial model of tree α-diversity and -density for the Amazon. Biodivers. Conserv. 2003, 12, 2255–2277. [Google Scholar] [CrossRef]
  30. Vieira, S.; De Camargo, P.B.; Selhorst, D.; Da Silva, R.; Hutyra, L.; Chambers, J.Q.; Brown, I.F.; Higuchi, N.; Dos Santos, J.; Wofsy, S.C.; et al. Forest structure and carbon dynamics in Amazonian tropical rain forest. Oecologia 2004, 140, 468–479. [Google Scholar] [CrossRef]
  31. Malhi, Y.; Wood, D.; Baker, T.R.; Wright, J.; Phillips, O.L.; Cochrane, T.; Meir, P.; Chave, J.; Almeida, S.; Arroyo, L.; et al. The regional variation of aboveground live biomass in old-growth Amazonian forests. Glob. Change Biol. 2006, 12, 1107–1138. [Google Scholar] [CrossRef]
  32. Saatchi, S.S.; Houghton, R.A.; Dos Santos Alvala, R.C.; Soares, J.V.; Yu, Y. Distribution of aboveground live biomass in the Amazon basin. Glob. Change Biol. 2007, 13, 816–837. [Google Scholar] [CrossRef]
  33. Hunter, M.O.; Keller, M.; Morton, D.C.; Cook, B.D.; Lefsky, M.A.; De Oliveira Junior, R.C. Structural dynamics of tropical moist forest gaps. PLoS ONE 2015, 10, e0132144. [Google Scholar] [CrossRef] [PubMed]
  34. Gao, T.; Hedblom, M.; Emilsson, T.; Nielsen, A.B. The role of forest stand structure as biodiversity indicator. For. Ecol. Manag. 2014, 330, 82–93. [Google Scholar] [CrossRef]
  35. Skovsgaard, J.P.; Vanclay, J.K. Forest site productivity: A review of the evolution of dendrometric concepts for even-aged stands. Forestry 2008, 81, 13–31. [Google Scholar] [CrossRef]
  36. Tabarelli, M.; Montovani, W. Clareiras naturais e a riqueza de espécies pioneiras em uma floresta Atlântica montana. Rev. Bras. De Biol. 1999, 59, 251–256. [Google Scholar] [CrossRef]
  37. Kohyama, T. Simulating stationary size distribution of trees in rain forests. Ann. Bot. 1991, 68, 173–180. [Google Scholar] [CrossRef]
  38. Souza, D.R.; Souza, A.L. Estratificação vertical em floresta ombrófila densa de terra firme não explorada, Amazônia oriental. Rev. Árvore 2004, 28, 691–698. [Google Scholar] [CrossRef]
  39. Ibge. Manual Técnico da Vegetação Brasileira, 2nd ed.; Série Manuais Técnicos em Geociências; IBGE: Rio de Janeiro, Brazil, 2012; Volume 1. [Google Scholar]
  40. Ibge. Manual Técnico de Pedologia, 3rd ed.; Série Manuais Técnicos em Geociências; IBGE: Rio de Janeiro, Brazil, 2015; Volume 1. [Google Scholar]
  41. Alvares, C.A.; Stape, J.L.; Sentelhas, P.C.; Gonçalves, J.D.; Sparovek, G. Köppen’s climate classification map for Brazil. Meteorol. Z. 2014, 22, 711–728. [Google Scholar] [CrossRef]
  42. Guedes, M.C.; Tonini, H.; Wadt, L.H.O.; Silva, K.E. Instalação e medição de parcelas permanentes para estudos com produtos florestais não madeireiros. In Produtos Florestais não Madeireiros—Guia Metodológico da Rede Kamukaia; Wadt, L.H.O., Santos, L.M.H., Bentes, M.P.M., Oliveira, V.B.V., Eds.; Embrapa: Brasília, Brazil, 2017; pp. 13–32. [Google Scholar]
  43. Macarthur, R.H.; Horn, J.W. Foliage profiles by vertical measurements. Ecology 1969, 50, 802–804. [Google Scholar] [CrossRef]
  44. R Core Team. R: A Language and Environment for Statistical Computing; R Foundation for Statistical Computing: Vienna, Austria, 2017; Available online: https://www.R-project.org/ (accessed on 5 June 2020).
  45. Smith, M.N.; Stark, S.C.; Taylor, T.C.; Ferreira, M.L.; De Oliveira, E.; Restrepo-Coupe, N.; Chen, S.; Woodcock, T.; Bentes dos Santos, D.; Alves, L.F.; et al. Seasonal and drought-related changes in leaf area profiles depend on height and light environment in an Amazon forest. New Phytol. 2019, 222, 741–757. [Google Scholar] [CrossRef]
  46. Wirth, R.; Weber, B.; Ryel, J.R. Spatial and temporal variability of canopy structure in a tropical moist forest. Acta Oecologica 2001, 22, 235–244. [Google Scholar] [CrossRef]
  47. Fayolle, A.; Doucet, J.L.; Gillet, J.F.; Bourland, N.; Lejeune, P. Tree allometry in Central Africa: Testing the validity of pantropical multi-species allometric equations for estimating biomass and carbon stocks. For. Ecol. Manag. 2012, 274, 119–131. [Google Scholar] [CrossRef]
  48. Slik, J.W.F.; Aiba, S.-I.; Brearley, F.Q.; Cannon, C.H.; Forshed, O.; Kitayama, K.; Nagamasu, H.; Nilus, R.; Payne, J.; Paoli, G.; et al. Environmental correlates of tree biomass, basal area, wood density, and stem density gradients in Bornean tropical forests. Glob. Ecol. Biogeogr. 2010, 19, 50–60. [Google Scholar] [CrossRef]
  49. Ryan, C.M.; Williams, M.; Hill, T.C.; Grace, J. Forests and carbon storage in tropical savannas: A win–win scenario? Carbon Balance Manag. 2011, 6, 6. [Google Scholar] [CrossRef]
  50. Neves, E.S.; Guedes, M.C.; Rodrigues, E.G. Relação da produção de frutos de castanha-da-amazônia (Bertholletia excelsa Bonpl.) com variáveis das próprias castanheiras, em capoeira e floresta da RESEX Cajari. Biota Amaz. 2015, 5, 31–37. [Google Scholar] [CrossRef]
  51. Shepard, G.H., Jr.; Ramirez, H.; Shepard, G.H. Ecological and biogeographical factors shaping Bertholletia excelsa populations in Amazonia. J. Trop. Ecol. 2019, 35, 149–161. [Google Scholar]
  52. Reis, C.R.; Aragão, L.E.O.C.; Silva, C.A.; Coe, M.T. Regional environmental gradients and their role in shaping Amazonian forest structure. Glob. Ecol. Biogeogr. 2018, 27, 1122–1132. [Google Scholar]
  53. Jucker, T.; Bongalov, B.; Burslem, D.F.R.P.; Nilus, R.; Dalponte, M.; Lewis, S.L.; Coomes, D.A. Topography shapes the structure, composition and function of tropical forest landscapes. Ecol. Lett. 2018, 21, 989–1000. [Google Scholar] [CrossRef]
  54. Tourne, D.C.M.; Ballester, M.V.R.; James, P.M.A.; Martorano, L.G.; Guedes, M.C.; Thomas, E. Strategies to optimize modeling habitat suitability of Bertholletia excelsa in the Pan-Amazonia. Ecol. Evol. 2019, 9, 12623–12638. [Google Scholar] [CrossRef]
  55. Laurance, W.F.; Ferreira, L.V.; Rankin-de Merona, J.M.; Laurance, S.G. Biomass collapse in Amazonian forest fragments. Science 1997, 278, 1117–1118. [Google Scholar] [CrossRef]
  56. Reis, C.R.; Jackson, T.D.; Gorgens, E.B.; Dalagnol, R.; Jucker, T.; Nunes, M.H.; Ometto, J.P.; Aragão, L.E.O.C.; Rodriguez, L.C.E.; Coomes, D.A. Forest disturbance and growth processes are reflected in the geographical distribution of large canopy gaps across the Brazilian Amazon. J. Ecol. 2022, 110, 2971–2983. [Google Scholar] [CrossRef]
Figure 1. Location of the study areas. (1) Regional scale: Forest sites with Brazil nut trees distributed in four states of the Brazilian Legal Amazon—Amazonas (AM), Mato Grosso (MT), Pará (PA), and Amapá (AP); (2) Local scale: Forest sites in two different forest typologies in the Extrativist Reserve of the Cajari River (RESEX Cajari).
Sustainability 17 06049 g001
Figure 2. Representation of the sampling units at each study site, for study of canopy structure of vegetation using terrestrial LiDAR and variation in the density of Brazil nut stems. Dashed lines (T1, T2, …T6) = transects sampled with LiDAR; Gray area = sampling units at each study site.
Sustainability 17 06049 g002
Figure 3. Maximum and average heights in forest sites of Amazonas (AM), Mato Grosso (MT), Pará (PA), and Amapá (AP), with occurrence of Brazil nut trees in the Brazilian Amazon. (A) Height data shown in a boxplot; kernel probability distributions for the average heights (B) and maximum heights (C).
Sustainability 17 06049 g003
Figure 4. Leaf area density (LAD) and cumulative leaf area index (LAI) along the vertical profile in forest sites with Brazil nut stems in the Brazilian Amazon. Color lines: continuous = average of LAD at each meter height; dashed = standard error; gray dashed = absolute maximum height of vegetation; gray dotted = height at the threshold of 18 m. Sites: Amazonas (AM), Mato Grosso (MT), Pará (PA), and Amapá (AP).
Sustainability 17 06049 g004
Figure 5. Maximum and average heights in different forest typologies with occurrence of Brazil nut trees in sites in the south of the state of Amapá. Typologies: Dense Forest and Forest transition Savannah/Forest. (A) Boxplot graph of maximum and average heights; (B) Kernel probability distributions of the frequencies of average heights; (C) Kernel probability distributions of the frequencies of maximum heights.
Sustainability 17 06049 g005
Figure 6. Leaf area density (LAD) and cumulative leaf area index (LAI) along the vertical profile of areas in different forest typologies with Brazil nut trees in the south of the state of Amapá. Color lines: continuous = average of LAD at each meter height; Dashed = standard error; Gray dashed = absolute maximum height of vegetation; Gray dotted = height at the threshold of 18 m.
Sustainability 17 06049 g006
Figure 7. Leaf area index (LAI) per height classes (strata) in areas with Brazil nut trees with different forest typologies (dense Forest and Savannah/Forest transition) in the south of the state of Amapá. Stratum: I (1–7 m), II (8–18 m), III (19–26 m), IV (27–35 m), and V (>35 m).
Sustainability 17 06049 g007
Figure 8. Spearman correlation between abundance of Brazil nut trees and LAI in different strata or vegetation height classes (I = 1 to 7 m, II = 8 to 18 m, III 19 to 26 m, IV = 27 to 35 m, and V = >35 m) in forests sites of different states in the Amazon (AM, MT, PA and AP). n = 72, significance probability = * 5%, ** 1%. Negative correlation of Brazil nut tree abundance with the LAI of the lower stratum (I) and positive correlation with the LAI of the upper stratum (IV + V), confirming that where there are more Brazil nut trees the upper canopy is more closed, and the understory is thinner.
Sustainability 17 06049 g008
Figure 9. Spearman correlation between abundance of Brazil nut trees and LAI in different strata or vegetation height classes (I = 1 to 7 m, II = 8 to 18 m, III = 19 to 26 m, IV = 27 to 35 m, and V = >35 m) in two forest typologies in the state of Amapá. n = 36; probability significance of the test: * 5%, ** 1%, and *** <1%. Positive correlation between the abundance of Brazil nut trees and LAI of the upper stratum (IV + V) confirmed for both typologies. The negative correlation was verified only with the intermediate stratum (III) of the Savannah/Forest typology.
Sustainability 17 06049 g009
Table 1. Biometric data for Brazil nut stems and matrix vegetation located in forest sites in four states of the Brazilian Amazon: Amazonas (AM), Mato Grosso (MT), Pará (PA), and Amapá (AP).
Forest SitesBrazil NutMatrix Vegetation
D (ind. ha−1)HavgHmaxHmaxAHavgHmaxHmax A
AM5333649252940
MT11313441283438
PA10---293948
AP12384251293849
D = density of Brazil nut stems per hectare; Havg = total average height (m); Hmax = total maximum height (m); Hmax A = absolute maximum height (m).
Table 2. Descriptive statistics comparing average (M) and standard deviation (SD) for the metrics obtained with the terrestrial lidar for the vertical profile of forests with Brazil nut stems in forest sites of different states of the Brazilian Amazon: Amazonas (AM), Mato Grosso (MT), Pará (PA), and Amapá (AP).
MetricsForest Sites (M ± SD)Test Kruskal–Wallis
1 (AM)2 (MT)3 (PA)4 (AP)Wp-Value
Hmax29.1 ± 6.2033.7 ± 3.1838.8 ± 5.8038.1 ± 8.7723.3<0.01
Havg24.6 ± 4.4627.9 ± 3.1428.8 ± 6.5528.9 ± 9.035.850.120
R3.98 ± 1.794.90 ± 1.397.51 ± 3.457.54 ± 2.5423.9<0.01
S (%)1.82 ± 1.792.51 ± 4.910.64 ± 0.973.71 ± 5.3916.00.001
F (10m)0.01 ± 0.020.00 ± 0.010.06 ± 0.130.05 ± 0.086.560.087
F (15m)0.03 ± 0.050.03 ± 0.040.12 ± 0.180.15 ± 0.203.720.292
LAI I1.16 ± 0.350.80 ± 0.261.42 ± 0.441.10 ± 0.5719.2<0.01
LAI II2.29 ± 0.602.25 ± 0.392.04 ± 0.771.90 ± 0.575.120.163
LAI III1.31 ± 0.571.05 ± 0.311.00 ± 0.440.73 ± 0.619.320.025
LAI IV0.30 ± 0.360.82 ± 0.450.83 ± 0.710.49 ± 0.3913.70.003
LAI V0.04 ± 0.090.01 ± 0.030.30 ± 0.480.44 ± 0.5018.6<0.01
LAI IV + V0.30 ± 0.380.82 ± 0.451.12 ± 1.050.94 ± 0.6914.60.002
LAI General5.11 ± 0.494.94 ± 0.515.58 ± 0.984.65 ± 0.6810.90.012
Hmax = maximum height; Havg = average height; R = roughness; S = sky shots; F = fraction of clearings; LAI = leaf area index; I, II, III, IV, and V = stratum of vegetation height classes.
Table 3. Biometric data for Brazil nut stems and matrix vegetation located in different forest typologies, forest and transition Savannah/Forest, in the south of the state of Amapá.
Forest SitesBrazil Nut Matrix Vegetation
D (ind. ha−1)HavgHmaxHmax AHavgHmaxHmax A
Forest12384251293849
Savannah/Forest17363842313744
D = density of Brazil nut stems (per hectare); Havg = total average height (m); Hmax = total maximum height (m); Hmax A = absolute maximum height (m).
Disclaimer/Publisher’s Note: The statements, opinions and data contained in all publications are solely those of the individual author(s) and contributor(s) and not of MDPI and/or the editor(s). MDPI and/or the editor(s) disclaim responsibility for any injury to people or property resulting from any ideas, methods, instructions or products referred to in the content.

