


Assessing Rural Development Vulnerability Index: A Spatio-Temporal Analysis of Post-Poverty Alleviation Areas in Hunan, China


Abstract
1. Introduction
2. Literature Review and Framework Presentation
2.1. SES Perspective
2.2. Poverty-Returning Vulnerability
2.3. Methodological Frameworks in Vulnerability Studies

| Model Name | Characteristics | References |
|---|---|---|
| R-H (Risk-Hazard) | Emphasizes multi-causal interactions between hazard drivers and exposure elements, focusing on hazard-consequence linkages and systemic complexity. | Burton, 1993 [66]; Costa, 2013 [65] |
| PAR (Pressure-and-Release) | Examines vulnerability dynamics under imbalanced societal pressures and institutional responsiveness, decoding systemic fragility formation. | Fadigas, 2017 [70]; Huelssiep, 2021 [69] |
| PSR (Pressure-State-Response) | A sustainable development assessment framework for ecological vulnerability based on the Pressure-State-Response model, with emphasis on studying linear pressure and its corresponding response mechanisms. | Talukdar, 2020 [71]; Zhang, 2023 [72] |
| HOP (Hazard-of-Place) | Assesses coupled natural-socioenvironmental impacts on regional vulnerability through risk-quantified spatial analytics. | Frigerio, 2016 [67]; Guo, 2021 [68] |
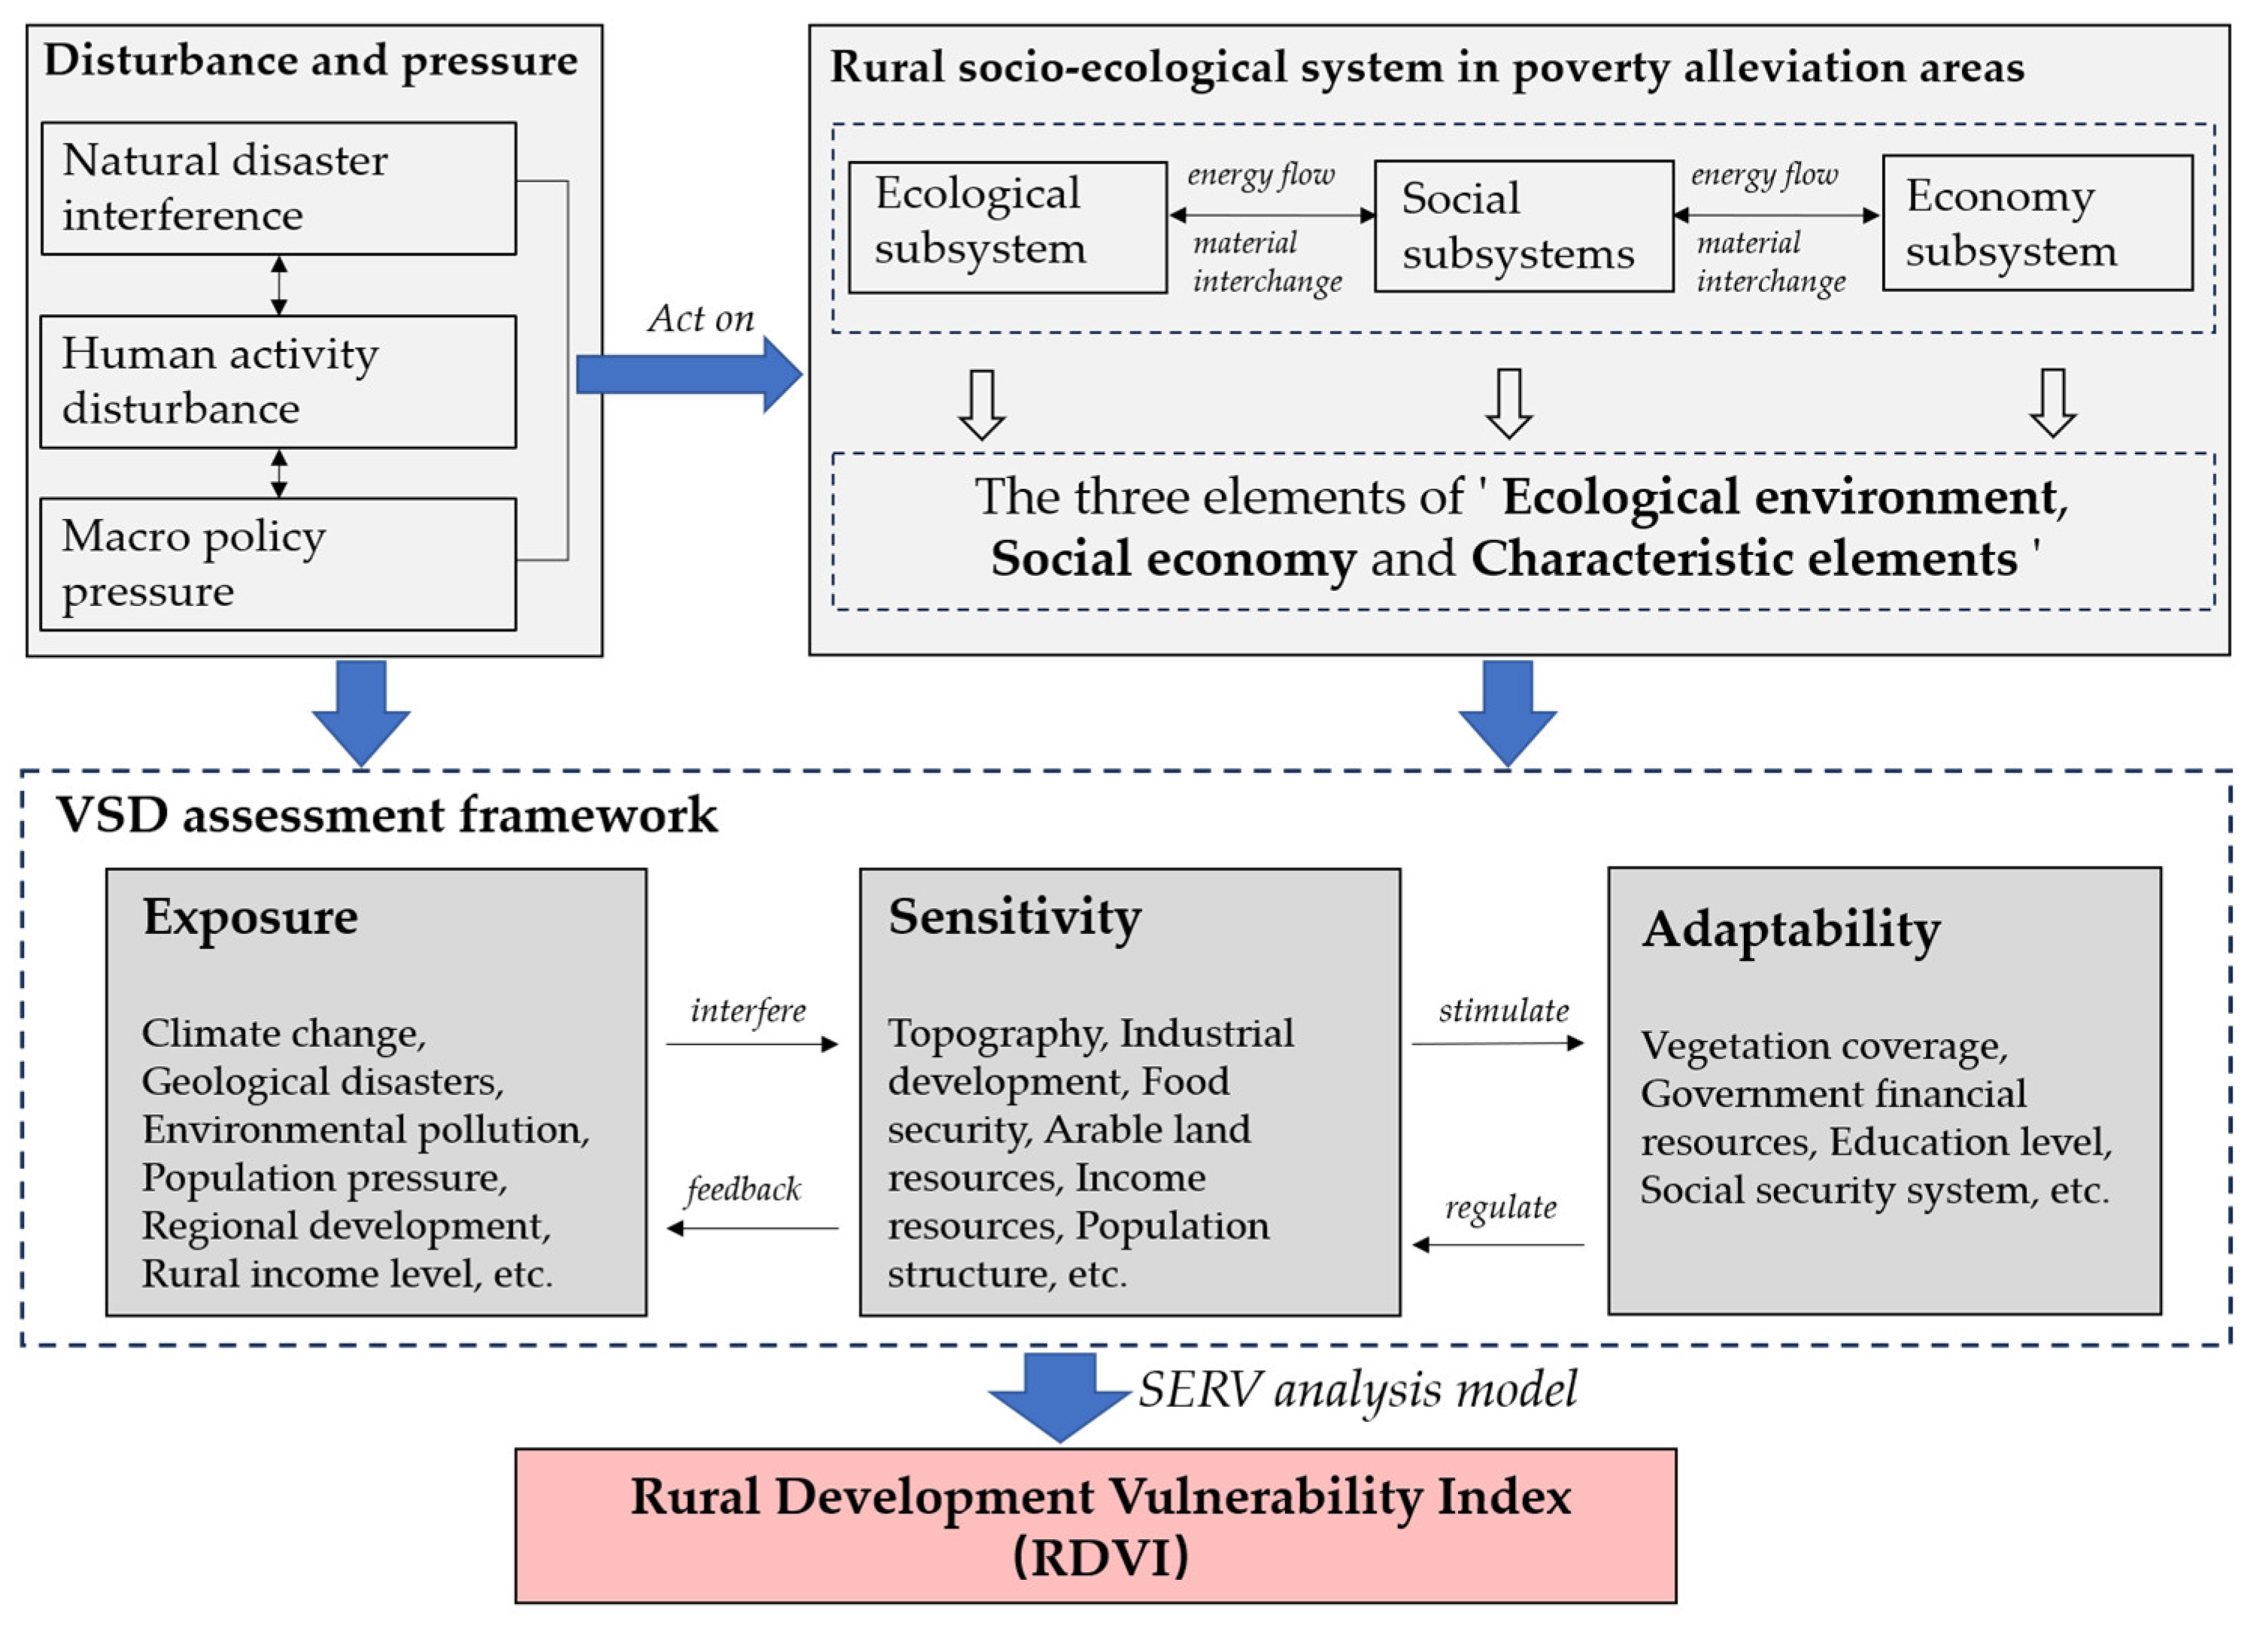
| VSD (Vulnerability-Scoping-Diagram) | The model breaks vulnerability down into three parts: “exposure, sensitivity, and adaptability,” integrates and constructs vulnerability assessment indicators, and considers nonlinear interactions. | Polsky, 2007 [58]; Nicholas, 2012 [73]; Cao, 2022 [74] |
| SERV (Spatially-Explicit-Resilience-Vulnerability) | Conducting vulnerability assessment and characterization of spatial systems affected by natural and anthropogenic factors within defined geographical areas. This methodology integrates geospatial data with statistical techniques to enable vulnerability pattern mapping. | Frazier, 2014 [75]; Chen, 2018 [77] |
3. Materials and Methods
3.1. Study Area
3.2. Data Sources
3.3. Methods
3.3.1. Assessment of the Rural Development Vulnerability Index (RDVI)
- (1)
- VSD Assessment Framework
- (2)
- SERV model and visualisation
3.3.2. Spatial Autocorrelation Analysis
3.3.3. Principal Component Analysis
3.3.4. Identification and Analysis of Factors Influencing Vulnerability
- (1)
- Factor detector
- (2)
- Interaction detector
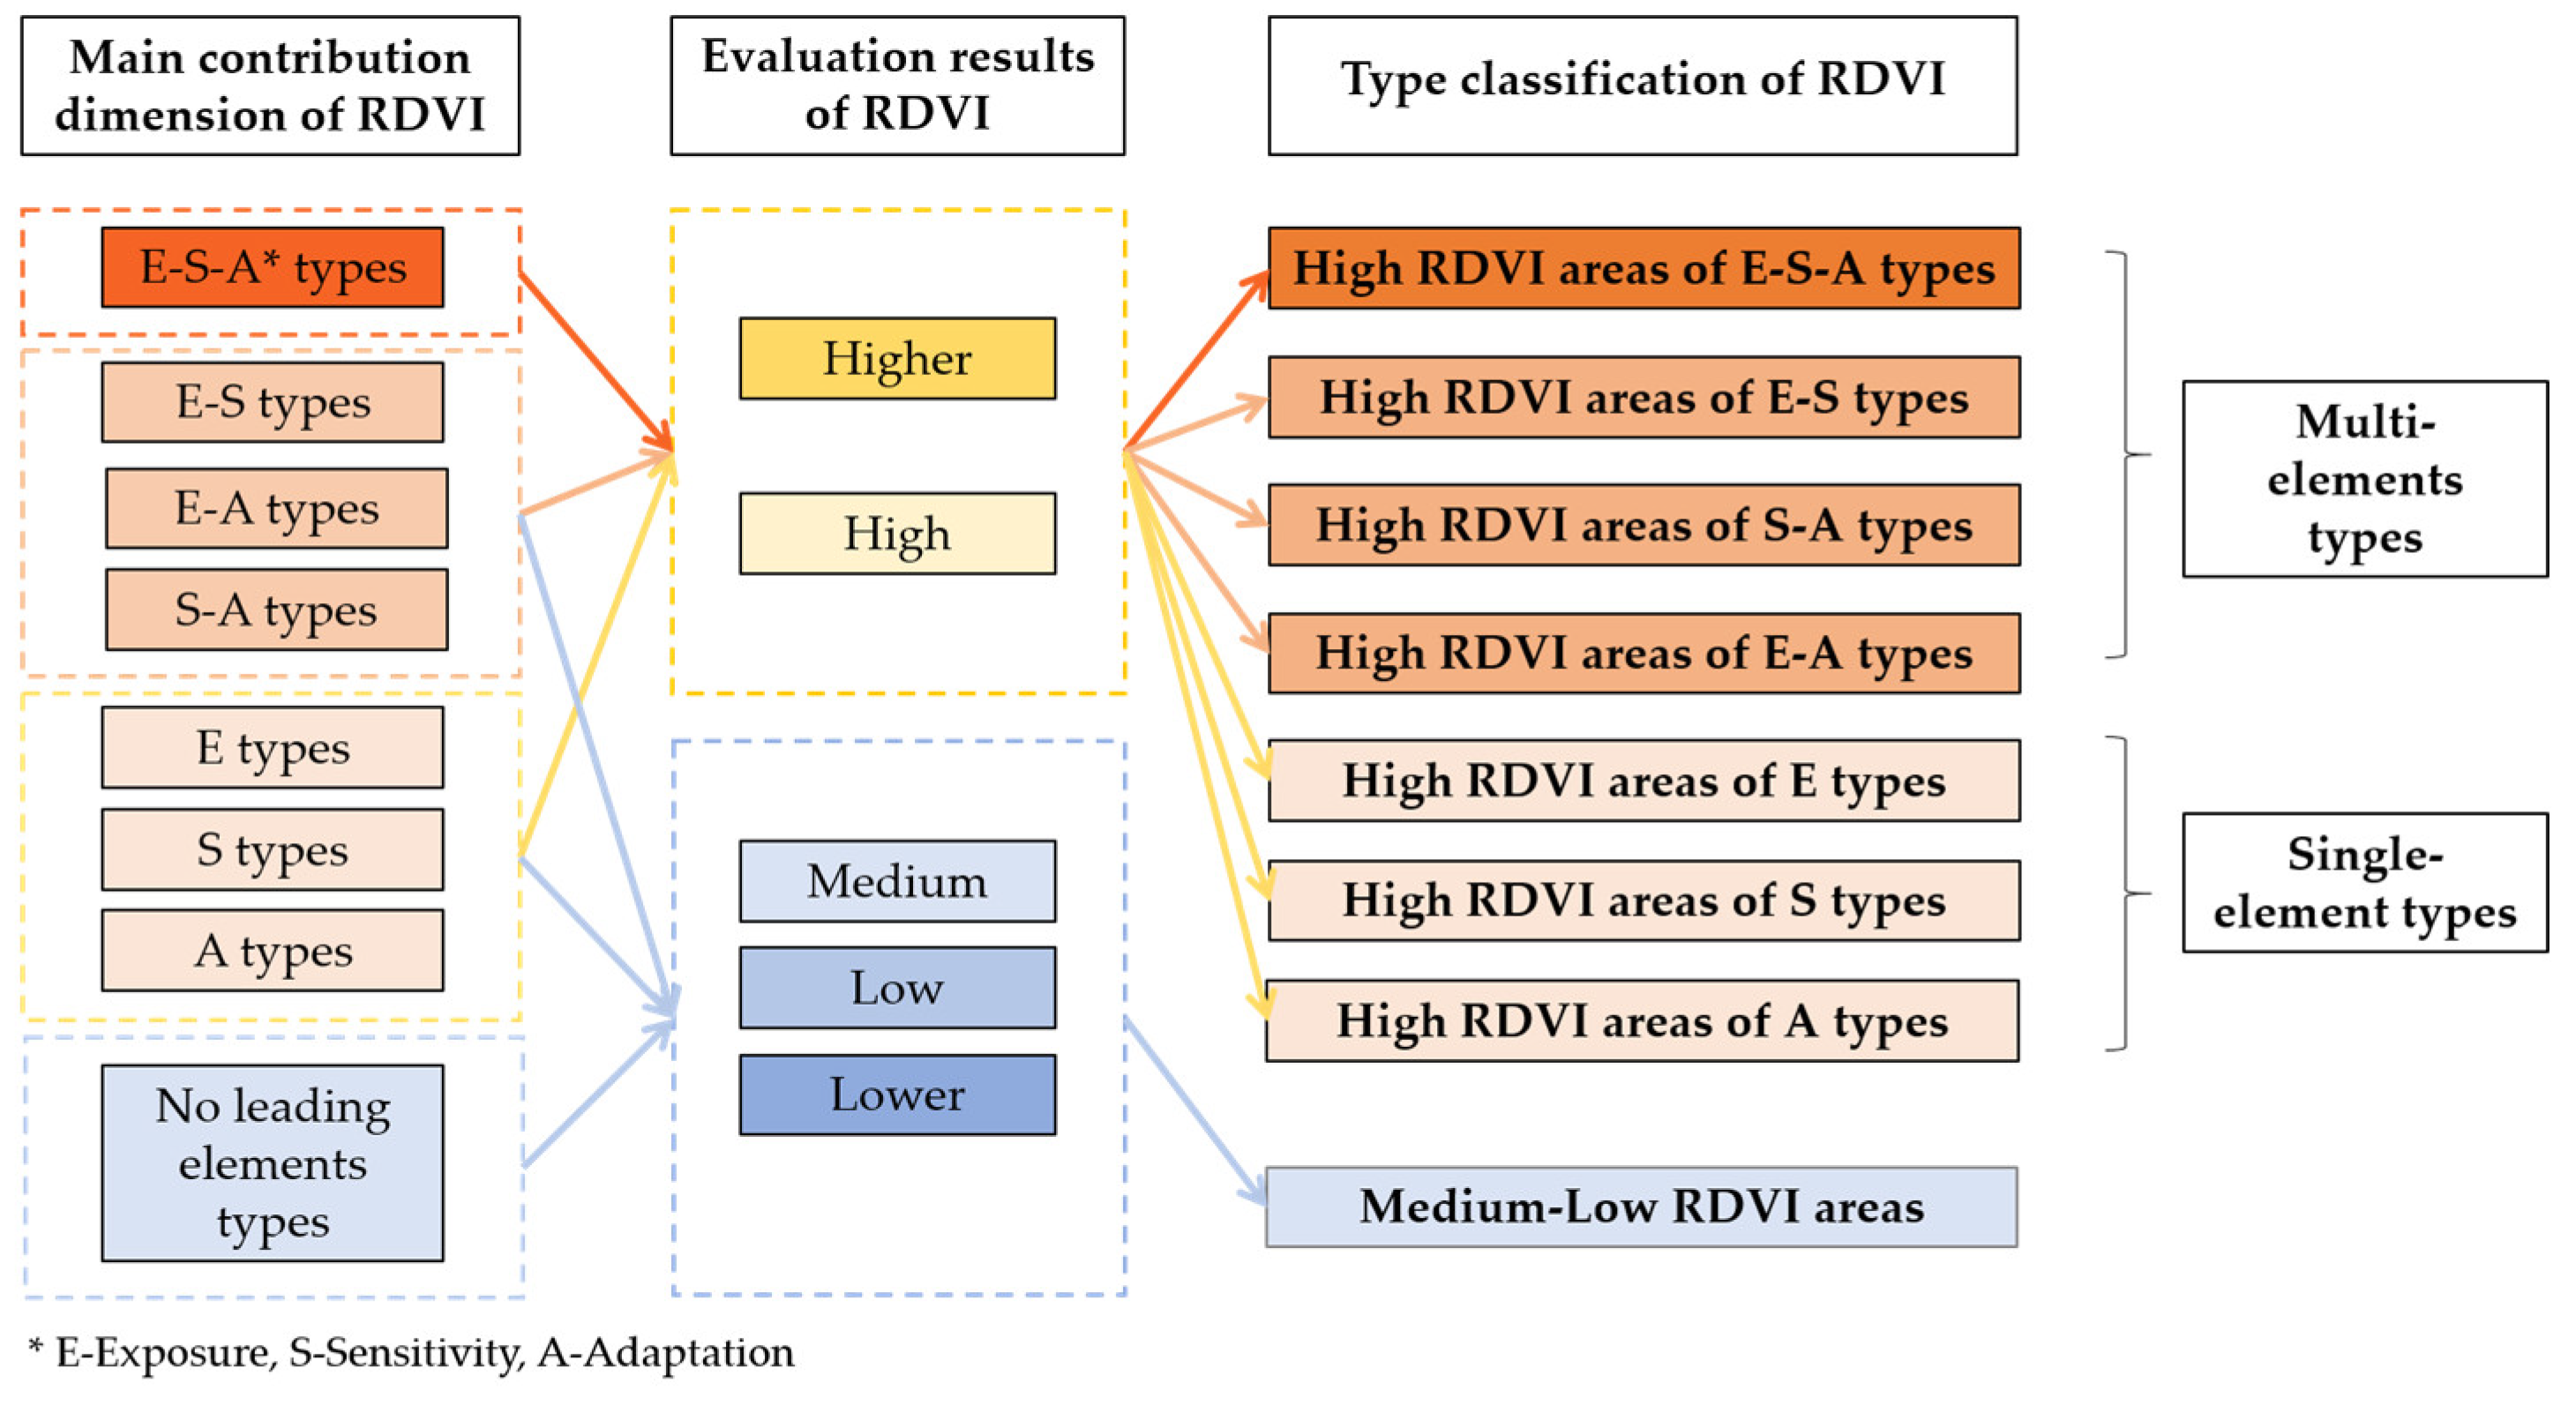
3.3.5. Type Classification of Vulnerability
4. Results
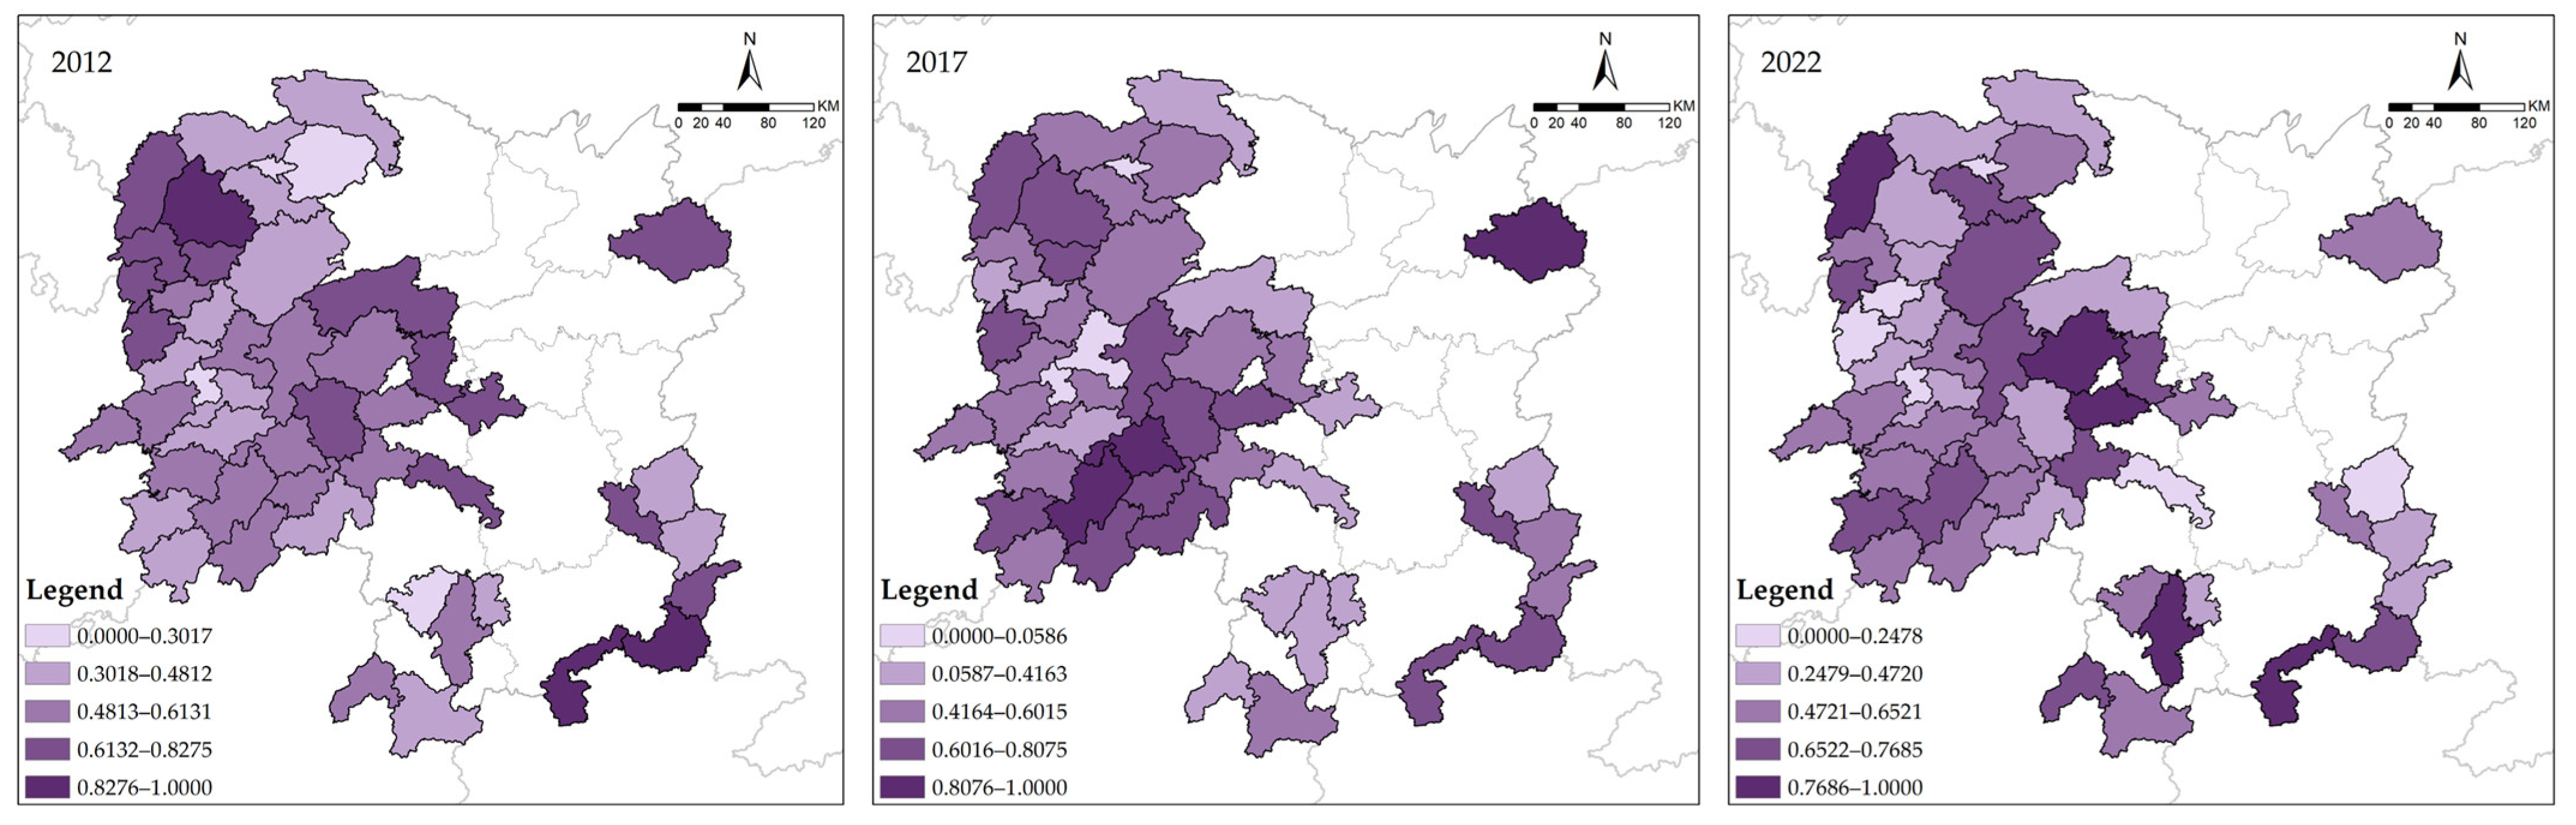
4.1. Spatial Characteristics of the Rural Development Vulnerability Index
4.1.1. The Spatial Pattern of the Rural Development Vulnerability Index
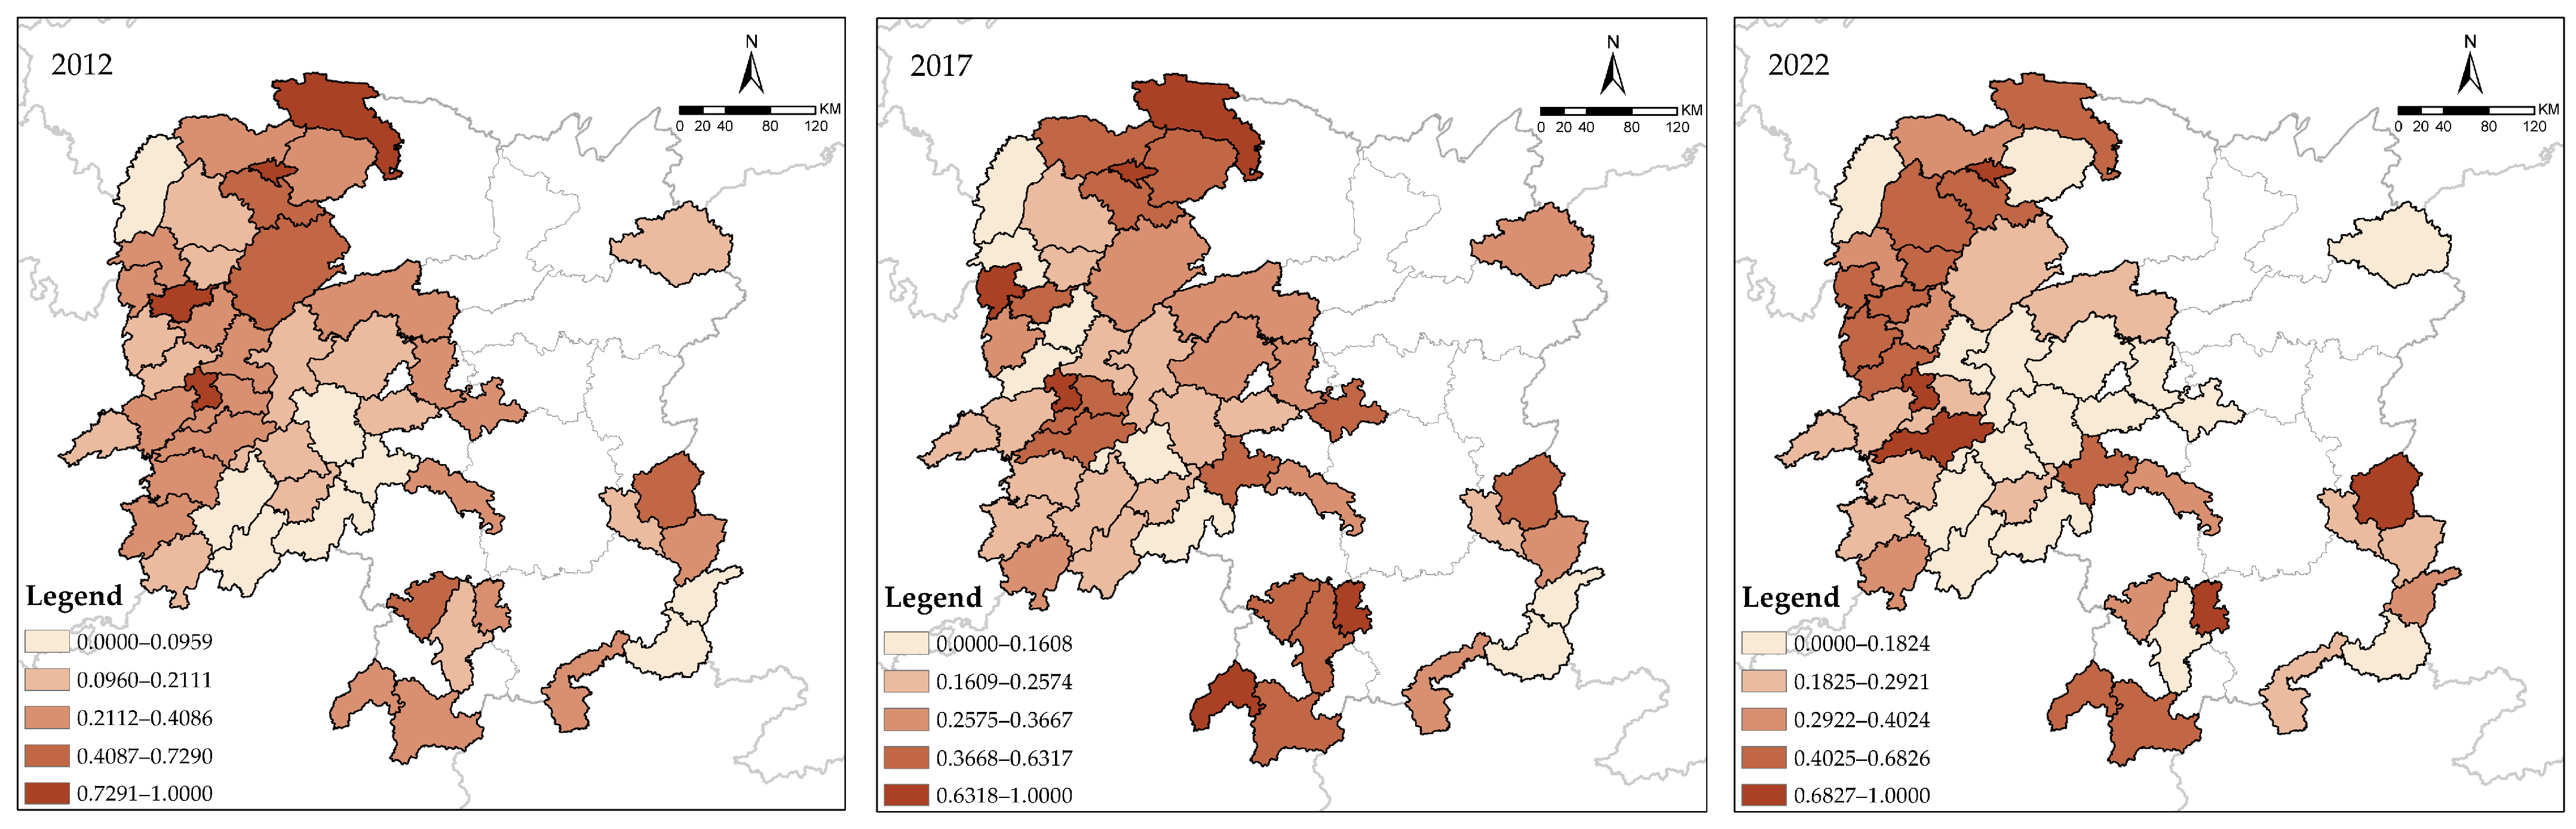
4.1.2. The Spatial Patterns of Exposure, Sensitivity, and Adaptability
4.2. Spatial Clustering Characteristics of the Rural Development Vulnerability Index
4.3. Factors Influencing Rural Development Vulnerability in Post-Poverty Alleviation Areas
4.3.1. Factor Detection Results
4.3.2. Interaction Detection Results
4.4. Type Classification of Vulnerability in Post-Poverty Alleviation Areas
5. Discussion
5.1. External Evidence and Theoretical Thinking
5.1.1. Spatial Characteristics of Vulnerability: Convergences with Global Mountainous-Ethnic Vulnerability Studies
5.1.2. Evolving Influences on Vulnerability: From Natural Disasters to Pressures on Social Resources
5.2. Academic Contributions and Future Research Directions
5.2.1. Theoretical Contributions: Advancing Coupled Socio-Ecological Vulnerability Analysis
5.2.2. Future Research Prospects
5.2.3. Practical Implications for Policy and Practice
5.3. Limitations
6. Conclusions
Author Contributions
Funding
Institutional Review Board Statement
Informed Consent Statement
Data Availability Statement
Conflicts of Interest
References
- Liu, Y.; Li, Y. Revitalize the world’s countryside. Nature 2017, 548, 275–277. [Google Scholar] [CrossRef]
- Weiland, S.; Hickmann, T.; Lederer, M.; Marquardt, J.; Schwindenhammer, S. The 2030 agenda for sustainable development: Transformative change through the sustainable development goals? Politics Gov. 2021, 9, 90–95. [Google Scholar] [CrossRef]
- Zhao, L. Tourism, institutions, and poverty alleviation: Empirical evidence from China. J. Travel Res. 2021, 60, 1543–1565. [Google Scholar] [CrossRef]
- Moller, S.; Bradley, D.; Huber, E.; Nielsen, F.; Stephens, J.D. Determinants of relative poverty in advanced capitalist democracies. Am. Sociol. Rev. 2003, 68, 22–51. [Google Scholar] [CrossRef]
- Brady, D.; Bostic, A. Paradoxes of social policy: Welfare transfers, relative poverty, and redistribution preferences. Am. Sociol. Rev. 2015, 80, 268–298. [Google Scholar] [CrossRef]
- Ge, Y.; Hu, S.; Song, Y.; Zheng, H.; Liu, Y.; Ye, X.; Ma, T.; Liu, M.; Zhou, C. Sustainable poverty reduction models for the coordinated development of the social economy and environment in China. Sci. Bull. 2023, 68, 2236–2246. [Google Scholar] [CrossRef]
- Guo, Y.; Zhou, Y.; Liu, Y. Targeted poverty alleviation and its practices in rural China: A case study of Fuping county, Hebei Province. J. Rural. Stud. 2022, 93, 430–440. [Google Scholar] [CrossRef]
- Cui, Z.; Li, E.; Li, Y.; Deng, Q.; Shahtahmassebi, A. The impact of poverty alleviation policies on rural economic resilience in impoverished areas: A case study of Lankao County, China. J. Rural. Stud. 2023, 99, 92–106. [Google Scholar] [CrossRef]
- Zhou, Y.; Liu, Z.; Wang, H.; Cheng, G. Targeted poverty alleviation narrowed China’s urban-rural income gap: A theoretical and empirical analysis. Appl. Geogr. 2023, 157, 103000. [Google Scholar] [CrossRef]
- Scott, D.; Hall, C.M.; Gössling, S. Global tourism vulnerability to climate change. Ann. Tour. Res. 2019, 77, 49–61. [Google Scholar] [CrossRef]
- Ren, X.; Xiao, Y.; Xiao, S.; Jin, Y.; Taghizadeh-Hesary, F. The effect of climate vulnerability on global carbon emissions: Evidence from a spatial convergence perspective. Resour. Policy 2024, 90, 104817. [Google Scholar] [CrossRef]
- Shokry, G.; Connolly, J.J.; Anguelovski, I. Understanding climate gentrification and shifting landscapes of protection and vulnerability in green resilient Philadelphia. Urban Clim. 2020, 31, 100539. [Google Scholar] [CrossRef]
- Sultana, F. Climate change, COVID-19, and the co-production of injustices: A feminist reading of overlapping crises. Soc. Cult. Geogr. 2021, 22, 447–460. [Google Scholar] [CrossRef]
- Connolly, C.; Keil, R.; Ali, S.H. Extended urbanisation and the spatialities of infectious disease: Demographic change, infrastructure and governance. Urban Stud. 2021, 58, 245–263. [Google Scholar] [CrossRef]
- Huang, T.; Wei, M.; Xi, J. Evolution difference and influence mechanism of social-ecosystem resilience in rural tourism destinations: Based on the comparative demonstration of the core-edge areas of the Yangtze River Delt. Sci. Geogr. Sinic 2024, 44, 492–501. [Google Scholar] [CrossRef]
- Zhou, Y.; Guo, Y.; Liu, Y.; Wu, W.; Li, Y. Targeted poverty alleviation and land policy innovation: Some practice and policy implications from China. Land Use Policy 2018, 74, 53–65. [Google Scholar] [CrossRef]
- Fang, E.F.; Scheibye-Knudsen, M.; Jahn, H.J.; Li, J.; Ling, L.; Guo, H.; Zhu, X.; Preedy, V.; Lu, H.; Bohr, V.A. A research agenda for aging in China in the 21st century. Ageing Res. Rev. 2015, 24, 197–205. [Google Scholar] [CrossRef]
- Liu, M.; Ji, Y. Determinants of agricultural infrastructure construction in China: Based on the “participation of beneficiary groups” perspective. Land 2020, 9, 6. [Google Scholar] [CrossRef]
- Zang, Y.; Liu, Y.; Yang, Y.; Woods, M.; Fois, F. Rural decline or restructuring? Implications for sustainability transitions in rural China. Land Use Policy 2020, 94, 104531. [Google Scholar] [CrossRef]
- Wang, Y.; Li, P. Appraisal of shallow groundwater quality with human health risk assessment in different seasons in rural areas of the Guanzhong Plain (China). Environ. Res. 2022, 207, 112210. [Google Scholar] [CrossRef]
- Yu, Z.; Li, B.; Zhang, X. Social ecological system and vulnerability driving mechanism analysis. Acta Ecol. Sin. 2014, 34, 1870–1879. [Google Scholar] [CrossRef]
- Wang, Q.; Yin, M.; Yang, X.; Yao, Z. Spatio-temporal evolution and impact mechanism of socio-ecological system vulnerability in poor mountainous tourist distinations:Taking Dabie Mountain Area as example. Acta Geogr. Sin. 2019, 74, 1663–1679. [Google Scholar] [CrossRef]
- Jia, J.; LIU, J. Prevent Large-scale Poverty Returning: Theoretical Logic, Key Issues and Implementation Mechanism. Issues Agric. Econ. 2024, 45, 128–144. [Google Scholar] [CrossRef]
- Zhang, Q.; Liang, Y.; Zhou, M. Alleviating poverty for common prosperity: The role of Fupinguan in an E-tailing supply chain. Eur. J. Oper. Res. 2025, 320, 101–114. [Google Scholar] [CrossRef]
- Ma, W.; Mu, L. China’s Rural Revitalization Strategy: Sustainable Development, Welfare, and Poverty Alleviation. Soc. Indic. Res. 2024, 174, 743–767. [Google Scholar] [CrossRef]
- Elliott, M.; Borja, Á.; Cormier, R. Managing marine resources sustainably: A proposed integrated systems analysis approach. Ocean Coast. Manag. 2020, 197, 105315. [Google Scholar] [CrossRef]
- Berrio-Giraldo, L.; Villegas-Palacio, C.; Arango-Aramburo, S. Understating complex interactions in socio-ecological systems using system dynamics: A case in the tropical Andes. J. Environ. Manag. 2021, 291, 112675. [Google Scholar] [CrossRef]
- Wang, K.; Cai, Z.; Xu, Y.; Zhang, F. Hexagonal cyclical network structure and operating mechanism of the social-ecological system. Ecol. Indic. 2022, 141, 109099. [Google Scholar] [CrossRef]
- Holland, J.H. Complex adaptive systems. Daedalus 1992, 121, 17–30. [Google Scholar]
- Cumming, G.S.; Barnes, G.; Perz, S.; Schmink, M.; Sieving, K.E.; Southworth, J.; Binford, M.; Holt, R.D.; Stickler, C.; Van Holt, T. An exploratory framework for the empirical measurement of resilience. Ecosystems 2005, 8, 975–987. [Google Scholar] [CrossRef]
- Walker, B.; Salt, D. Resilience Thinking: Sustaining Ecosystems and People in a Changing World; Island Press: Washington, DC, USA, 2012. [Google Scholar]
- Preiser, R.; Biggs, R.; De Vos, A.; Folke, C. Social-ecological systems as complex adaptive systems. Ecol. Soc. 2018, 23, 46. [Google Scholar] [CrossRef]
- Schlüter, M.; Haider, L.J.; Lade, S.J.; Lindkvist, E.; Martin, R.; Orach, K.; Wijermans, N.; Folke, C. Capturing emergent phenomena in social-ecological systems. Ecol. Soc. 2019, 24, 11. [Google Scholar] [CrossRef]
- Lipton, M.; Ravallion, M. Poverty and policy. Handb. Dev. Econ. 1995, 3, 2551–2657. [Google Scholar]
- Dzator, J.; Acheampong, A.O.; Appiah-Otoo, I.; Dzator, M. Leveraging digital technology for development: Does ICT contribute to poverty reduction? Telecommun. Policy 2023, 47, 102524. [Google Scholar] [CrossRef]
- Adebayo, T.S.; Ullah, S. Formulating sustainable development policies for China within the framework of socioeconomic conditions and government stability. Environ. Pollut. 2023, 328, 121673. [Google Scholar] [CrossRef]
- Chen, Y.; Shu, B.; Chen, Y.; Hu, J.-h.; Wei, D. Spatial distribution and potential poverty-returning factors of former poverty-stricken villages in the Liangshan Mountains, China. J. Mt. Sci. 2023, 20, 2692–2707. [Google Scholar] [CrossRef]
- Du, Y.; Zhao, R. Early Warning of Poverty Returning against the Background of Rural Revitalization: A Case Study of Two Counties in Guangxi Province, China. Agriculture 2023, 13, 1087. [Google Scholar] [CrossRef]
- Liu, T.; Yu, L.; Chen, X.; Li, X.; Du, Z.; Yan, Y.; Peng, D.; Gong, P. Utilizing nighttime light datasets to uncover the spatial patterns of county-level relative poverty-returning risk in China and its alleviating factors. J. Clean. Prod. 2024, 448, 141682. [Google Scholar] [CrossRef]
- Long, J.; Pan, X.; Zhao, Q.; Li, J.; IEEE. Research on Guangxi Yulin’s Poverty Return Identification Based on Integrated Learning. In Proceedings of the IEEE International Conference on Electrical Engineering, Big Data and Algorithms (EEBDA), Changchun, China, 25–27 February 2022; pp. 1299–1304. [Google Scholar]
- Wang, B.; Shi, H.; Wang, Z.; Xu, S.; Deng, N.; Qiu, Y.; Zhang, B. Pandemics erode poverty alleviation process: Impact on productive livelihood and poverty return. iScience 2023, 26, 107177. [Google Scholar] [CrossRef]
- Wang, S.; Guo, Y.; He, Z. Analysis on the Measurement and Dynamic Evolution of Multidimensional Return to Poverty in Chinese Rural Households. Soc. Indic. Res. 2023, 165, 31–52. [Google Scholar] [CrossRef]
- Wang, W.; Chen, K.; Xiao, W.; Du, J.; Qiao, H. Determinants of health poverty vulnerability in rural areas of Western China in the post-poverty relief era: An analysis based on the Anderson behavioral model. BMC Public Health 2024, 24, 459. [Google Scholar] [CrossRef] [PubMed]
- Wang, Y.; Zhao, J.; Yao, R.; Zhao, R.; Li, Y. Risk of Poverty Returning to the Tibetan Area of Gansu Province in China. Sustainability 2022, 14, 11268. [Google Scholar] [CrossRef]
- Xu, M.; Li, J.; Ieee Computer, S.O.C. Research on Machine Learning Based Analysis of Poverty Alleviation Households Returning to Poverty. In Proceedings of the 10th International Conference on Intelligent Data and Security (Ids), New York, NY, USA, 10–12 May 2024; pp. 86–91. [Google Scholar]
- Zhang, R.; He, Y.; Cui, W.; Yang, Z.; Ma, J.; Xu, H.; Feng, D. Poverty-Returning Risk Monitoring and Analysis of the Registered Poor Households Based on BP Neural Network and Natural Breaks: A Case Study of Yunyang District, Hubei Province. Sustainability 2022, 14, 5228. [Google Scholar] [CrossRef]
- Zhang, S. Study on the prevention mechanism of rural poverty return and psychological anxiety prevention in the era of relative poverty—A case study of Ningde city, Fujian province. Medicine 2024, 103, 2–3. [Google Scholar] [CrossRef]
- Zhou, D.; Chen, T.; Zhu, Y.; He, Y.; Li, B.; Wang, W. A statistical evaluation of the effectiveness of multidimensional relative poverty alleviation efforts in China. J. Econ. Inequal. 2024, 23, 279–302. [Google Scholar] [CrossRef]
- Saha, A.; Pal, S.C.; Chowdhuri, I.; Roy, P.; Chakrabortty, R.; Shit, M. Vulnerability assessment of drought in India: Insights from meteorological, hydrological, agricultural and socio-economic perspectives. Gondwana Res. 2023, 123, 68–88. [Google Scholar] [CrossRef]
- Bostani, M.; Tavousi, T.; Mahmoudi, P.; Jordaan, A.; Jahanshahi, S.M.A. Drought risk assessment based on hazard, vulnerability, and coping capacity concepts for hot and dry climate regions of Iran. Environ. Dev. 2024, 52, 101077. [Google Scholar] [CrossRef]
- Zhang, Y.; Zhao, W. Social capital’s role in mitigating economic vulnerability: Understanding the impact of income disparities on farmers’ livelihoods. World Dev. 2024, 177, 106515. [Google Scholar] [CrossRef]
- Azeem, M.M.; Mugera, A.W.; Schilizzi, S. Poverty and vulnerability in the Punjab, Pakistan: A multilevel analysis. J. Asian Econ. 2016, 44, 57–72. [Google Scholar] [CrossRef]
- Jha, R.; Nagarajan, H.K.; Pradhan, K.C.; Kang, W. Vulnerability as Expected Poverty in Rural India. J. South Asian Stud. 2018, 24, 97–126. [Google Scholar]
- Novignon, J.; Nonvignon, J.; Mussa, R.; Chiwaula, L.S. Health and vulnerability to poverty in Ghana: Evidence from the Ghana Living Standards Survey Round 5. Health Econ. Rev. 2012, 2, 11. [Google Scholar] [CrossRef] [PubMed]
- Ozughalu, U.M. Relationship Between Household Food Poverty and Vulnerability to Food Poverty: Evidence from Nigeria. Soc. Indic. Res. 2016, 125, 567–587. [Google Scholar] [CrossRef]
- Best, J. Redefining Poverty as Risk and Vulnerability: Shifting strategies of liberal economic governance. Third World Q. 2013, 34, 109–129. [Google Scholar] [CrossRef]
- Chiwaula, L.S.; Witt, R.; Waibel, H. An asset-based approach to vulnerability: The case of small-scale fishing areas in Cameroon and Nigeria. J. Dev. Stud. 2011, 47, 338–353. [Google Scholar] [CrossRef]
- Polsky, C.; Neff, R.; Yarnal, B. Building comparable global change vulnerability assessments: The vulnerability scoping diagram. Glob. Environ. Change 2007, 17, 472–485. [Google Scholar] [CrossRef]
- Liu, W.; Liu, J.; Xu, J.; Li, J.; Feldman, M. Examining the links between household livelihood resilience and vulnerability: Disaster resettlement experience from rural China. Front. Environ. Sci. 2024, 11, 1340113. [Google Scholar] [CrossRef]
- Veisi, H.; Liaghati, H.; Vaninee, H.S. Participatory assessment of the sustainability of livelihoods in the agroecosystem of Abesard, Iran. Sustain. Sci. 2014, 9, 347–359. [Google Scholar] [CrossRef]
- Peng, K.; Zhang, A. Farmers’Vulnerability in Farmland Conversion: Analytical Framework and Empirical Research on Five Provinces in Central China. J. Nat. Resour. 2015, 30, 1798–1810. [Google Scholar] [CrossRef]
- Yan, X.; Qi, X.; Pan, Y.; Li, Y. Vulnerability assessment of return-to-poverty under poverty elimination in China: A new integrated regional and individual perspective. J. Nat. Resour. 2022, 37, 440–458. [Google Scholar] [CrossRef]
- Liu, W.; Duan, M.; Feldman, M. Exploring the relationship between vulnerability and adaptation of rural households: Disaster resettlement experience from rural China. Front. Environ. Sci. 2024, 12, 1437416. [Google Scholar] [CrossRef]
- Qi, J.; Li, H.; Li, W.; Jin, J.; Ye, F. The Influence of Digital Skills on Farm Households’ Vulnerability to Relative Poverty: Implications for the Sustainability of Farmers’ Livelihoods. Sustainability 2024, 16, 8420. [Google Scholar] [CrossRef]
- Costa, L.; Kropp, J.P. Linking components of vulnerability in theoretic frameworks and case studies. Sustain. Sci. 2013, 8, 1–9. [Google Scholar] [CrossRef]
- Burton, I. The Environment as Hazard; Guilford Press: New York, NY, USA, 1993. [Google Scholar]
- Frigerio, I.; De Amicis, M. Mapping social vulnerability to natural hazards in Italy: A suitable tool for risk mitigation strategies. Environ. Sci. Policy 2016, 63, 187–196. [Google Scholar] [CrossRef]
- Guo, N.; Tang, X.; Ren, Y.; Ma, K.; Fang, J. Place vulnerability assessment based on the HOP model in the middle and lower reaches of the Yangtze River. GeoJournal 2021, 86, 689–710. [Google Scholar] [CrossRef]
- Huelssiep, M.; Thaler, T.; Fuchs, S. The impact of humanitarian assistance on post-disaster social vulnerabilities: Some early reflections on the Nepal earthquake in 2015. Disasters 2021, 45, 577–603. [Google Scholar] [CrossRef]
- Fadigas, A.B. Vulnerability factors of shellfisherwomen in the face of oil spill events: An analysis of the Prestige case. Int. J. Disaster Risk Reduct. 2017, 24, 560–567. [Google Scholar] [CrossRef]
- Talukdar, S.; Pal, S. Wetland habitat vulnerability of lower Punarbhaba river basin of the uplifted Barind region of Indo-Bangladesh. Geocarto Int. 2020, 35, 857–886. [Google Scholar] [CrossRef]
- Zhang, Y.; Shang, K. Cloud model assessment of urban flood resilience based on PSR model and game theory. Int. J. Disaster Risk Reduct. 2023, 97, 104050. [Google Scholar] [CrossRef]
- Nicholas, K.A.; Durham, W.H. Farm-scale adaptation and vulnerability to environmental stresses: Insights from winegrowing in Northern California. Glob. Environ. Change 2012, 22, 483–494. [Google Scholar] [CrossRef]
- Cao, J.; Yang, Y.; Deng, Z.; Hu, Y. Spatial and temporal evolution of ecological vulnerability based on vulnerability scoring diagram model in Shennongjia, China. Sci. Rep. 2022, 12, 5168. [Google Scholar] [CrossRef]
- Frazier, T.G.; Thompson, C.M.; Dezzani, R.J. A framework for the development of the SERV model: A Spatially Explicit Resilience-Vulnerability model. Appl. Geogr. 2014, 51, 158–172. [Google Scholar] [CrossRef]
- Li, P.; Chen, C. Ecological vulnerability assessment of economic developed region based on VSD model: The case of Taihu basin. Ecol. Environ. Sci. 2014, 23, 237–243. [Google Scholar]
- Chen, J.; Yang, X.; Yin, S.; Wu, K.; Deng, M.; Wen, X. The vulnerability evolution and simulation of social-ecological systems in a semi-arid area: A case study of Yulin City, China. J. Geogr. Sci. 2018, 28, 152–174. [Google Scholar] [CrossRef]
- Bennett, N.J.; Blythe, J.; Tyler, S.; Ban, N.C. Communities and change in the anthropocene: Understanding social-ecological vulnerability and planning adaptations to multiple interacting exposures. Reg. Environ. Change 2016, 16, 907–926. [Google Scholar] [CrossRef]
- González-Moreno, P.; Schmitt, E.; Moreno-Ortiz, J.; Pinto-Correia, T.; Guiomar, N.; Delgado-Serrano, M.d.M. Assessing the vulnerability of mountain value chains to environmental and social drivers in Europe: A land-use and stakeholder-based approach. Ambio 2025, 1–18. [Google Scholar] [CrossRef]
- Yu, Z.; Yang, G.; Lin, T.; Zhao, B.; Xu, Y.; Yao, X.; Ma, W.; Vejre, H.; Jiang, B. Exposure ecology drives a unified understanding of the nexus of (urban) natural ecosystem, ecological exposure, and health. Ecosyst. Health Sustain. 2024, 10, 0165. [Google Scholar] [CrossRef]
- Fronzek, S.; Carter, T.R.; Pirttioja, N.; Alkemade, R.; Audsley, E.; Bugmann, H.; Flörke, M.; Holman, I.; Honda, Y.; Ito, A. Determining sectoral and regional sensitivity to climate and socio-economic change in Europe using impact response surfaces. Reg. Environ. Change 2019, 19, 679–693. [Google Scholar] [CrossRef]
- Gurusamy, B.T.; Vasudeo, A.D. Socio-economic and ecological adaptability across South Asian Floodplains. J. Environ. Eng. Landsc. Manag. 2023, 31, 121–131. [Google Scholar] [CrossRef]
- Walker, B.; Holling, C.S.; Carpenter, S.R.; Kinzig, A. Resilience, adaptability and transformability in social–ecological systems. Ecol. Soc. 2004, 9, 5. [Google Scholar] [CrossRef]
- Li, Z.; Shi, L.; Zhang, C. Vulnerability Assessment and Differentiated Response Strategies of Rural Territorial Systems at the County Level from the Socio-ecological Perspective. Econ. Geogr. 2022, 42, 175–184. [Google Scholar] [CrossRef]
- Qu, Y.; He, S.; Peng, Y.; Chen, H.; Zhang, X. Sustainable Livelihood of Rural Elderly Farmers in Poverty Alleviation Areas from the Perspective of Active Aging: Analysis of the Path for Integrating Individual and Spatial Perspectives. Trop. Geogr. 2023, 43, 2102–2118. [Google Scholar]
- Grave, I.; Bojórquez-Tapia, L.A.; Estrada-Barón, A.; Nelson, D.R.; Eakin, H. Analytic hierarchy process and sensitivity analysis implementation for social vulnerability assessment: A case study from Brazil. J. Multi-Criteria Decis. Anal. 2022, 29, 381–392. [Google Scholar] [CrossRef]
- Bhuyan, N.; Sajjad, H.; Sharma, Y.; Sharma, A.; Ahmed, R. Assessing socio-economic vulnerability to riverbank erosion in the Middle Brahmaputra floodplains of Assam, India. Environ. Dev. 2024, 51, 101027. [Google Scholar] [CrossRef]
- Duan, W.; Zhang, P.; Zhu, R.; Li, B.; Zhang, Y.; Zhang, Y. Impact of Nature Reserves on the Rural Household’s Livelihood Vulnerability In Surrounding Communities: 17 Giant Panda Nature Reserves in China As Examples. Small-Scale For. 2024, 23, 423–442. [Google Scholar] [CrossRef]
- Acosta-Michlik, L.; Espaldon, V. Assessing vulnerability of selected farming communities in the Philippines based on a behavioural model of agent’s adaptation to global environmental change. Glob. Environ. Change 2008, 18, 554–563. [Google Scholar] [CrossRef]
- Wang, J.; Xu, C. Geodetector: Principle and prospective. Acta Geogr. Sin. 2017, 72, 116–134. [Google Scholar] [CrossRef]
- Wang, J.F.; Li, X.H.; Christakos, G.; Liao, Y.L.; Zhang, T.; Gu, X.; Zheng, X.Y. Geographical Detectors-Based Health Risk Assessment and its Application in the Neural Tube Defects Study of the Heshun Region, China. Int. J. Geogr. Inf. Sci. 2010, 24, 107–127. [Google Scholar] [CrossRef]
- Zhou, T.; Qi, J.; Xu, Z.; Zhou, D. Damage or recovery? Assessing ecological land change and its driving factors: A case of the Yangtze River Economic Belt. J. Resour. Ecol. 2021, 12, 175–191. [Google Scholar]
- Wang, C.; He, Y. Spatio-temporal differentiation and differentiated regulation of the vulnerability of rural production space system in Chongqing. Acta Geogr. Sin. 2020, 75, 1680–1698. [Google Scholar] [CrossRef]
- Wang, J.; Xu, K.; Chi, Y.; Wang, J.; Zhang, X.; Lu, J.; Wang, X. The environmental function assessment and zoning scheme in China. Acta Ecol. Sin. 2014, 34, 129–135. [Google Scholar] [CrossRef]
- Nguyen, Y.T.B.; Leisz, S.J. Determinants of livelihood vulnerability to climate change: Two minority ethnic communities in the northwest mountainous region of Vietnam. Environ. Sci. Policy 2021, 123, 11–20. [Google Scholar] [CrossRef]
- Fetoui, M.; Aribi, F.; Chouikhi, F.; Sghaier, M.; Sghaier, M. Vulnerability of rural households’ livelihoods to climate change: Comparative analysis of mountainous and coastal areas of Tunisian arid zones. New Medit 2021, 20, 15–31. [Google Scholar]
- Poudel, S.; Funakawa, S.; Shinjo, H.; Mishra, B. Understanding households’ livelihood vulnerability to climate change in the Lamjung district of Nepal. Environ. Dev. Sustain. 2020, 22, 8159–8182. [Google Scholar] [CrossRef]
- Nguyen, P.T.M.; Nguyen, S.V.; Do, D.T.; Nguyen, Q.T.T.; Dinh, T.T.; Nguyen, H.P.T. A study on the poverty of mountain people depending on forests. J. Asian Financ. Econ. Bus. 2020, 7, 519–529. [Google Scholar] [CrossRef]
- Zhang, F.; Zhu, Y.; Zhao, X.; Zhang, Y.; Shi, L.; Liu, X. Spatial distribution and identification of hidden danger points of landslides based on geographical factors. Geomat. Inf. Sci. Wuhan Univ. 2020, 45, 1233–1244. [Google Scholar]
- Li, L.-M.; Wang, C.-Y.; Wen, Z.-Z.; Gao, J.; Xia, M.-F. Landslide displacement prediction based on the ICEEMDAN, ApEn and the CNN-LSTM models. J. Mt. Sci. 2023, 20, 1220–1231. [Google Scholar] [CrossRef]
- Li, Q.; Sun, P.; Li, B.; Mohiuddin, M. Impact of Climate Change on Rural Poverty Vulnerability from an Income Source Perspective: A Study Based on CHIPS2013 and County-Level Temperature Data in China. Int. J. Environ. Res. Public Health 2022, 19, 3328. [Google Scholar] [CrossRef]
- Arouri, M.; Nguyen, C.; Ben Youssef, A. Natural Disasters, Household Welfare, and Resilience: Evidence from Rural Vietnam. World Dev. 2015, 70, 59–77. [Google Scholar] [CrossRef]
- Ahmad, D.; Khurshid, S.; Afzal, M. Climate change vulnerability and multidimensional poverty in flood prone rural areas of Punjab, Pakistan: An application of multidimensional poverty index and livelihood vulnerability index. Environ. Dev. Sustain. 2024, 26, 13325–13352. [Google Scholar] [CrossRef]
- Yang, Y.P.; Guo, X.D. Universal basic education and the vulnerability to poverty: Evidence from compulsory education in rural China. J. Asia Pac. Econ. 2020, 25, 611–633. [Google Scholar] [CrossRef]
- McCulloch, N.; Calandrino, M. Vulnerability and chronic poverty in rural Sichuan. World Dev. 2003, 31, 611–628. [Google Scholar] [CrossRef]
- Hernández, J.E.; Zuluaga, B. Vulnerability to Multidimensional Poverty: An Application to Colombian Households. Soc. Indic. Res. 2022, 164, 345–371. [Google Scholar] [CrossRef]
- Sun, H.; Li, X.; Li, W. The Nexus between Credit Channels and Farm Household Vulnerability to Poverty: Evidence from Rural China. Sustainability 2020, 12, 3019. [Google Scholar] [CrossRef]
- Li, Y.; Huang, L. Assessing the impact of public transfer payments on the vulnerability of rural households to healthcare poverty in China. BMC Health Serv. Res. 2022, 22, 242. [Google Scholar] [CrossRef] [PubMed]
- Chen, S.; Liang, M.; Yang, W. Does Digital Financial Inclusion Reduce China’s Rural Household Vulnerability to Poverty: An Empirical Analysis From the Perspective of Household Entrepreneurship. SAGE Open 2022, 12, 21582440221102423. [Google Scholar] [CrossRef]
- Ji, Q.; Yang, J.; Chu, Y.; Chen, H.; Guo, X. Inequality of rural residents’ income in China since the targeted poverty alleviation strategy: New trends, causes, and policy implications. Res. Cold Arid. Reg. 2024, 16, 201–213. [Google Scholar] [CrossRef]
- Xie, X.; Sarntisart, S.; Uddin, M.N. The impact of education investment on regional poverty alleviation, dynamic constraints, and marginal benefits: A case study of Yunnan’s poor counties. Economies 2023, 11, 42. [Google Scholar] [CrossRef]
- Bui, L.K.; Huyen, H. Non-farm employment, food poverty and vulnerability in rural Vietnam. Environ. Dev. Sustain. 2021, 23, 7326–7357. [Google Scholar] [CrossRef]
- Lohmann, C.; Liefner, I. Location, non-agricultural Employment, and vulnerability to poverty in rural Thailand. Erdkunde 2009, 63, 141–160. [Google Scholar] [CrossRef]
- Eshetu, F.; Haji, J.; Ketema, M.; Mehare, A. Impact of Rural Out-Migration on Vulnerability to Rural Multidimensional Poverty in Southern Ethiopia. J. Int. Migr. Integr. 2023, 24, 1175–1209. [Google Scholar] [CrossRef]
- Fernandez Martinez, P.; de Castro-Pardo, M.; Martin Barroso, V.; Azevedo, J.C. Assessing Sustainable Rural Development Based on Ecosystem Services Vulnerability. Land 2020, 9, 222. [Google Scholar] [CrossRef]
- Cai, P.; Zhang, X.; Xing, Y.; Chen, F.; Qu, H.; Lou, J.; Li, Y. Evaluation of spatial form of rural ecological landscape and vulnerability of water ecological environment based on analytic hierarchy process. Open Geosci. 2023, 15, 20220540. [Google Scholar] [CrossRef]


| Period | Characteristics | Key Measures |
|---|---|---|
| 1949–1977 | Relief-based poverty alleviation | Provided fiscal subsidies and material relief to ensure minimum living standards for impoverished populations. |
| 1978–2011 | Promote poverty alleviation through institutional reform and solve the problem of food and clothing for the poor. | Implementing the household contract responsibility system in rural areas and promoting the reform of township enterprises. Carrying out regional poverty alleviation initiatives, such as the Western Development Strategy. |
| 2012–2020 | Targeted governance with clear objectives | Accurately identify people living in poverty. Based on local conditions and individual circumstances, develop distinctive industries, implement relocation poverty alleviation plans, strengthen education poverty alleviation, etc. |
| 2021–Present | In the post-poverty alleviation period, consolidating poverty alleviation achievements and effectively linking them with rural revitalization | Strengthen dynamic monitoring of low-income populations. Implement consumption assistance. Implement employment promotion measures to prevent return to poverty. |
| Type | Subtype | Indicator | Direction |
|---|---|---|---|
| A1. Exposure | B1. Ecological exposure | C1. Number of days with heavy rainfall | + * |
| C2. Relative rate of change in precipitation | + | ||
| C3. Area of rocky desertification | + | ||
| C4. Number of important geological hazard sites | + | ||
| C5. Industrial sulfur dioxide, wastewater, and soot emissions | + | ||
| C6. Surface PM2.5 concentration | + | ||
| B2. Social exposure | C7. Density of resident population | + | |
| C8. Urbanization rate | + | ||
| B3. Economic exposure | C9. Share of primary sector output | + | |
| C10. Per capita disposable income of rural residents | − | ||
| A2. Sensitivity | B4. Ecological sensitivity | C11. Average slope | + |
| C12. Average elevation | + | ||
| B5. Social sensitivity | C13. Per capita food possession | − | |
| C14. Proportion of population over 65 years old | + | ||
| C15. Proportion of population aged 15–64 | − | ||
| C16. Ratio of male to female population | + | ||
| C17. Number of traditional villages | + | ||
| B6. Economic sensitivity | C18. Share of output value of secondary and tertiary industries | − | |
| C19. Per capita arable land area | − | ||
| C20. Disposable income gap ratio between urban and rural residents | + | ||
| A3. Adaptability | B7. Ecological adaptability | C21. Average NDVI | + |
| C22. Number of environmental protection penalty cases | + | ||
| C23. Area of state-level nature reserves | + | ||
| B8. Social adaptability | C24. Number of educated population with tertiary education and above | + | |
| C25. Number of beds in medical and healthcare institutions per 1000 people | + | ||
| C26. Highway density | + | ||
| B9. Economic adaptability | C27. Fiscal expenditures on healthcare, education and social security | + | |
| C28. Local fiscal revenue | + | ||
| C29. GDP per capita | + | ||
| C30. Total retail sales of consumer goods | + |
| Principal Component | Name | Original Indicators Included |
|---|---|---|
| X1 | Level of rural social service security | C8. Urbanization rate, C13. Per capita food possession, C19. Per capita arable land area, C27. Fiscal expenditures on healthcare, education and social security, C29. GDP per capita, C26. Highway density |
| X2 | Rural population structure | C14. Proportion of population over 65 years old, C15. Proportion of population aged 15–64 |
| X3 | Resource and environmental loads | C5. Industrial sulfur dioxide, wastewater, and soot emissions, C7. Density of resident population |
| X4 | Geographical and environmental characteristics | C11. Average slope, C12. Average elevation |
| X5 | Level of development of non-agricultural industries | C18. Share of output value of secondary and tertiary industries, C20. Disposable income gap ratio between urban and rural residents |
| X6 | Urban-rural socio-economic balance | C10. Per capita disposable income of rural residents |
| X7 | Educational level | C24. Number of educated population with tertiary education and above |
| X8 | Level of local finance | C28. Local fiscal revenue |
| X9 | Geological disaster risk | C4. Number of important geological hazard sites |
| X10 | Climate risk | C1. Number of days with heavy rainfall |
| Principal Component Dimension | 2012 | Rank | 2017 | Rank | 2022 | Rank |
|---|---|---|---|---|---|---|
| X1 Level of rural social service security | 0.2387 | 2 | 0.1719 | 1 | 0.2469 | 1 |
| X2 Rural population structure | 0.0098 | 10 | 0.0370 | 10 | 0.0401 | 9 |
| X3 Resource and environ-mental loads | 0.1305 | 5 | 0.1186 | 3 | 0.1646 | 3 |
| X4 Geographical and environmental characteristics | 0.0531 | 9 | 0.0675 | 7 | 0.0550 | 8 |
| X5 Level of non-agricultural industries | 0.1154 | 6 | 0.1075 | 4 | 0.1220 | 4 |
| X6 Urban-rural socio-economic balance | 0.0727 | 8 | 0.0409 | 9 | 0.0559 | 7 |
| X7 Educational level | 0.1516 | 4 | 0.0601 | 8 | 0.0076 | 10 |
| X8 Level of local finance | 0.0870 | 7 | 0.1284 | 2 | 0.0695 | 6 |
| X9 Geological disaster risk | 0.2863 | 3 | 0.0793 | 6 | 0.2451 | 2 |
| X10 Climate risk | 0.3543 | 1 | 0.1061 | 5 | 0.1042 | 5 |
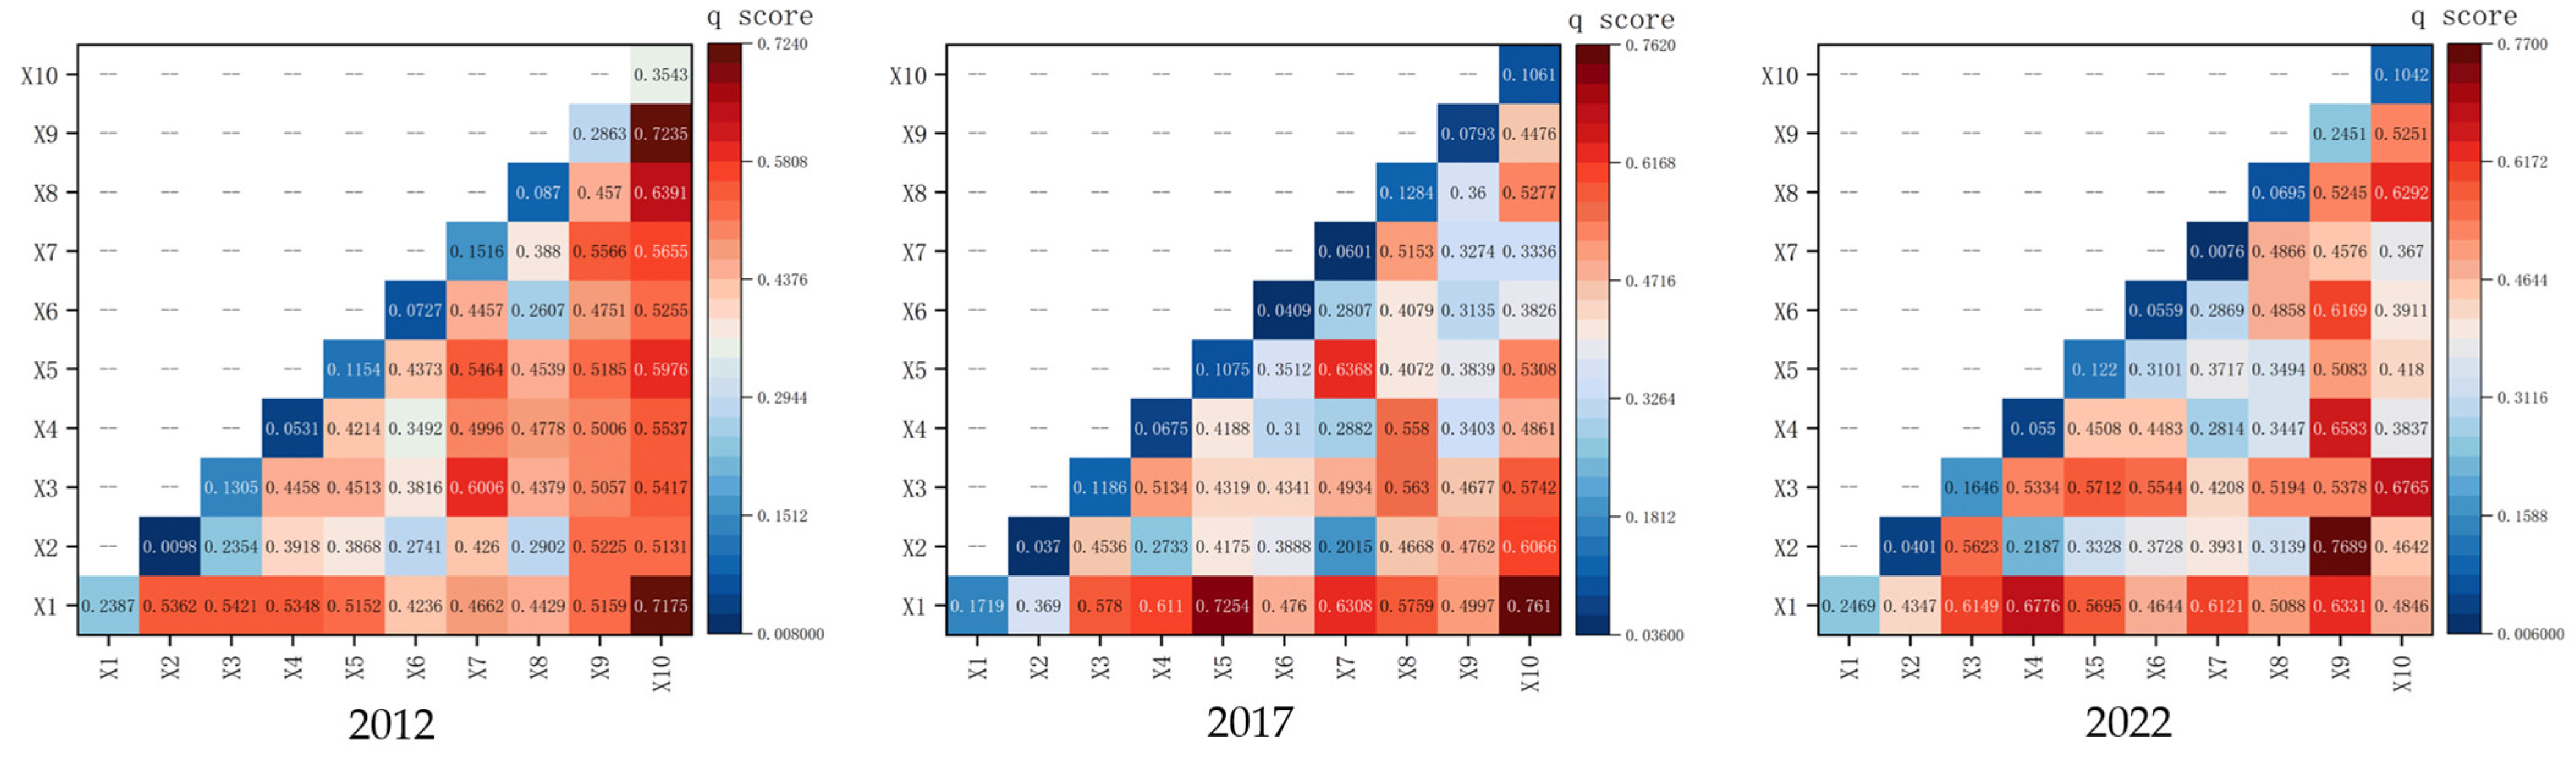
| Year | Main Interaction Principal Components with Top 3 | ||
|---|---|---|---|
| 1 | 2 | 3 | |
| 2012 | X9∩X10 (0.7235 *) | X1∩X10 (0.7175) | X3∩X7 (0.6006) |
| 2017 | X1∩X10 (0.7610) | X1∩X5 (0.7254) | X5∩X7 (0.6368) |
| 2022 | X2∩X9 (0.7689) | X1∩X4 (0.6776) | X3∩X10 (0.6765) |
Disclaimer/Publisher’s Note: The statements, opinions and data contained in all publications are solely those of the individual author(s) and contributor(s) and not of MDPI and/or the editor(s). MDPI and/or the editor(s) disclaim responsibility for any injury to people or property resulting from any ideas, methods, instructions or products referred to in the content. |
© 2025 by the authors. Licensee MDPI, Basel, Switzerland. This article is an open access article distributed under the terms and conditions of the Creative Commons Attribution (CC BY) license (https://creativecommons.org/licenses/by/4.0/).
Share and Cite
Li, G.; He, S.; Ma, W.; Huang, Z.; Peng, Y.; Ding, G. Assessing Rural Development Vulnerability Index: A Spatio-Temporal Analysis of Post-Poverty Alleviation Areas in Hunan, China. Sustainability 2025, 17, 6033. https://doi.org/10.3390/su17136033
Li G, He S, Ma W, Huang Z, Peng Y, Ding G. Assessing Rural Development Vulnerability Index: A Spatio-Temporal Analysis of Post-Poverty Alleviation Areas in Hunan, China. Sustainability. 2025; 17(13):6033. https://doi.org/10.3390/su17136033
Chicago/Turabian StyleLi, Guangyu, Shaoyao He, Wei Ma, Zhenrong Huang, Yiyan Peng, and Guosheng Ding. 2025. "Assessing Rural Development Vulnerability Index: A Spatio-Temporal Analysis of Post-Poverty Alleviation Areas in Hunan, China" Sustainability 17, no. 13: 6033. https://doi.org/10.3390/su17136033
APA StyleLi, G., He, S., Ma, W., Huang, Z., Peng, Y., & Ding, G. (2025). Assessing Rural Development Vulnerability Index: A Spatio-Temporal Analysis of Post-Poverty Alleviation Areas in Hunan, China. Sustainability, 17(13), 6033. https://doi.org/10.3390/su17136033