

Research on Resilience Evaluation and Prediction of Urban Ecosystems in Plateau and Mountainous Area: Case Study of Kunming City

 ,
,
Abstract
1. Introduction
2. Methods
2.1. Research Steps
2.2. Data Sources
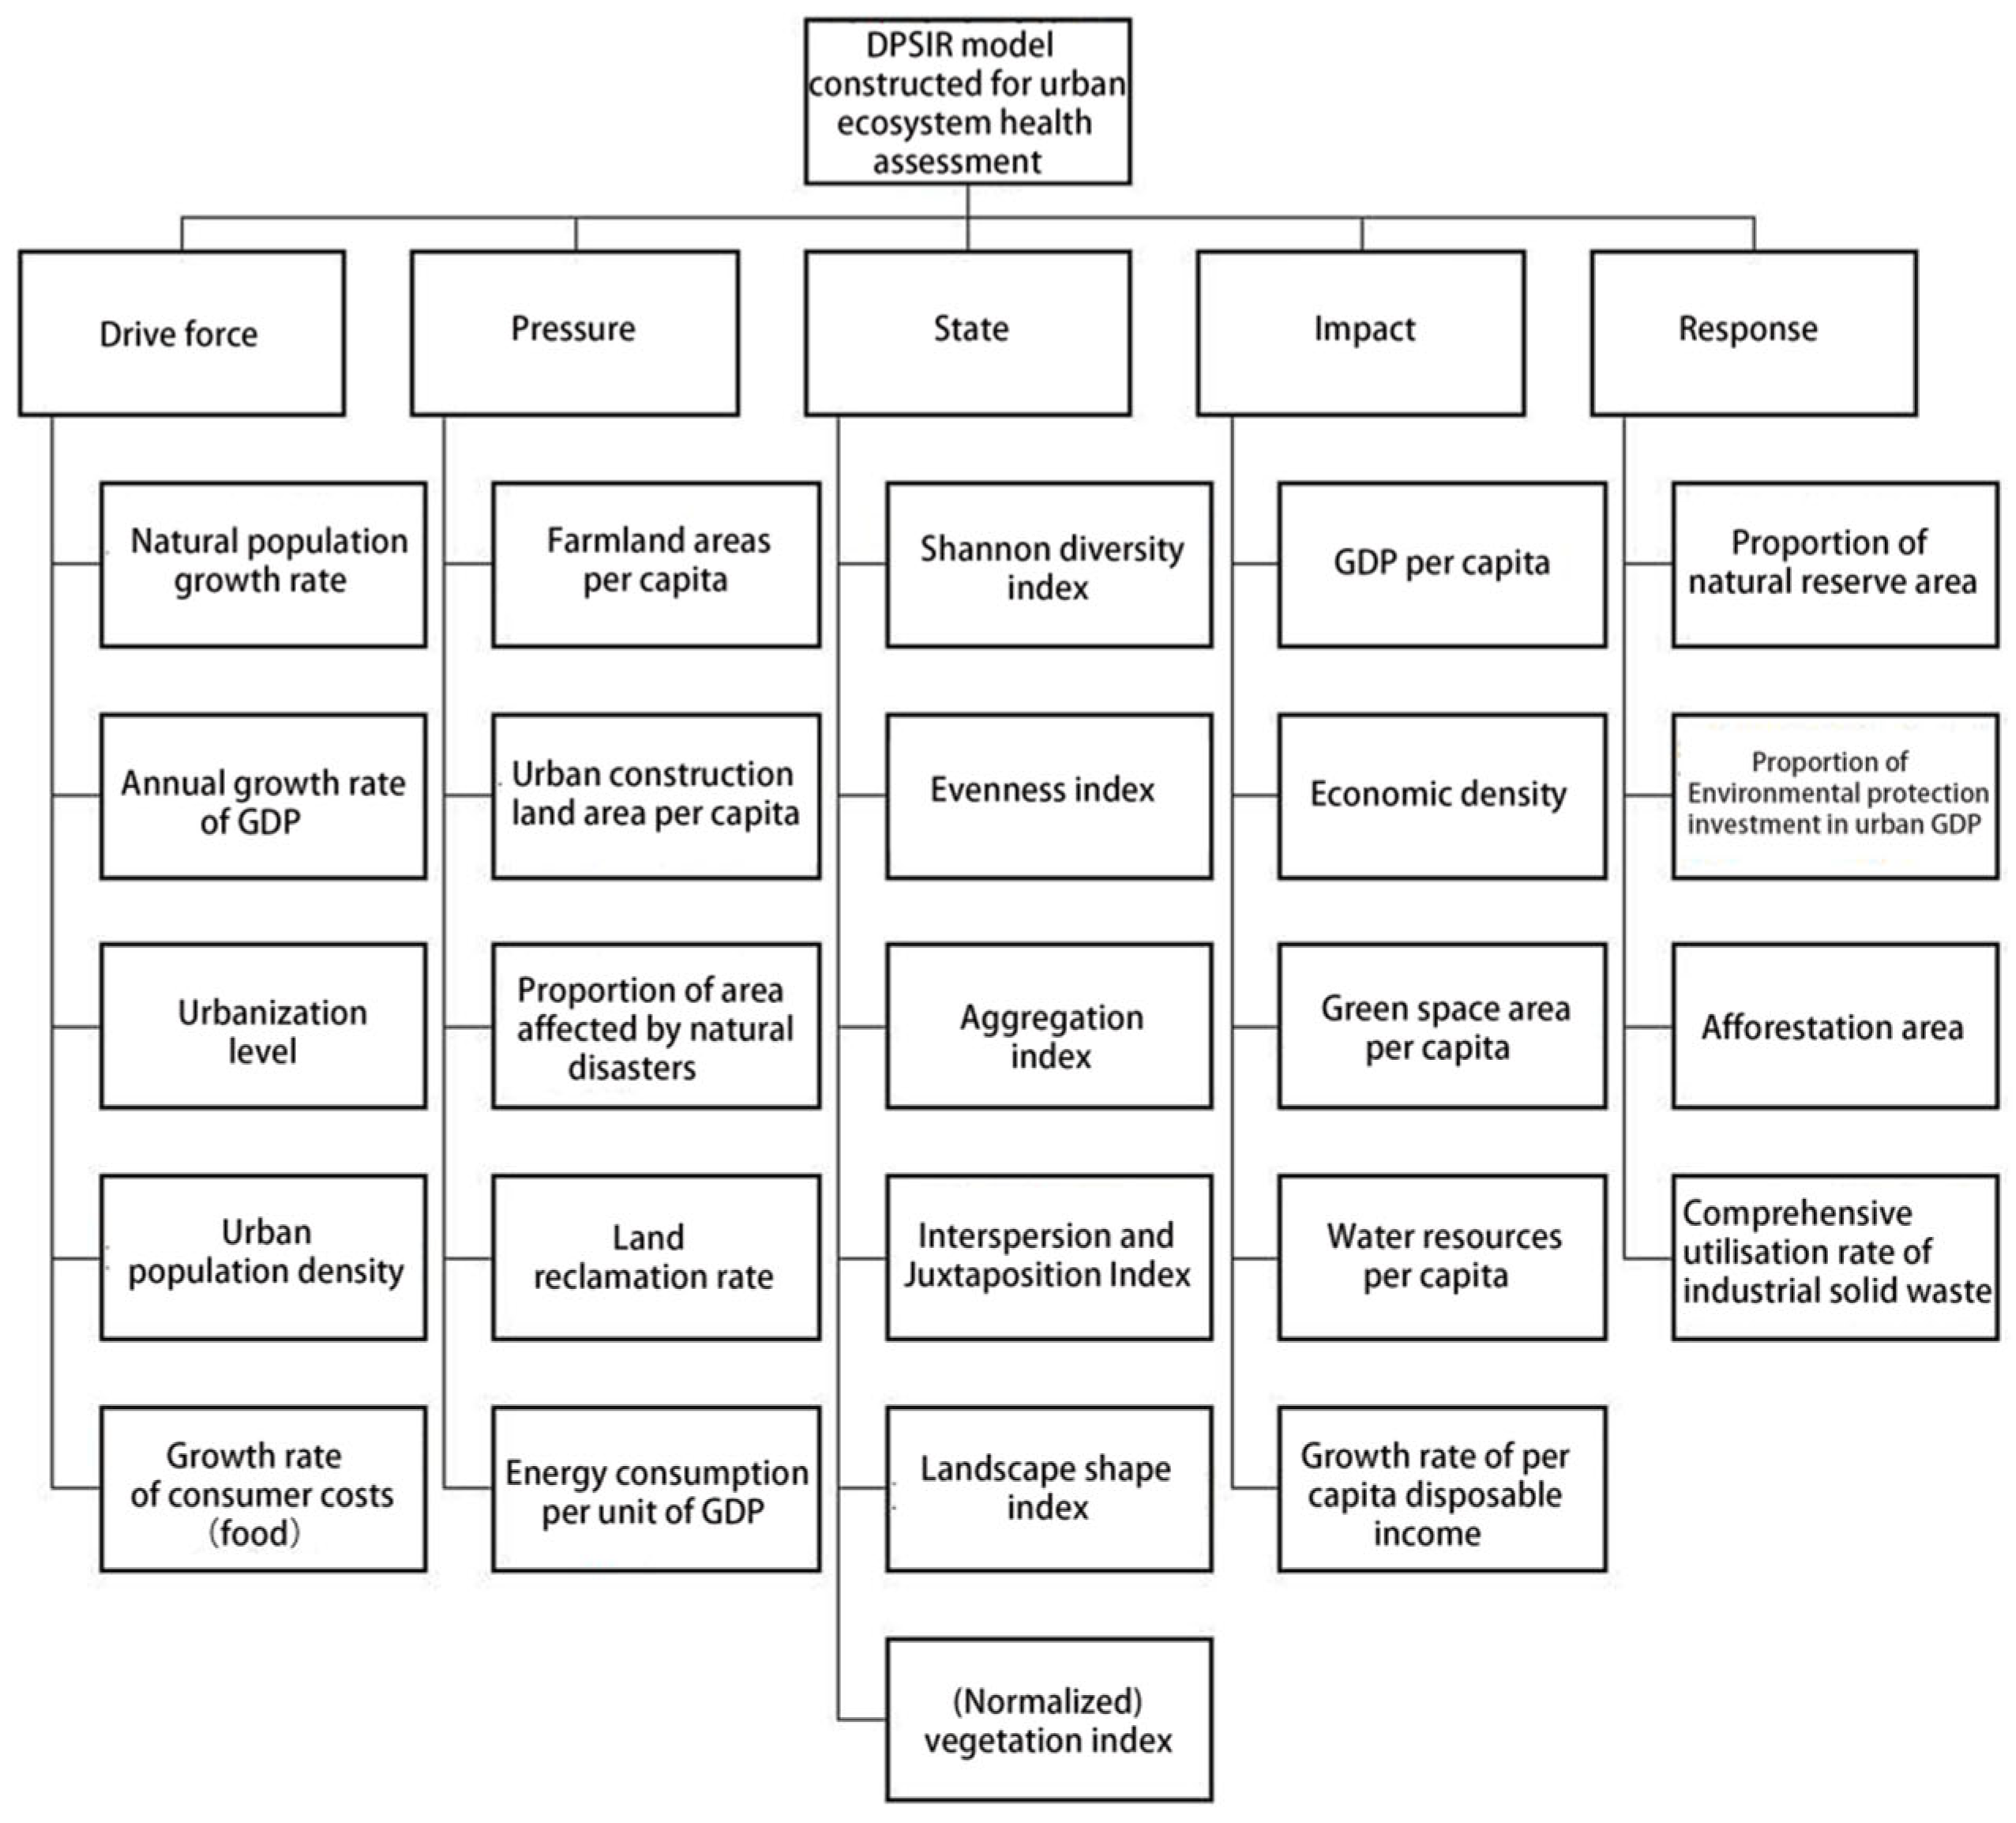
2.3. The DPSIR Model Construction
2.4. Entire-Array Polygon Indicator Method
2.5. Gray System Forecasting Method
3. Evaluation Results of Urban Ecosystem Resilience in Kunming
3.1. Calculation Results of Ecosystem Resilience Evaluation Indicators in Kunming
3.2. Construction and Analysis Results of Entire-Array Polygon Diagrams for Individual Indicators
3.3. Calculation of the Comprehensive Index Values and Assessment of the Resilience Level
3.4. Prediction of Ecosystem Resilience Status in Kunming
4. Discussion
4.1. Assessing the Resilience Status of Plateau-Mountainous Urban Ecosystems Based on the DPSIR Model
4.2. Strategies to Improve the UER in Plateau-Mountainous Areas
5. Conclusions
Author Contributions
Funding
Institutional Review Board Statement
Informed Consent Statement
Data Availability Statement
Conflicts of Interest
Appendix A
Indicator Selection Questionnaire

| Factors | Definition |
|---|---|
| Driving forces factors | The potential causes of changes in urban ecosystems are mainly indicators of the impact of changes in society, economy, population, and corresponding lifestyles and production modes on ecosystems. |
| Pressure factors | The direct cause of changes in urban ecosystems. |
| State factors | The state of the urban ecosystem under the influence of the above stressors. |
| Impact factors | The state of the urban ecosystem under pressure has in turn the impact on the social and economic structure. |
| Response factors | Measures taken by the government and social organizations to prevent, mitigate, and improve environmental changes by using artificial means. |
| Target Layer | Criterion Layer | Indicator Layer (Scenario Layer) | |
|---|---|---|---|
| Specific Metrics | Indicator Calculation Method and Interpretation | ||
| A health evaluation model of urban ecological system in Kunming | Driving forces factors | Gross domestic product (GDP) annual growth rate | The ratio of GDP growth in the study area to the GDP of the previous year |
| Natural population growth rate | Natural growth rate of the population = birth rate in the current year - mortality rate in the current year | ||
| Engel’s coefficient | The ratio of household food expenditure to total household consumption expenditure | ||
| Level of urbanization | Level of urbanization = total urban population/total population × 100% | ||
| Urban population density | Population density = total population in a geographic area/land area in a geographic area | ||
| Growth rate of primary and secondary industries | The percentage of the growth of the primary and secondary industries in the study area in the previous year’s GDP | ||
| The consumer price index increased Growth Rate (Food, Tobacco & Alcohol) | In the study area, the growth of the price index of food, tobacco and alcohol accounted for the percentage of the consumer price index of residential buildings in the previous year | ||
| Added value of industry | The increase in the output value of the industrial sector in the study area compared with the previous year | ||
| Pressure factors | Total amount of wastewater discharged | The amount of wastewater discharged in the study area during the year (including domestic and industrial wastewater) | |
| Change in energy consumption per unit of GDP (increase/decrease) | Energy consumption per unit of GDP per 10,000 yuan of the study area in that year | ||
| Change in water consumption per unit of GDP (increase/decrease) | Water consumption per 10,000 yuan of GDP per unit of the study area in that year | ||
| Total road mileage | The length of roads constructed within the study area during the year | ||
| Cultivated land area per capita | Cultivated land per capita = Total cultivated land/Total permanent population | ||
| Per capita urban construction land accumulate | Urban construction land area per capita = total urban construction land area/total permanent resident population | ||
| Land reclamation rate | Land reclamation rate = cultivated area/total land area × 100% | ||
| Proportion of natural disasters affected | Proportion of area affected by natural disasters = area affected by natural natural disasters/area of cultivated land × 100% | ||
| State factors | Landscape fragmentation index | Characterize the degree of fragmentation of the landscape | |
| Landscape evenness index | To characterize the uniformity of the distribution of different patch types in the landscape | ||
| Landscape diversity index | Reflects the complexity and variability of the various patch types in the landscape | ||
| Landscape agglomeration index | Reflects the degree of non-randomness or aggregation of different patch types in the landscape | ||
| Scatter and Parallel Indiex | It reflects the dispersion and juxtaposition of various types of patches under specific habitat conditions, and can characterize the habitat characteristics of mountain landforms and confined natural conditions | ||
| Landscape shape index | Patch shape information that reflects the entire landscape | ||
| Landscape sprawl | Reflects the degree of aggregation or extension of different patches in the landscape | ||
| Air Pollution Index | The frequency at which air in the study area was assessed as air pollution during the year | ||
| Number of natural disasters | Statistics on the number of natural disasters that occurred within the study area during the year | ||
| Water and soil loss rate | Soil erosion rate = soil erosion area/total area of the area × 100% | ||
| Impact factors | Rate of change in exhaust emissions (increase/decrease) | The percentage of the change in exhaust gas emissions in the study area in the previous year of the total exhaust gas emissions | |
| Rate of change in wastewater discharge (increase/decrease) | The percentage of the change in wastewater discharge in the study area in the previous year of the total exhaust gas discharge | ||
| Area of public green space per capita | Green space per capita = Urban green space/Total urban population × 100% | ||
| GDP per capita | GDP per capita = total GDP of the region/total population | ||
| Economic density | Economic Density = Total Regional GDP/Total Land Area | ||
| Per capita disposable income of residents Rate of change (increase/decrease) | The percentage of change in per capita disposable income in the study area in the previous year | ||
| Water resources per capita | The percentage of total water resources in the study area as a percentage of the total resident population | ||
| Forest cover | The percentage of forest cover in the study area of all land area during the year | ||
| Response factors | Industrial wastewater treatment rate | Efficiency of industrial wastewater treatment | |
| Domestic sewage treatment rate | Efficiency of domestic sewage treatment | ||
| Perfection of environmental regulations and systems | The number of laws and regulations related to environmental protection formulated in the study area during the year | ||
| Industrial Solid Waste Synthesis utilization rate | The percentage of the comprehensive utilization of industrial solid waste in the amount of industrial solid waste generated | ||
| Area of soil erosion prevention and control | The area of soil erosion prevention and control by relevant government departments | ||
| Soil erosion control input | The amount of investment made by relevant government departments in the prevention and control of soil erosion | ||
| Proportion of nature reserves | The percentage of nature reserves in the total land area of the study area | ||
| Environmental governance as a percentage of GDP | The percentage of GDP spent by relevant government departments on enviroArea of planted forestsnmental protection | ||
| Area of planted forests | The area of planted forests within the study area during the year | ||
| Importance Level | Meaning | Description |
|---|---|---|
| 1 | Equally important | The two factors are of equal importance |
| 3 | Slightly more important | Comparing the two factors, one factor is slightly more important than the other |
| 5 | Obviously important | Comparing the two factors, one factor is significantly more important than the other |
| 7 | Very important | Comparing the two factors, one factor is more important than the other |
| 9 | Extremely important | Comparing the two factors, one factor is more important than the other |
| Factor A | Comparison of Importance | Factor B | |||||||||
|---|---|---|---|---|---|---|---|---|---|---|---|
| 9 | 7 | 5 | 3 | 1 | 3 | 5 | 7 | 9 | |||
| Driving forces factors layer | Gross domestic product (GDP) annual growth rate | Natural population growth rate | |||||||||
| Engel’s coefficient | |||||||||||
| Level of urbanization | |||||||||||
| Urban population density | |||||||||||
| Growth rate of primary and secondary industries | |||||||||||
| The consumer price index increased Growth Rate (Food, Tobacco & Alcohol) | |||||||||||
| Added value of industry | |||||||||||
References
- Mageau, M.T.; Costanza, R.; Ulanowicz, R.E. Quantifying the Trends Expected in Developing Ecosystems. Ecol. Model. 1998, 112, 1–22. [Google Scholar] [CrossRef]
- DeStefano, S. Wildlife Responses to Climate Change, North American Case Studies. Ecol. Econ. 2004, 49, 487–488. [Google Scholar] [CrossRef]
- Marina, A. Urban Form and Ecosystem Dynamics: Empirical Evidence and Practical Implications. In Achieving Sustainable Urban Form; Routledge: London, UK, 2013; pp. 84–96. ISBN 978-0-203-82792-5. [Google Scholar]
- CSIRO. A Research Prospectus for Urban Resilience: A Resilience Alliance Initiative for Transitioning Urban Systems towards Sustainable Futures; CSIRO: Canberra, Australia, 2007.
- Ahern, J. From Fail-Safe to Safe-to-Fail: Sustainability and Resilience in the New Urban World. Landsc. Urban Plan. 2011, 100, 341–343. [Google Scholar] [CrossRef]
- Adger, W.N. Social and Ecological Resilience: Are They Related? Prog. Hum. Geogr. 2000, 24, 347–364. [Google Scholar] [CrossRef]
- Marina, A.; Marzluff, J. Ecological resilience in urban ecosystems: Linking urban patterns to human and ecological functions. Urban Ecosyst. 2004, 7, 241–265. [Google Scholar]
- Liu, Y.X.; Peng, J.; Wang, A.; Xie, P.; Han, Y.N. New research progress and trends in ecosystem health. Acta Ecol. Sin. 2015, 18, 5920–5930. [Google Scholar] [CrossRef]
- Rockefeller Foundation ARUP. 2014. Available online: https://www.arup.com/insights/city-resilience-framework/ (accessed on 16 June 2016).
- U.S. Indian Ocean Tsunami Warning System Program. How Resilient Is Your Coastal Community? A Guide for Evaluating Coastal Community Resilience to Tsunamis and Other Hazards; U.S. Agency for International Development: Washington, DC, USA, 2007; ISBN 978-0-9742991-4-3. [Google Scholar]
- Prasad, N.; Ranghieri, F.; Shah, F.; Trohanis, Z.; Kessler, E.; Sinha, R. Climate Resilient Cities: A Primer on Reducing Vulnerabilities to Disasters; The World Bank: Washington, DC, USA, 2008; ISBN 978-0-8213-7766-6. [Google Scholar]
- UNDRR. How to Make Cities More Resilient: A Handbook for Local Government Leaders; Making Cities Resilient 2030; UNDRR: Geneva, Switzerland, 2017. [Google Scholar]
- Goodness, J.; Andersson, E.; Anderson, P.M.; Elmqvist, T. Exploring the links between functional traits and cultural ecosystem services to enhance urban ecosystem management. Ecol. Indic. 2016, 70, 597–605. [Google Scholar] [CrossRef]
- Organization of Economic Cooperation and Development. OECD Core Set of Indicators for Environmental Performance; Environment Directorate: Paris, France, 1993. [Google Scholar]
- Indicators of Sustainable Development: Framework and Methodologies; Unies, N., Ed.; United Nations: New York, NY, USA, 1996; ISBN 978-92-1-104470-6. [Google Scholar]
- Europe’s Environment: The Second Assessment: An Overview; European Environment Agency, Ed.; Office for Official Publ. of the European Communities: Luxembourg, 1998; ISBN 978-92-9167-087-1.
- Bottero, M.; Datola, G.; De Angelis, E. A System Dynamics Model and Analytic Network Process: An Integrated Approach to Investigate Urban Resilience. Land 2020, 9, 242. [Google Scholar] [CrossRef]
- Feofilovs, M.; Romagnoli, F. Dynamic Assessment of Urban Resilience to Natural Hazards. Int. J. Disaster Risk Reduct. 2021, 62, 102328. [Google Scholar] [CrossRef]
- Datola, G.; Bottero, M.; De Angelis, E.; Romagnoli, F. Operationalising Resilience: A Methodological Framework for Assessing Urban Resilience through System Dynamics Model. Ecol. Model. 2022, 465, 109851. [Google Scholar] [CrossRef]
- Tao, Z.; Grove, M. A Discourse on Landscape Architecture: At the Intersection of Design, Ecology, Resilience, and Research. Landsc. Archit. Front. 2018, 6, 54. [Google Scholar] [CrossRef]
- Feng, X.; Xiu, C.; Bai, L.; Zhong, Y.; Wei, Y. Comprehensive Evaluation of Urban Resilience Based on the Perspective of Landscape Pattern: A Case Study of Shenyang City. Cities 2020, 104, 102722. [Google Scholar] [CrossRef]
- Gedefaw, A.; Atzberger, C.; Bauer, T.; Agegnehu, S.; Mansberger, R. Analysis of Land Cover Change Detection in Gozamin District, Ethiopia: From Remote Sensing and DPSIR Perspectives. Sustainability 2020, 12, 4534. [Google Scholar] [CrossRef]
- Ruan, J.; Chen, Y.; Yang, Z. Assessment of Temporal and Spatial Progress of Urban Resilience in Guangzhou under Rainstorm Scenarios. Int. J. Disaster Risk Reduct. 2021, 66, 102578. [Google Scholar] [CrossRef]
- Chen, X.; Rong, F.; Li, S. Driving Force–Pressure–State–Impact–Response-Based Evaluation of Rural Human Settlements’ Resilience and Their Influencing Factors: Evidence from Guangdong, China. Sustainability 2024, 16, 813. [Google Scholar] [CrossRef]
- Van Ginkel, K.C.H.; Hoekstra, A.Y.; Buurman, J.; Hogeboom, R.J. Urban Water Security Dashboard: Systems Approach to Characterizing the Water Security of Cities. J. Water Resour. Plan. Manag. 2018, 144, 04018075. [Google Scholar] [CrossRef]
- Connolly, J.J. From Systems Thinking to Systemic Action: Social Vulnerability and the Institutional Challenge of Urban Resilience. City Community 2018, 17, 8–11. [Google Scholar] [CrossRef]
- Gould, K.A.; Lewis, T.L. From Green Gentrification to Resilience Gentrification: An Example from Brooklyn. City Community 2018, 17, 12–15. [Google Scholar] [CrossRef]
- Shokry, G.; Connolly, J.J.; Anguelovski, I. Understanding Climate Gentrification and Shifting Landscapes of Protection and Vulnerability in Green Resilient Philadelphia. Urban Clim. 2020, 31, 100539. [Google Scholar] [CrossRef]
- Li, G.; Kou, C.; Wen, F. The Dynamic Development Process of Urban Resilience: From the Perspective of Interaction and Feedback. Cities 2021, 114, 103206. [Google Scholar] [CrossRef]
- Agbossou, I. Urban Resilience Key Metrics Thinking and Computing Using 3D Spatio-Temporal Forecasting Algorithms. In Computational Science and Its Applications—ICCSA 2023; Lecture Notes in Computer Science; Gervasi, O., Murgante, B., Taniar, D., Apduhan, B.O., Braga, A.C., Garau, C., Stratigea, A., Eds.; Springer: Cham, The Switzerland, 2023; Volume 13957, pp. 332–350. ISBN 978-3-031-36807-3. [Google Scholar]
- Mu, X.; Fang, C.; Yang, Z. Spatio-Temporal Evolution and Dynamic Simulation of the Urban Resilience of Beijing-Tianjin-Hebei Urban Agglomeration. J. Geogr. Sci. 2022, 32, 1766–1790. [Google Scholar] [CrossRef]
- Li, H.; Yang, S.-H.; Yao, W.-J.; Wang, S.-Q.; Yi, N.; Liu, D.-B. Evaluation of Ecological Conservation Importance via GIS Approach in the Middle Reaches of Nujiang Watershed: Evaluation of Ecological Conservation Importance via GIS Approach in the Middle Reaches of Nujiang Watershed. Chin. J. Eco-Agric. 2011, 19, 947–953. [Google Scholar] [CrossRef]
- Kunming Bureau of Statistics. Kunming Statistical Yearbook 2007; China Statistics Press: Beijing, China, 2008; ISBN 978-7-5037-5221-6.
- Kunming Bureau of Statistics. Kunming Statistical Yearbook 2012; China Statistics Press: Beijing, China, 2013; ISBN 978-7-5037-6666-4.
- National Economic and Social Development Statistics Bulletin of Kunming in 2016. 2017. Available online: https://www.km.gov.cn/c/2017-07-20/3410539.shtml (accessed on 25 April 2025).
- Yunnan Water Resources Bulletin 2011. 2023. Available online: https://shuiwu.km.gov.cn/c/2023-10-08/4796520.shtml (accessed on 25 April 2025).
- Kunming Water Resources Bulletin 2016. 2023. Available online: https://shuiwu.km.gov.cn/c/2023-10-08/2122407.shtml (accessed on 25 April 2025).
- Nature Reserve List of Yunnan Province 2011. 2012. Available online: https://www.mee.gov.cn/ywgz/zrstbh/zrbhdjg/201208/t20120824_235174.shtml (accessed on 25 April 2025).
- Department of Natural Ecology Protection. National Nature Reserve List 2011; China Environmental Press: Beijing, China, 2012.
- Department of Natural Ecology Protection. National Nature Reserve List 2014; China Environmental Press: Beijing, China, 2015.
- Environmental Status Bulletin of Kunming City 2016. 2017. Available online: http://sthjj.km.gov.cn/c/2017-11-07/3977515.shtml (accessed on 25 April 2025).
- Wang, Y.R.; Zhang, D.H.; Wu, Y.L. The spatio-temporal changes of forest ecological security based on DPSIR model: Cases study in Zhejiang Province. Acta Ecol. Sin. 2020, 40, 2793–2801. [Google Scholar] [CrossRef]
- Yang, Q.; Lin, A.; Zhao, Z.; Zou, L.; Sun, C. Assessment of Urban Ecosystem Health Based on Entropy Weight Extension Decision Model in Urban Agglomeration. Sustainability 2016, 8, 869. [Google Scholar] [CrossRef]
- Liu, P.; Rong, L.; Teng, F. The Evaluation of Ecosystem Health Based on Hybrid Todim Method for Chinese Case. Technol. Econ. Dev. Econ. 2019, 25, 542–570. [Google Scholar] [CrossRef]
- Han, H.; Li, H.; Zhang, K. Urban Water Ecosystem Health Evaluation Based on the Improved Fuzzy Matter-Element Extension Assessment Model: Case Study from Zhengzhou City, China. Math. Probl. Eng. 2019, 2019, 7502342. [Google Scholar] [CrossRef]
- Zhang, F.T.; Wang, L.C.; Su, W.C. Evaluation of land ecological security in Chongqing based on the matter-element analysis-DPSIR model. China Environ. Sci. 2016, 36, 3126–3134. [Google Scholar]
- Xu, H.T.; Zhou, L.F.; Cheng, Q. Study on ecosystem health evaluation and risk assessment for Linghekou wetlands based on a PSR model. Acta Ecol. Sin. 2017, 37, 8264–8274. [Google Scholar] [CrossRef]
- Li, W.; Xie, S.; Wang, Y.; Huang, J.; Cheng, X. Effects of Urban Expansion on Ecosystem Health in Southwest China from a Multi-Perspective Analysis. J. Clean. Prod. 2021, 294, 126341. [Google Scholar] [CrossRef]
- Zhou, W.; Cao, Y.G.; Qiao, L.Y. Urban Land Intensive Use Assessment Based on the Entire-Array-Polygon Indictor Method. China Land Sci. 2012, 4, 84–90. [Google Scholar] [CrossRef]
- Li, H.; Liao, B.; Guo, J.; Huang, Y.; Chen, P.; Lin, X. History and Future: Evaluation and Conservation of Campus Heritage Values Based on Fully Arranged Polygon Graphical Indicator Method. Landsc. Archit. Acad. J. 2024, 41, 64–73. [Google Scholar]
- Cheng, L.; Dong, J. Suitability Evaluation of “Linking the Increase with Decrease in Land Used for Urban and Rural Con-striction” Based on Entire-Array-Polygon Evaluation Model. Res. Agric. Mod. 2013, 4, 472–476. [Google Scholar]
- Quan, J.T.; Yang, Y.F.; Zhou, J.X. Analysis and Prediction of Spatial and Temporal Evolution of Land Resource Carrying Capacity in Henan Province. Res. Soil Water Conserv. 2020, 2, 315–322. [Google Scholar] [CrossRef]
- United Nations Human Settlements Programme. World Cities Report 2016: Urbanization and Development: Emerging Futures; UN-Habitat: Nairobi, Kenya, 2016; ISBN 978-92-1-132708-3. [Google Scholar]
- McPhearson, T.; Cook, E.M.; Berbés-Blázquez, M.; Cheng, C.; Grimm, N.B.; Andersson, E.; Barbosa, O.; Chandler, D.G.; Chang, H.; Chester, M.V.; et al. A Social-Ecological-Technological Systems Framework for Urban Ecosystem Services. One Earth 2022, 5, 505–518. [Google Scholar] [CrossRef]
- Assche, K.V.; Verschraegen, G.; Valentinov, V.; Gruezmacher, M. The Social, the Ecological, and the Adaptive. Von Bertalanffy’s General Systems Theory and the Adaptive Governance of Social-Ecological Systems. Syst. Res. Behav. Sci. 2019, 36, 308–321. [Google Scholar] [CrossRef]
- Gupta, A.K.; Singh, S.; Wajih, S.A.; Mani, N.; Singh, A.K. Urban Resilience and Sustainability Through Peri-Urban Ecosystems: Integrating Climate Change Adaptation and Disaster Risk Reduction; Gorakhpur Environmental Action Group: Gorakhpur, India, 2017; Volume 14, pp. 5–28. [Google Scholar]
- Dai, W.; Sun, Y.; Han, M.; Taneha, K.B. Resilient Planning of Delta Cities Under Climate Change. City Plan. Rev. 2017, 12, 26–34. [Google Scholar]

| Factor | No. | Indicator | 2006 | 2011 | 2016 | |||
|---|---|---|---|---|---|---|---|---|
| Calculated Results | Standard Value | Calculated Results | Standard Value | Calculated Results | Standard Value | |||
| Driving force | 1 | Natural population growth (%) | 6.47 | −0.622 | 5.66 | −0.664 | 6.21 | −0.635 |
| 2 | Annual GDP growth (%) | 12.07 | −0.366 | 18.36 | −0.136 | 8.32 | −0.531 | |
| 3 | Urbanization level (%) | 58.99 | 0.662 | 66.00 | 0.739 | 71.05 | 0.788 | |
| 4 | Urban population density (persons/hm2) | 2.928 | −0.817 | 3.087 | −0.807 | 3.202 | −0.801 | |
| 5 | Resident consumption price growth (food) (%) | 1.8 | −0.885 | 10.8 | −0.420 | 3.1 | −0.807 | |
| Pressure | 6 | Per capita farmland (hm2/person) | 0.077 | −0.997 | 0.067 | −0.998 | 0.065 | −0.998 |
| 7 | Per capita urban construction land (hm2/person) | 0.048 | −0.999 | 0.053 | −0.998 | 0.069 | −0.997 | |
| 8 | Land reclamation and cultivation rate (%) | 22.54 | −0.007 | 20.72 | −0.061 | 20.89 | −0.056 | |
| 9 | Proportion of natural disaster-stricken area (%) | 19.89 | −0.087 | 32.8 | 0.247 | 5.23 | −0.687 | |
| 10 | Unit GDP energy consumption (ton standard coal/10,000 CNY) | 1.143 | −0.927 | 0.557 | −0.965 | 0.547 | −0.966 | |
| State | 11 | Evenness Index (EI) | 0.7968 | −0.949 | 0.7864 | −0.950 | 0.7121 | −0.955 |
| 12 | Shannon Diversity Index (SHDI) | 1.5506 | −0.901 | 1.5303 | −0.902 | 1.3856 | −0.911 | |
| 13 | Aggregation Index (AI) | 97.1776 | 0.986 | 97.2779 | 0.987 | 97.6256 | 0.989 | |
| 14 | Interspersion and Juxtaposition Index (IJI) | 69.5997 | 0.954 | 71.8750 | 0.932 | 53.2194 | 0.838 | |
| 15 | Landscape Shape Index (LSI) | 92.1164 | 0.774 | 88.8813 | 0.796 | 76.6895 | 0.590 | |
| 16 | Normalized Vegetation Index (NDVI) | 0.1184 | −0.994 | 0.1542 | −0.991 | 0.1572 | −0.992 | |
| Impact | 17 | Per capita GDP | 1.976 | −0.874 | 3.869 | −0.762 | 6.392 | −0.626 |
| 18 | Economic density (10,000 CNY/hm2) | 5.79 | −0.657 | 11.94 | −0.372 | 20.47 | −0.069 | |
| 19 | Per capita disposable income growth (%) | 10.2 | −0.446 | 11.0 | −0.411 | 8.2 | −0.537 | |
| 20 | Per capita green space area (m2/person) | 12.72 | −0.340 | 25.36 | 0.070 | 23.63 | 0.024 | |
| 21 | Per capita water resources (m3/person) | 0.081 | −0.996 | 0.035 | −1.000 | 0.088 | −0.995 | |
| Response | 22 | Proportion of natural reserve area (%) | 14.03 | −0.289 | 3.44 | −0.787 | 2.84 | −0.822 |
| 23 | Proportion of environmental protection investment to GDP (%) | 2.82 | −0.823 | 5.30 | −0.683 | 3.71 | −0.771 | |
| 24 | Overall utilization of industrial solid waste (%) | 92.62 | 0.958 | 71.35 | 0.791 | 99.36 | 1.000 | |
| 25 | Afforestation area (10,000 mu) | 0.53 | −0.967 | 37.16 | 0.335 | 80.30 | 0.868 | |
| Indicator Name | Indicator Definition | Calculation Method |
|---|---|---|
| Evenness Index (EI) | An index that reflects the uniformity of area distribution among different land use types. | where is the Maximum Diversity Index. |
| Shannon Diversity Index (SHDI) | An index that reflects landscape diversity. | where is the number of land use types. |
| Aggregation Index (AI) | An index that reflects the degree of clustering of a specific landscape type. | where . |
| Interspersion and Juxtaposition Index (IJI) | An index that reflects the overall interspersion and juxtaposition of different patch types in the landscape. | It measures the percentage probability that a given patch type is adjacent to other patch types in the landscape. |
| Landscape Shape Index (LSI) | An index that reflects the overall shape characteristics of the landscape. It not only considers the shape information of individual patches but also reveals the degree of aggregation or dispersion among different patches. | where is the total area of the landscape. |
| Normalized Vegetation Index (NDVI) | An indicator that reflects the vegetation productivity of the ecosystem. | where is the reflectance in the red band. |
| Level | Low Resilience | Medium Low Resilience | Medium High Resilience | High Resilience |
|---|---|---|---|---|
| Interval | <0.25 | 0.25–0.5 | 0.5–0.75 | >0.75 |
Disclaimer/Publisher’s Note: The statements, opinions and data contained in all publications are solely those of the individual author(s) and contributor(s) and not of MDPI and/or the editor(s). MDPI and/or the editor(s) disclaim responsibility for any injury to people or property resulting from any ideas, methods, instructions or products referred to in the content. |
© 2025 by the authors. Licensee MDPI, Basel, Switzerland. This article is an open access article distributed under the terms and conditions of the Creative Commons Attribution (CC BY) license (https://creativecommons.org/licenses/by/4.0/).
Share and Cite
Li, H.; Liang, F.; Du, J.; Liu, Y.; Wang, J.; Xu, Q.; Tang, L.; Zhou, X.; Sheng, H.; Chen, Y.; et al. Research on Resilience Evaluation and Prediction of Urban Ecosystems in Plateau and Mountainous Area: Case Study of Kunming City. Sustainability 2025, 17, 5515. https://doi.org/10.3390/su17125515
Li H, Liang F, Du J, Liu Y, Wang J, Xu Q, Tang L, Zhou X, Sheng H, Chen Y, et al. Research on Resilience Evaluation and Prediction of Urban Ecosystems in Plateau and Mountainous Area: Case Study of Kunming City. Sustainability. 2025; 17(12):5515. https://doi.org/10.3390/su17125515
Chicago/Turabian StyleLi, Hui, Fucheng Liang, Jiaheng Du, Yang Liu, Junzhi Wang, Qing Xu, Liang Tang, Xinran Zhou, Han Sheng, Yueying Chen, and et al. 2025. "Research on Resilience Evaluation and Prediction of Urban Ecosystems in Plateau and Mountainous Area: Case Study of Kunming City" Sustainability 17, no. 12: 5515. https://doi.org/10.3390/su17125515
APA StyleLi, H., Liang, F., Du, J., Liu, Y., Wang, J., Xu, Q., Tang, L., Zhou, X., Sheng, H., Chen, Y., Liu, K., Li, Y., Chen, Y., & Li, M. (2025). Research on Resilience Evaluation and Prediction of Urban Ecosystems in Plateau and Mountainous Area: Case Study of Kunming City. Sustainability, 17(12), 5515. https://doi.org/10.3390/su17125515