Abstract
Electricity in rural Alaska is provided by more than 200 standalone microgrid systems powered predominantly by diesel generators. Incorporating renewable energy generation and storage to these systems can reduce their reliance on costly imported fuel and improve sustainability; however, uncertainty remains about optimal grid architectures to minimize cost, including how and when to incorporate long-duration energy storage. This study implements a novel, multi-pronged approach to assess the techno-economic feasibility of future energy pathways in the community of Kotzebue, which has already successfully deployed solar photovoltaics, wind turbines, and battery storage systems. Using real community load, resource, and generation data, we develop a series of comparison models using the HOMER Pro software tool to evaluate microgrid architectures to meet over 90% of the annual community electricity demand with renewable generation, considering both battery and hydrogen energy storage. We find that near-term planned capacity expansions in the community could enable over 50% renewable generation and reduce the total cost of energy. Additional build-outs to reach 75% renewable generation are shown to be competitive with current costs, but further capacity expansion is not currently economical. We additionally include a cost sensitivity analysis and a storage capacity sizing assessment that suggest hydrogen storage may be economically viable if battery costs increase, but large-scale seasonal storage via hydrogen is currently unlikely to be cost-effective nor practical for the region considered. While these findings are based on data and community priorities in Kotzebue, we expect this approach to be relevant to many communities in the Arctic and Sub-Arctic regions working to improve energy reliability, sustainability, and security.
Keywords:
arctic; microgrids; renewables; hydrogen; solar; wind; batteries; resilience; sustainability 1. Introduction
Energy reliability, affordability, and resiliency have emerged as key criteria for economic and societal stability [1,2]. In the electricity sector, these are often highlighted at the large-scale grid level, where interconnected transmission and distribution networks comprise an essential means of providing electricity to consumers [3,4]. However, a case of equal importance exists at the smaller, community microgrid level, comprised of standalone systems that may not have the option to connect to major grid networks [5,6]. In Alaska, more than 200 microgrids constitute the primary means of supplying electricity to rural areas [7], and nearly all depend predominantly on diesel generators to produce electricity [8]. However, fuel supply is often limited to infrequent aircraft and barge deliveries throughout the year. The resulting utility diesel fuel costs can reach USD 9.50 per gallon, with electricity costs often exceeding USD 1.00 per kilowatt-hour (kWh) [9]. Alaska additionally has the highest energy consumption per capita in the country, which further exacerbates this energy burden [10]. In addition to high costs, market volatility and aging infrastructure have driven increasing deployments of local power generation via renewable resources.
The trend of rural renewable energy adoption follows an accelerated global pursuit of emissions reductions and sustainable energy technology deployment, which has spurred a near-doubling in both wind and solar generation and installed capacity between 2018 and 2023 [11]. Over 70 isolated Alaskan communities have seen successful deployments of renewable energy technologies as of 2020; these include installations of wind turbines, solar photovoltaic (PV) modules, hydropower facilities, and battery energy storage systems (BESS) [12,13,14]. The hub community of Kotzebue is located thirty-three miles north of the Arctic Circle on the coast of northwest Alaska and has been a leader in deploying early-stage energy technologies in the state [15]. The local cooperative utility, Kotzebue Electric Association (KEA), successfully installed its first wind turbines in 1997. Subsequent upgrades and iterations have led to an energy system today that includes 1800 kilowatts (kW) of wind power, 1206 kW of solar photovoltaic (PV) power and a 950 kilowatt-hour (kWh) lithium-ion battery system to supplement the existing six diesel generators, ranging from 725 kW to 3100 kW in generation capacity (Figure 1).
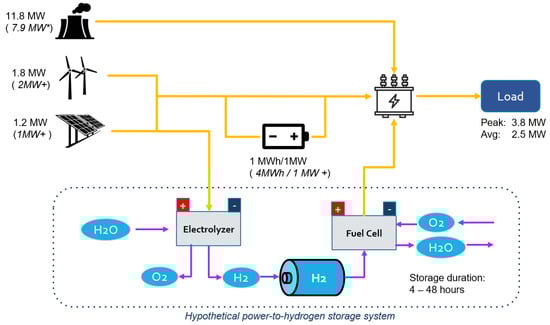
Figure 1.
Schematic of microgrid architecture in Kotzebue, including diesel generation, wind, solar, batteries, and a hypothetical hydrogen-to-gas storage system. Italicized values represent minimum capacity and storage additions currently under consideration. * Denotes capacity used in modeling, described in Section 2.
The incorporation of renewable energy generation and storage technologies alongside conventional generators comprises a “hybrid renewable microgrid” (HRM) architecture. In 2024, the HRM system in Kotzebue allowed the community to reduce diesel consumption by over 20% relative to a 2005 baseline according to state reporting, equivalent to 300,000 gallons annually (it should be noted that electricity demand dropped by 6% over the same time period) [9,15,16]. KEA is actively working with the local tribe, the Native Village of Kotzebue (NVOK), to build on the current renewable generation assets to reach the goal of 50% renewable power in the next five years. Further capacity expansion of renewables is dependent on projected cost-savings, comprising a key focus of this analysis.
Whether at the larger grid or microgrid scale, incorporating high shares of renewable power incurs technological challenges. Chief among these are maintaining sufficient power quality with inverter-based resources and addressing weather-dependent variability in generation potential [17]. Strategies to maintain acceptable power quality might include incorporating grid-forming inverters and synchronous condensers, while addressing intermittency and excess generation might emphasize demand-side management, incorporation of widespread electrification, and long-duration energy storage (LDES) [18]. Modeling and optimization of these technologies to maximize grid reliability while minimizing cost constitutes a primary focus of previous work in the literature [19,20,21,22,23,24].
Recent work has also begun to explore the feasibility of hydrogen in microgrids, with a particular focus on the tradeoffs of installing power-to-hydrogen (PtH) storage systems to reduce fuel costs [25,26,27]. Such systems would employ electrolyzers to convert excess renewable energy and water to hydrogen, which could be stored in pressurized vessels and later consumed in a fuel cell to supply power to the microgrid. In a high-latitude system similar to those found in Alaska, Giovanniello and Wu modeled a wind/battery/hydrogen system for a Canadian microgrid, finding that a hybridized storage strategy using both batteries and hydrogen resulted in the lowest system cost [25]. Additionally, Van et al. conducted a comprehensive review of microgrid-based hydrogen modeling studies, showing that the selection of energy management strategy, as well as user-specified modeling constraints and optimization methods are key criteria when interpreting model outputs and grid architectures [28]. While the future for a global hydrogen economy remains uncertain, these findings have become increasingly relevant in Alaska, where recent work has highlighted opportunities to produce, use and export hydrogen and its derivatives in the state [29].
Whereas much of the work in the literature has generally focused on modeling microgrid renewable integration to assess specific technologies and cost targets, our study develops a multi-scenario pathway for future grid adaptations and architectures in Kotzebue, incorporating real community data, utility priorities, and updated models of new and existing technologies. We utilize directly measured utility load and resource data to assess the techno-economic viability of near-term plans for capacity expansion, along with optimized scenarios for long-term HRM architectures approaching 100% renewable power in Kotzebue. The combination of statewide and local interest in hydrogen, along with the seasonal variability of resources in Alaska, has also made hydrogen for LDES a compelling point of investigation. The data and approach employed here consider scenarios that are of interest specifically to KEA and the Native Village of Kotzebue. However, this study details procedures and results that may be broadly relevant to other Arctic and Sub-Arctic communities seeking to reduce costs through energy innovation.
2. Materials and Methods
2.1. Approach
The objective of this study is to assess the technical and economic feasibility of microgrid architectures in Kotzebue that range from currently planned upgrades to long-term potential technology installations. This is performed by simulating system configurations with progressively higher shares of local renewable electricity generation and storage. The primary aspects of this approach are depicted in Figure 2 and detailed in the following subsections. First, we combine measured data for wind speed, solar global horizontal irradiance (GHI) and temperature resources in Kotzebue with load data from a supervisory control and data acquisition (SCADA) system to construct one year of energy resource and load data. Next, we develop a validation model to simulate the performance of the Kotzebue microgrid using the Hybrid Optimization for Multiple Energy Resources (HOMER) Pro platform (version 3.18.4), using hourly time steps for the aggregated datasets. The initial model is validated using power output data from the SCADA system and serves as the basis for additional capacity expansion scenario models. By parameterizing each model with financial and technical specifications from first-hand utility reporting, industry reporting and the literature, we compare the total cost to the utility of each architecture to the existing base case over a 25-year period. For architectures shown to be economically competitive with the base case, we conduct a sensitivity analysis to evaluate the impact to system total cost from key variables, such as capital costs for generation and storage assets. Finally, we present a standalone scenario that outlines the case for 100% renewable generation by considering seasonal storage of hydrogen.
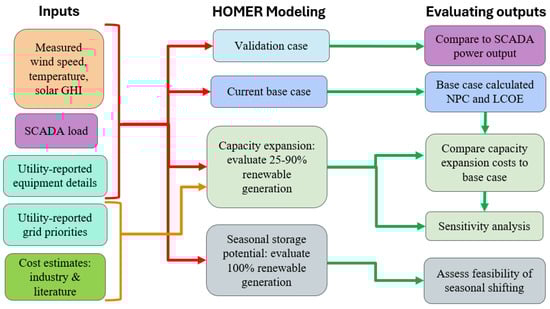
Figure 2.
Project overview delineating modeling inputs, HOMER model objectives, and metrics of evaluation.
2.2. Data and Model Validation
Both load and resource data utilized in this analysis are collected in Kotzebue spanning the years 2021–2022. SCADA data provided and owned by the utility, KEA, include power output data for diesel generators, solar modules, wind turbines, and battery charge and discharge, as well as dispatchable thermal loads. To maintain consistency across all modeled scenarios, dispatchable loads are omitted, and only regular electric loads are considered in this analysis. Resource data is obtained through multiple direct measurement sources. Wind speed data are collected via integrated anemometers on the wind turbines, while ground-based global horizontal irradiance measurements and air temperature measurements are obtained from a meteorological station installed at the renewable energy site in Kotzebue [30]. In cases of periodic data gaps, adjusted ERA5 satellite data downloaded from the Photovoltaic Geographical Information System (PVGIS) is used for temperature and solar resource data [31]. The combined datasets comprise a constructed representative year of energy resources and electricity demand in Kotzebue.
HOMER models are validated with power output data from Kotzebue over the same time period (2021–2022). The HOMER model used for validation is a modification of the current architecture today, reflecting that only 525 kW of solar PV was installed as of 2021, compared to the 1206 kW today. A comparison of weekly averages from the validation HOMER model and the SCADA system are shown in Figure 3. We note Kotzebue employs bifacial solar arrays, a capability that is precluded in HOMER. However, we confirm that total generation from the solar modules in HOMER are within 1.4% of the measured SCADA output data, which is deemed sufficient to capture major trends in solar resources. We additionally find that unexpected downtime for one of the operating wind turbines results in some discrepancy in the total wind generation. While issues with data collection and turbine operation are difficult to predict, we include a 24 h downtime period in our HOMER model to better reflect utility responses to unplanned maintenance. The collected resource data is unaffected by issues with the turbine generation data and are utilized in the remaining modeled scenarios.
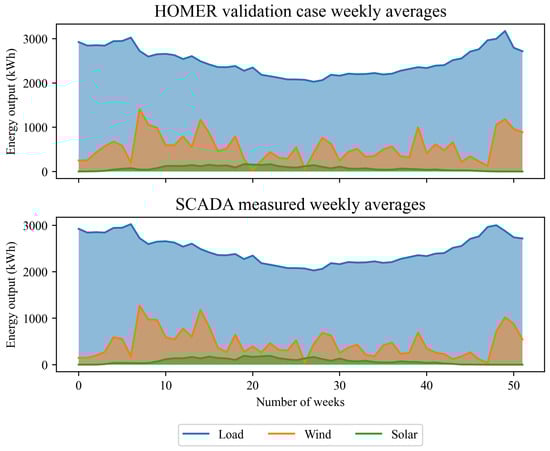
Figure 3.
Weeklyaverages for measured SCADA data and simulated HOMER outputs using measured resource data.
2.3. Simulation Scenarios for Techno-Economic Comparisons
HOMER Pro is considered an industry standard throughout Alaska and other regions with a high prevalence of microgrids, capable of both simulating and optimizing grid architectures to simultaneously evaluate the cost and performance of the proposed system [22,23,26]. Figure 4 depicts the HOMER Pro architecture schematic. Users may specify discrete values (including single values for prescribed architectures) for component sizes and operational parameters using the “Search Space” feature. Alternatively, component sizing may in some cases be determined by the software optimizer without requiring user-specified values [32].
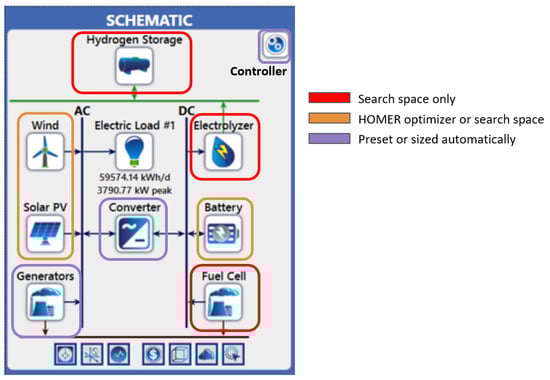
Figure 4.
Snapshot of the HOMER Pro design page architecture.
In this study, we consider both prescribed and optimized microgrid architectures using one year of hourly time step data for energy balance modeling, with economic modeling conducted over a 25-year time period. The primary model outputs of interest are fuel usage and cost. The former is evaluated based on the ability of the selected architecture to offset a certain percentage of annual load met by diesel generators with renewable power, while the latter is assessed in terms of the total net present cost (NPC) of the system over the projected lifetime and the resulting levelized cost of energy (LCOE). We explicitly report the annual gallons of diesel fuel consumed by the system, as well as the total contributions from renewable power. Table 1 presents the overall categories for models developed in HOMER for this analysis, including a representative base case (BC), a “no renewables” (NR) comparison case, and three benchmarks for renewable capacity expansion for the near term (NT), medium term (MT), and long term (LT). Capacity values denoted by a question mark in Table 1 are determined through the optimization analysis and presented in the results.

Table 1.
INPUTS: Modeling scenarios and simulated Kotzebue grid architectures.
Figure 5 shows a further delineation of the scenarios presented in Table 1, including their rationale. The base case (BC) model is built to reflect the existing Kotzebue grid, including upgrades since 2022 (thereby distinguishing it from the validation case, constructed to represent the 2021–2022 grid). The current base load is primarily met by six diesel generators ranging in capacity from 725 kW to 3100 kW, with electricity from solar, wind and batteries meeting approximately 25% of the primary load served. The BC model omits two of the current diesel generators slated for near-term overhaul and possible decommissioning to enable direct comparison to the longer-term scenarios. Near-term (NT) scenarios are directly informed by planned build-outs within the community, consistent with the goal of the utility to meet 50% of the annual load with renewables in the next five years. Both the BC and NT models are based on prescribed architectures, according to the specified values in Table 1.
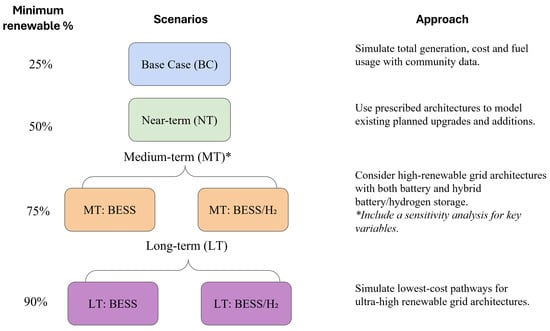
Figure 5.
Categorization and modeling approach for microgrid architectures considered. Medium-term and long-term architectures are treated as optimization problems while the base case and near-term architectures are prescribed.
Medium-term (MT) and long-term (LT) scenarios are developed through an optimization analysis using the HOMER Pro mixed-integer linear programming (MiLP) feature. These models evaluate the feasibility and cost of architectures designed to meet the annual load with at least 75% and 90% renewable generation. We note that in all scenarios, the minimum renewable percentage refers to the share of the total annual load that must be met by renewable sources.
The medium- and long-term scenarios additionally consider storage of excess renewable generation in a power-to-hydrogen (PtH) system (Figure 1), to supplement lithium-ion battery storage. Thus, the MT and LT scenarios are subdivided into models that consider exclusively battery energy storage (MT: BESS and LT: BESS) and those that consider both batteries and hydrogen storage via a PtH configuration (MT: BESS/H2 and LT: BESS/H2).
In theory, a PtH system enables energy storage potential constrained only by the volumetric capacity of the physical vessel or reservoir. This potential makes hydrogen a favorable candidate for long-duration, and importantly seasonal, storage of energy. The prospect of seasonal storage is particularly interesting in high-latitude locations like Alaska, which experiences substantial seasonal fluctuations in wind and solar potential. Hydrogen technology is additionally of direct interest to community partners involved with this project and other energy stakeholders throughout the state. We consider hydrogen systems at a variety of scales shown in Table 2, assuming proton exchange membrane (PEM) electrolyzers and fuel cells, in conjunction with pressurized steel vessels modeled at a 350 bar storage pressure. The selected storage capacities are based on the number of continuous hours during which the annual peak load in Kotzebue could be met by stored hydrogen. Technology sizes for all components of the hydrogen system are modeled as independent variables, allowing for multiple configurations of the values shown in Table 2.
Table 2.
Power-to-hydrogen storage system components and capacities.
2.4. Parameters and Sizing
Model parameterization is broadly split into three categories: component sizing, costs, and operational parameters. As discussed previously, a majority of component sizing is either prescribed or determined through an optimization procedure. Table 3 lists key operational parameters used throughout all simulation scenarios. These parameters encompass overall project economics, diesel generator operation, and simulation constraints. Fuel costs and project economics are based on data available for 2023, while parameters in the latter categories are based on system practices used throughout the region. In some cases, parameters are modified to account for nuances in HOMER and datasets being used. For example, a 1% annual allowed capacity shortage is included in all models. This prevents components, such as generation assets, from being significantly oversized in HOMER in the event of a single spike in load. Additional advanced parameters for individual components and simulation constraints can be found in the attached Supplementary Materials.
Cost parameters for individual components are included in Table 4. Listed values correspond to installed capital costs (CAPEX), replacement costs as a fraction of CAPEX, and operation and maintenance costs (O&M). Where possible, these values are based on first-hand reporting from utility and community partners and quotes from industry, as noted in Table 4. We acknowledge that some values, such as those for wind and solar, are inflated relative to reporting in the literature at the national or international level [33,34]. This reflects an established premium to install and operate equipment in Alaska, particularly in regions with limited access to major supply chains. We extend this premium in some instances to components for which consistent cost data is sparse at the microgrid scale, such as hydrogen storage. For example, correspondences with local gas companies suggest that the cost to install and operate a compressed hydrogen storage unit in rural Alaska can result in a near-100% premium per kilogram relative to reporting in the literature [34]. Similarly, we utilize upper bound values for electrolyzer and fuel cells from national reports, corroborated by industry quotes where possible [35,36,37,38]. Component costs are thus reported to the best knowledge of the authors; however, due to the inherent uncertainty in cost data for new technologies, we additionally include a sensitivity analysis in our techno-economic comparison.
The sensitivity analysis is intended to assess the impact to the total system cost by varying a single component cost by a fixed percentage. In this case, we evaluate the cost of new wind turbines, solar modules, batteries, all components of the hydrogen system, and fuel price. Each component value is varied individually by a margin of . We select the medium-term scenario as the model subset on which to conduct the sensitivity testing since this scenario both uses the HOMER optimization feature and considers all available technologies. Sensitivity analysis results are thus reported both for the model that considers only battery storage (MT-BESS) as well as that which considers a hybrid battery/hydrogen system (MT-BESS/H2).
Table 3.
Global parameters for HOMER modeling across scenarios.
Table 3.
Global parameters for HOMER modeling across scenarios.
| Parameter Group | Parameter | Value |
|---|---|---|
| Economic parameters | Diesel fuel cost | 3.27 USD/gal [9] |
| Inflation rate | 3% [39] | |
| Discount rate | 6% | |
| Project lifetime | 25 years | |
| Diesel generators | Min. run time | 60 min |
| Min. load ratio | 30% | |
| Overhaul interval | 30,000 h | |
| Grid parameters | Dispatch strategy | Load-following |
| Max. capacity shortage | 1% | |
| Operating reserves 1 | 30% |
1 Operating reserves refer to the percentages of wind and solar capacity that are maintained as surplus capacity in the event of a sudden load increase. The surplus capacity may be comprised of generators, fuel cells, or batteries.
Table 4.
Cost parameters for renewable/hybrid system components.
Table 4.
Cost parameters for renewable/hybrid system components.
| Component | Capital Cost | Replacement Cost | O&M |
|---|---|---|---|
| EWT wind turbines † | USD 5500/kW | 100% | USD 75/kW/year |
| Solar PV † | USD 3250/kW | 100% | USD 10/kW/year |
| 950 kWh Li-ion BESS † | USD 1000/kWh | 75% | USD 10/kWh/year |
| ABB inverter † | USD 270/kW | 100% | USD 0/year ‡ |
| 4 MWh Li-ion BESS [40] † | USD 500/kWh | 100% | USD 8.8/kWh/year |
| 1 MW wind turbines [15] | USD 6000/kW | 100% | USD 75/kW/year |
| PEM electrolyzer [38] | USD 2000/kW | 20% ** | USD 100/kW/year |
| PEM fuel cell [35] | USD 2000/kW | 20% ** | USD 0.02/op. h |
| H2 cylinder storage [34] * | USD 1500/kg | 100% | USD 30/kg/year |
† Reference to utility-reported costs and estimates from quotes and past projects. Rows with both references and † marking represent industry quotes that have been modified/increased for installation in Alaska. ‡ Operational costs for inverter are incorporated into individual components on the AC or DC bus to delineate O&M costs for using different technologies. * Storage capital costs and replacement costs account for installation and hydrogen balance-of-plant (BoP) costs in Alaska, which has been directly quoted at nearly a 100% premium to cost estimates in the literature. ** Replacement costs for electrolyzer and fuel cell components assume only the PEM stack is replaced, as opposed to the entire system.
2.5. Assessing Seasonal Storage
Finally, we present an ultra-long duration storage case as an exercise to consider the threshold at which seasonal storage of hydrogen can enable 100% total renewable generation. We consider two scenarios in which a 20 MW electrolyzer and a 3.5 MW fuel cell are paired with a hydrogen storage system capable of continuously meeting four days (20,000 kg) and 24 days (120,000 kg) of the peak community load. The 3.5 MW fuel cell is sized to meet the primary load autonomously, mirroring the capacity in Table 2. The electrolyzer is sized so that the load during the maximum renewable generation lull observed in the year of data (13 h total of no wind or solar generation) can be met using stored hydrogen if the electrolyzer runs at the rated 20 MW capacity for eight hours. We acknowledge that these capacities are significantly mismatched from the current Kotzebue grid, and the considered storage volumes (up to 120,000 kg) are not suited to the geographical constraints of the region. Storage at this scale would likely require underground caverns or reservoirs, which have yet to be demonstrated in Alaska. Due to these limitations, this scenario is not included in the above techno-economic assessment. At the same time, it is important to consider the scale of upgrades and installations required to enable the storage of energy from days to months. We therefore include this comparison as a follow-on effort to the exploration of hydrogen in this study, noting that limitations exist in the lack of available robust cost projections.
3. Results and Discussion
3.1. Lowest Cost Scenarios Across Microgrid Architectures
Figure 6 shows modeled results for all primary scenarios considered with corresponding cost values reported in Table 5. The optimal sizing for individual technology components in each scenario is further shown in Table 6, as a completion of the optimization process referenced in Table 1. Increased renewable generation corresponds to reduced fuel consumption across the scenarios but does not always reduce total system costs. In the near-term scenario, investment in renewable generation and battery storage decreases costs relative to the base case in terms of the system net present cost (NPC) and the levelized cost of energy (LCOE). Cost projections for the medium-term scenario are relatively competitive with the base case, depending on the storage technology selected. For example, the inclusion of a small-scale hydrogen system in conjunction with battery storage is approximately 1.3% more costly in terms of NPC than the base case, while using only batteries actually results in a 1.1% NPC reduction relative to the base case. The closeness of these projections from multiple architectures is explored in the sensitivity analysis. In contrast, the total net present cost for the long-term (90% renewable) scenario remains more costly than both the base case and the non-renewable comparison case, despite substantial reductions in fuel costs. This disparity is evident regardless of which storage medium is used (batteries or battery-hydrogen hybrid), as costs are dominated by capital expenditures to build wind and solar assets.
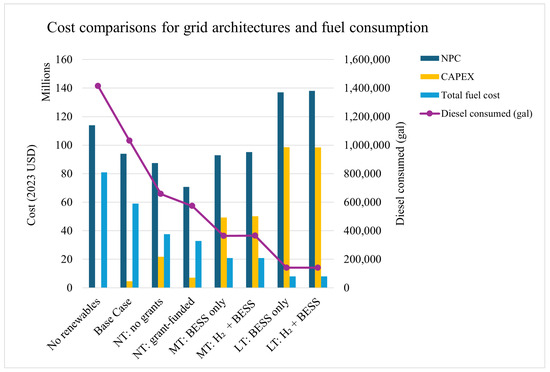
Figure 6.
Cost comparisons for grid architectures and fuel consumption. NT = “near-term” (50% renewable); MT = “medium-term” (75% renewable); LT = “long-term” (90% renewable). Note that replacement of components are included in the reported CAPEX values.
Table 5.
Costs and energy consumption outputs from techno-economic scenario modeling.
Table 6.
OUTPUTS: Modeling scenarios and simulated Kotzebue grid architectures.
A scenario is also considered in the near-term case in which capital expenditures for new generation and battery storage are covered by grants, as is common for projects of this nature in the region. Funded projects would include an additional 1.0 MW of solar capacity, 2.0 MW of wind capacity, and 16.0 MWh of battery energy storage. This analysis shows that if all planned projects are grant-funded, the result is the lowest-cost scenario overall among those considered. This scenario results in a 24% decrease in the system NPC relative to the base case, with an LCOE of USD 0.19 per kWh, compared to the base case LCOE of USD 0.25 per kWh. In the absence of grant funding, a partial deployment of planned projects in the near-term still results in cost reductions, but the corresponding savings are less significant. When no grant funding is applied, a near-term 6.8% NPC reduction relative to the base case is observed, with an LCOE of USD 0.23 per kWh.
3.2. Sensitivity Analysis
Figure 7 and Figure 8 show tornado plots comprising a sensitivity analysis for medium-term architectures that utilize either (1) only battery energy storage; or (2) a hybrid battery/hydrogen storage system. Capacities for generation assets are fixed at the optimized (MT-BESS/H2) sizes in this portion of the analysis to enable a direct comparison across the two scenarios.
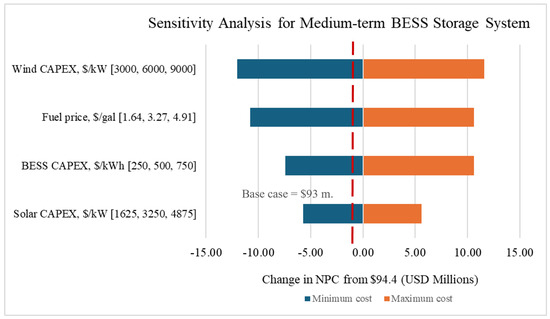
Figure 7.
Sensitivity analysis for the medium-term battery-only scenario, with 4.7 MW of solar capacity, 5.8 MW wind capacity, and 20 MWh of battery storage. The dotted red line denotes the base case NPC.
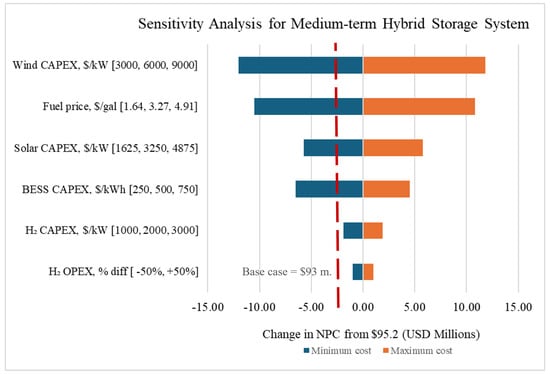
Figure 8.
Sensitivity analysis for the medium-term hybrid storage scenario, with 4.7 MW of solar capacity, 5.8 MW wind capacity, and 12 MWh of battery storage, and a pilot-scale hydrogen system featuring an 800 kW electrolyzer, a 500 kW fuel cell, and 840 kg of compressed gas storage. The dotted red line denotes the base case NPC.
In both cases, changes in the capital costs for wind turbines have the most significant impact on overall net present cost, followed by changes in fuel price. Changes in battery capital costs are unsurprisingly more significant when batteries comprise the only energy storage medium (Figure 7). However, increased battery costs result in a more significant change in NPC (USD 11 million) compared with decreasing the battery costs by the same margin (resulting in an NPC reduction of USD 7 million). In the hybrid system, the opposite trend is observed, with decreased battery costs exhibiting a more significant impact on NPC than increases. Furthermore, changes in capital and operating costs of hydrogen equipment have a smaller effect on the system NPC compared to that of battery or generation costs. The cost impact from both batteries and hydrogen in the hybrid scenario is also smaller than the individual impact of battery costs in the battery-only architecture. This suggests that while the hybrid storage system remains more expensive overall, it may be more insulated from changes in cost due to single component price volatility.
Although the sensitivity analysis is conducted over the medium-term cases, it can provide some insight into tradeoffs in the long-term capacity expansion scenarios. Our modeling suggests that investing in a 90% renewable microgrid is not currently economical. However, as the cost of wind and solar generation continue to decrease, it is important to consider tradeoffs in storage costs and flexibility in high-renewable scenarios. Table 7 shows multiple selected storage configurations for the long-term scenario. Similar to the medium-term scenario, using only battery storage results in a lower net present cost. However, a hybrid storage architecture employing hydrogen storage alongside batteries at a “pilot scale” and a “moderate scale” remains fairly competitive with architectures using only battery storage (within a margin of <1% in NPC). In contrast, using a larger hydrogen system in lieu of any battery storage is substantially more costly. In the event that battery costs continue to decrease, battery storage will likely remain the more cost-effective storage medium in this particular microgrid context. However, the more significant impact on NPC from battery cost fluctuations relative to those for hydrogen in the sensitivity analysis also means that in the event of battery cost increases, a hydrogen-battery hybrid system could reduce the risk of increases in the total system cost. Thus, given the flexibility of hydrogen use cases and individual component capacities, a hybrid storage architecture for long-term scenario planning may be more resilient compared to using only one storage technology.
Table 7.
Multiple storage configurations for a long-term scenario with 90% renewable generation.
3.3. Feasibility of Seasonal Storage
While moderate and large-scale hydrogen systems provide some long-duration energy storage to the microgrid (12–24 h of autonomous storage), these systems do not enable seasonal shifting (i.e., storage of weeks to months). As a standalone follow-on effort to the presented techno-economic analysis, we assess the scale of hydrogen storage required to adequately meet the load during extensive lulls in solar and wind generation, thus enabling a 100% renewable microgrid. Figure 9 shows a timeseries plot for an architecture with a high-capacity hydrogen storage reservoir (20,000 kg or four days of autonomous storage). Figure 10 shows an adapted system with the storage capacity increased a further six-fold (120,000 kg or 24 days of autonomous storage). Both cases employ a 20 MW electrolyzer and a 3.5 MW fuel cell to complete the PtH storage system. With four days of storage, Figure 9 illustrates that the hydrogen storage reservoir is never depleted in the summer months and remains fully charged for several days. However, several multi-week periods in the winter months still require diesel generators to meet 10% of the annual load during periods of minimal wind and solar generation due to insufficient volumes of stored hydrogen.
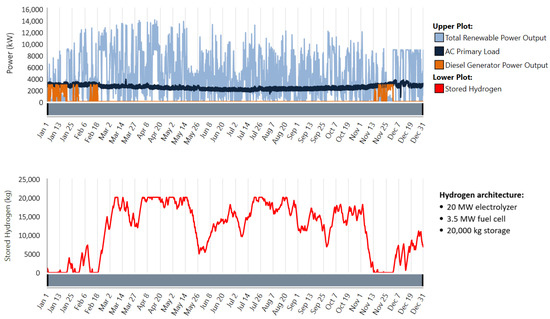
Figure 9.
Time series plot from a HOMER model enabling long-duration hydrogen storage but not 100% renewable power.
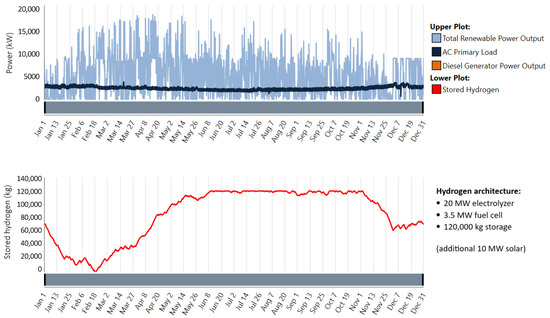
Figure 10.
Time series plot from a HOMER model achieving 100% renewable power and seasonal storage of hydrogen. Note that the diesel generator is included in the legend for comparison with Figure 9 but is not required in this scenario to meet the load.
With 24 days of storage, Figure 10 depicts a scenario in which seasonal shifting is achieved and stored hydrogen enables 100% renewable power. In this case, the hydrogen storage reservoir remains fully charged for much of the summer season but is fully discharged over the course of the winter, thus providing just enough stored energy to cover the extended generation lulls. We note that the grid architectures in these cases are not fully optimized due to the constraints on hydrogen sizing in HOMER; however, the scale of storage presented here is important to consider relative to the scenarios presented in the techno-economic assessment. Even with additional generating capacity, enabling seasonal storage not only requires hydrogen reservoirs more than 140 times the volume of any configuration deemed competitive with the base case, but exists at a scale that would require land resources, dedicated labor, and adjacent economies and supply chains that are not currently present in the northwest Arctic region. Therefore, while we note that hydrogen may have a role to play in microgrids that successfully install large shares of renewable generating capacity, it is not likely to be an immediate candidate for seasonal storage at this time.
4. Conclusions
4.1. Key Trends
This study considers a broad range of future pathways for hybrid renewable microgrid architectures in Kotzebue. Model outputs for the analyzed scenarios highlight four major takeaways: (1) investment in moderate renewable capacity expansion and storage in the near-term scenario leads to direct cost reductions; (2) medium-term architectures to reach 75% renewable generation are competitive with the base case and will be advantageous over time if the cost of renewable generation and storage fall or if fuel prices increase; (3) hydrogen is generally unfavorable on a cost basis across the considered scenarios, but it may lead to longer-term resiliency through increased grid flexibility and the option for long-duration energy storage; (4) reaching 90% or higher renewable generation remains uneconomical due primarily to high capital costs. This further precludes seasonal long-duration storage to reach 100% renewable generation, which would require massive financial and resource investments in hydrogen production and storage capacity.
These takeaways are broadly aligned with previous findings and market trends, which include the limitations on hydrogen use due to cost and the challenges in enabling near-100% renewable power. At the same time, we show there is evidence to support efforts in the near-term to increase onsite renewable generation in isolated power systems that currently rely on diesel generators. These results are thus relevant not only to Kotzebue but could inform future planning in other rural microgrid communities in the Arctic and Sub-Arctic regions.
4.2. Limitations and Future Work
We note there are limitations to the results presented herein and are careful to distinguish our work from making formal recommendations to any utilities or communities. First, a substantial degree of uncertainty exists in both present-day and future costs for individual technologies, especially those that are not currently deployed in Arctic microgrids, such as hydrogen. Operational challenges and maintenance are additionally difficult to predict and capture in our models. Second, while financial modeling is conducted over a 25-year period, HOMER simulates technical feasibility of a system for only one year worth of data. Thus, while we consider it beneficial to use real community load and resource data in our modeling, we are unable to capture multi-year seasonal trends and fluctuations that would affect grid operations and resiliency. This is an area of future work that we are actively exploring. Finally, our study combines prescribed microgrid architectures (for the base case and near-term models) with those that utilize full or partial optimization (medium and long-term). The presented results describe the most cost-effective architectures determined from our models but are limited to the best available information used for parameters and constraints.
While this analysis enables comparison across comprehensive grid scenarios, there remain numerous opportunities for future work. Useful follow-on efforts may consider multiple storage technologies beyond lithium-ion batteries and hydrogen, as well as alternate routes for widespread electrification. Analysis at a higher resolution than hourly time steps would also be informative, such as evaluating grid integration of storage and high shares of renewables through dynamical modeling. Future efforts may also increase precision of modeling results, such as sizing all components via a single optimization algorithm, modeling bifacial solar arrays and considering multiple years of data. Similarly, we anticipate that as data collection continues, we may be able to better incorporate thermal and deferrable loads into this work, which is of direct interest to community partners. Ultimately, we present a comprehensive overview of active and future energy planning options that would enable increased energy security, autonomy, and sustainability in a rural microgrid community. We hope that this work can inform and contribute to ongoing efforts to continually seek new ways to improve our energy systems in Alaska, the Arctic, and beyond.
Supplementary Materials
The following supporting information can be downloaded at: https://www.mdpi.com/article/10.3390/su17135996/s1, Scenario descriptions and technical parameters used for components of HOMER modeling.
Author Contributions
Conceptualization, P.C.M., E.W. and M.W.; methodology, P.C.M. and M.W.; formal analysis, P.C.M.; writing—review, M.W. and E.W.; writing—drafting and editing, P.C.M.; funding acquisition, E.W. All authors have read and agreed to the published version of the manuscript.
Funding
This material is based upon work supported by the U.S. Department of Energy’s Office of Energy Efficiency and Renewable Energy (EERE) under the Hydrogen Fuel Cell Technology Office, Award Number DE-EE0010724. The views expressed herein do not necessarily represent the views of the U.S. Department of Energy or the United States Government. Additional work for data processing, cleaning and modeling is further supported by the U.S. Office of Naval, the Arctic Energy Office, and the Denali Commission.
Data Availability Statement
Restrictions apply to the availability of these data. Data were provided by Kotzebue Electric Association (KEA) and are the sole property of the utility. Inquiries regarding data and models may be directed to the authors.
Acknowledgments
The authors further wish to acknowledge and thank the following entities and individuals for their contributions: We acknowledge Kotzebue Electric Association (KEA) for providing community load and power output data, as well as system information and community perspectives. Specifically, we would like to thank Tom Atkinson (CEO) and Matt Bergan (project engineer) for their insight and feedback. We additionally would like to acknowledge Mariko Shirazi, Glen Woodworth, and Henry Toal from the Alaska Center for Energy and Power (ACEP) for their work in data procurement, cleaning and analysis. Finally, we wish to thank Sweekar Bengaluru for his contributions to model development.
Conflicts of Interest
The authors declare no conflicts of interest. The funders had no role in the design of the study; in the collection, analyses, or interpretation of data; in the writing of the manuscript; or in the decision to publish the results.
Abbreviations
The following abbreviations are used in this manuscript:
| BESS | Battery energy storage system |
| CAPEX | Capital expenditures |
| HOMER | Hybrid Optimization of Multiple Energy Resources |
| HRM | Hybrid renewable microgrid |
| LCOE | Levelized cost of energy |
| MiLP | Mixed-integer linear programming |
| NPC | Net present cost |
| OPEX | Operating expenses |
| O&M | Operations and maintenance |
| PEM | Proton-exchange membrane |
| PtH | Power-to-hydrogen |
References
- Smil, V. Energy and Civilization: A History; The MIT Press: Cambridge, MA, USA, 2017. [Google Scholar]
- IEA. World Energy Outlook 2024—Analysis; International Energy Agency: Paris, France, 2024. [Google Scholar]
- Smith, O.; Cattell, O.; Farcot, E.; O’Dea, R.D.; Hopcraft, K.I. The effect of renewable energy incorporation on power grid stability and resilience. Sci. Adv. 2022, 8, eabj6734. [Google Scholar] [CrossRef] [PubMed]
- Oyekale, J.; Petrollese, M.; Tola, V.; Cau, G. Impacts of Renewable Energy Resources on Effectiveness of Grid-Integrated Systems: Succinct Review of Current Challenges and Potential Solution Strategies. Energies 2020, 13, 4856. [Google Scholar] [CrossRef]
- Azeem, F.; Narejo, G.B.; Shah, U.A. Integration of renewable distributed generation with storage and demand side load management in rural islanded microgrid. Energy Effic. 2020, 13, 217–235. [Google Scholar] [CrossRef]
- Trivedi, R.; Patra, S.; Sidqi, Y.; Bowler, B.; Zimmermann, F.; Deconinck, G.; Papaemmanouil, A.; Khadem, S. Community-Based Microgrids: Literature Review and Pathways to Decarbonise the Local Electricity Network. Energies 2022, 15, 918. [Google Scholar] [CrossRef]
- Holdmann, G.P.; Wies, R.W.; Vandermeer, J.B. Renewable Energy Integration in Alaska’s Remote Islanded Microgrids: Economic Drivers, Technical Strategies, Technological Niche Development, and Policy Implications. Proc. IEEE 2019, 107, 1820–1837. [Google Scholar] [CrossRef]
- Green, N.; Mueller-Stoffels, M.; Whitney, E. An Alaska case study: Diesel generator technologies. J. Renew. Sustain. Energy 2017, 9, 061701. [Google Scholar] [CrossRef]
- Alaska Energy Authority. Power Cost Equalization Program FY24 Report; Technical Report; Alaska Energy Authority: Anchorage, AK, USA, 2025. [Google Scholar]
- Energy Information Administration. Alaska State Energy Profile Data. 2025. Available online: https://www.eia.gov/state/print.php?sid=AK (accessed on 13 February 2025).
- IEA. Integrating Solar and Wind; Technical Report; International Energy Agency: Paris, France, 2024. [Google Scholar]
- Meadows, R.; Edgerly, E.; Jordan, R.; Beshilas, L. Renewable Energy Integration in Remote Alaska Communities; Technical Report NREL/TP-5700-90685, 2522802, MainId: 9246; U.S. Department of Energy: Washington, DC, USA, 2025. [CrossRef]
- Whitney, E.; Pike, C. An Alaska case study: Solar photovoltaic technology in remote microgrids. J. Renew. Sustain. Energy 2017, 9, 061704. [Google Scholar] [CrossRef]
- VanderMeer, J.; Mueller-Stoffels, M.; Whitney, E. Wind power project size and component costs: An Alaska case study. J. Renew. Sustain. Energy 2017, 9, 061703. [Google Scholar] [CrossRef]
- Kotzebue Electric Association. Our Renewable Energy. 2022. Available online: https://www.kea.coop/renewable-energy/our-renewable-energy/ (accessed on 13 February 2025).
- Alaska Energy Authority. Power Cost Equalization Program FY05 Report; Technical Report; Alaska Energy Authority: Anchorage, AK, USA, 2006. [Google Scholar]
- Vaziri Rad, M.A.; Kasaeian, A.; Niu, X.; Zhang, K.; Mahian, O. Excess electricity problem in off-grid hybrid renewable energy systems: A comprehensive review from challenges to prevalent solutions. Renew. Energy 2023, 212, 538–560. [Google Scholar] [CrossRef]
- Ismail, M.S.; Moghavvemi, M.; Mahlia, T.M.I.; Muttaqi, K.M.; Moghavvemi, S. Effective utilization of excess energy in standalone hybrid renewable energy systems for improving comfort ability and reducing cost of energy: A review and analysis. Renew. Sustain. Energy Rev. 2015, 42, 726–734. [Google Scholar] [CrossRef]
- Launch Alaska. ProjectSpotlight: Kotzebue Electric Association. 2022. Available online: https://www.launchalaska.com/deployment/kotzebue-electric (accessed on 6 June 2025).
- Jacobson, M.Z.; Cameron, M.A.; Hennessy, E.M.; Petkov, I.; Meyer, C.B.; Gambhir, T.K.; Maki, A.T.; Pfleeger, K.; Clonts, H.; McEvoy, A.L.; et al. 100% clean and renewable Wind, Water, and Sunlight (WWS) all-sector energy roadmaps for 53 towns and cities in North America. Sustain. Cities Soc. 2018, 42, 22–37. [Google Scholar] [CrossRef]
- Jacobson, M.Z. Batteries or hydrogen or both for grid electricity storage upon full electrification of 145 countries with wind-water-solar? iScience 2024, 27, 108988. [Google Scholar] [CrossRef] [PubMed]
- Bolt, G.; Wilber, M.; Huang, D.; Sambor, D.J.; Aggarwal, S.; Whitney, E. Modeling and Evaluating Beneficial Matches between Excess Renewable Power Generation and Non-Electric Heat Loads in Remote Alaska Microgrids. Sustainability 2022, 14, 3884. [Google Scholar] [CrossRef]
- Mitchell, A.; Madden, D.; Wilber, M.; Dolan, C. Wind Economic Analysis Project: An Alaska Case Study for Integration of High-Penetration Wind Energy in Marshall, AK; Technical Report UAF/ACEP/TP-02-0001; Alaska Center for Energy and Power (ACEP): Fairbanks, AK, USA, 2024. [Google Scholar]
- Simpkins, T.; Cutler, D.; Hirsch, B.; Olis, D.; Anderson, K. Cost-optimal pathways to 75% fuel reduction in remote Alaskan villages. In Proceedings of the 2015 IEEE Conference on Technologies for Sustainability (SusTech), Ogden, UT, USA, 30 July–1 August 2015; pp. 125–130. [Google Scholar] [CrossRef]
- Giovanniello, M.A.; Wu, X.Y. Hybrid lithium-ion battery and hydrogen energy storage systems for a wind-supplied microgrid. Appl. Energy 2023, 345, 121311. [Google Scholar] [CrossRef]
- Dawood, F.; Shafiullah, G.M.; Anda, M. Stand-Alone Microgrid with 100% Renewable Energy: A Case Study with Hybrid Solar PV-Battery-Hydrogen. Sustainability 2020, 12, 2047. [Google Scholar] [CrossRef]
- Hunter, C.A.; Penev, M.M.; Reznicek, E.P.; Eichman, J.; Rustagi, N.; Baldwin, S.F. Techno-economic analysis of long-duration energy storage and flexible power generation technologies to support high-variable renewable energy grids. Joule 2021, 5, 2077–2101. [Google Scholar] [CrossRef]
- Van, L.P.; Chi, K.D.; Duc, T.N. Review of hydrogen technologies based microgrid: Energy management systems, challenges and future recommendations. Int. J. Hydrogen Energy 2023, 48, 14127–14148. [Google Scholar] [CrossRef]
- Whitney, E.; Koleva, M.; Kilcher, L.; Raun, J. Alaska Hydrogen Opportunities Report; Technical Report NREL/TP–5700-88753, UAF/ACEP/TP-05-0001, 2483257; Alaska Center for Energy and Power: Fairbanks, AK, USA, 2024. [Google Scholar] [CrossRef]
- Toal, H.; Pike, C.; Riley, D.; Burnham, L. Optimizing a Hybrid East-West Vertical and Equator-Facing Bifacial Solar PV Array for a High-Latitude Microgrid. In Proceedings of the 2024 IEEE 52nd Photovoltaic Specialist Conference (PVSC), Seattle, WA, USA, 9–14 June 2024; pp. 1775–1777. [Google Scholar] [CrossRef]
- Huld, T.; Müller, R.; Gambardella, A. A new solar radiation database for estimating PV performance in Europe and Africa. Sol. Energy 2012, 86, 1803–1815. [Google Scholar] [CrossRef]
- HOMER Pro Support 3.16. Available online: https://support.ul-renewables.com/homer-manuals-pro/index.html (accessed on 1 January 2024).
- National Renewable Energy Laboratory. Annual Technology Baseline 2024. 2024. Available online: https://atb.nrel.gov/ (accessed on 25 March 2025).
- MIT Energy Initiative. The Future of Energy Storage; Massachusetts Institute of Technology: Cambridge, MA, USA, 2022. [Google Scholar]
- U.S. Department of Energy. Hydrogen and Fuel Cell Technologies Office Multi-Year Program Plan: Fuel Cell Technologies; Technical Report; U.S. Department of Energy: Washington, DC, USA, 2024.
- Arjona, V. Electrolyzer Installations in the United States; Technical Report 23002; U.S. Department of Energy: Washington, DC, USA, 2023.
- Kleen, G.; Gibbons, W.; Fornaciari, J. Heavy-Duty Fuel Cell System Cost; Technical Report 23002; U.S. Department of Energy: Washington, DC, USA, 2023.
- Badgett, A.; Brauch, J.; Thatte, A.; Rubin, R.; Skangos, C.; Wang, X.; Ahluwalia, R.; Pivovar, B.; Ruth, M. Updated Manufactured Cost Analysis for Proton Exchange Membrane Water Electrolyzers; Technical Report NREL/TP–6A20-87625, 2311140, MainId:88400; NREL: Golden, CO, USA, 2024. [CrossRef]
- Kneifel, J.D. Energy Price Indices and Discount Factors for Life-Cycle Cost Analysis—2024: Annual Supplement to NIST Handbook 135; NIST: Gaithersburg, MD, USA, 2024. [Google Scholar]
- Tesla. Megapack: Utility-Scale Energy Storage. 2025. Available online: https://www.tesla.com/megapack (accessed on 16 May 2025).
Disclaimer/Publisher’s Note: The statements, opinions and data contained in all publications are solely those of the individual author(s) and contributor(s) and not of MDPI and/or the editor(s). MDPI and/or the editor(s) disclaim responsibility for any injury to people or property resulting from any ideas, methods, instructions or products referred to in the content. |
© 2025 by the authors. Licensee MDPI, Basel, Switzerland. This article is an open access article distributed under the terms and conditions of the Creative Commons Attribution (CC BY) license (https://creativecommons.org/licenses/by/4.0/).