Article

Socio-Economic Drivers and Sustainability Challenges of Urban Green Space Distribution in Jinan, China

1
School of Environment and Geography, Qingdao University, Qingdao 266071, China
2
Agro-Environmental Protection Institute, Ministry of Agriculture and Rural Affairs, No. 31 Fukang Road, Nankai District, Tianjin 300191, China
3
Guangdong Provincial Key Laboratory of Marine Disaster Prediction and Prevention, Institute of Marine Sciences, Shantou University, Shantou 515063, China
*
Authors to whom correspondence should be addressed.
These authors contributed equally to this work.
Sustainability 2025, 17(13), 5993; https://doi.org/10.3390/su17135993
Submission received: 8 May 2025 / Revised: 16 June 2025 / Accepted: 26 June 2025 / Published: 30 June 2025

Abstract

Urban green spaces (UGSs), including parks, forests, and community gardens, play a critical role in enhancing public health and well-being by providing essential ecosystem services such as improving air quality, reducing surface temperatures, and mitigating harmful substances. As urbanization accelerates, especially in rapidly growing cities like Jinan, China, the demand for UGSs is intensifying, necessitating careful urban planning to balance development and environmental protection. While previous studies have often focused on city-level green coverage, this study shifts the analytical focus from UGS as a whole to urban functional units (UFUs), allowing for a more detailed examination of how green space is distributed across different land use types. We investigate UGS changes in Jinan over the past two decades and assess the influence of socio-economic factors—such as housing prices, land use types, and building age—on UGS distribution within UFUs. Remote sensing technology was employed to analyze the spatiotemporal dynamics of UGS and its correlation with these variables. Our findings reveal a significant shift in UGS distribution, with parks and leisure areas becoming primary drivers of UGS expansion. This study also highlights the growing influence of economic factors, particularly housing prices, on UGS distribution in more affluent UFUs. Additionally, while UGS in Jinan has generally expanded, challenges remain in balancing green space with urban expansion, especially in commercial and residential UFUs. This paper contributes to a more nuanced understanding of UGS distribution by integrating the UFU framework and identifying socio-economic drivers—including housing prices, construction age, and land use type—that shape green space patterns in Jinan. Our findings demonstrate that the spatial pattern of UGS in Jinan mirrors socio-economic and land use disparities observed in other global cities, highlighting both the universality of these patterns and the need for targeted planning in rapidly urbanizing contexts.

1. Introduction

Urban green spaces (UGSs) such as parks, street greenbelts, community gardens, forested patches, and green rooftops provide vital ecosystem services that contribute to human health and well-being [1,2]. These spaces are known to improve air quality, mitigate the urban heat island effect, reduce surface temperatures, and absorb harmful pollutants like sulfur dioxide and nitrogen oxides [1,2]. In particular, UGSs play a significant role in public health, supporting physical activity, providing restorative spaces, and offering environmental benefits [3,4]. These benefits are particularly crucial for elderly populations, where UGSs facilitate rest, physical activity, and social interaction [5]. Consequently, urban planning strategies must prioritize UGSs to optimize these health benefits, while balancing ecological sustainability with social equity [6,7].
However, urbanization pressures and the rapid expansion of built-up areas have often led to the encroachment and degradation of green spaces, making the preservation and expansion of UGSs a global challenge. Cities worldwide, including Los Angeles with its “Million Trees” initiative, have developed strategies to counteract these trends [8]. In China, the accelerating pace of urbanization, accompanied by a growing population density, has intensified the demand for UGS. The country’s urban population is expanding at a rate faster than the global average, posing significant challenges for integrating green spaces into urban planning [9]. Alongside their role in enhancing quality of life, UGSs are critical in mitigating environmental issues such as urban heat islands and supporting biodiversity [10].
While global trends reflect a general increase in UGS, there remains a significant issue of uneven distribution, with wealthier and more developed areas often benefiting from better access to green spaces. Several hypotheses have been proposed to explain these disparities: the “luxury effect”, where wealthier neighborhoods tend to have more green space due to greater financial resources and a preference for ecological conditions [4,11]; the “legacy effect”, which highlights the long-lasting influence of past land use and urban planning decisions; and the “land use hypothesis”, which suggests that changes in urban land use, such as the conversion of residential areas to commercial zones, significantly impact UGS distribution [5,12]. These concepts are useful for understanding the drivers of UGS distribution but do not fully account for the complex socio-economic and spatial dynamics that govern green space accessibility in rapidly urbanizing cities.
Recent advances in remote sensing technology have enhanced our ability to study UGS dynamics. Satellite and drone imagery allow for detailed assessments of the green space distribution across various land use types, providing valuable data for urban planning [12]. Integrating this remote sensing data with socio-economic variables—such as population density, housing prices, and community history—has revealed strong correlations between these factors and the spatial configuration of UGS [13]. This approach enables a more nuanced understanding of how socio-economic factors shape the distribution and accessibility of UGS.
This study focuses on Jinan, a representative inland city in Northern China, to address a significant gap in the literature concerning UGS distribution in rapidly growing urban centers within China’s diverse regional contexts. Jinan, known as the “Spring City”, has a population of approximately 9.437 million (as of 2023) and is characterized by a mix of low mountains, hills, plains, and a warm temperate climate. The city is strategically important as a major economic and logistics hub in Shandong Province, with an expanding urban footprint. Despite Jinan’s growth and natural beauty, the spatial distribution and accessibility of UGS remain under-researched, especially in the context of its rapid urbanization and the ongoing pressures on its environment.
This study aims to address the following core research questions: (1) What changes have occurred in the distribution of urban green spaces (UGSs) in Jinan over the past two decades? (2) What socio-economic factors—such as housing prices, land use types, and construction age—have influenced these changes? (3) Does the distribution of UGS in Jinan follow socio-economic and land use patterns observed in other global cities?
Given the unique urbanization challenges faced by Northern Chinese cities, this study uses Jinan as a case to expand the understanding of UGS dynamics in China. By filling current research gaps related to regional disparities and the equity of UGS distribution, this study seeks to provide more effective and equitable urban green space planning strategies for Jinan and other cities experiencing similar urbanization issues. By integrating remote sensing data with socio-economic analysis, a comprehensive analytical framework is developed to assess the spatial distribution patterns of UGS and to inform future urban planning and policy decisions.

2. Materials and Methods

2.1. Study Area

Jinan (36°02′ N–37°54′ N, 116°21′ E–117°93′ E), often referred to as “Ji” or “Spring City”, is the capital of Shandong Province, China. Located within the Yellow River Basin, Jinan is a prominent central city with a population of approximately 9.44 million and an area of 10,244.45 km2 (source: http://www.jinan.gov.cn/index.html, accessed on 16 June 2024) (Figure 1). The city occupies a strategic position at the confluence of the low mountainous terrain in Southern Shandong and the alluvial plains to the northwest. Jinan experiences a warm temperate continental monsoon climate, and its diverse topography features low mountains, hills, plains, and low-lying areas along the Yellow River. Known for its abundant springs, the city has earned the nickname “Natural Karst Spring Water Museum”, which reflects its rich water resources and contributes to the region’s exceptional biodiversity.
In this study, we differentiate between the urbanized region of Jinan and its surrounding suburban and rural areas, ensuring that the study area accurately represents a typical urban landscape. The delineation of the urbanized area of Jinan [4], forms the basis of the research area for this investigation.

2.2. Definition of Urban Functional Units

Urban functional units (UFUs) refer to distinct areas within a city that are classified based on specific land use categories. These units are defined as physical spaces that support a range of activities, including education, transportation, and recreation, and encompass institutions such as schools, hospitals, and roads (Figure 2) [4]. In this study, we adopt the UFORE model’s “Field Data Collection Manual” along with the adaptation by for Jinan [3], to categorize the UFUs into 6 primary types and 18 secondary types. The primary UFU categories include public service areas, industrial and commercial zones, residential areas, recreational areas, transportation zones, and undeveloped land. These categories are further subdivided into secondary types, which include specific institutions such as universities, research centers, hospitals, major and minor roads, and hotels (Table 1).
UFUs are crucial elements in urban planning and management, serving as fundamental units that provide the spatial environments necessary for various human activities. They reflect the functional diversity and concentration of these activities within the city, making them vital for socio-economic analysis and urban applications.
For this study, a stratified random sampling approach was employed using Google Earth satellite imagery and ArcGIS 12.2 software. Initially, random sampling points were placed within the boundaries of the urban built-up area. A 1 km × 1 km grid was then established, and 1–2 UFUs were selected from each grid square across Jinan. A total of 151 UFUs were included in the analysis (Figure 1; Table 1). Within each UFU, we assessed the coverage of trees and shrubs, herbaceous plants, water bodies, built-up areas, and undeveloped land (Table 1). Additionally, UGS was quantified as the combined coverage of trees, shrubs, and herbaceous plants. Using ArcGIS 12.2 and high-resolution 1 m Google Earth imagery from both 2000 and 2020, we analyzed the proportions of UGS, water bodies, built-up areas, and undeveloped land within each UFU.

2.3. Potential Drivers of the UGS System in Jinan

We collected variable data through field surveys to identify the potential drivers influencing the presence and distribution of the UGS system in Jinan. At least one sample plot was established within each urban functional unit (UFU). This approach directly relates to Zhang [4], whose methodology also emphasized a structured yet flexible sampling design that moves from broader spatial units (like grid cells) to specific field plots. By adapting Zhang’s framework, this study benefits from a tested and validated strategy for integrating spatial analysis with field-based data collection, which enhances the reliability and comparability of the results [4].
The following variables were considered as potential predictors of UGS: primary UFU types, secondary UFU types, population density (persons per square kilometer), construction age, and housing prices (RMB/m2). These variables were selected based on the premise that land use (represented by primary and secondary UFU types), legacy effects (reflected by building age), and luxury effects (indicated by housing prices) may influence the distribution of UGS. Consequently, the collection of these variables facilitates an assessment of their relevance to UGS patterns in Jinan during both 2000 and 2020. UGS was classified into five categories: (i) tree and shrub, (ii) herb, (iii) water, (iv) built-up, and (v) undeveloped.
Calculation of population density. To determine the population (P) of each UFU, we used the following formula:
P = A × B × C × D
where A is the number of residential buildings in the UFU, determined through aerial photographs and field surveys; B is the number of floors per building; C is the number of residential units (households) per floor; D is the average number of persons per household (2.62 persons per household, according to 2020 data from the National Bureau of Statistics of China).
Population density was subsequently calculated using the formula
Population density = P/E
where E represents the area of each UFU in square kilometers.
The construction age of each UFU is defined as the number of years from its start date to the target year. For example, if a UFU was constructed in 1997, its construction age would be 3 years in 2000 and 23 years in 2020. Construction dates were obtained through one of three methods: consulting government or real estate websites for construction records, interviewing property management departments if construction dates were unavailable, or analyzing Google Earth imagery from different years if the prior methods were unsuccessful.
Housing price data for 2000 and 2020 was sourced from the leading real estate platform, “Anjuke” (https://m.anjuke.com/bj/, accessed on 16 June 2024).

2.4. Data Analysis

This study employed a multiple linear regression model, complemented by diagnostic tests, to analyze the driving factors influencing the UGS system. The research covers data from different UFUs in Jinan for the years 2000 and 2020 and utilizes spatial and temporal comparisons to identify the mechanisms affecting UGS distribution.
The dataset was derived from field surveys and statistical analysis, with key variables including built-up area, undeveloped land area, water area, construction age, housing price, and population density. To ensure the data’s completeness, missing values were removed using the na.omit function during the data cleaning process. The data for each UFU was organized into subsets based on row numbers, corresponding to five major UFU types: industrial and commercial districts, public service districts, recreational and leisure districts, residential districts, and transportation districts.
The regression model was constructed with UGS as the dependent variable and independent variables related to land use, legacy effects, and luxury effects as the main predictors. The model was fitted using the 1 m function to capture the primary drivers of the UGS ratio. Separate models were developed for each UFU to examine the driving mechanisms within different functional units.
To ensure the model’s reliability and scientific rigor, several diagnostic tests were employed. The Variance Inflation Factor (VIF) was used to assess multicollinearity among the independent variables, with a VIF value exceeding 10 indicating potential multicollinearity issues. The Durbin–Watson test was applied to check for autocorrelation in the residuals, with a statistic close to 2 suggesting the absence of significant autocorrelation. Additionally, the Breusch–Pagan test was used to detect heteroscedasticity and to verify whether the residuals satisfied the homoscedasticity assumption.
  • UFU Partition and Temporal Comparison Analysis
Based on the UFU classification, the model analysis results were partitioned into five categories: industrial and commercial districts, public service districts, recreational and leisure districts, residential districts, and transportation districts. This partitioning allows for the examination of variations in UGS distribution across different functional units.
For instance, in industrial and commercial districts, the focus is placed on evaluating the impacts of built-up area and population density, while in residential districts, the primary drivers are housing prices and population density. Each UFU type is analyzed separately to understand the distinct factors influencing UGS distribution within these areas.
Furthermore, separate models were constructed for the years 2000 and 2020 to facilitate a temporal comparison of the driving factors of UGS. This approach allows for the exploration of the dynamic effects of time on UGS distribution, revealing how changes over the two decades have influenced the spatial patterns and drivers of UGS in Jinan.

3. Results

3.1. Proportion of UGS in Different UFUs

The overall proportion of UGS within the UFUs of Jinan decreased from 50.35% in 2000 to 43.15% in 2020 (Table 2). Different types of UGS coverage exhibited distinct spatiotemporal changes over this period. The proportion of trees and shrubs increased from 30.89% in 2000 to 34.31% in 2020, reflecting an expansion in vegetative green cover. In contrast, the proportion of developed land saw a significant increase, rising from 45.06% in 2000 to 55.79% in 2020, indicating a notable shift toward urbanization over the two decades.
In 2020, the proportion of UGS in parks was significantly higher than in 2000 (Figure 3; Table A1). In 2000, parks had the highest average UGS proportion (75.17% ± 97.12%, n = 15), while shopping malls had the lowest (6.76% ± 9.04%, n = 4). By 2020, parks maintained the highest average UGS proportion (86.51% ± 108.45%, n = 15), while shopping malls continued to exhibit the lowest proportion (3.05% ± 2.46%, n = 4). Between 2000 and 2020, the UGS proportion in industrial areas experienced the largest average decrease, dropping by 53.19%.

3.2. Land Cover in Secondary UFUs Between 2000 and 2020

The area with the highest coverage of trees and shrubs was parks, which increased from 56.33% in 2000 to 78.09% in 2020, reflecting a substantial improvement (Table 3; Figure 4). Throughout the study period, parks consistently maintained the largest proportion of tree and shrub coverage. In contrast, tree and shrub coverage in primary and secondary schools significantly decreased from 25.79% in 2000 to 9.74% in 2020. Similarly, tree and shrub coverage in hospitals also decreased from 25.39% to 12.73%.
The coverage of herbaceous vegetation displayed varying trends across different UFUs. In primary and secondary schools, herbaceous vegetation coverage significantly increased from 11.50% to 17.08%. In contrast, the coverage in universities decreased from 16.22% to 9.25%. Water coverage remained relatively low across most UFUs, with parks having the highest proportion. In parks, water coverage slightly increased from 7.92% to 9.81%, while in universities, it slightly decreased from 0.52% to 0.47%.
Supermarkets exhibited the highest proportion of built-up space, which increased from 92.76% in 2000 to 96.79% in 2020. The built-up area in bus parking zones also saw a significant rise, from 10.76% to 62.38%. In contrast, the built-up area in parks remained relatively stable, decreasing only slightly from 14.87% to 13.48%. The proportion of undeveloped land showed the most significant decrease in barren land, dropping from 65.57% in 2000 to 15.22% in 2020.

3.3. Assessment of Potential Drivers of Urban Greening Proportion

In the primary UFUs, the proportion of public service areas to UGS was significantly positively correlated in both 2000 (β = 0.144 **) and 2020 (β = 0.115 ***) (Table 4 and Table A2). Leisure and entertainment areas were the most significant positive factor driving changes in UGS proportions, with their influence increasing from 2000 (β = 0.483 ***) to 2020 (β = 0.646 ***). The explanatory power of the model improved notably, with R2 increasing from 0.25 in 2000 to 0.52 in 2020, indicating a stronger understanding of the driving factors behind UGS in recent years. Additionally, the Variance Inflation Factor (VIF) for all predictor variables remained below 2 for both years, confirming the absence of multicollinearity issues.
In secondary UFUs, UGS in public service areas in 2000 was negatively correlated with built-up area (β = −0.392 **) (Table 5 and Table A3). In residential areas (R2 = 0.61), UGS was positively correlated with built-up area (β = 0.161 ***) and housing price (β = 0.124 *), while building age showed a negative correlation with UGS (β = −0.116 *). In transportation areas (R2 = 0.42), UGS was positively correlated with population density.
In 2020, UGS in industrial and commercial areas showed a positive correlation with building age (β = −0.176 *). In public service areas, UGS exhibited a negative correlation with undeveloped land area (β = −0.213 *). In residential areas, UGS was positively correlated with housing price (β = 0.059 **).

4. Discussion

4.1. Change in Land Cover in Jinan

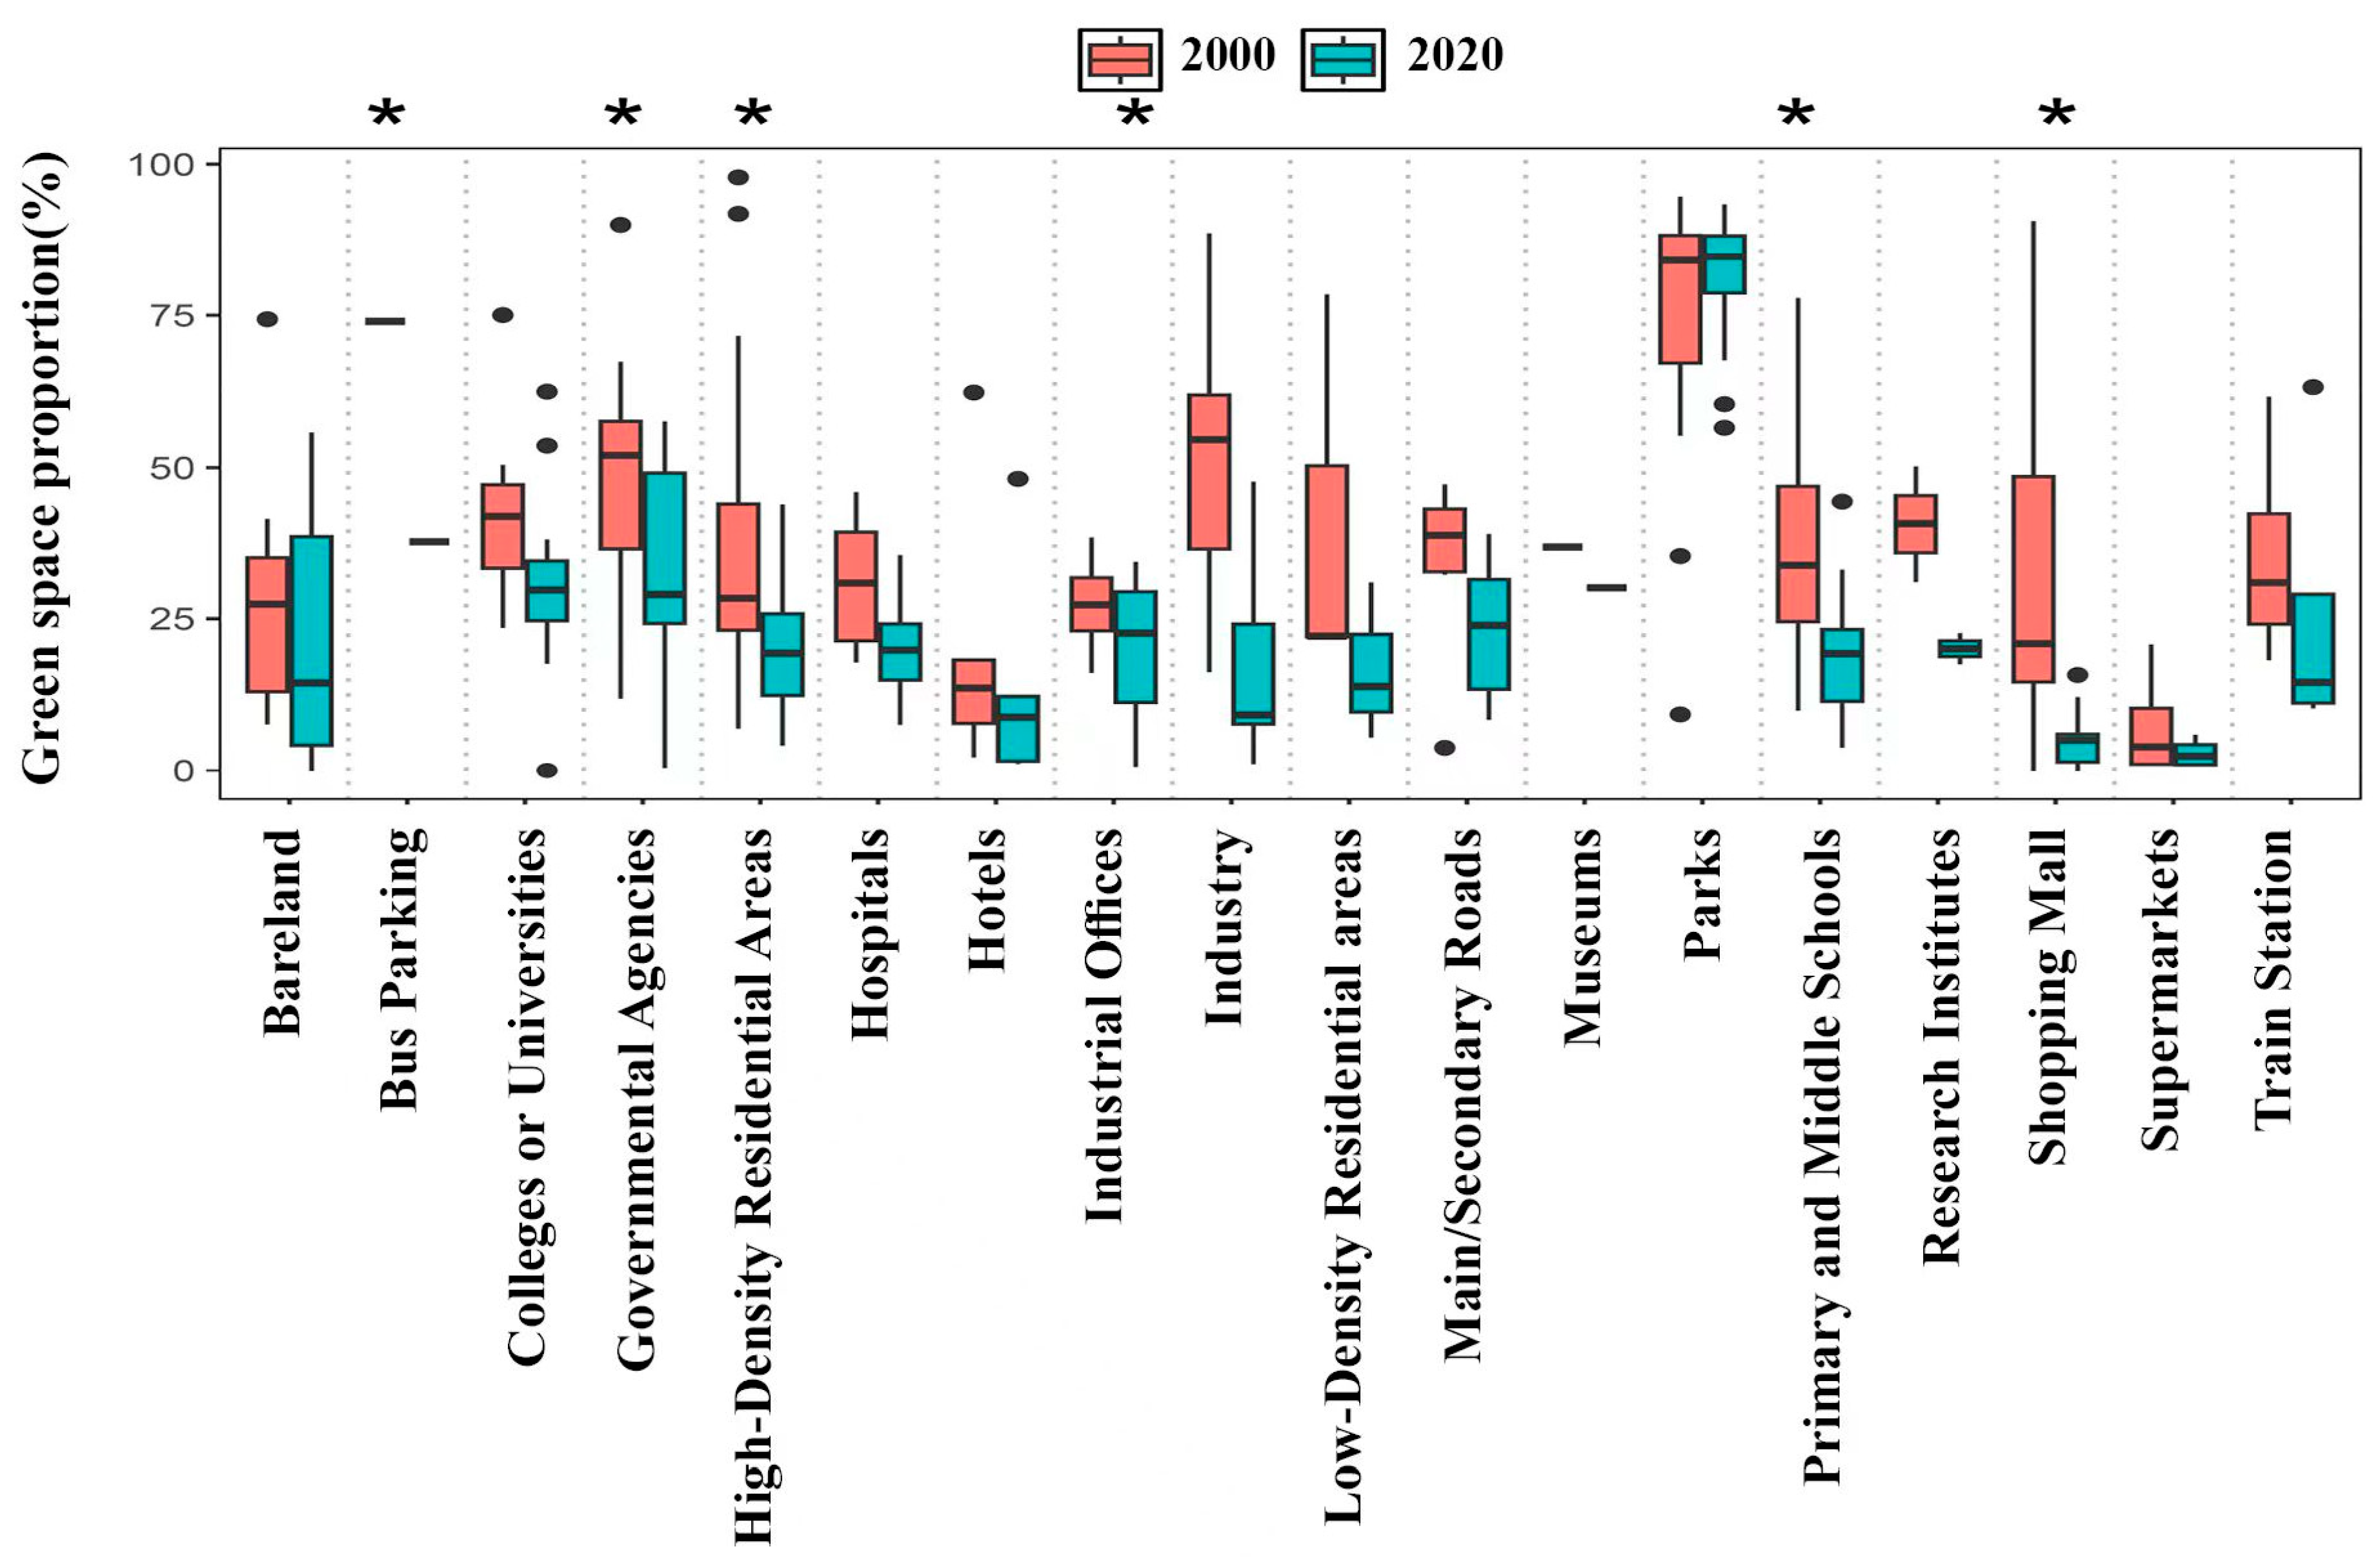
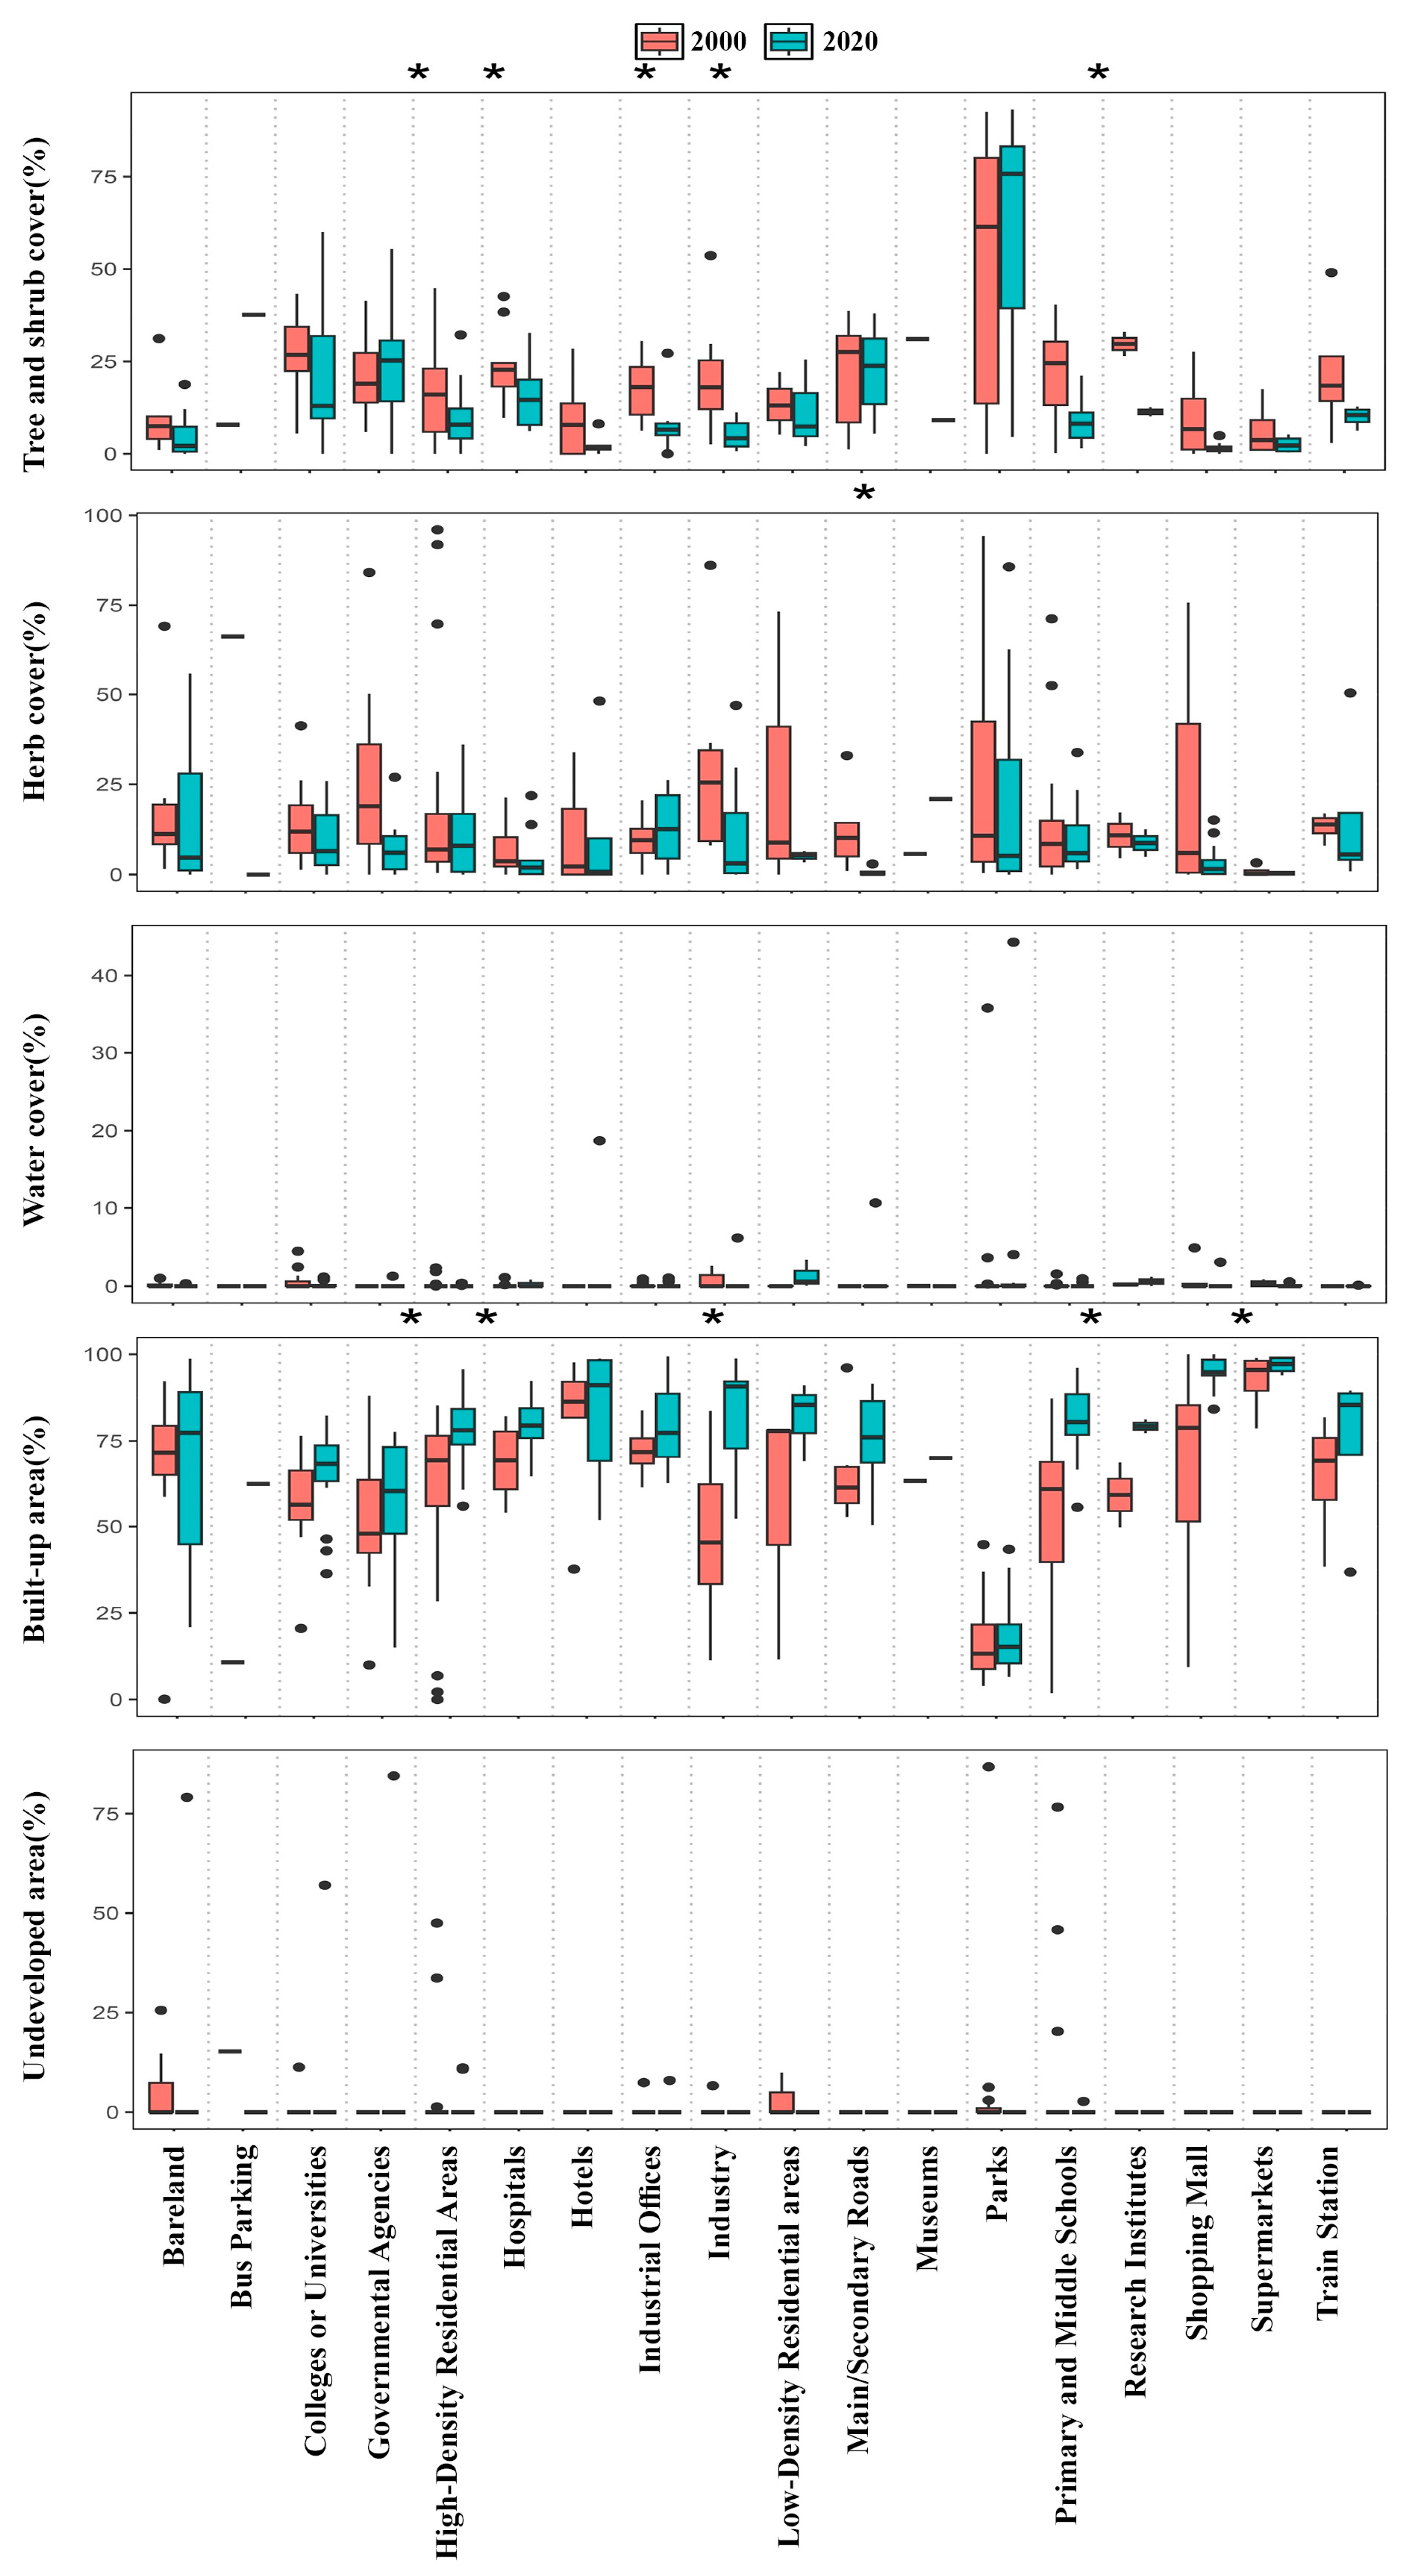
The analysis of land cover changes from 2000 to 2020 reveals significant shifts in vegetation and built-up areas across various UFUs. Notably, parks exhibited a remarkable increase in tree and shrub coverage, growing from 56.33% to 78.09%. This expansion suggests a successful urban greening initiative, enhancing ecological benefits such as improved air quality, increased biodiversity, and enhanced recreational spaces for residents. The sustained dominance of parks in maintaining a high vegetation coverage underscores their critical role in urban planning and sustainability efforts. Urban greening, which includes increasing tree and shrub coverage in urban areas, offers a range of benefits that contribute to environmental sustainability [14]. Increasing vegetation in urban spaces is known to improve air quality by absorbing pollutants and reducing urban heat islands, which can lead to a decrease in local temperatures and energy consumption [15]. Additionally, well-designed green spaces like parks enhance biodiversity by providing habitats for various species and improving ecological connectivity within urban areas [16]. The presence of trees and shrubs in urban areas also contributes to the mental and physical well-being of residents by offering recreational opportunities and enhancing their aesthetic value [17]. Furthermore, urban greening supports sustainability efforts by mitigating the impacts of climate change through carbon sequestration and water management, contributing to the overall resilience of cities.
The rise in vegetation coverage brings a wide array of ecological, health, social, and economic benefits to the urban environment. Ecologically, urban vegetation—especially trees and shrubs—can reduce airborne pollutants by retaining particulate matter such as PM2.5 on leaf surfaces and absorbing gaseous pollutants like nitrogen dioxide and ozone, thereby significantly improving air quality. Through transpiration and shading, plants also mitigate the urban heat island effect, helping to reduce peak temperatures and the frequency of heatwaves.
The decline in tree and shrub coverage in schools and hospitals, from 25.79% to 9.74% in schools and from 25.39% to 12.73% in hospitals, is a worrying trend with potential implications for the mental health and well-being of students and patients. Numerous studies highlight the positive impact of green spaces on mental health, showing that exposure to nature can significantly reduce stress, anxiety, and depression. For example, access to natural environments has been linked to improved cognitive function and academic performance in schools, while in healthcare settings, green spaces have been found to aid in a faster recovery, reduce pain perception, and improve overall patient satisfaction. Furthermore, urbanization pressures often lead to a reduction in green spaces in favor of development, which can exacerbate mental health issues, as a lack of greenery is associated with increased stress and reduced well-being [18]. This decline in vegetation could reflect an insufficient prioritization of natural spaces in institutional planning, which may lead to long-term negative consequences for individuals who rely on these settings for education or healthcare. Therefore, the loss of greenery in schools and hospitals not only undermines the aesthetic value of these spaces but also deprives individuals of the mental health benefits associated with nature.
The trends in herbaceous vegetation across different educational institutions highlight the evolving dynamics of urban landscapes and their impact on the built environment. Primary and secondary schools have seen an increase in herbaceous coverage, from 11.50% to 17.08%, suggesting a shift towards more green, natural environments. This increase can enhance learning spaces by improving air quality, providing restorative areas for students, and fostering a connection with nature. In contrast, universities experienced a decline in herbaceous coverage, from 16.22% to 9.25%, likely due to competing priorities in land use. As universities expand their infrastructures to accommodate larger student populations, green spaces may be sacrificed for new buildings and facilities, reflecting a trend towards more built-up environments [19]. This disparity in herbaceous vegetation between schools and universities may thus be attributed to differences in land use priorities and available space, with schools prioritizing green spaces for educational benefit, while universities focus more on infrastructure development due to space constraints [8].
Water coverage in urban areas tends to remain relatively stable, with parks generally maintaining the highest proportions of water features. This stability suggests that parks have successfully integrated water bodies to enhance their aesthetics and support local ecosystems, aligning with urban sustainability goals [20]. The slight increase in water coverage within parks reflects intentional urban planning strategies, such as integrating water-sensitive urban designs to improve ecological functionality and mitigate urban heat islands. However, other urban areas, including universities, have seen minimal changes or a slight decrease in water coverage, indicating potential gaps in urban planning that could benefit from the inclusion of water features. Incorporating water-sensitive design elements, such as rain gardens and permeable surfaces, could enhance biodiversity, support mental health, and contribute to better stormwater management in these spaces. These observations underline the need for holistic urban planning approaches that integrate water features across diverse land uses to maximize ecological and social benefits.
The substantial increase in built-up areas, particularly in supermarkets and bus parking zones, reflects the ongoing trend of urbanization driven by growing commercial and transportation demands. This urban expansion caters to the logistical and economic needs of urban populations, but it also leads to the loss of natural landscapes and may contribute to environmental challenges such as the urban heat island effect. As urban areas become more built up, the prevalence of impervious surfaces increases, which exacerbates temperature rises and reduces the natural cooling capacity of the environment [21]. This shift toward a more developed infrastructure underscores the need for cities to strike a balance between meeting the demands for economic growth and maintaining green spaces that can mitigate environmental impacts [22]. Preserving these natural areas is essential not only for ecological reasons but also for the well-being of urban residents, as green spaces help reduce the intensity of urban heat island effects, promote biodiversity, and improve air quality. Effective urban planning strategies must therefore integrate both built infrastructure and nature to ensure sustainable, livable cities.
The significant reduction in undeveloped barren land, from 65.57% in 2000 to 15.22% in 2020, underscores the accelerating trend of urbanization. This shift toward more developed areas brings both opportunities and challenges. On one hand, urban development drives economic growth, enhances infrastructure, and meets the growing demand for housing and services. This development, however, can lead to negative environmental impacts. Urbanization often results in reduced permeability, leading to increased surface runoff, which exacerbates flooding and water quality degradation. The loss of permeable surfaces reduces the ability of natural systems to absorb water and manage stormwater runoff, making cities more vulnerable to flooding. Another consequence is the fragmentation of natural habitats, leading to a decline in biodiversity. Urban sprawl divides ecosystems into smaller patches, disrupting wildlife movement and reducing habitat availability. This fragmentation can significantly diminish species diversity and ecological resilience. To address these environmental challenges, sustainable development practices should be integrated into urban planning. Green infrastructure, including permeable pavements, green roofs, and urban wetlands, can restore some of the lost permeability, reduce runoff, and support local ecosystems. These solutions not only mitigate environmental impacts but also enhance urban resilience against extreme weather events.

4.2. Drivers of Patterns in Distribution and Amount of UGS in Jinan over the Past Two Decades

The increase in tree and shrub coverage within parks over a two-decade period underscores the significant role of urban greening initiatives in shaping urban landscapes. Among the key socio-economic factors, housing prices emerged as a consistent positive predictor of UGS distribution across both primary and secondary UFUs. This supports the “luxury effect” hypothesis, where more affluent areas possess greater access to green amenities. Construction age, particularly in residential districts, showed a negative association with UGS, indicating that older developments may lack the green infrastructure integrated into newer planning. Furthermore, land use types, particularly recreation and public service areas, were found to exert a strong positive influence on vegetation coverage. These patterns confirm that socio-economic conditions—such as wealth level, planning legacy, and functional land designation—are pivotal in determining the green space distribution in Jinan. As development pressures continue to expand built-up areas, urban planners have increasingly recognized the importance of integrating green spaces, particularly parks, into city designs. These efforts have led to a substantial rise in vegetation coverage within recreational areas, highlighting the effectiveness of land management strategies aimed at preserving and enhancing urban greenery. Studies have shown that urban greening strategies, such as increasing park vegetation, contribute significantly to mitigating heat islands, improving air quality, and fostering biodiversity in cities [23]. Parks, with their expanding tree and shrub coverage, not only contribute to aesthetic value but also play critical roles in urban resilience. They help mitigate heat islands, conserve biodiversity, and improve overall human well-being. The increased vegetation coverage within parks reflects a broader trend in urban planning, where the need for green infrastructure is prioritized to address environmental challenges and enhance the quality of life for city dwellers [24].
The marked reduction in tree and shrub coverage within primary and secondary schools, and to a lesser extent in hospitals, suggests a significant trade-off between infrastructure development and the retention of green space. As urban populations grow and institutional needs expand, schools and hospitals often prioritize the construction of new facilities over the preservation of natural areas [25]. This loss of greenery has implications not only for environmental quality by reducing the benefits of urban cooling, air purification, and biodiversity but also for public health. Green spaces in educational and healthcare settings have been linked to improved academic performance, stress reduction, and faster recovery times for patients. Moreover, the diminishing presence of vegetation exacerbates the urban heat island effect, increasing energy consumption and creating heat-related health risks. Therefore, there is a clear need for policies that balance infrastructure growth with the integration of green spaces, promoting urban resilience and supporting the health and well-being of the populations that rely on these essential public services.
The shifts in herbaceous vegetation coverage across different urban spaces, such as primary and secondary schools versus universities, are influenced by varying management practices, landscaping preferences, and development priorities. Primary and secondary schools are more likely to incorporate herbaceous plants in their landscapes due to their low maintenance costs and aesthetic appeal. Additionally, these plants can serve educational purposes, providing hands-on opportunities to teach students about ecology and environmental sustainability. In contrast, universities, particularly in urban settings, often face space constraints driven by the need for infrastructure expansion. As a result, they tend to prioritize trees or hardscaping over herbaceous cover, as these options are seen as more durable and better suited for long-term use, especially in areas with high foot traffic. Despite their relatively low carbon sequestration potential compared to trees, herbaceous plants offer critical ecological benefits, including soil stabilization, pollinator support, and aesthetic enhancement. These functions are crucial in maintaining biodiversity and resilience in urban ecosystems.
Water coverage, although generally low across urban fabric use (UFU) types, shows a slight increase in parks compared to universities, indicating differing priorities when integrating water features. Parks, as public green spaces, are more likely to incorporate water bodies to improve local microclimates, enhance biodiversity, and provide recreational opportunities for urban residents. Water bodies can significantly reduce urban heat island effects by cooling surrounding areas through evaporation, making them valuable tools for mitigating the impacts of climate change in cities. Moreover, small water bodies support local biodiversity by providing habitats for aquatic species, insects, and birds, contributing to overall ecosystem health. On the other hand, universities often face challenges in integrating water features due to limited space and the high cost of maintenance. The competing demands for land and resources may make water features less feasible in university campuses, which may prioritize research facilities and student housing. Nonetheless, small water bodies, even in constrained urban settings, can still provide significant ecological and aesthetic benefits, supporting both human well-being and local wildlife. These observations highlight the need for thoughtful urban planning that prioritizes both development and ecological sustainability. By integrating herbaceous vegetation and water features into urban landscapes, cities can enhance their resilience to climate change, support biodiversity, and provide healthier, more attractive spaces for their inhabitants.
The rapid expansion of built-up spaces, particularly in commercial and transportation sectors such as supermarkets and bus parking zones, reflects broader urbanization trends driven by increasing demands for infrastructure and services. While this growth enhances economic activity and improves service accessibility, it also brings significant environmental challenges. Research indicates that the expansion of impervious surfaces in these areas exacerbates the urban heat island effect, raising temperatures and impacting local climates. Additionally, larger built environments contribute to increased stormwater runoff, overwhelming existing drainage systems and potentially leading to localized flooding and pollution. The loss of natural habitats is another major consequence, as the conversion of green spaces to urban infrastructure reduces biodiversity and disrupts local ecosystems. Thus, while the growth of built environments plays a crucial role in urban development, it also highlights the need for sustainable urban planning that mitigates its environmental impact.
The reduction in undeveloped land, particularly barren land, due to urban infill and land intensification, represents a significant shift in land-use patterns that presents both benefits and challenges. While urban infill helps optimize land use by focusing development within existing urban areas, reducing urban sprawl, and promoting sustainable growth, the conversion of barren lands, which often provide vital ecological services such as carbon sequestration and biodiversity support, may lead to environmental drawbacks. Additionally, these less-developed lands frequently serve as accessible public spaces that contribute to social cohesion and community well-being, functions that may be diminished as urbanization encroaches. As urban areas grow, it becomes critical to balance these ecological and social losses with sustainable urban planning strategies, such as integrating green infrastructure, to preserve the multifaceted benefits that barren lands provide.

4.3. Comparison of the Drivers of the Distribution of UGS in Jinan and Other Cities

The analysis of urban green space (UGS) in Jinan from 2000 to 2020 reveals several key trends in its development, reflecting both local and global urban planning dynamics. One notable trend is the positive correlation between UGS and public service districts, as evidenced by β values of 0.144 ** in 2000 and 0.115 *** in 2020. This suggests that urban planning in these areas has increasingly prioritized green spaces, especially around government buildings, civic centers, and institutions. This shift aligns with growing ecological awareness, emphasizing the integration of green spaces within public service zones. Furthermore, UGS in these areas is associated with improved community health, as studies have shown that regions with a higher green space coverage tend to experience lower disease morbidity rates, supporting the notion that well-planned green spaces in public service areas promote better public health. A study in Mumbai also observed that neighborhoods with a higher socio-economic status benefit from better access to quality green spaces, highlighting the importance of equitable urban planning, particularly in high-priority areas such as government districts.
The positive correlation between UGS and leisure areas in Jinan, increasing from β = 0.483 in 2000 to β = 0.646 in 2020, suggests an increasing focus on parks, recreational spaces, and lakeside areas, particularly near natural features such as Daming Lake. This trend mirrors findings from a study on the effects of the rapid urbanization on green spaces and well-being in Jinan, which reported a significant rise in green spaces and a corresponding improvement in residents’ quality of life. Additionally, research across major Chinese cities has shown that increased urban park space enhances both environmental quality and social interaction, further underscoring the growing importance of leisure areas in urban planning.
However, the negative correlation between UGS and built-up areas in public service zones (β = −0.392 **) in 2000 reflects the initial constraints of dense urbanization on green space expansion. This issue is common in rapidly developing cities, where urban growth often leads to the encroachment of natural areas. Studies on urban sprawl, particularly those focusing on China between 1990 and 2015, emphasize the pressure of rising land values, which often results in the prioritization of built-up areas over green space. Nevertheless, Jinan appears to have adjusted its urban planning policies over time to counteract these effects, incorporating green spaces into new developments and retrofitting older areas. As urbanization continues, the negative environmental impacts, such as rising pollution and the urban heat island effect, have prompted the further integration of green spaces into urban design as part of sustainable development strategies [13].
The finding that UGS is positively correlated with housing prices (β = 0.124 * in 2020) is consistent with studies highlighting the economic value of green spaces. Research indicates that green areas not only improve aesthetic appeal but also enhance property values, as they contribute to a better environmental quality and neighborhood satisfaction. For example, a study in Brazil found that residents’ satisfaction was significantly influenced by the availability of green spaces, along with other amenities such as commerce and schools. Similarly, research in Medellín, Colombia, highlights how urban design features, particularly green spaces, can influence property investment and the overall attractiveness of residential areas. Further supporting this, a study on vacant land in Oklahoma City found that even potential green spaces contributed positively to housing values and urban renewal. These findings converge on the idea that UGSs serve as vital urban infrastructure, not only providing environmental benefits but also generating economic advantages by attracting investment and enhancing residents’ quality of life.
Urban areas often prioritize economic growth, sometimes at the expense of UGS, especially in areas with high land values or where local governments are focused on financial revenue from development [16]. The loss of UGS is frequently linked to changes in land use, as observed in cities like Kolkata, where rapid urbanization has led to a significant reduction in green space [10,11] Similarly, the spatial distribution of UGS can be influenced by accessibility to public transportation. In Taipei, for example, UGS on vacant land and rooftops decreases as public transport accessibility improves, suggesting that urban development tends to prioritize well-connected areas [18]. Furthermore, the urban form, including road density and built-up boundaries, often leads to fragmentation of green spaces, particularly in cities with complex layouts [19]. Additionally, the reduction in UGS can exacerbate urban heat island effects, as seen in Bangkok, where diminished green space has led to higher land surface temperatures [22].
In transportation zones, UGS shows a positive correlation with population density (β = 6.775 * in 2020), reflecting a trend toward integrating green spaces into densely populated transportation hubs. This helps to improve air quality and mitigate heat island effects. Jinan’s urban planning strategy, which prioritizes sustainable transport, incorporates green infrastructure such as bike lanes and tree-lined streets in transportation corridors. A study in Jinan found that increased population density tends to negatively impact access to UGS, highlighting the need for urban planning strategies that balance transportation infrastructure with an equitable green space distribution to improve sustainability and livability.
Water areas, which played a significant role in UGS in 2000 (β = 0.984), show a reduced influence by 2020 (β = 0.286). This change reflects a broader diversification of green space types, with parks and urban forests now contributing more to urban ecosystem services, including cooling, flood regulation, and aesthetic benefits. In many urban settings, the focus has shifted from relying solely on water features to improving the overall configuration of green spaces, which has proven more effective in mitigating urban heat islands.
The negative correlation between the construction age and UGS in residential areas (β = −0.116 * in 2000) highlights the challenges posed by older neighborhoods, which often have less green space than newer developments. Modern urban planning tends to integrate more green spaces, particularly in new areas, while retrofitting older areas remains a significant challenge. Studies emphasize that aging infrastructure often fails to meet the environmental and social needs of an aging population, including access to green spaces. Furthermore, newer districts tend to offer better health outcomes, partly due to the incorporation of high-quality green spaces. Research on urban green spaces in Berlin suggests that while newer districts benefit from better green space access, older areas struggle with providing equitable access due to past planning decisions. The integration of green spaces into older urban areas is essential for creating environments that accommodate a growing elderly population. The increase in the model’s R2 from 0.25 *** in 2000 to 0.52 *** in 2020 demonstrates Jinan’s evolving approach to urban sustainability. This improvement reflects a more integrated and comprehensive understanding of the role of UGS in enhancing urban livability and resilience.
Overall, our findings support the notion that the UGS distribution in Jinan reflects patterns documented in other global cities such as New York, Mumbai, and Berlin, where socio-economic disparities lead to unequal access to urban greenery. The positive associations between green space and wealthier UFUs in Jinan mirror the global “luxury effect”. Similarly, the legacy effect of earlier urban planning decisions explains the lower vegetation coverage in older districts. These parallels confirm that Jinan’s UGS dynamics are not isolated but fit within broader global urban ecological patterns.

4.4. Implications

The observed trends in UGS, built-up expansion, and institutional support underscore the pressing need for sustainable strategies that balance development with ecological integrity. Although the increase in tree and shrub coverage within parks indicates positive progress in enhancing urban resilience and biodiversity, the reduction of UGS in schools and hospitals more accurately reflects the growing building density of educational and healthcare facilities driven by population growth and rising societal demand. In order to accommodate the growing number of people they serve, hospitals and schools have prioritized the expansion of functional building areas, which has consequently reduced the space originally allocated for greenery. Similarly, although expanding commercial and transportation infrastructure signals economic growth, it also presents challenges, such as the heat island effect and loss of natural habitats, which can be mitigated through green building practices and the integration of sustainable features like permeable pavements and green roofs. By recognizing these interconnected trends and prioritizing policies that safeguard green areas in educational and healthcare institutions, as well as implementing nature-based solutions in newly developed commercial sectors, city planners can foster a more harmonious and enduring model of urban development that ensures environmental benefits, public health, and long-term resilience.

5. Conclusions

This study analyzes the changes in UGS in Jinan from 2000 to 2020, revealing a decline in overall green space from 50.35% to 43.15%, driven by urban expansion in commercial and transportation areas. Despite this, improvements in tree and shrub coverage, particularly in parks and leisure zones, reflect efforts to enhance ecological benefits. However, the five-category classification used to define urban functional units may limit the analysis, as it may oversimplify the diverse and dynamic land use patterns within the urban landscape. Key drivers of UGS distribution include socio-economic factors like housing prices, population density, and land use. The “luxury effect” has intensified in affluent areas, where higher green space proportions are observed. Public service zones and leisure areas have emerged as major contributors to UGS expansion, underscoring the importance of targeted urban planning in these zones. The research also suggests that while early urbanization restricted green space growth, Jinan’s recent policies have integrated more UGS into new developments and retrofitted older areas to address environmental challenges. Additionally, UGS correlates positively with housing prices, emphasizing its economic value in urban planning. Jinan’s urban planning should prioritize a sustainable, equitable UGS distribution to enhance both environmental quality and residents’ quality of life. These efforts are crucial as the city continues to urbanize and address the challenges of population growth and climate change.

Author Contributions

Conceptualization, H.-L.Z. and W.W.; methodology, H.-L.Z., W.W., Y.W., F.M. and H.X.; software, R.S.; validation, H.-L.Z., W.W., H.X., M.M.N. and Z.Z.; formal analysis, H.-L.Z.; investigation, W.W.; resources, Y.W. and F.M.; data curation, R.S.; writing—original draft preparation, H.-L.Z. and W.W.; writing—review and editing, Y.W., F.M., R.S., H.X., M.M.N. and Z.Z.; visualization, Y.W. and F.M.; supervision, M.M.N. and Z.Z.; project administration, H.-L.Z.; funding acquisition, Z.Z. All authors have read and agreed to the published version of the manuscript.

Funding

This work was supported by the Qingdao Postdoctoral Application Research Project (QDBSH20240201028). This work was also supported by the Taishan Youth Scholar Program of Shandong Province (NO. tsqn202103059).

Institutional Review Board Statement

No applicated.

Informed Consent Statement

No applicated.

Data Availability Statement

Data will be made available on request.

Acknowledgments

Thanks to Zhang Chi and Luo Jie for assisting with data collection and analysis.

Conflicts of Interest

The authors declare no conflict of interest.

Appendix A

Table A1. Absolute values of land cover occupied by tree and shrub, herb, water, built-up area, and undeveloped land in primary and secondary UFUs in Jinan in 2000 and 2020.
Primary Types of UFUsSecondary Types of UFUsTree and ShrubHerbWaterBuilt-UpUndeveloped Land
2000202020002020200020202000202020002020
Public affairs service districtsGovernmental agencies6226.255458.253620.7892.63020.59369.1811,900.260965.00
Colleges or universities66,282.4770,910.437,943.621,641.21227.471095.13121,010.31138,157.047524.62173.34
Primary and middle schools9590.943620.154276.756350.69167.0675.4421,731.2327,125.171426.9668.31
Research institutes4512.5172318381150241108403.4511,770.9500
Hospitals10,027.15028.12162.63193.120.412327,288.0631,153.9600
Industry and business districtsIndustry32,766.437185.5758,527.2611,570.86748.291760.1444,126.9115,861.32090
Shopping malls8544.851870.5425,077.423348419.7764.8565,264.9394,023.5800
Hotels110.8115.6561.6283.320478.43235.053030.1300
Industrial offices11,583.6984268211.858072.23167.85273.3855,229.3958,266.08601.54756.62
Supermarkets1110.5532.75172.2546.590.7530.2517,588.6718,352.6700
Residential districtsLow-density residential areas6991.33841919,646.73304814.33338.6724,705.842,131.532599.330
High-density residential areas13,770.3811,428.7119,837.158530.33112.196650,784.0865,821.841816.60473.1
Recreation and leisure districtsParks181,695.37251,848.9960,758.0727,187.4525,534.6731,65247,944.5043,468.036598.720
Museums30,740905356552073132062,600.569,243.500
TransportationBus parking59428324977.500008104695.5011460
Main roads and secondary roads16,233.8316,120.678984.67517.501168.6739,196.1346,607.7900
Train Station13,497.75793211,071.755814.5025.2564,152.0474,949.7900
Undeveloped landBareland7824.297007.5723,62715,761.25261.4367.5771,675.0476,989.645920.59549.81
Table A2. Comparison of Variance Inflation Factors (VIFs) for indicators across primary urban functional units (UFUs) in 2000 and 2020.
(VIF)20002020
Primary UFU2.0731.826
Built-up area1.1921.149
Undeveloped land area1.2211.020
Water area1.0741.067
Construction age1.2871.259
Housing price1.0331.089
Population density1.4141.400
(VIF)20002020
Primary UFU2.0731.826
Table A3. Comparison of Variance Inflation Factors (VIFs) for indicators across secondary urban functional units (UFUs) in 2000 and 2020.
(VIF)Industry and Business DistrictsPublic Affairs Service DistrictsRecreation and Leisure DistrictsResidential DistrictsTransportation
2000202020002020200020202000202020002020
Built-up area1.4661.1831.1641.45963.52121.8761.2561.865--
Undeveloped land area1.0441.0141.1461.06033.1162.8611.3221.090--
Water area1.2291.0921.0471.3401229.23913.9451.5104.074--
Construction age1.1281.1261.1551.0206.35511.3453.0453.708--
Housing price1.2351.2051.0971.3491571.93020.5802.8591.767--
Population density1.0681.0761.0781.201165.8341.6381.4563.220--

References

  1. Gupta, K.; Kumar, P.; Pathan, S.K.; Sharma, K.P. Urban Neighborhood Green Index–A measure of green spaces in urban areas. Landsc. Urban Plan. 2012, 105, 325–335. [Google Scholar] [CrossRef]
  2. Silva, L.T.; Fonseca, F.; Pires, M.; Mendes, B. SAUS: A tool for preserving urban green areas from air pollution. Urban For. Urban Green. 2019, 46, 126440. [Google Scholar] [CrossRef]
  3. Wang, W.; Awais, M.; Meng, F.; Wang, Y.; Nizamani, M.M.; Xue, H.; Zhao, Z.; Zhang, H.-L. Eco-Environmental Quality and Driving Mechanisms of Green Space in Urban Functional Units: A Case Study of Haikou, China. Sustainability 2025, 17, 4908. [Google Scholar] [CrossRef]
  4. Zhang, H.-L.; Cubino, J.P.; Nizamani, M.M.; Harris, A.J.; Cheng, X.-L.; Da, L.; Sun, Z.; Wang, H.F. Wealth and land use drive the distribution of urban green space in the tropical coastal city of Haikou, China. Urban For. Urban Green. 2022, 71, 127554. [Google Scholar] [CrossRef]
  5. Artmann, M.; Chen, X.; Ioja, C.; Hof, A.; Onose, D.; Ponizy, L.; Lamovsek, A.Z.; Breuste, J. The role of urban green spaces in care facilities for elderly people across European cities. Urban For. Urban Green. 2017, 27, 203–213. [Google Scholar] [CrossRef]
  6. Bowler, D.E.; Buyung-Ali, L.; Knight, T.M.; Pullin, A.S. Urban greening to cool towns and cities: A systematic review of the empirical evidence. Landsc. Urban Plan. 2010, 97, 147–155. [Google Scholar] [CrossRef]
  7. Corburn, J. Toward the Healthy City: People, Places, and the Politics of Urban Planning; Mit Press: Cambridge, MA, USA, 2009. [Google Scholar]
  8. Jim, C.Y.; Chen, S.S. Comprehensive greenspace planning based on landscape ecology principles in compact Nanjing city, China. Landsc. Urban Plan. 2003, 65, 95–116. [Google Scholar] [CrossRef]
  9. Pincetl, S. Implementing Municipal Tree Planting: Los Angeles Million-Tree Initiative. Environ. Manag. 2010, 45, 227–238. [Google Scholar] [CrossRef]
  10. Dinda, S.; Das Chatterjee, N.; Ghosh, S. An integrated simulation approach to the assessment of urban growth pattern and loss in urban green space in Kolkata, India: A GIS-based analysis. Ecol. Indic. 2021, 121, 107178. [Google Scholar] [CrossRef]
  11. Masoudi, M.; Tan, P.Y.; Fadaei, M. The effects of land use on spatial pattern of urban green spaces and their cooling ability. Urban Clim. 2021, 35, 100743. [Google Scholar] [CrossRef]
  12. Hope, D.; Gries, C.; Zhu, W.X.; Fagan, W.F.; Redman, C.L.; Grimm, N.B.; Nelson, A.L.; Martin, C.; Kinzig, A. Socioeconomics drive urban plant diversity. Proc. Natl. Acad. Sci. USA 2003, 100, 8788–8792. [Google Scholar] [CrossRef] [PubMed]
  13. Wang, D.; Xu, P.-Y.; An, B.-W.; Guo, Q.-P. Urban green infrastructure: Bridging biodiversity conservation and sustainable urban development through adaptive management approach. Front. Ecol. Evol. 2024, 12, 1440477. [Google Scholar] [CrossRef]
  14. Sathyakumar, V.; Ramsankaran, R.A.A.J.; Bardhan, R. Linking remotely sensed Urban Green Space (UGS) distribution patterns and Socio-Economic Status (SES)-A multi-scale probabilistic analysis based in Mumbai, India. Giscience Remote Sens. 2019, 56, 645–669. [Google Scholar] [CrossRef]
  15. Shackleton, C.M.; Gwedla, N. The Legacy Effects of Colonial and Apartheid Imprints on Urban Greening in South Africa: Spaces, Species, and Suitability. Front. Ecol. Evol. 2021, 8, 579813. [Google Scholar] [CrossRef]
  16. Tzoulas, K.; Korpela, K.; Venn, S.; Yli-Pelkonen, V.; Kazmierczak, A.; Niemela, J.; James, P. Promoting ecosystem and human health in urban areas using Green Infrastructure: A literature review. Landsc. Urban Plan. 2007, 81, 167–178. [Google Scholar] [CrossRef]
  17. Zhang, F.; Qian, H. A comprehensive review of the environmental benefits of urban green spaces. Environ. Res. 2024, 252, 118837. [Google Scholar] [CrossRef]
  18. Vujcic, M.; Tomicevic-Dubljevic, J.; Zivojinovic, I.; Toskovic, O. Connection between urban green areas and visitors’ physical and mental well-being. Urban For. Urban Green. 2019, 40, 299–307. [Google Scholar] [CrossRef]
  19. Hartig, T.; Mitchell, R.; de Vries, S.; Frumkin, H. Nature and Health. Annu. Rev. Public Health 2014, 35, 207–208. [Google Scholar] [CrossRef]
  20. Liu, Y.; Li, H.; Li, C.; Zhong, C.; Chen, X. An Investigation on Shenzhen Urban Green Space Changes and Their Effect on Local Eco-Environment in Recent Decades. Sustainability 2021, 13, 12549. [Google Scholar] [CrossRef]
  21. Wu, Z.; Zhang, Y. Spatial Variation of Urban Thermal Environment and Its Relation to Green Space Patterns: Implication to Sustainable Landscape Planning. Sustainability 2018, 10, 2249. [Google Scholar] [CrossRef]
  22. Zhang, H.-L.; Nizamani, M.M.; Guo, L.-Y.; Cui, J.; Cubino, J.P.; Hughes, A.C.; Wang, H.-F. Interplay of socio-economic and envi-ronmental factors in shaping urban plant biodiversity: A comprehensive analysis. Front. Ecol. Evol. 2024, 12, 1344343. [Google Scholar] [CrossRef]
  23. Miroshnyk, N.V.; Likhanov, A.F.; Grabovska, T.O.; Teslenko, I.K.; Roubik, H. Green infrastructure and relationship with urbanization—Importance and necessity of integrated governance. Land Use Policy 2022, 114, 105941. [Google Scholar] [CrossRef]
  24. Wang, H.-F.; Qiu, J.X.; Breuste, J.; Friedman, C.R.; Zhou, W.Q.; Wang, X.K. Variations of urban greenness across urban structural units in Beijing, China. Urban For. Urban Green. 2013, 12, 554–561. [Google Scholar] [CrossRef]
  25. Guo, L.Y.; Nizamani, M.M.; Harris, A.J.; Cubino, J.P.; Johnson, J.B.; Cui, J.P.; Zhang, H.-L.; Zhou, J.J.; Zhu, Z.X.; Wang, H.-F. Anthropogenic factors explain urban plant diversity across three tropical cities in China. Urban For. Urban Green. 2024, 95, 128323. [Google Scholar] [CrossRef]
Figure 1. (A) Map of China showing the location of Shandong Province. (B) Map of Shandong Province showing the location of the study area in Jinan. (C) Satellite map of Jinan (https://www.google.com/maps, accessed on 16 June 2024) showing the 151 urban functional units (UFUs) surveyed (red boundaries), with yellow grids representing 1 km × 1 km grid lines.
Sustainability 17 05993 g001
Figure 2. Example map of UFUs of the secondary type in Jinan. (A) Parks; (B) Hospitals; (C) Colleges or Universities; (D) Train Station; (E) Museums; (F) High-Density Residential Areas; (G) Low-Density Residential Areas; (H) Shopping Malls; (I) Research Institutes. (All images, including Figure 2, were taken by the authors).
Sustainability 17 05993 g002
Figure 3. Proportion of green space (%) in secondary UFUs of Jinan in 2000 and 2020. Asterisks (*) indicate significant differences between 2000 and 2020 based on Wilcoxon tests.
Sustainability 17 05993 g003
Figure 4. Box plots of the proportion of land cover classes (tree and shrub, herbs, water, built-up area, and undeveloped land) across secondary UFUs in Jinan in 2010 and 2020. Asterisks (*) indicate significant differences between 2000 and 2020 based on Wilcoxon tests.
Sustainability 17 05993 g004
Table 1. The number of primary and secondary UFUs sampled in Jinan.
Primary Urban Functional Unit TypeSecondary Urban Functional Unit TypeNumber Sample
Public affairs service districtsGovernmental Agencies8
Colleges or Universities15
Primary and Middle Schools16
Research Institutes2
Hospitals10
Industry and business districtsIndustry7
Hotels5
Industrial Offices13
Supermarkets4
Shopping Malls13
Residential districtsLow-Density Residential Areas3
(lower than six stories)
High-Density Residential Areas21
(higher than six stories)
Recreation and leisure districtsParks15
Museums1
TransportationMain/Secondary Roads6
Bus Parking1
Train Station4
Undeveloped landBareland7
Total 151
Table 2. Proportion (%) of total land use across UFUs in 2000 and 2020.
Land Cover Classes20002020
Total green space (UGS)50.3543.15
Tree and shrub30.8934.31
Herb19.468.84
Water2.573.18
Built-up45.0655.79
Undeveloped2.020.78
Table 3. Proportion of land cover occupied by tree and shrub, herb, water, built-up area, and undeveloped land in primary and secondary UFUs in Jinan in 2000 and 2020. Results for absolute values can be found in Appendix A (Table A1).
Primary Types of UFUsSecondary Types of UFUsTree and Shrub Area (%)Herb Area (%)Water Area (%)Built-Up Area (%)Undeveloped Area (%)
2000202020002020200020202000202020002020
Public affairs service districtsGovernmental agencies32.40 ± 57.7728.40 ± 40.4218.84 ± 15.734.65 ± 4.090 ± 00.11 ± 0.2848.76 ± 66.0961.93 ± 95.760 ± 05.02 ± 13.29
Colleges or universities28.33 ± 25.9030.31 ± 62.2316.22 ± 27.199.25 ± 9.830.52 ± 0.990.47 ± 1.2651.73 ± 51.9159.06 ± 51.693.22 ± 12.040.93 ± 3.48
Primary and middle schools25.79 ± 32.829.74 ± 11.5811.50 ± 14.5317.08 ± 31.260.45 ± 1.520.20 ± 0.5758.44 ± 68.6372.94 ± 64.413.84 ± 8.530.18 ± 0.71
Research institutes30.59 ± 10.6011.68 ± 4.0412.46 ± 9.037.79 ± 1.670.16 ± 0.160.75 ± 0.7556.96 ± 5.1979.78 ± 21.690 ± 00 ± 0
Hospitals25.39 ± 20.7812.73 ± 7.705.48 ± 6.108.08 ± 18.070.05 ± 0.120.31 ± 0.4669.09 ± 54.6878.87 ± 57.890 ± 00 ± 0
Industry and business districtsIndustry24.03 ± 40.045.27 ± 6.0442.92 ± 71.148.48 ± 14.530.55 ± 1.121.29 ± 3.1632.36 ± 27.8084.96 ± 87.380.15 ± 0.380 ± 0
Shopping malls8.60 ± 10.191.88 ± 2.8825.25 ± 41.483.37 ± 5.990.42 ± 1.300.07 ± 0.2365.72 ± 81.6194.68 ± 114.80 ± 00 ± 0
Hotels2.84 ± 3.442.96 ± 3.1314.37 ± 22.957.25 ± 12.850 ± 012.24 ± 24.4982.79 ± 96.0777.55 ± 77.730 ± 00 ± 0
Industrial offices15.28 ± 12.5011.12 ± 21.7210.83 ± 16.5910.65 ± 13.270.22 ± 0.450.36 ± 0.9172.87 ± 61.0976.87 ± 61.010.79 ± 2.751.00 ± 3.46
Supermarkets5.86 ± 7.542.81 ± 2.260.91 ± 1.500.25 ± 0.320.48 ± 0.550.16 ± 0.2892.76 ± 45.0696.79 ± 44.500 ± 00 ± 0
Residential districtsLow-density residential areas12.96 ± 10.1015.60 ± 15.5836.41 ± 49.495.65 ± 3.220.03 ± 0.040.63 ± 0.4245.79 ± 35.2578.08 ± 34.484.82 ± 6.810 ± 0
High-density residential areas15.95 ± 19.2113.24 ± 25.5722.98 ± 48.309.88 ± 16.040.13 ± 0.340.08 ± 0.1858.83 ± 63.1576.25 ± 61.372.10 ± 6.460.55 ± 1.69
Recreation and leisure districtsParks56.33 ± 90.4278.0 ± 108.9318.84 ± 34.458.43 ± 10.127.92 ± 29.519.81 ± 36.4714.87 ± 23.5613.48 ± 14.332.05 ± 5.820 ± 0
Museums31.04 ± 09.14 ± 05.71 ± 020.93 ± 00.03 ± 00 ± 063.22 ± 069.92 ± 00 ± 00 ± 0
TransportationBus parking7.89 ± 037.62 ± 066.12 ± 00 ± 00 ± 00 ± 010.76 ± 062.38 ± 015.22 ± 00 ± 0
Main roads and secondary roads25.20 ± 19.2425.03 ± 19.4513.95 ± 11.590.80 ± 1.080 ± 01.81 ± 4.0460.85 ± 25.5472.36 ± 33.960 ± 00 ± 0
Undeveloped landTrain Station15.21 ± 10.048.94 ± 4.1812.48 ± 6.056.55 ± 3.410 ± 00.03 ± 0.0572.31 ± 43.7884.48 ± 50.670 ± 00 ± 0
Bareland7.16 ± 3.966.41 ± 8.5121.62 ± 23.1714.42 ± 16.860.24 ± 0.460.06 ± 0.1565.57 ± 41.3570.43 ± 41.215.42 ± 9.488.74 ± 21.40
Table 4. Results from linear regression models predicting the proportion of UGS from primary UFU type. Built-up area, undeveloped land area, water area, construction age, housing price, and population density in 2000 and 2020. Signif codes: 0 “***” 0.001 “**” 0.01.
20002020
Estimatep-ValueEstimatep-Value
(Intercept)0.346<0.001 ***0.149<0.001 ***
Public affairs service districts0.1440.001 **0.1150.001 ***
Recreation and leisure districts0.483<0.001 ***0.646<0.001 ***
Residential districts0.0640.2680.0650.105
Transportation0.1160.1150.0820.104
Undeveloped land−0.0170.8430.1020.104
Built-up area−0.0330.2070.0070.721
Undeveloped land area0.0870.124−0.0080.892
Water area0.9840.1080.2860.447
Construction age−0.0510.114−0.0010.957
Housing price0.0090.7030.0230.098
Population density−0.0330.629−0.0340.374
R20.2540.526
BPTest12.3810.33620.6750.037
DWTest2.3300.1542.0130.762
Table 5. Results from linear regression models predicting the proportion of UGS from secondary UFU type. Built-up area, undeveloped land area, water area, construction age, housing price, and population density in 2000 and 2020. Signif codes: 0 “***” 0.001 “**” 0.01 “*” 0.05. Table A3 presents a comparison of Variance Inflation Factors (VIFs) for these indicators in 2000 and 2020 to assess multicollinearity.
Industry and Business DistrictsPublic Affairs Service DistrictsRecreation and Leisure DistrictsResidential DistrictsTransportation
β-Coefficientβ-Coefficientβ-Coefficientβ-Coefficientβ-Coefficient
2000202020002020200020202000202020002020
(Intercept)0.284 ***0.234 ***0.451 **0.215 ***−0.6563.053−0.764 **−0.5162.455 *-
Built-up area--−0.392 **0.047−0.076−1.0720.161 ***---
Undeveloped land area--−0.842−0.213 *-−1.591--−0.377-
Water area-0.552--−11.144 *39.445−5.935 *−8.062--
Construction age-0.176 *--−0.185−0.138−0.116 *-−0.070-
Housing price----0.1640.1020.124 *0.059 **0.099-
Population density---−0.185-−1.243--6.775 *-
R2-0.1230.6710.1070.1640.8690.6100.2620.423-
BPTest3.843.8366.3137.1586.7697.5752.6321.893--
DWTest2.3302.0962.3491.1172.5341.7162.2332.440--
Disclaimer/Publisher’s Note: The statements, opinions and data contained in all publications are solely those of the individual author(s) and contributor(s) and not of MDPI and/or the editor(s). MDPI and/or the editor(s) disclaim responsibility for any injury to people or property resulting from any ideas, methods, instructions or products referred to in the content.

