1. Introduction
In order to meet nowadays’ increasing energy efficiency needs, the integration of photovoltaic (PV) systems on building roofs is a topical aspect, and especially for those building such as factories, warehouses, or exhibition halls, notoriously energy-intensive and usually featuring large, flat roofs which can accommodate high-capacity power plants.
In order to maximise the productivity, solar arrays should be installed with optimal orientation (azimuth) and tilt angle, depending on the site location, where the best orientation is generally 0° to the south with tilt angles rising up to about 30°.
However, greater tilt angles increase the structural stresses transferred from the PV modules to their support frames and, consequently, to the building structure [
1]. As a result, flat or co-planar configurations are more common.
While the azimuth can often be selected freely, on large flat roofs, which are usually rectangular in plan, PV strings are often aligned with the building’s edges. This typically results in a simplification of the design of support frames, cable routing, and maintenance procedures. Moreover, standing seam roofs, which are extremely common for such buildings, require a free thermal elongation capability that, in the presence of roof-attached PV strings, may lead to severe damage to the roof metal panels [
2].
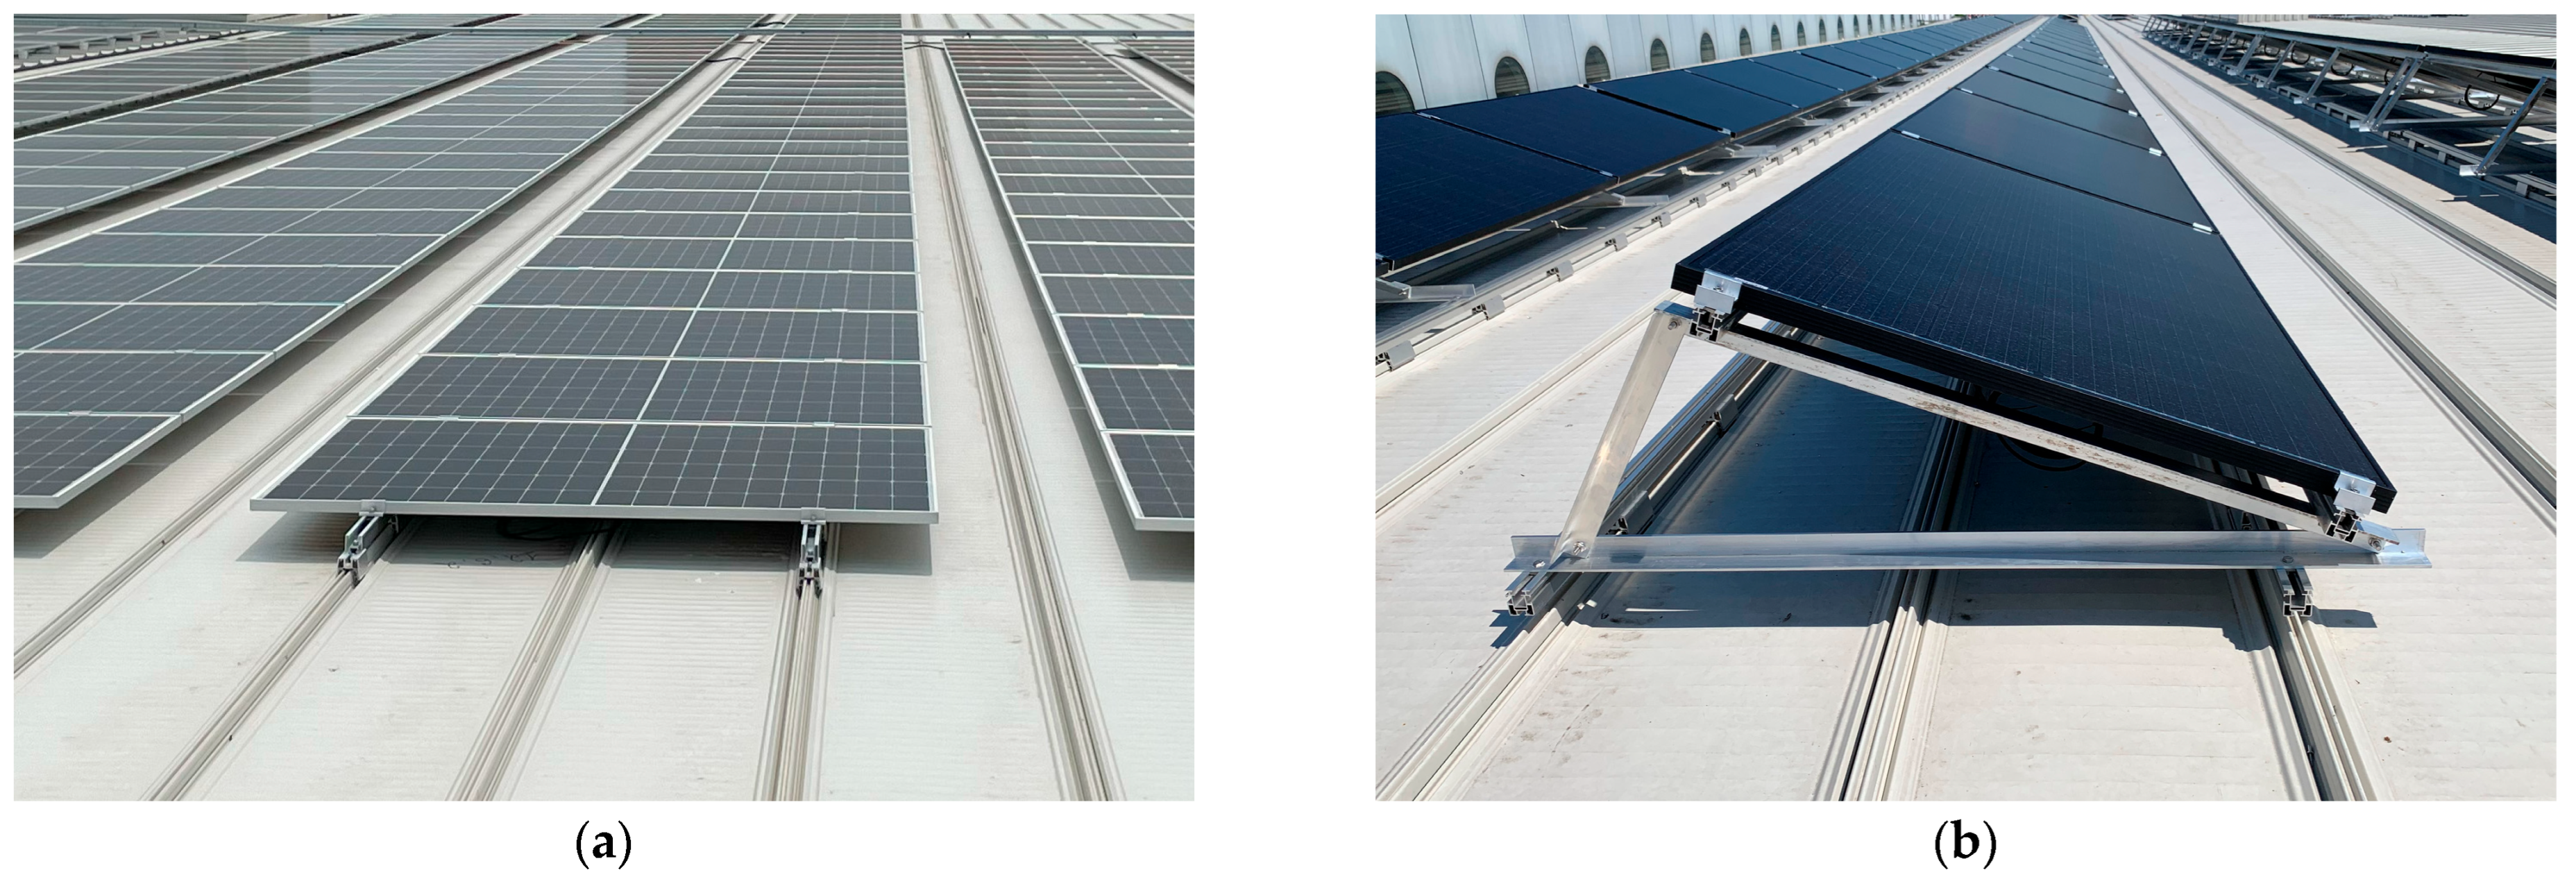
In this framework, designers should be provided with adequate information in order to correctly calculate and ensure the reliability of rooftop PV arrays, both in new constructions and revamping interventions, considering that actions on flat and tilted strings (see
Figure 1) can be significantly different.
In fact, calculations should aim to verify both the global resistance of the roof structure and the resistance of PV string components (i.e., PV modules, frames, brackets, fixings, etc.). For the latter, local wind effects are particularly important as they can be significantly greater than mean actions, as better described in the following, and may result in failures even under loads related to ordinary wind events. In this respect, accurate and detailed pressure coefficient distributions are strongly necessary.
In this respect, the national and European standards used to derive wind actions only provide instructions about the design loads on different configurations of bare roofs, not considering the specificity of roof-mounted, tilted photovoltaic strings. As stated in the standards, the aerodynamic coefficients (pressure or friction coefficients) to be used for the design of buildings or building parts with a particular shape should be derived from appropriate scientific documentation or specific wind tunnel tests, which can provide more precise and accurate results to be applied to specific layouts while also investigating local pressure effects.
Several studies investigated the wind-induced load and effects on solar panels or arrays of multiple panels in order to optimise the design and ultimately the cost of the photovoltaic panels, the array support structure, and its foundation or anchoring. The literature provides a wide set of approaches, including both small- and large-scale wind tunnel experiments as well as numerical simulations made by computational fluid dynamics modelling.
In the late 1970s and early 1980s, several commercial industrial projects aimed to initiate an effort towards reducing the cost of solar arrays were promoted. Among them, the most relevant are those by the Bechtel National Inc. (San Francisco, CA, USA) and Miller and Zimmerman. Bechtel National Inc. (San Francisco, CA, USA) [
3] reported the wind loads on a ground-mounted solar array using strain gauges in a boundary-layer wind tunnel, while Miller & Zimmerman [
4,
5,
6] used scaled models provided with pressure taps in a boundary-layer wind tunnel to measure wind loads on very-high-aspect-ratio (span/chord) flat plate photovoltaic arrays located on or in close proximity to the ground, in close proximity to each other, and exposed to the wind, providing pressure distributions on the solar panel surface. The aim of these studies was to determine wind-loading criteria in relation to chord lengths, array spacings, the height of the arrays from the ground, wind directions, and array angles of attack.
The model scale issue was also stressed by Aly & Bitsuamlak [
7], who experimentally and numerically investigated the sensitivity of wind loads on solar panels, although ground-mounted, at different geometric scales. This study showed that the mean surface pressures are not significantly affected by the scale and then by the turbulence intensity, while the standard deviation and peak load coefficients can vary significantly according to the model size. Another similar study by Aly [
8] in fact confirmed that the geometric scale is a primary reason for the discrepancies in peak wind loads, which can however be avoided by adapting the inflow turbulence, overcoming the lack of large-scale turbulence.
Since wind loads on low-rise buildings and their roof-attached elements also depend on many parameters relative to the building geometry and the wind characteristics, different values were collected through boundary-layer wind tunnel tests on small-scale [
1,
9] or large-scale models [
10,
11,
12]. Among these, Kopp [
1] particularly focused on different aerodynamic mechanisms to be assessed, i.e., the equalisation of the building-generated pressures and array-generated turbulence. Particularly, Kopp et al. [
13] investigated through wind tunnel tests the effect of buildings on roof-mounted solar arrays, compared to ground-mounted arrays, showing that the aerodynamics of roof-mounted arrays have a complexity beyond that of building aerodynamics, due their presence in a flow field containing vortices generated by flow separations at the roof edges, turbulence induced by the array, and turbulence in the atmospheric boundary layer. The difference in wind peak loads on the bare roof and on roof-mounted solar arrays was also studied through experimental tests on various scales models by Banks [
14] and Abiola-Ogedengbe et al. [
15].
However, although the response of different roof-mounted arrays layouts was experimentally evaluated on large scale models [
11], previous studies produced results for several different although hardly comparable configurations. In this regard, the present research aims to provide a comprehensive and definitive investigation of the influence of typical geometric parameters that generally characterise rooftop tilted PV strings in representative configurations on strings’ wind-loading pattern. Experimental results had been intended to eventually confirm hypotheses derived by the literature and highlight any correlations between said parameters.
In order to achieve the most accurate and reliable design coefficients for representative configurations, wind tunnel tests were carried out at the Politecnico di Milano Wind Tunnel, which has a ~14 m wide, ~4 m high boundary-layer section equipped with a circular turning table which allows for an easy investigation of all wind directions.
2. Materials and Methods
2.1. Experimental Setup Definition
Reference scaled-model essential features were firstly defined based on the following:
- -
The reference building has a rectangular footprint, which is standard for the most of buildings provided with large, flat roofs;
- -
The roof slope is assumed to be perfectly horizontal (typical flat roof pitches down to 0.5/1.0% do not significantly affect wind-pressure coefficients);
- -
Photovoltaic modules are assumed to have standard dimensions of 1600 × 1000 mm;
- -
Photovoltaic modules are assumed to be installed in a tilted position with an angle ranging from 5° to 30° and their long side parallel to the roof plane, with their short sides against each other in order to reduce the overall drag;
- -
Photovoltaic strings are assumed to be parallel to the building edges, which is a configuration commonly adopted to simplify and standardise support frames and cableways, provide a cleaner layout for maintenance, and also, in the case of metal roofs, avoid issues related to the differential thermal expansions of adjacent metal panels onto which string frames are attached.
Concerning the configuration of rooftop PV strings, the literature provided useful contributions to the present research case [
1,
9,
10], which suggest that:
- -
For straight wind, the magnitude of force coefficients decreases across rows as a result of a sheltering effect from the upwind solar panels, as the first row experiences the maximum wind loads (drag and lift) for all wind directions;
- -
The largest reduction in wind-load coefficients is on the second row, but the amount of reduction drops quickly afterwards, becoming minimal after the fourth or fifth row;
- -
Modules located in the outer string ends could be subjected to higher wind loads compared to modules located in the middle of the strings, mainly due to edge vortices that are also particularly relevant for oblique winds;
- -
Increasing the side spacing between adjacent modules has a minimal effect on the force coefficients, while the wind-load coefficients increase as the rows spacing is increased;
- -
Furthermore, for roof-mounted arrays, the wind-load coefficients appeared to decrease with increasing perimeter gap from the building edge.
According to the previous findings, the experimental setup characteristics were defined as follows:
- -
A number of 8 rows was chosen so that the length is enough to appropriately highlight the downstream dissipation of sheltering effects and to investigate possible peaks of pressure coefficients at the downwind flow reattachment point;
- -
A 12-module, 1920 mm (scaled size) long string was considered adequate to avoid the affection of pressure coefficients by corner vortexes;
- -
The model strings were designed without providing any gap between adjacent modules;
- -
A fixed 1.5 m distance from the building edge was chosen as it can be considered the minimum to allow for the integration of a perimetral gutter and a maintenance walkway.
The roof height was ultimately set to 10 m (1 m in model scale), which can be assumed as representative for typical large, flat-roofed commercial/industrial buildings in suburban areas.
In the end, the main parameters to be investigated through wind tunnel tests were:
- -
Wind direction (α);
- -
Photovoltaic panels tilt angle (β);
- -
Rows spacing (d);
- -
Clearance between the panel’s bottom and the roof plane (c).
Concerning the tilted modules, it has to be noted that increasing the
β angle results in a shading over the upcoming strings. For this reason, the net row spacing was assumed equal, for each configuration, to the maximum value among the standard gap, to allow for passing and maintenance purposes (taken as 60 cm), and the distance needed to avoid the shadowing given by the adjacent string was calculated (conservatively, for any latitude) as presented by Aronescu & Appelbaum [
16], referring to parameters in
Figure 2:
where
δ is the sun declination at the winter solstice (23.45°) and
γ is the slope pitch. For ease of experimental investigating, the latter is assumed equal to zero, whereas it is consistent with general reference buildings’ “flat” roofs’ pitch (1% to 3%), and such a minimal difference will not affect wind-loading pattern.
For the considered interval of tilt angles (5° to 30°), the resulting spacing values versus tilt angle are shown in
Figure 3.
While most of previous studies were performed in boundary-layer wind tunnels not large enough to fit large-scale models, Politecnico di Milano Wind Tunnel’s dimensions make it suitable to accommodate larger-scale models.
In order to achieve a better results accuracy, the reference building model scale was defined as 1:10, also according to Aly [
8], who showed the similarity between mean pressure distribution on 1:1 and 1:10 solar panels obtained by CFD simulations and experimental results. Specifically, higher scales allow for a better flow similarity between the model and the real scale due to a higher Reynolds number with no need for very high tunnel speed.
Moreover, Politecnico di Milano’s wind tunnel section size also allowed for the integration of boundary-layer simulation equipment in order to provide further accuracy, as better described in the following paragraph.
2.2. Scaled-Model Design and Creation
Based upon the characteristics mentioned above, the design of the 1:10 scale model [
2] was first made using 3D CAD software, in order to create a rectangular envelope with a flat top, provided with 8 strings with sixteen modules each and a system to adjust their tilt angle, the clearance from the roof plane, and the row spacing (see
Figure 4).
This meant having 8 independent strings, each provided with its own tilt adjustment and capable to slide away from each other to increase/decrease the row spacing, integrated into an outer box capable of extending its length to comply with larger row spacing and higher tilt-angle configurations.
Each string was then provided with NEMA17 stepper motors controlled by an Arduino shield in order to quickly adjust tilt angle and bottom clearance, allowing for easy transitions between different string configurations.
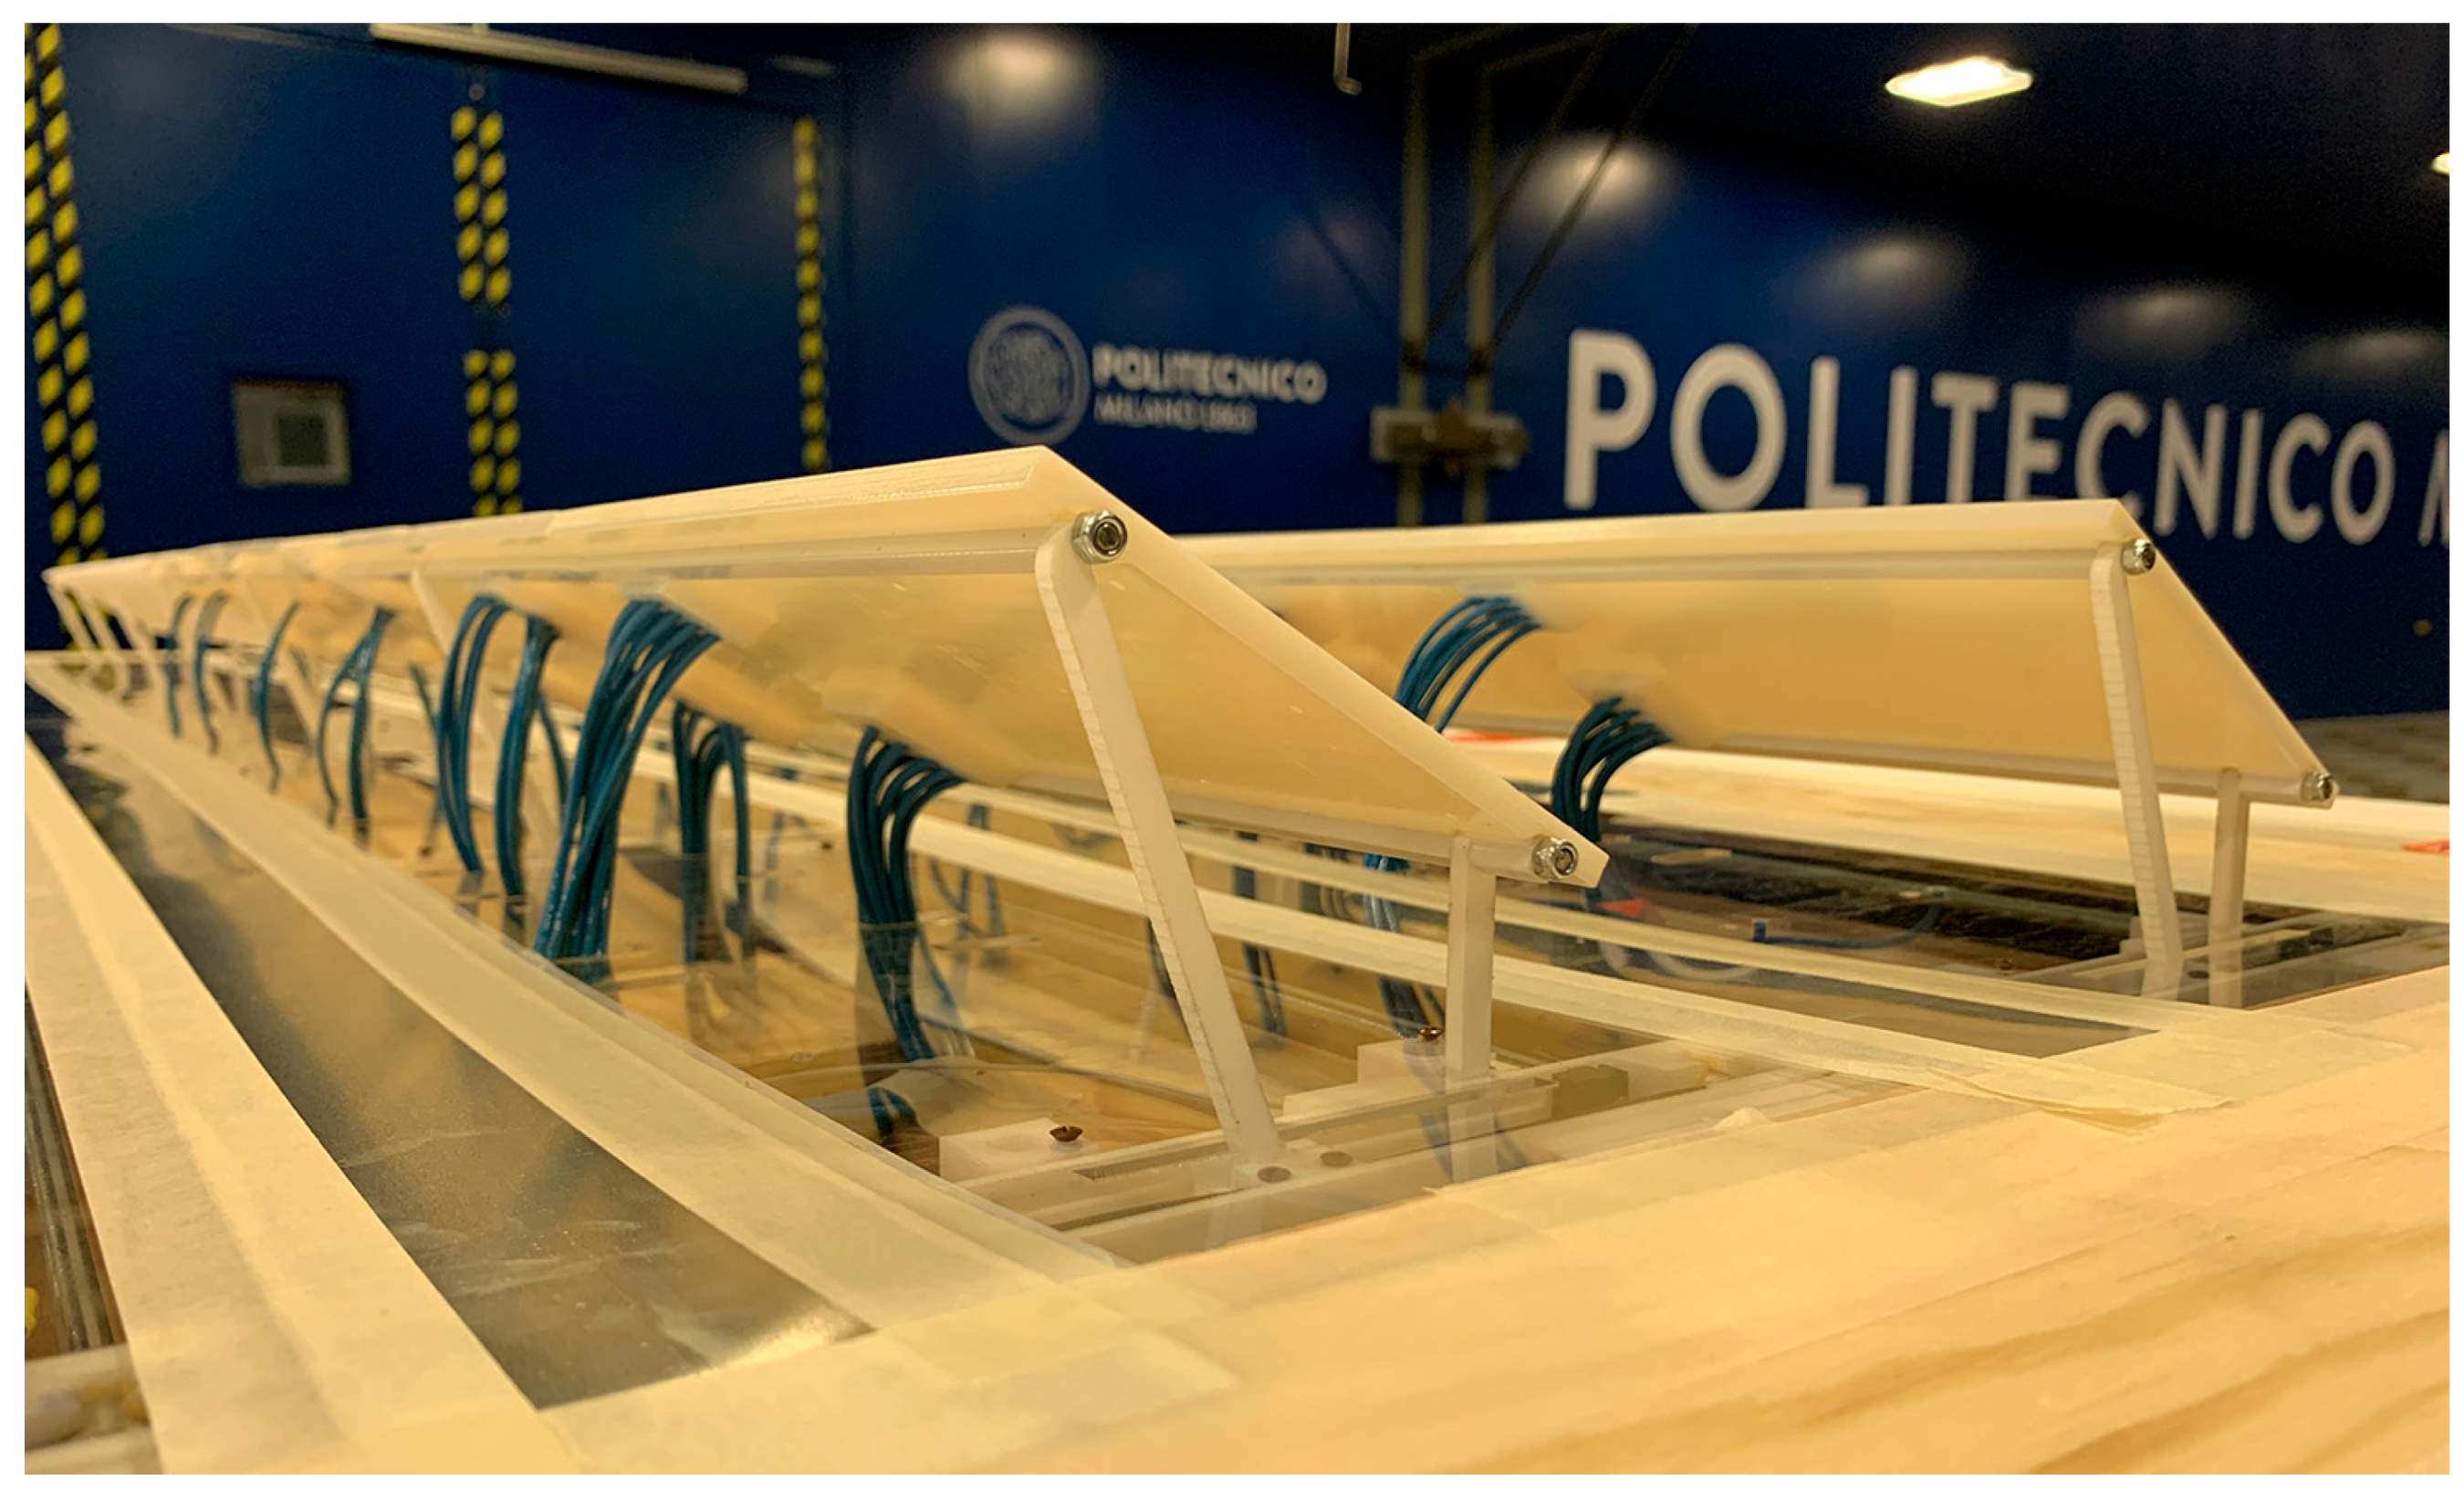
Due to the model symmetry, a half of each string was made of scaled modules provided with pressure taps, while the other half was dummy (in
Figure 4, respectively, orange- and grey-coloured). Each instrumented semi-string featured 56 pressure taps, one on each side (needed to derived net pressure coefficients) in 28 different positions (see
Figure 5), giving a total of 448 pressure taps.
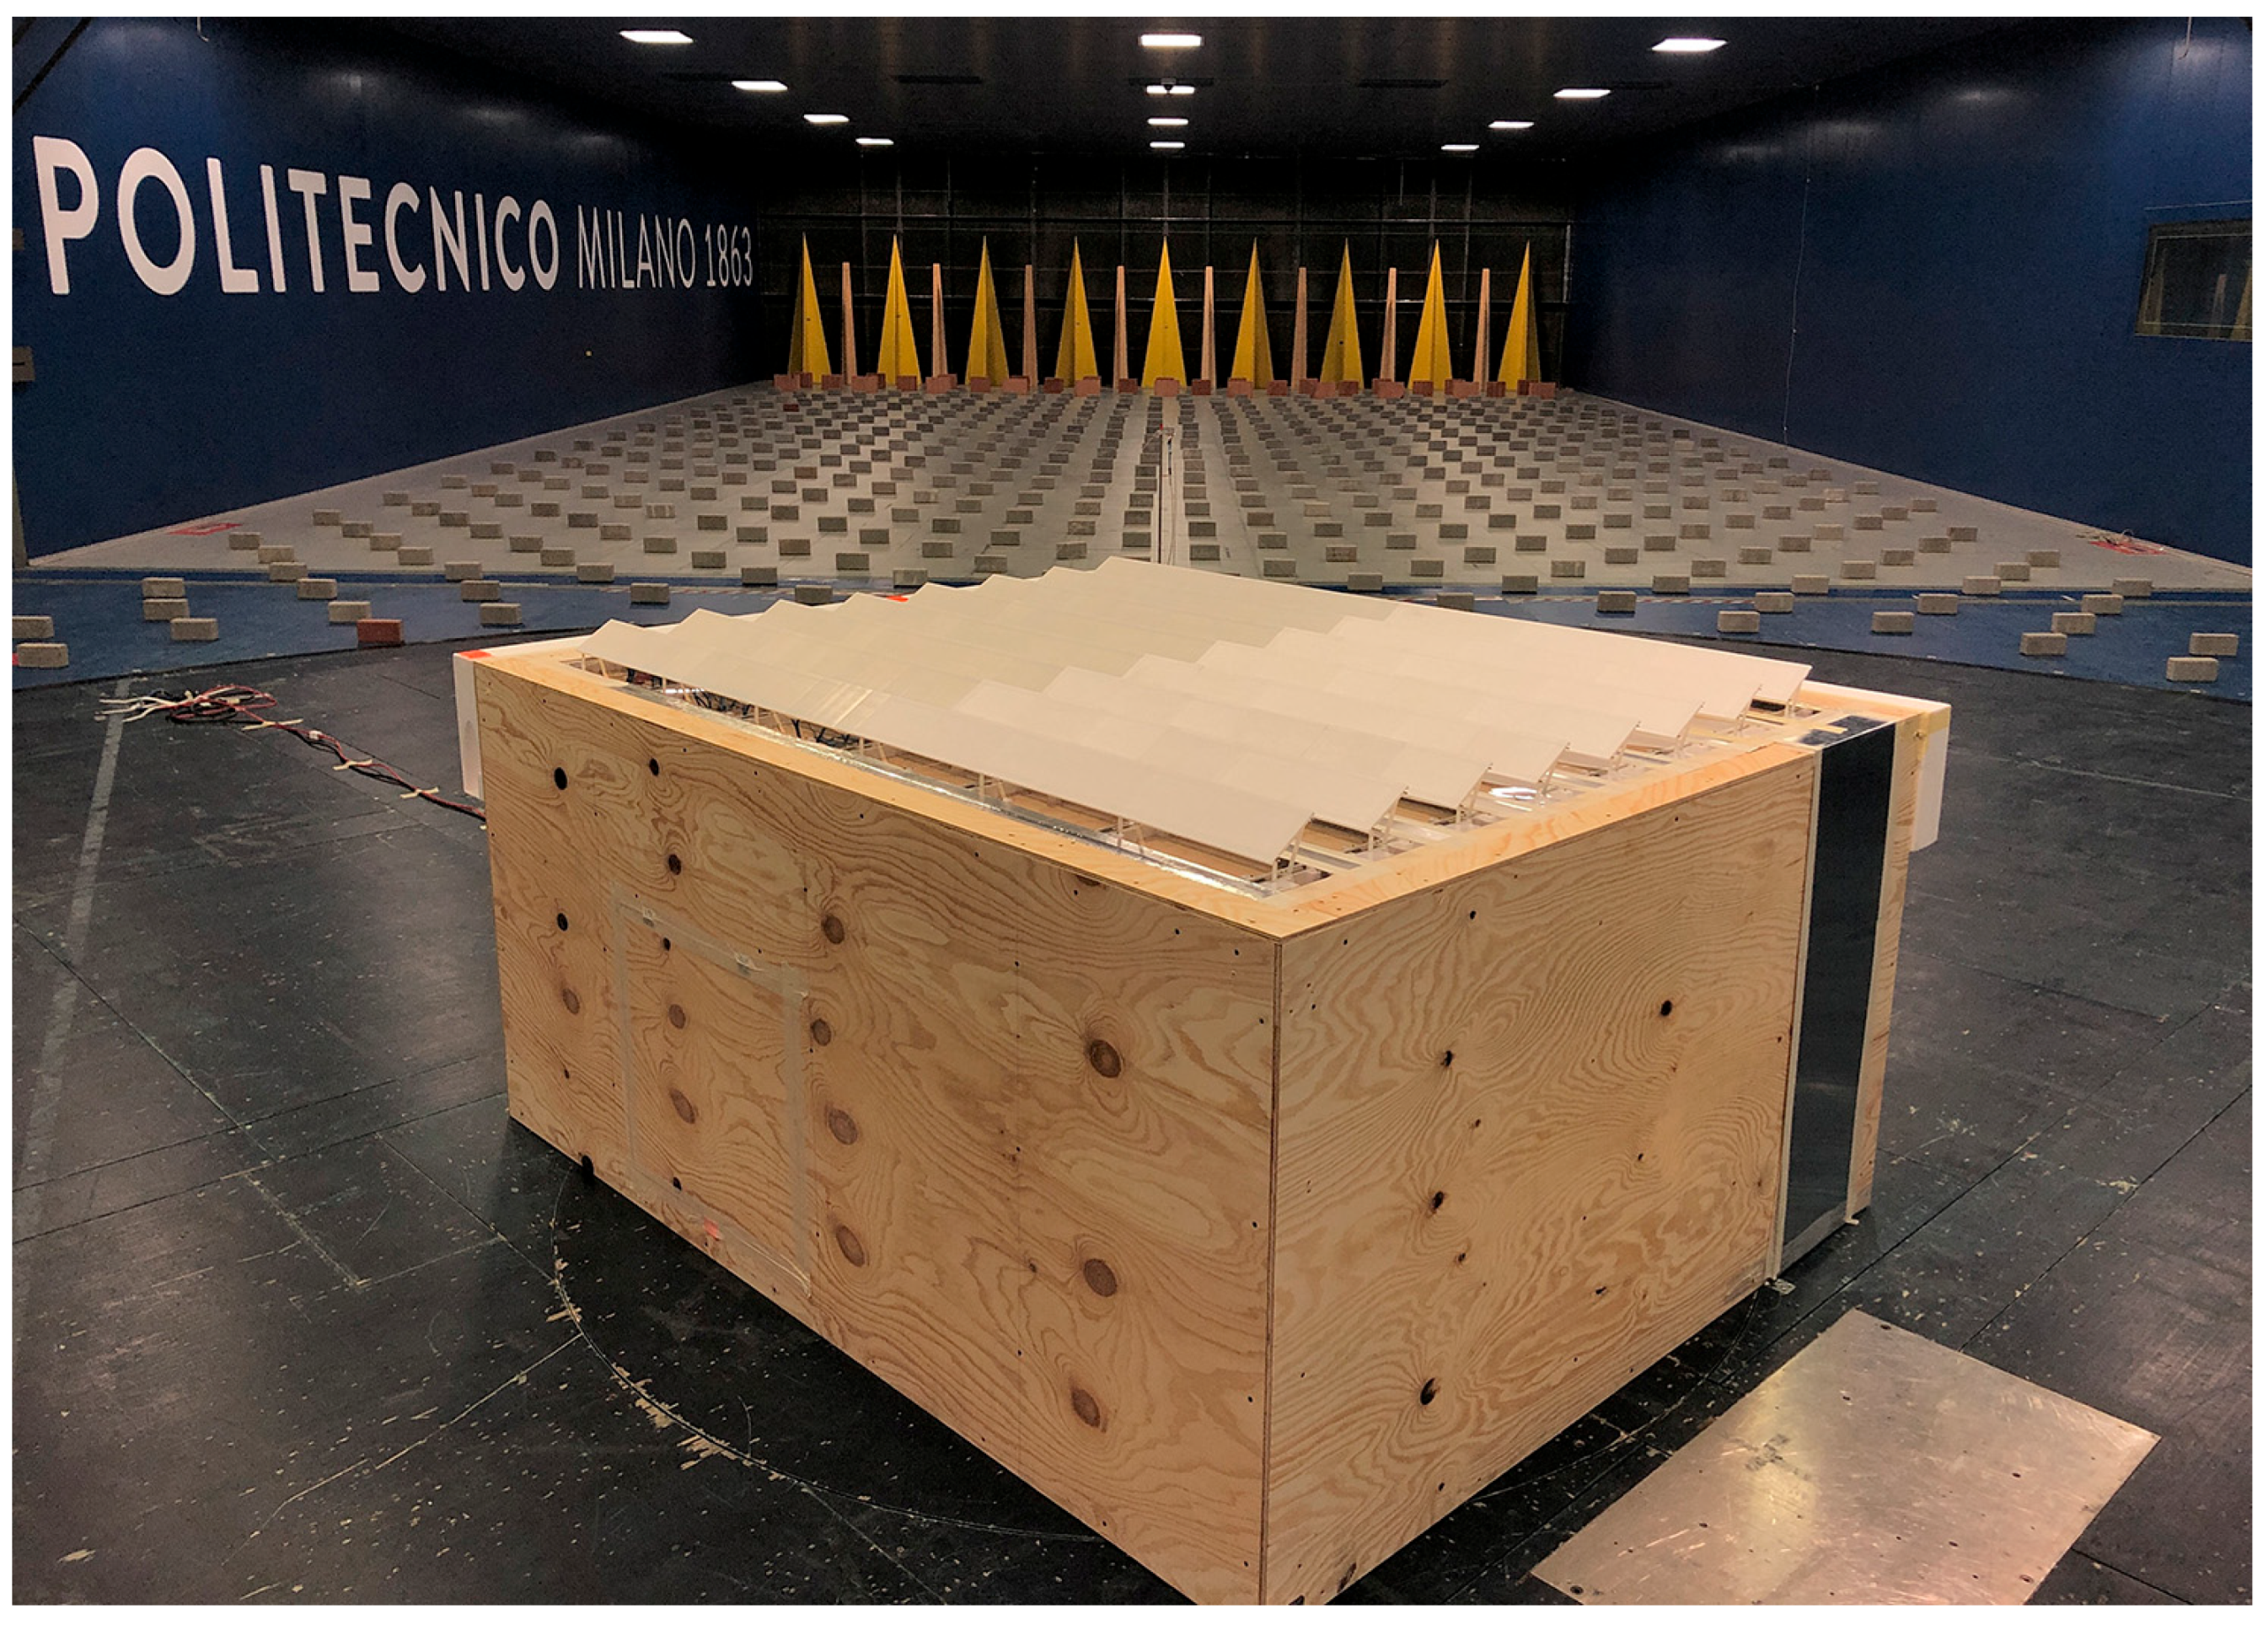
The 3D printing of scaled-model components and their preparation were presented by Scrinzi et al. in [
17]. The full model is depicted in
Figure 6 and
Figure 7.
The model was therefore provided with 16 high-speed pressure scanners with 32 channels each, in turn connected to a high-speed data acquisition controller.
2.3. Boundary-Layer Wind Tunnel Tests
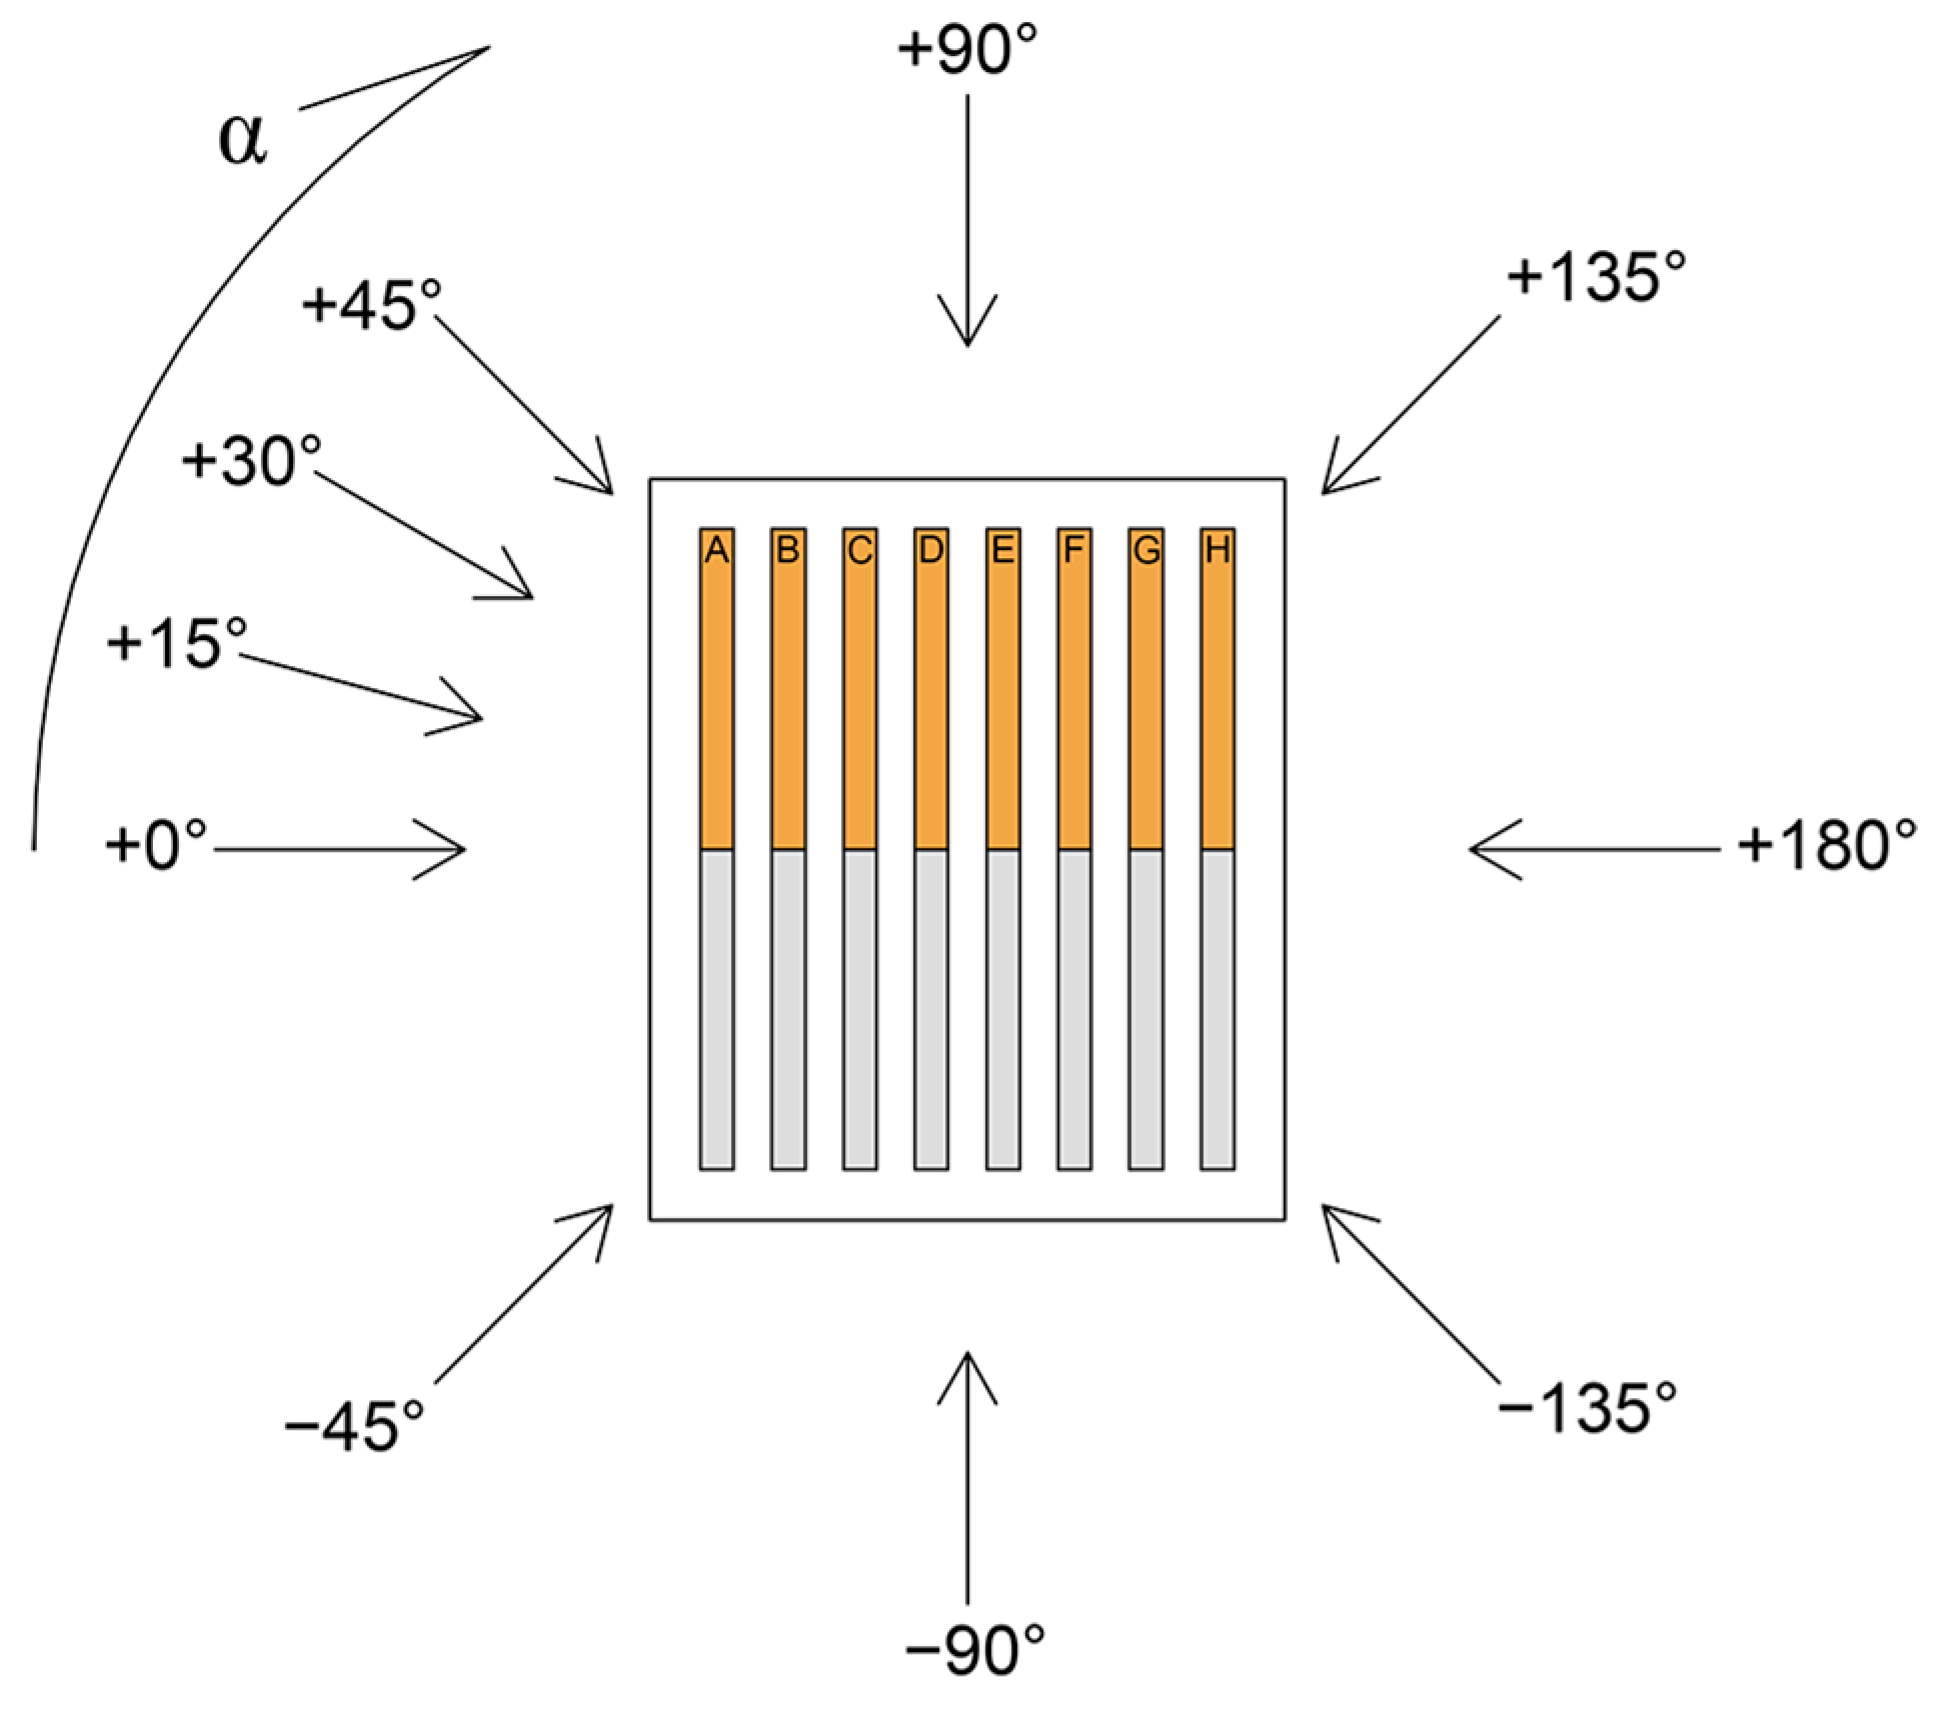
Tests were conducted in the boundary-layer chamber, the dimensions of which (13.84 m wide, 3.84 m height) allowed us to avoid freestream flow blockage issues even in the least favourably oriented wind directions, with a blockage ratio always lower than 5% for a scaled-model maximum cross-section of ~2.7 × 1.0 m. Different orientations (wind exposure angle) were investigated by rotating the model around its middle point on the turning table.
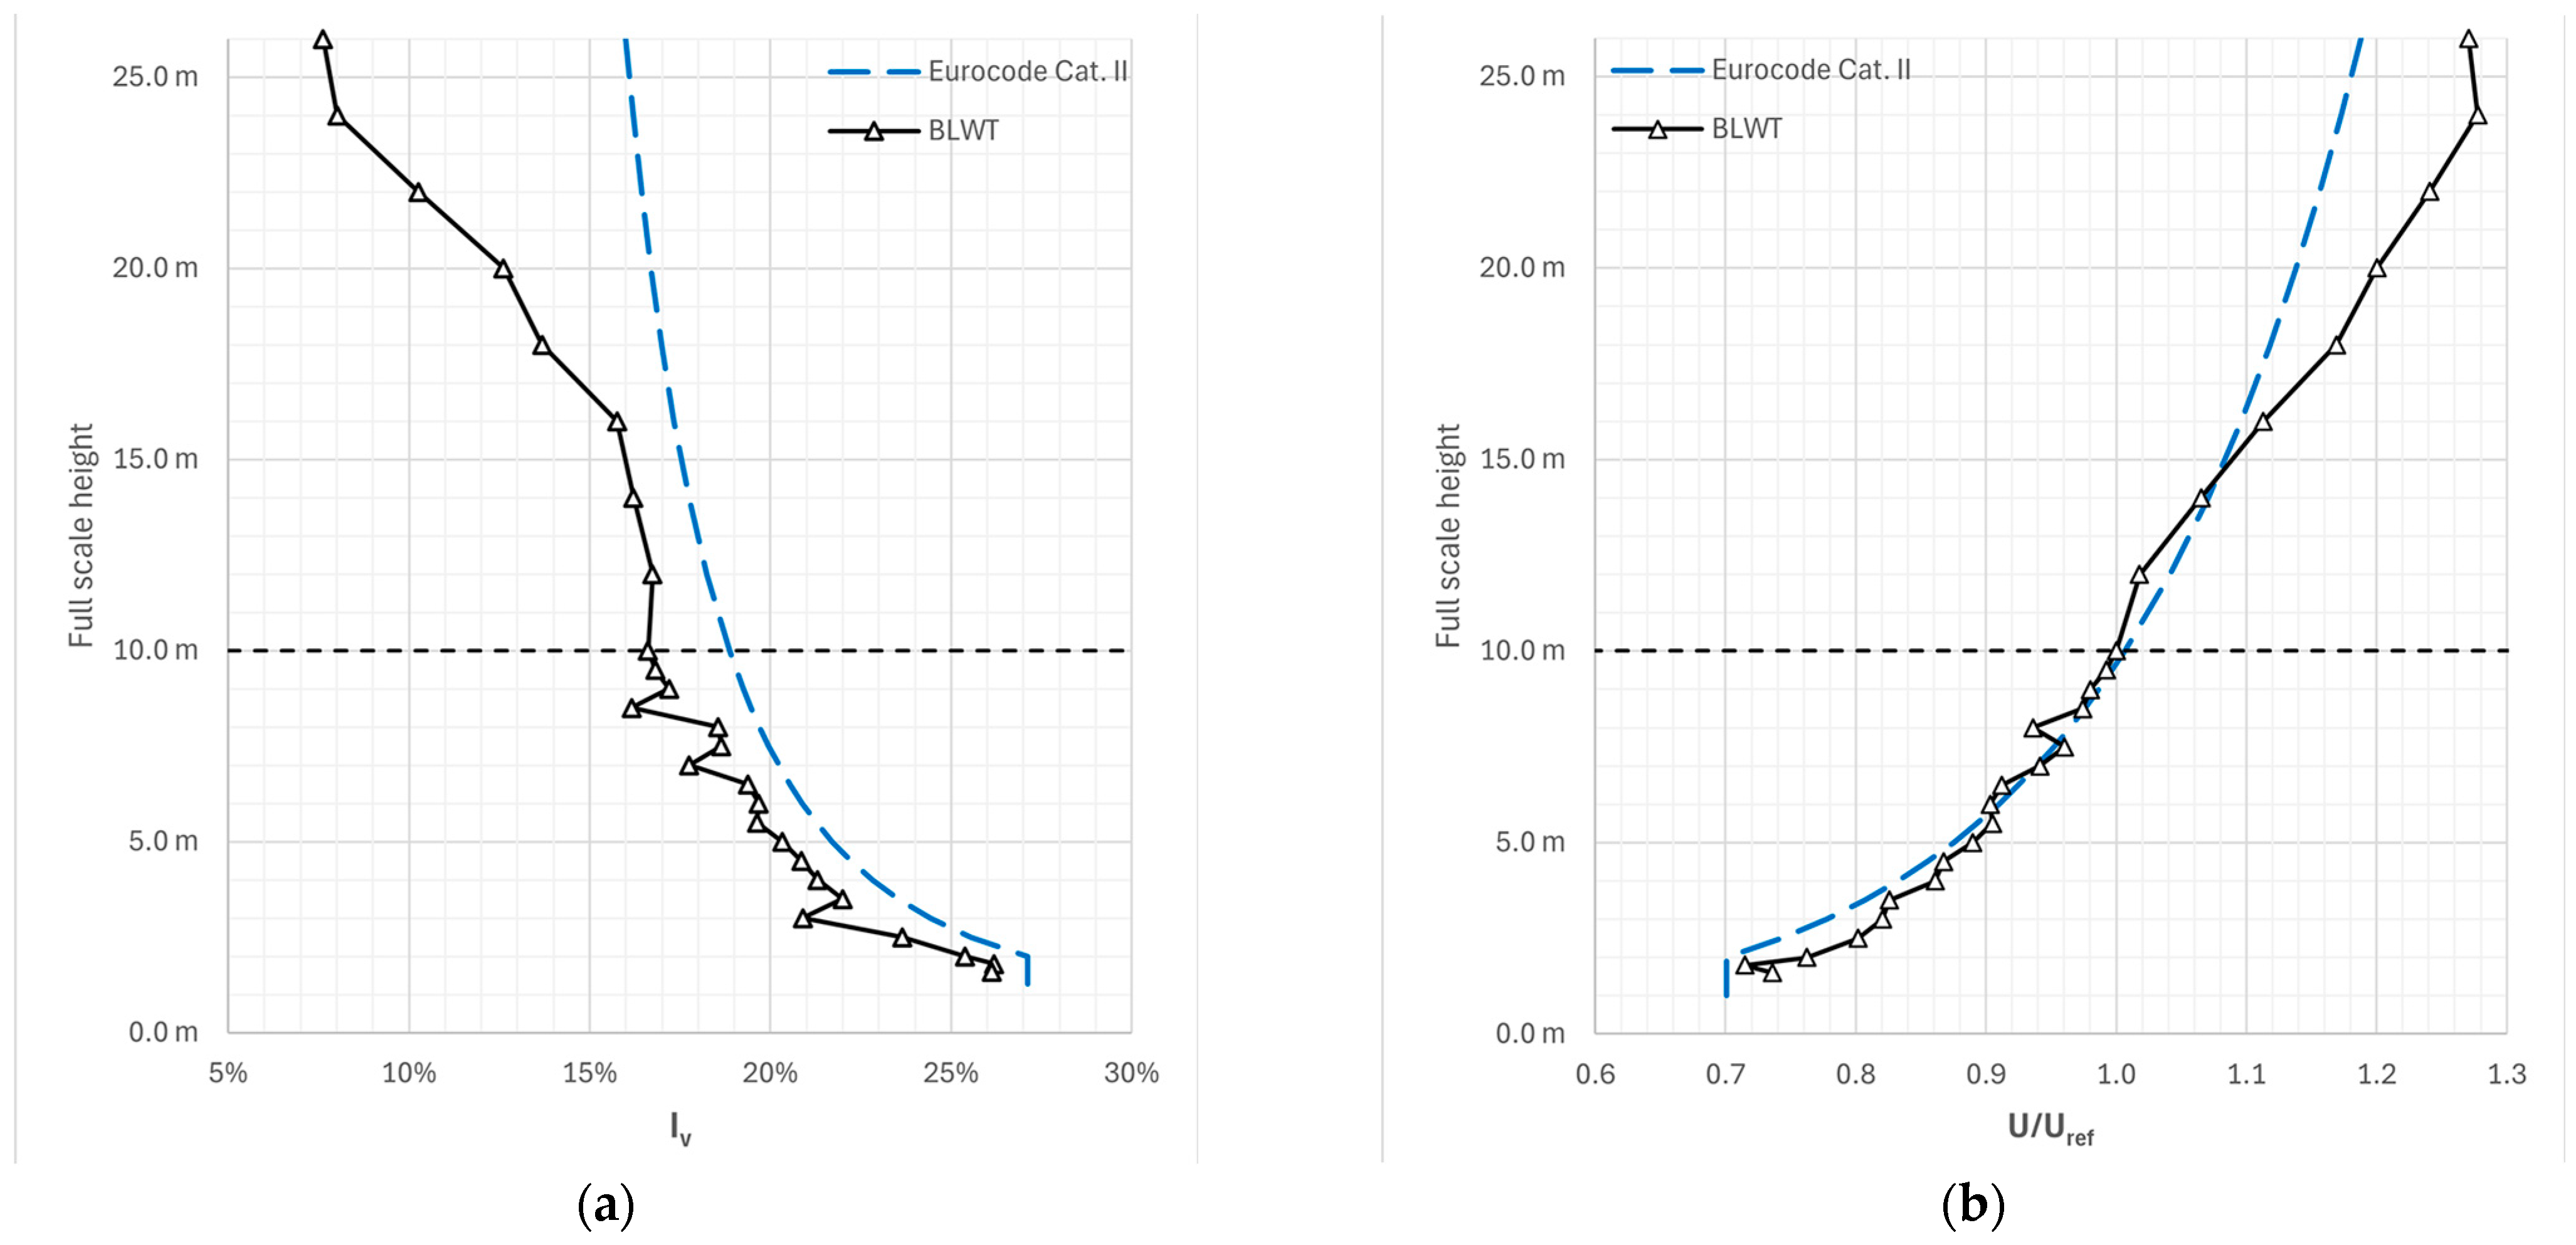
Appropriate vertical spikes installed at the chamber inlet and a brick pattern all along the floor upwind of the scaled model (see
Figure 7) were used to generate a wind turbulence/velocity profile approximating a Class II (mild roughness) profile by Eurocode [
18], as depicted in
Figure 8. Experimental profiles were measured 1 m upwind of the scaled model, at a distance of 30+ m from the boundary-layer chamber inlet.
In order to reduce the number of different configurations to be tested, the tilt angle, bottom clearance, and wind-direction angle values had to be discretized, as shown in the following
Table 1 and
Table 2, with references to the depiction of parameters in
Figure 2 and
Figure 9.
All-round wind directions were covered by 45° steps, only reducing the step to 15° for the first eighth of a turn (instrumented modules upwind), as previous studies [
13] showed the highest corner vortexes effects on upwind rows edges for oblique winds with angles up to 45°.
Two sizes of bottom clearance were selected: 15 and 30 cm (on a real scale). Usually, when installing photovoltaic modules on a flat roof, an air gap remains between the bottom panels’ edge and the roof. This particularly happens in case of metal roofing systems due to the presence of the standing seam and the anchor clamps, which would always allow a certain air flow. A 15 cm clearance is assumed to be the minimum actually achievable.
Tilt angles were assumed 5° to 30°, which is an optimal angle range for local latitudes, efficiency wise.
Each testing cycle lasted 300 s in order to provide statistical relevance in terms of peak values.
In order to validate the experimental setup and the measurements’ accuracy, multiple preliminary tests were run in specific conditions/configurations and the consistency of the results was checked before starting the actual tests.
2.4. Data Processing
Differential (with reference to the inner wind tunnel static pressure) local pressures (
p) were measured for each tap at 500 Hz over a 5 min time span and divided by the kinetic wind pressure (
qw) calculated with the speed (
v) and air density (
ρ) at the mock-up roof height (10 m in real scale), in order to obtain instant local pressure coefficients (c
p,±):
For each couple of pressure taps (top and bottom side) on the PV strings, an instant net pressure coefficient (cp) is obtained by subtracting the value of the bottom-side coefficient from the value of its respective top-side coefficient. Conventionally, cp is positive for pressures directed towards the top surface of the string.
A fully probabilistic assessment method by Cook & Mayne [
19,
20] was applied in order to neglect instant peaks. A 78% fractile (namely a 22% risk of exceedance) of extreme wind-load distribution was extracted as the experimental result. The indicated fractile has been selected to comply with serviceability requirements, providing an adequately conservative estimation of typical loads without focusing on extreme action, as PV strings are actually non-structural elements which may instead require very higher fractiles. It is also to be considered that, in such an application, occasional exceedance poses relatively little risk, as common metal support structures are generally capable of redistributing and/or absorbing extra loads in case of extreme events.
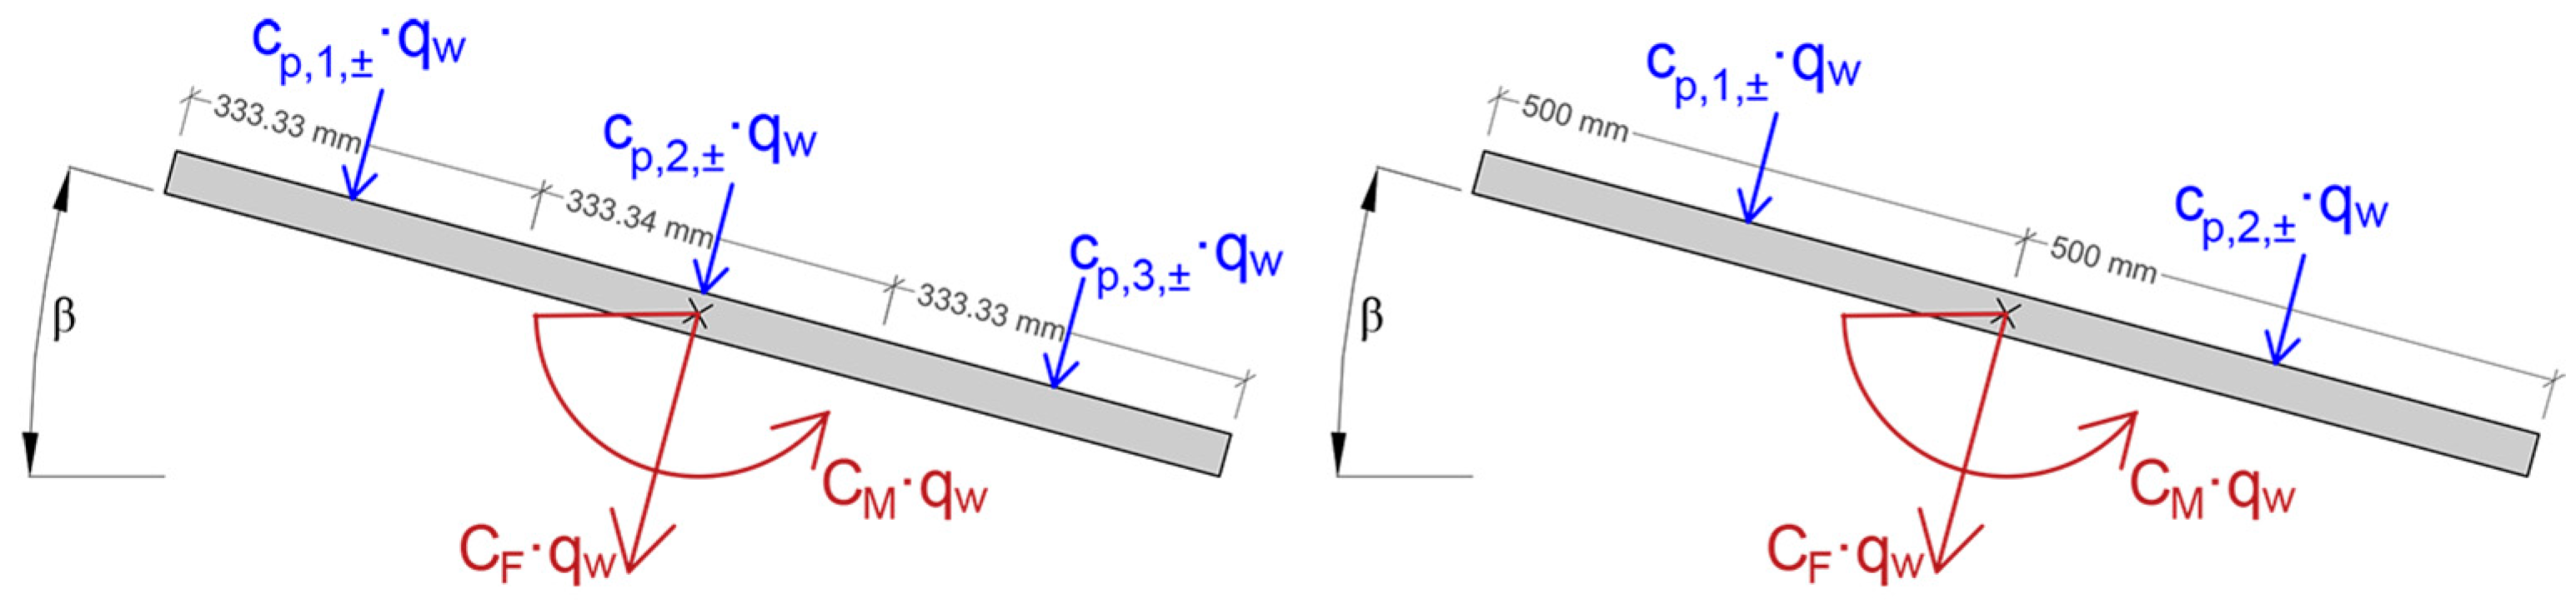
Eventually, net pressure coefficients’ time histories (i.e., c
p versus time) of each wind tunnel test case were then processed to derive the time histories of force (C
F) and moment (C
M) resultants normalised by q
w pressure, for each section, which are obtained by appropriately combining c
p values multiplied by their reference section width (see
Figure 10). C
F and C
M are dimensionally represented, respectively, as [m] and [m
2]. Once multiplied by q
w pressure [N/m
2], the resulting forces [N/m] and moments [Nm/m] are intended per string length unit.
3. Results
The experimental results support the initial hypotheses quite well based on the literature review above, concerning the influence of different geometric parameters. Such good consistency further proves the measurements’ accuracy.
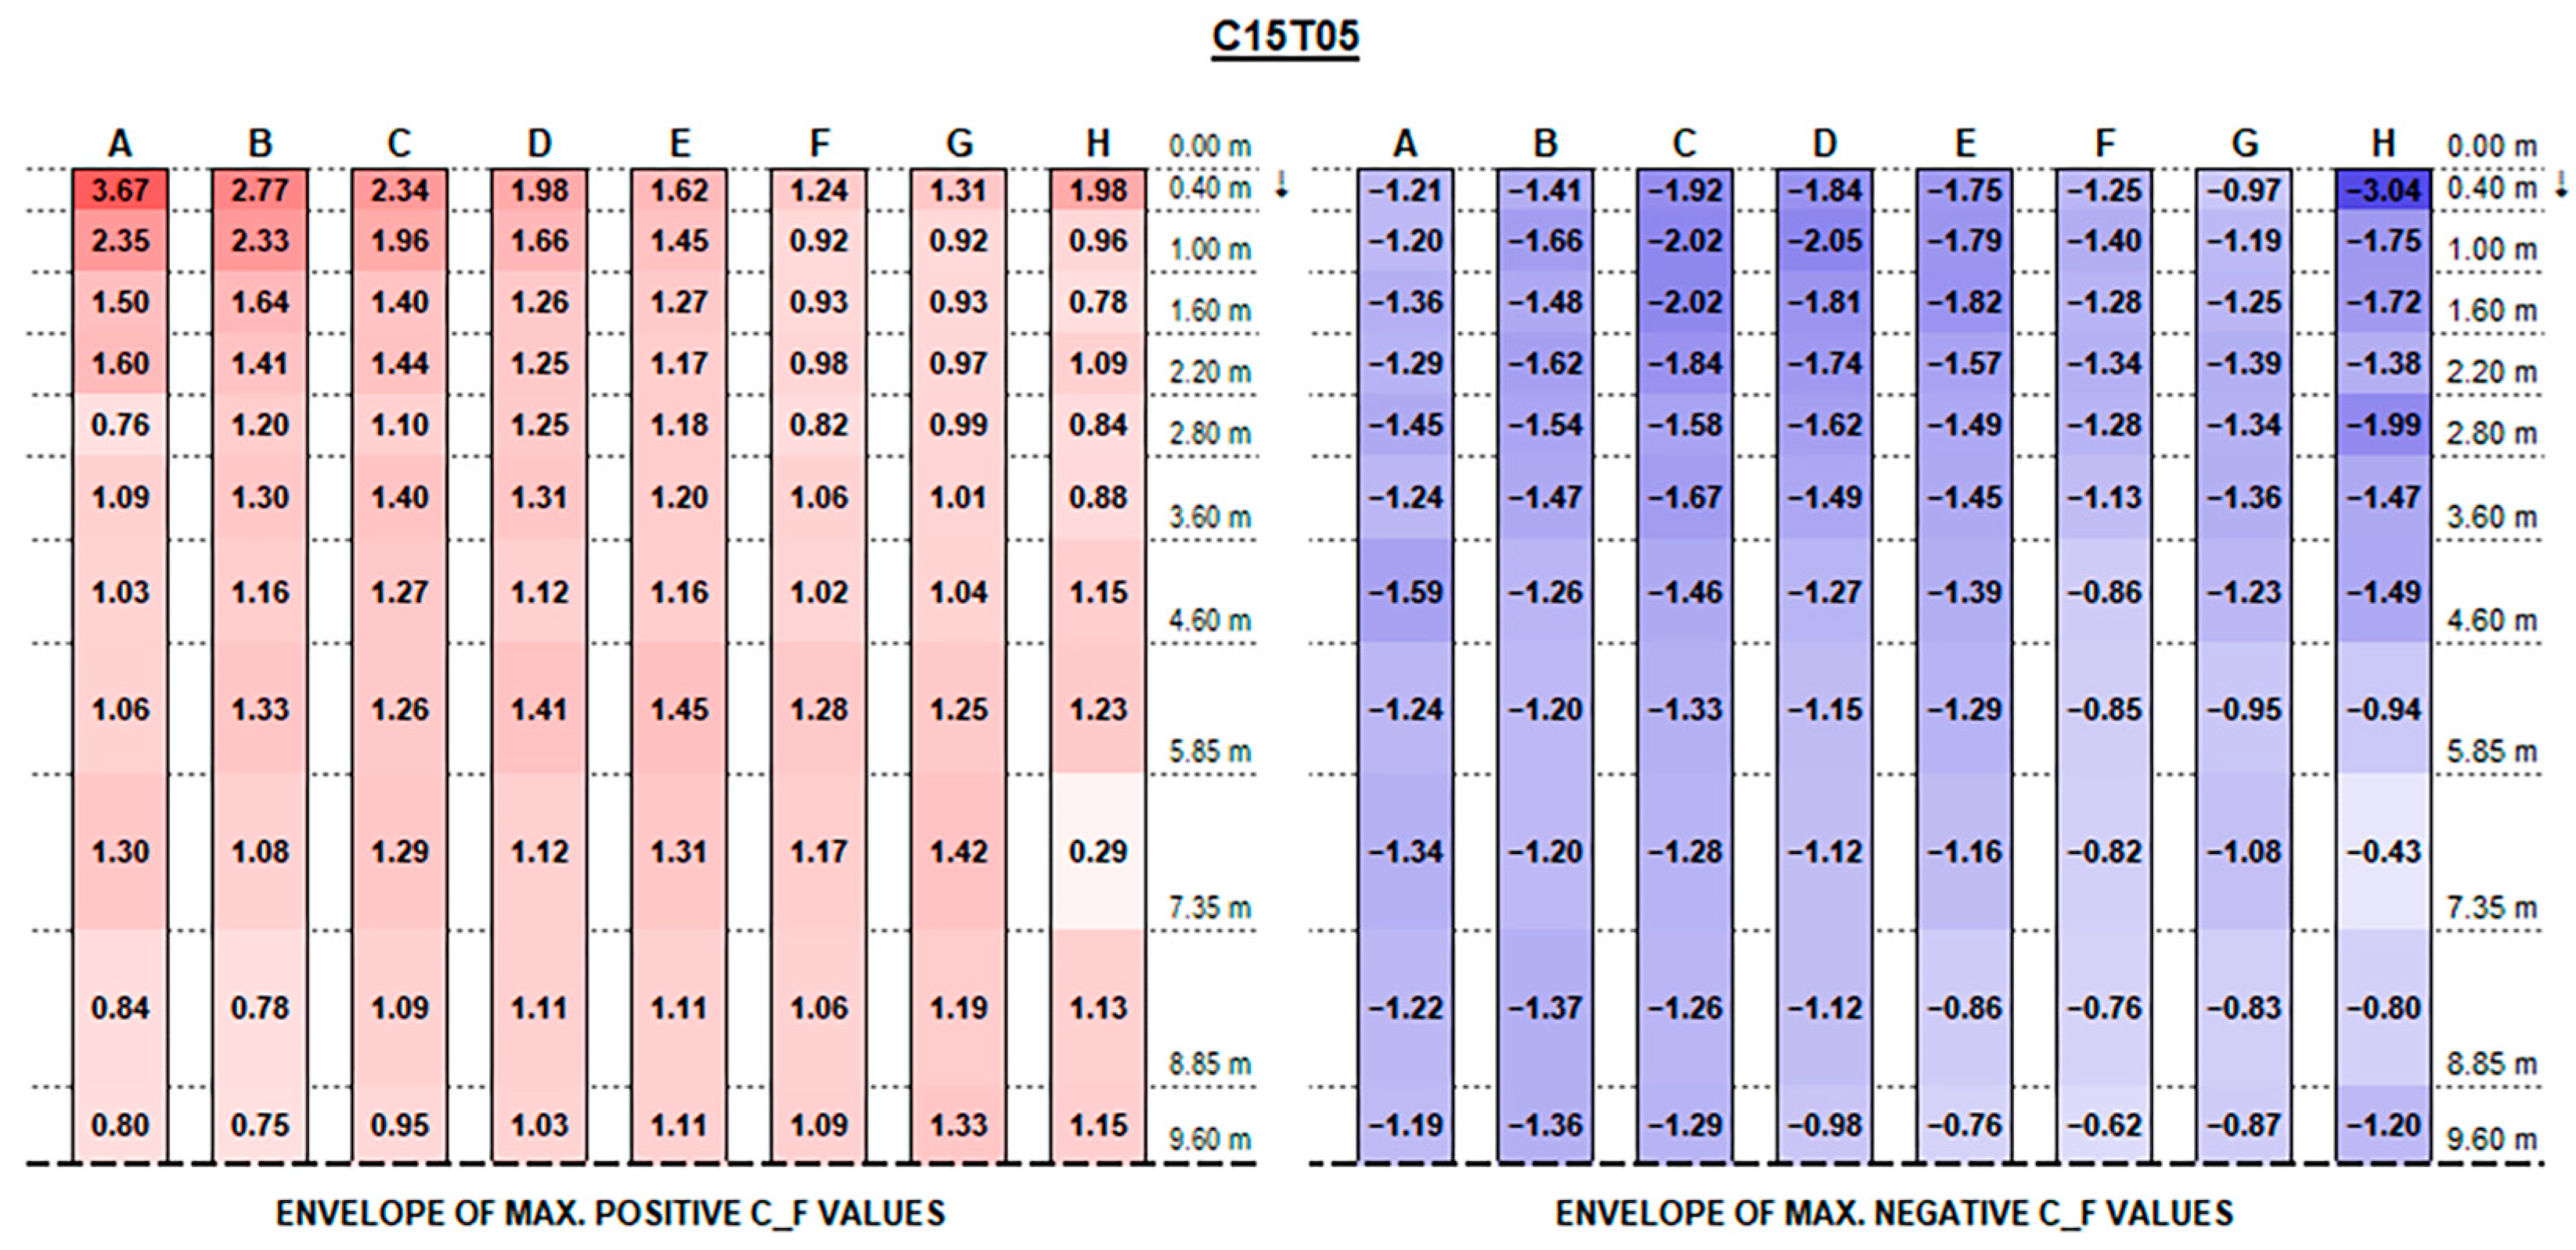
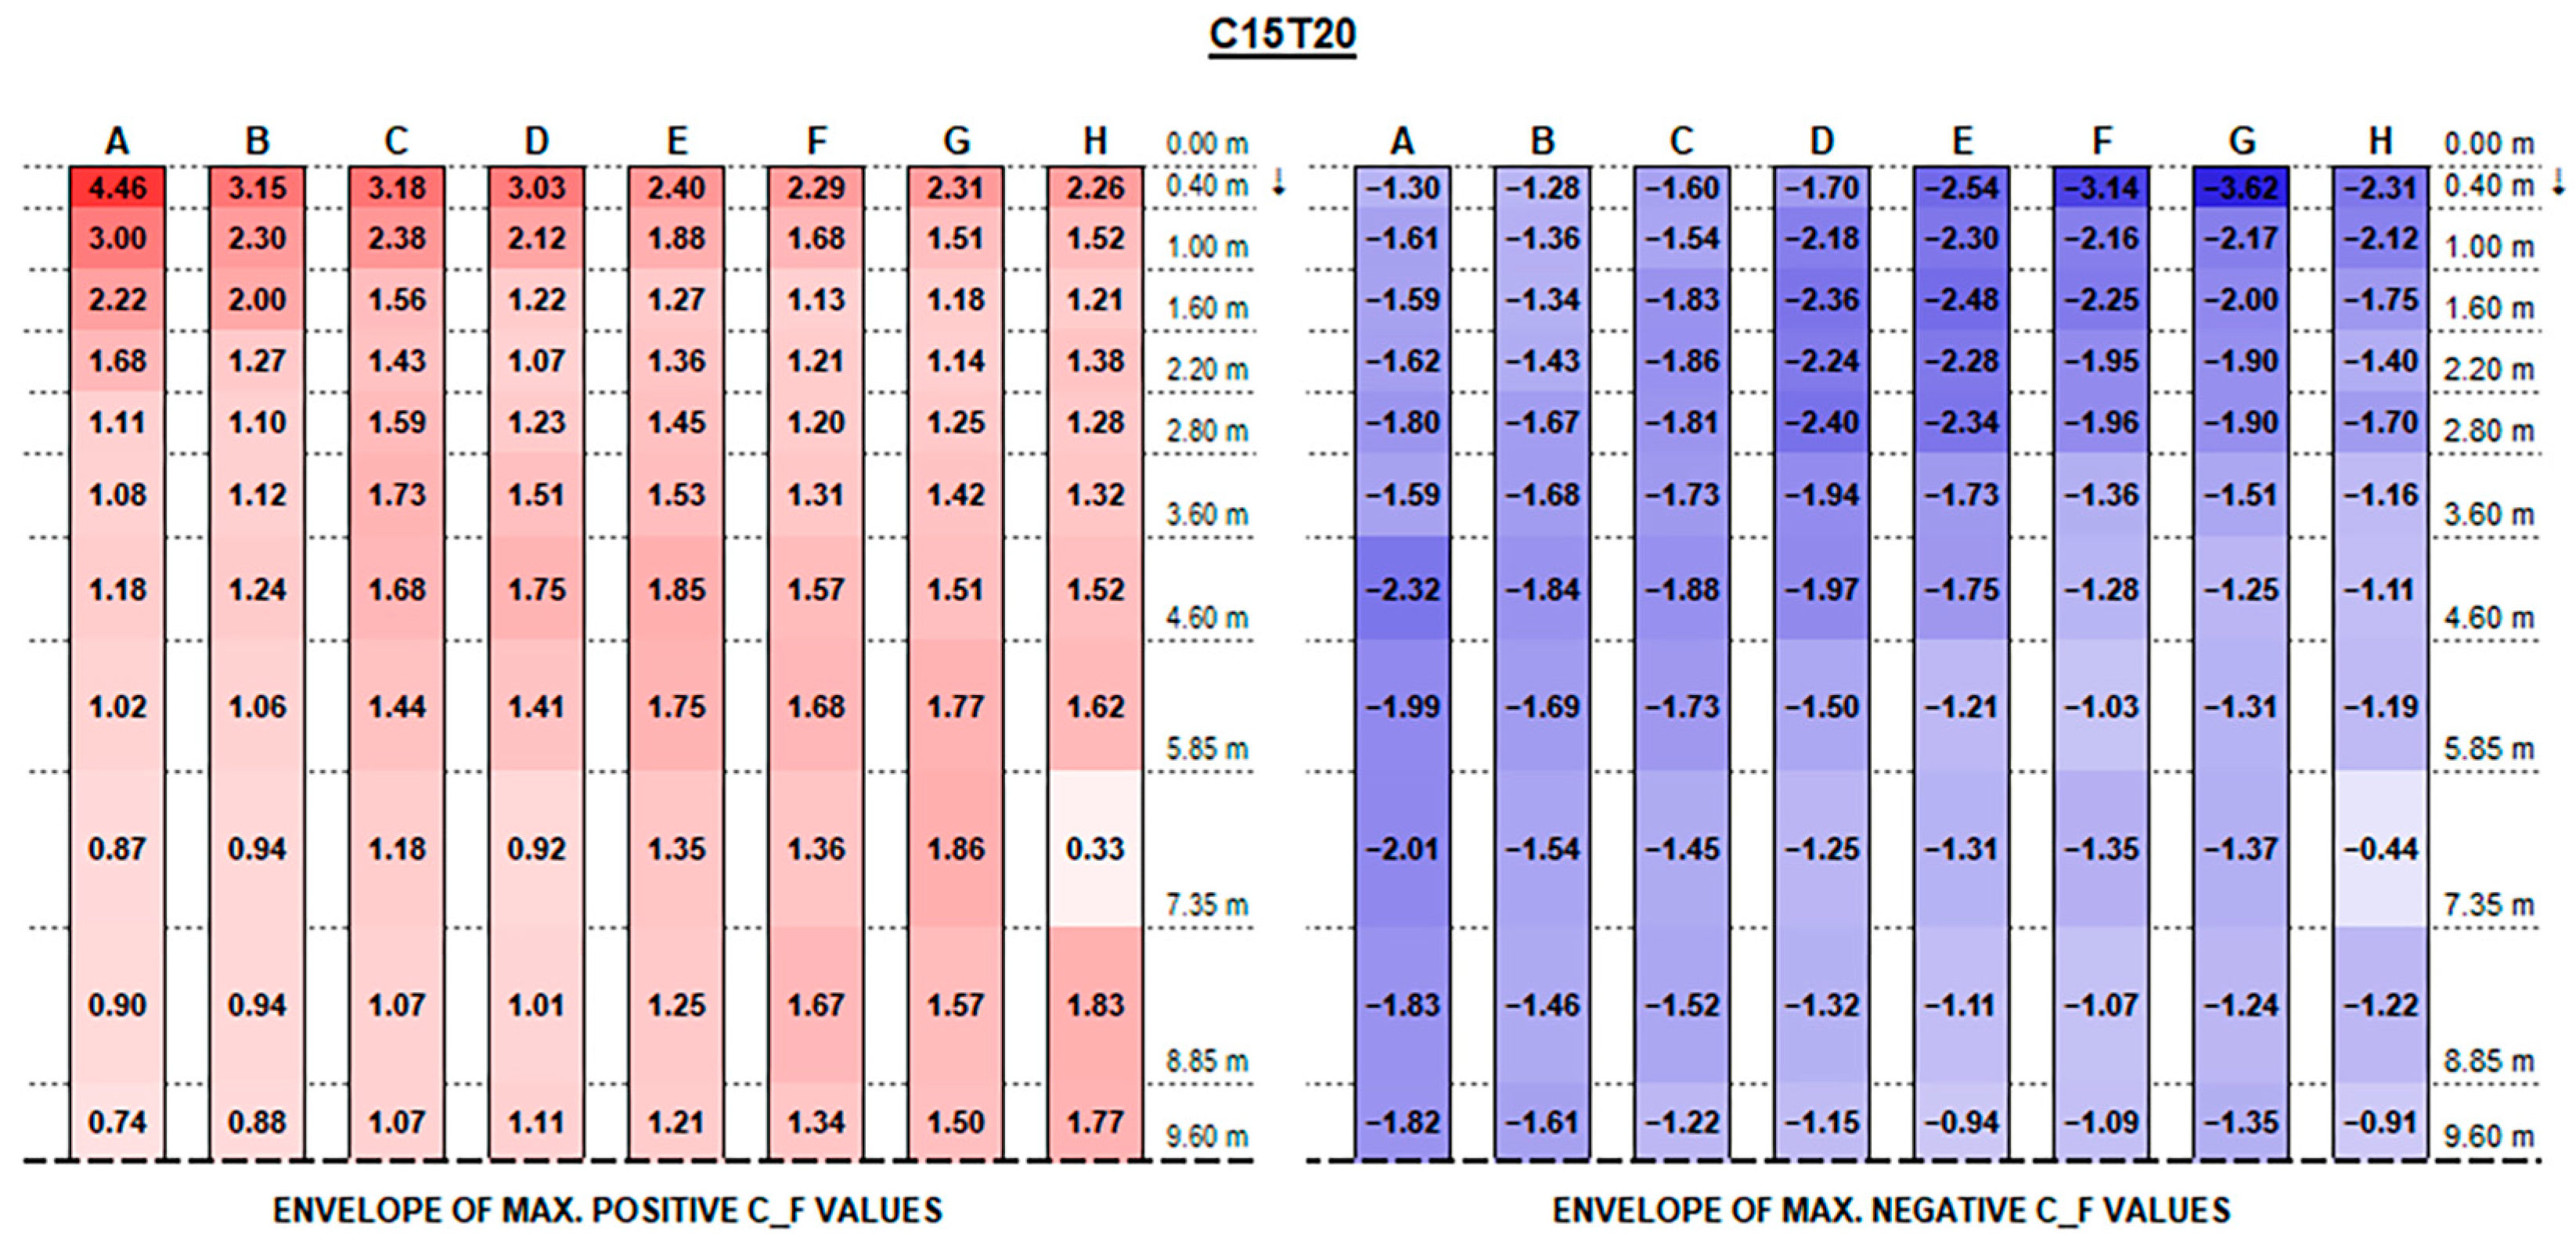
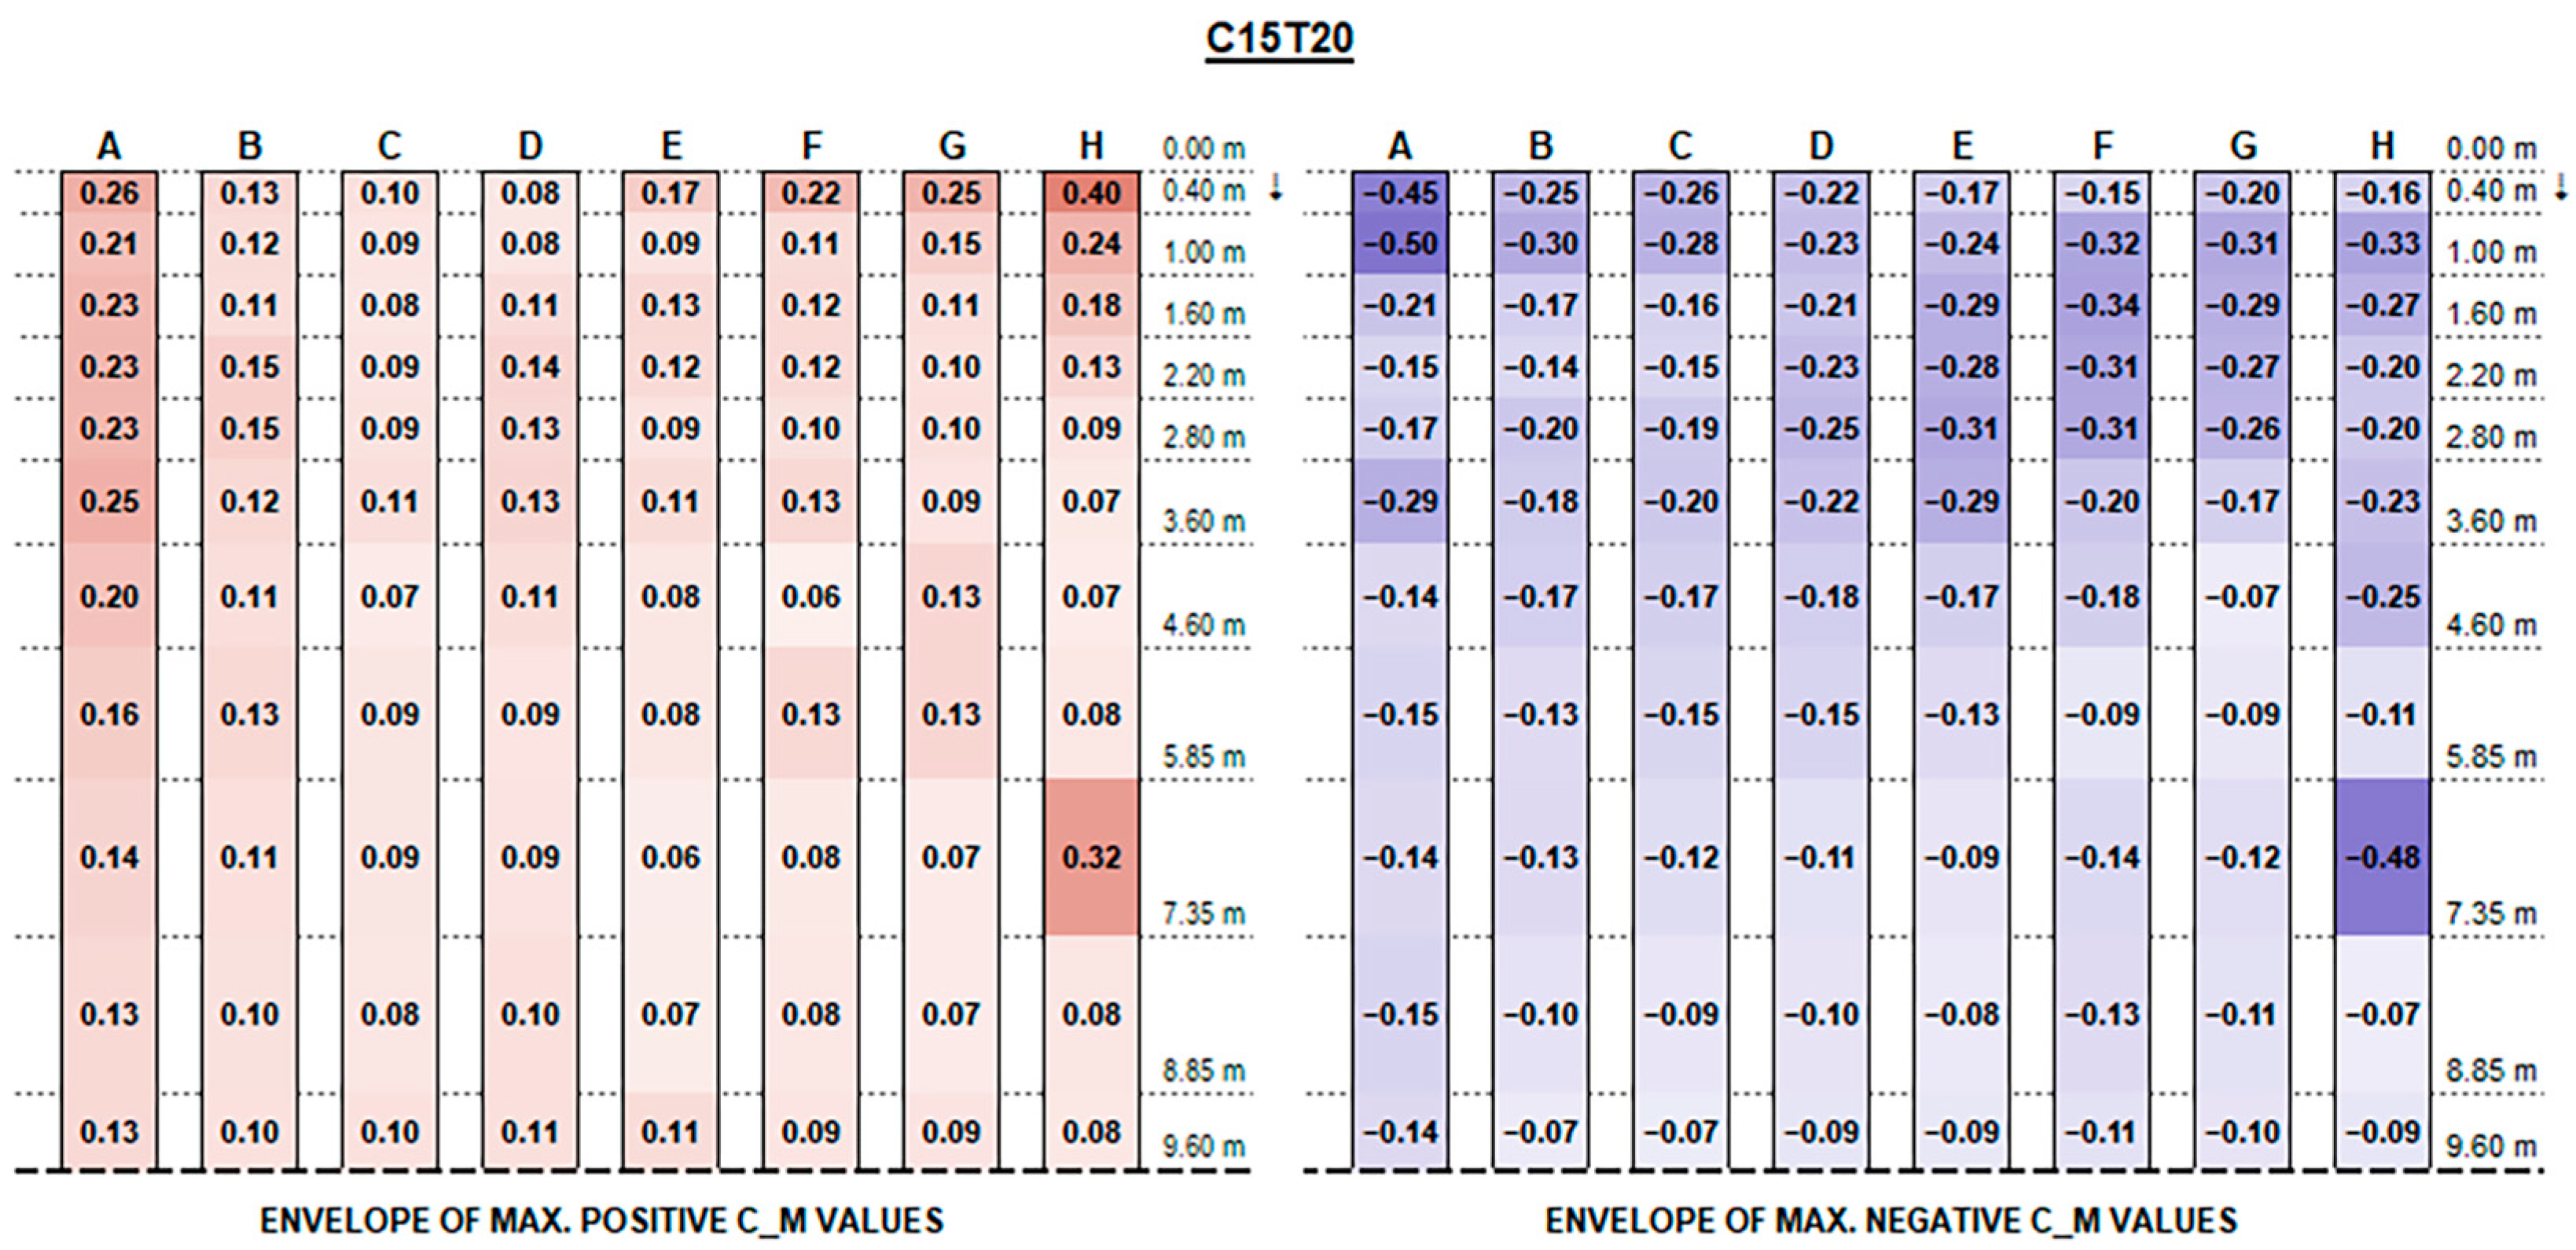
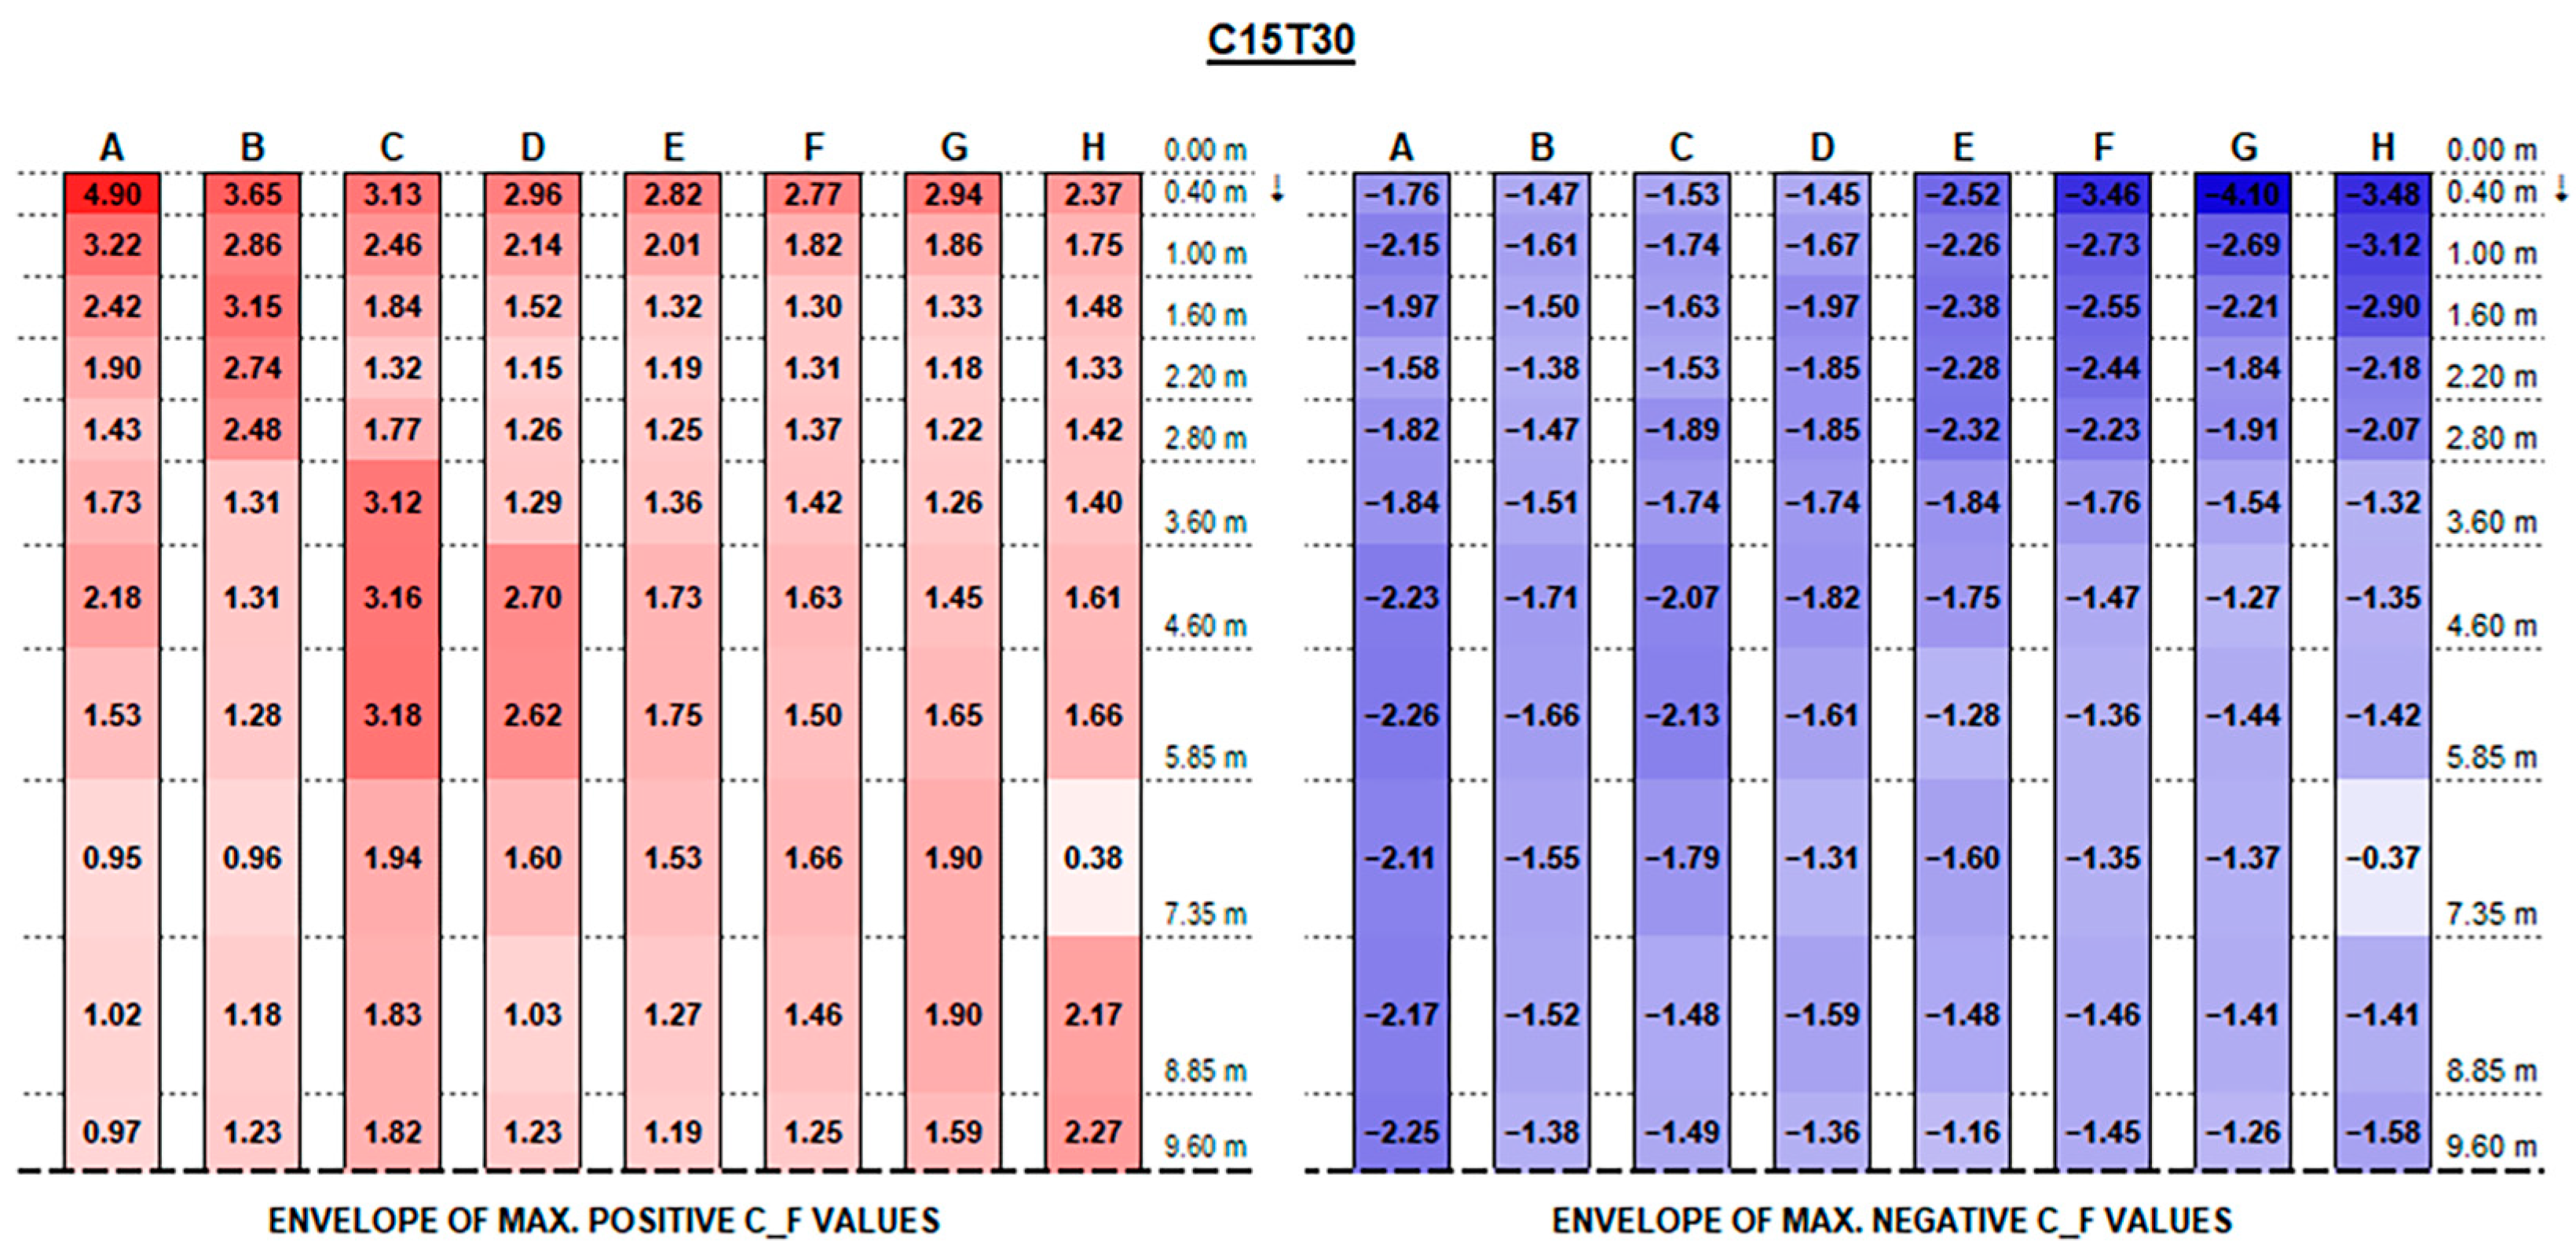
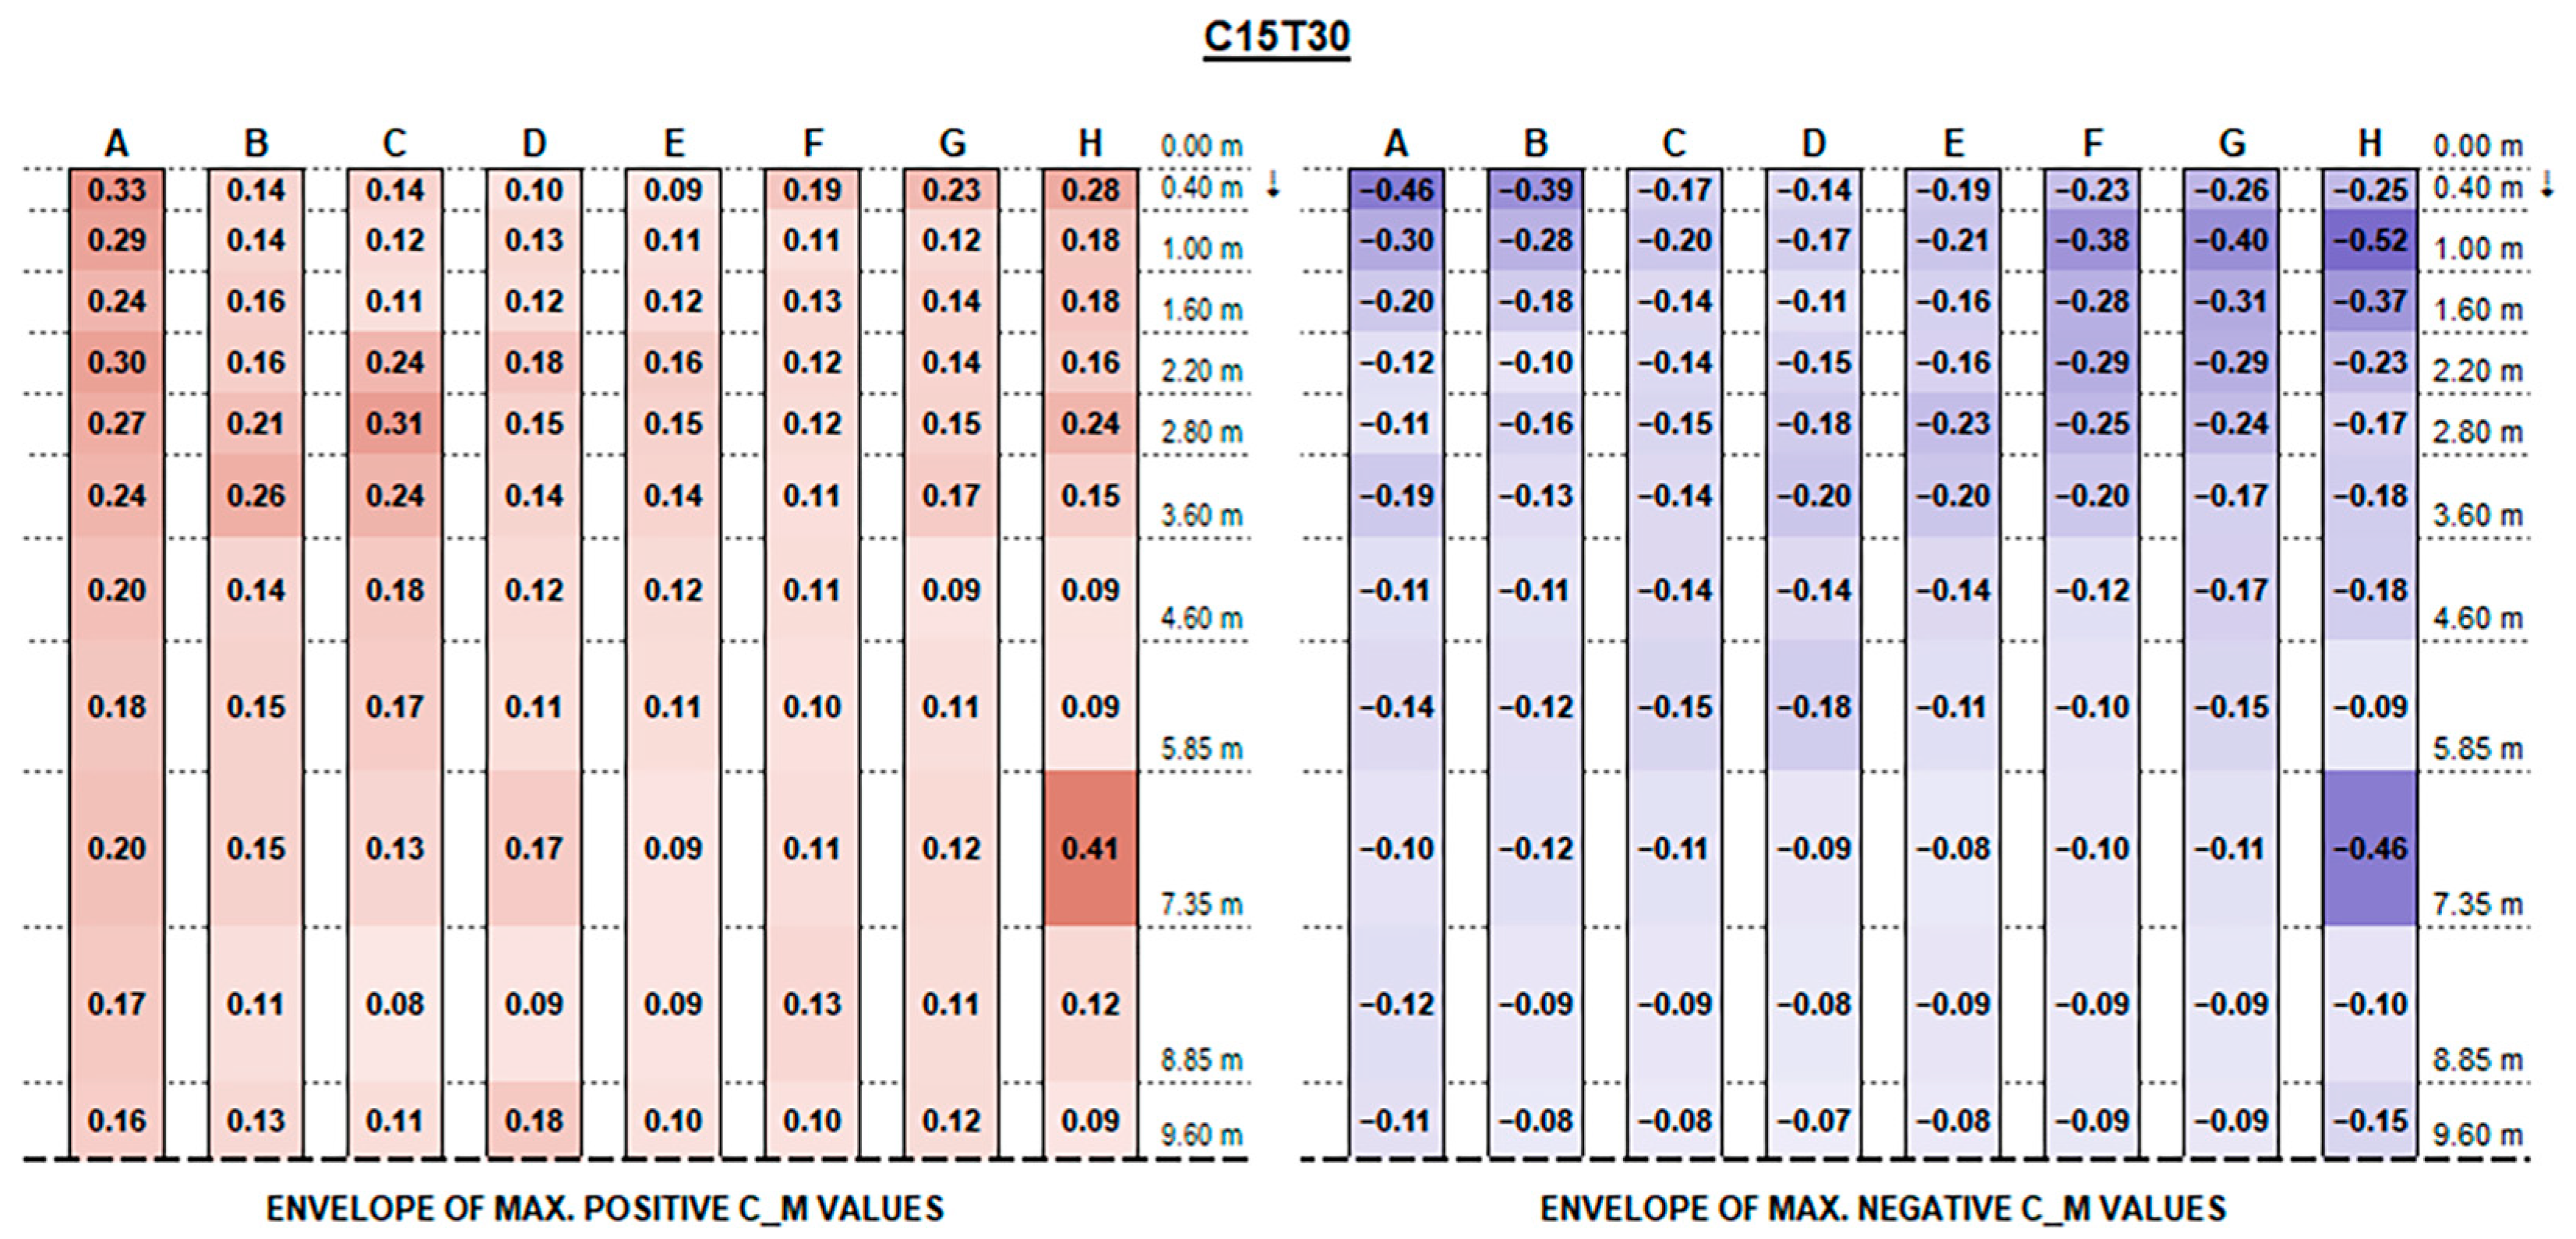
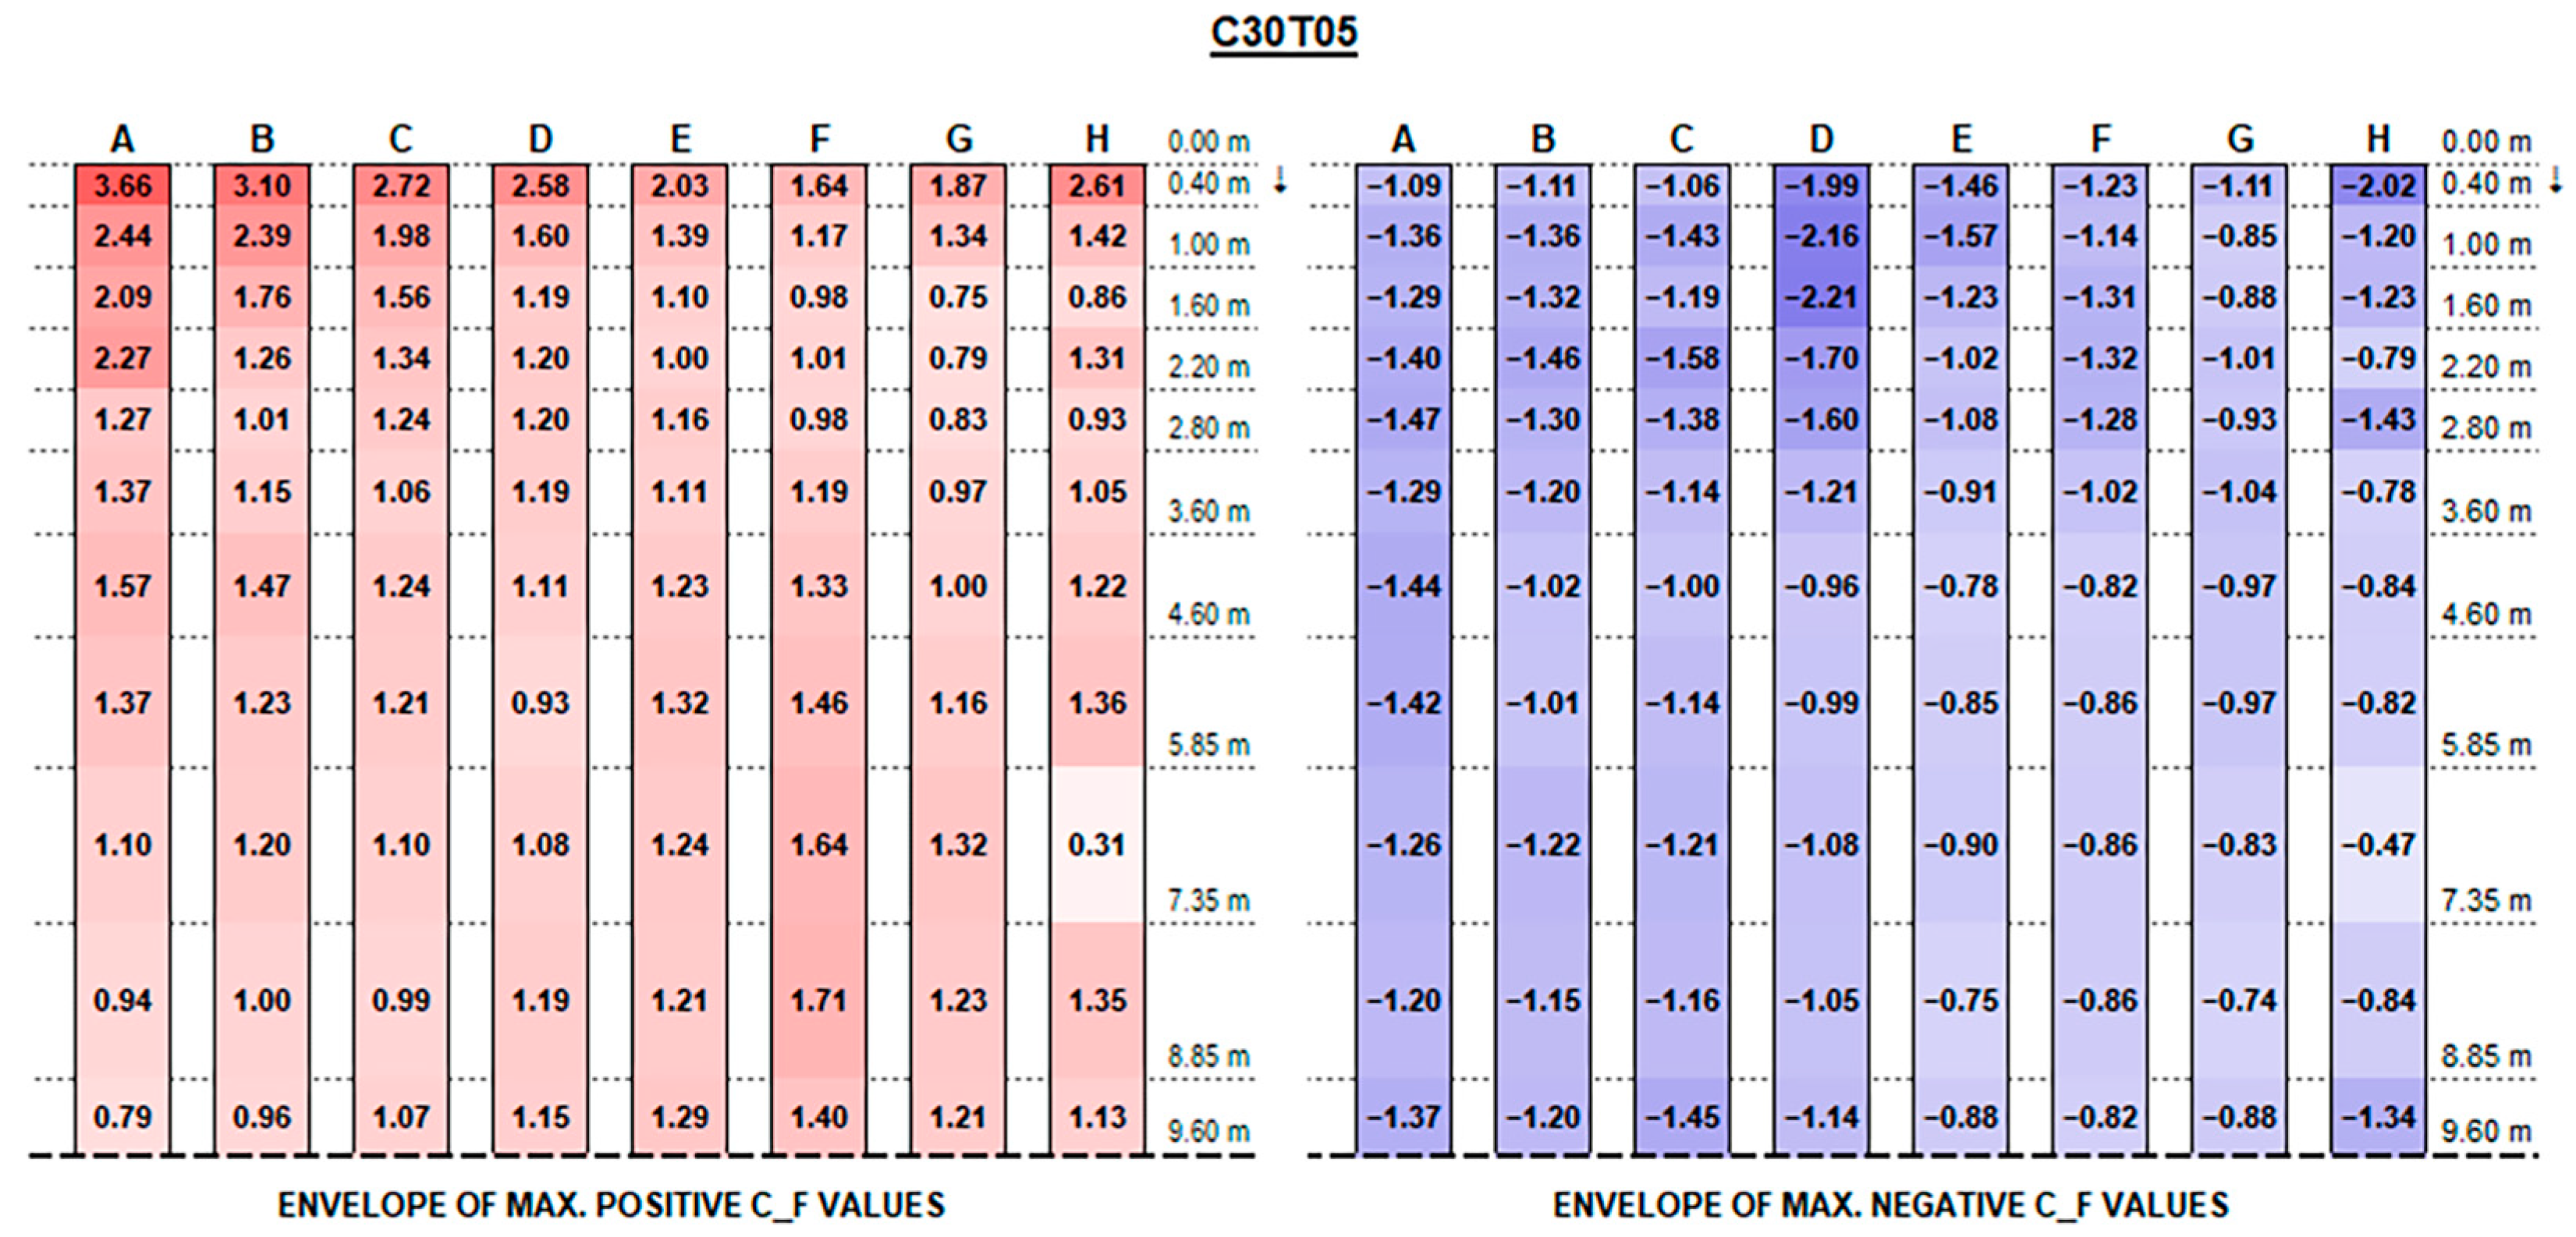
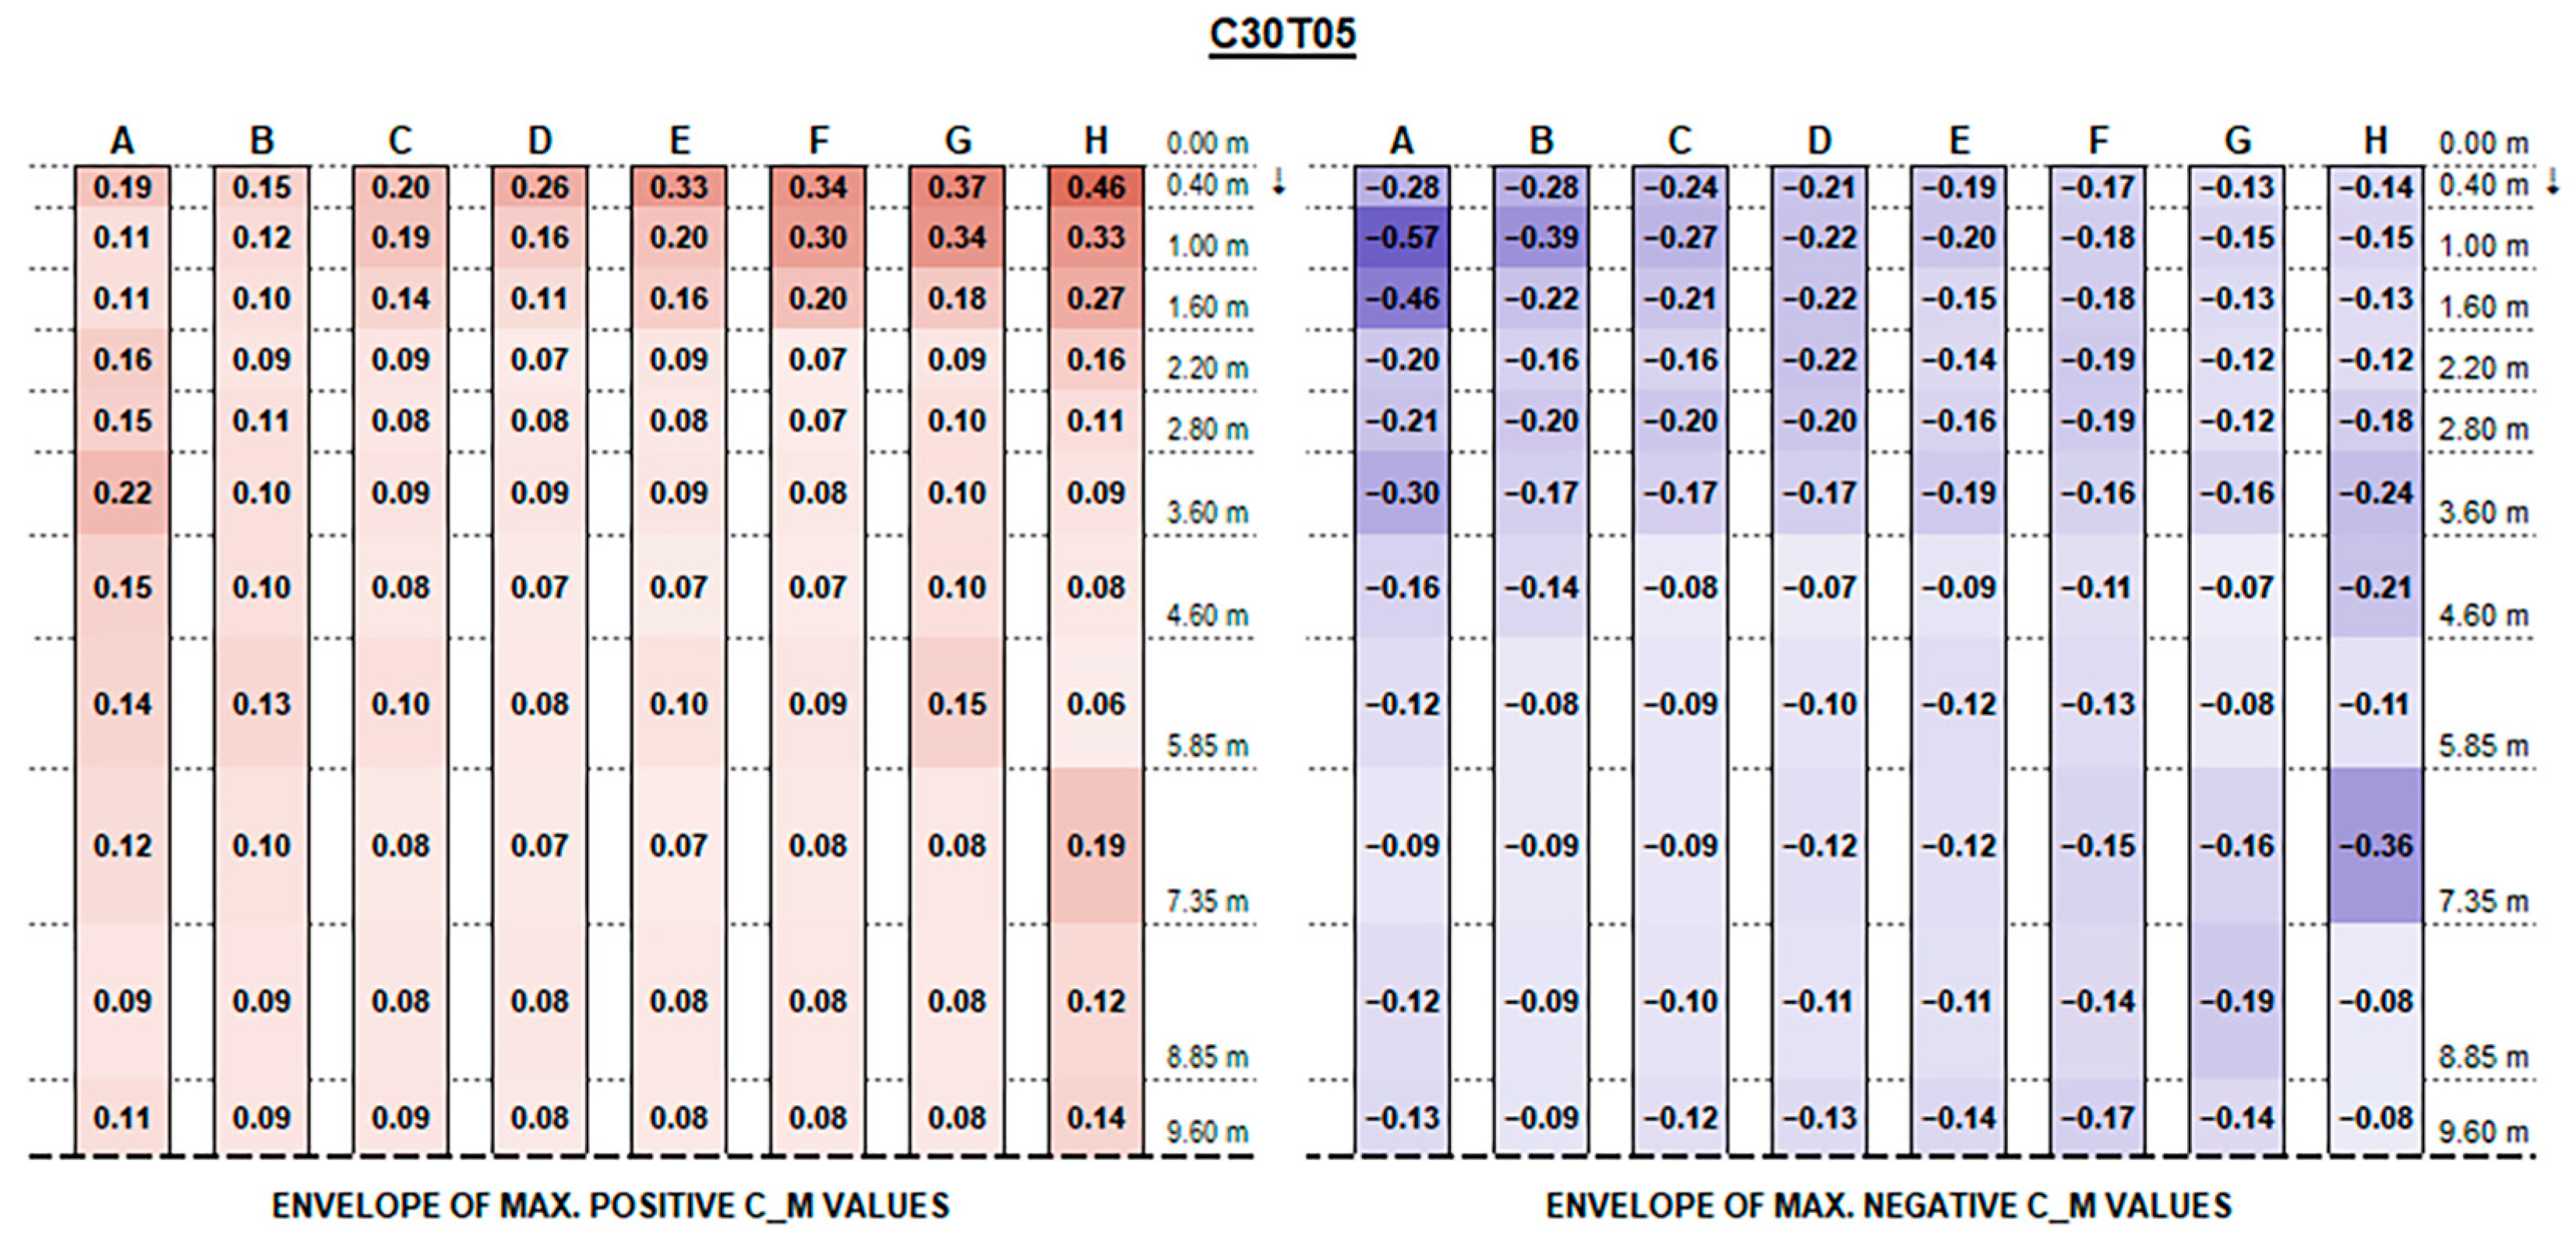
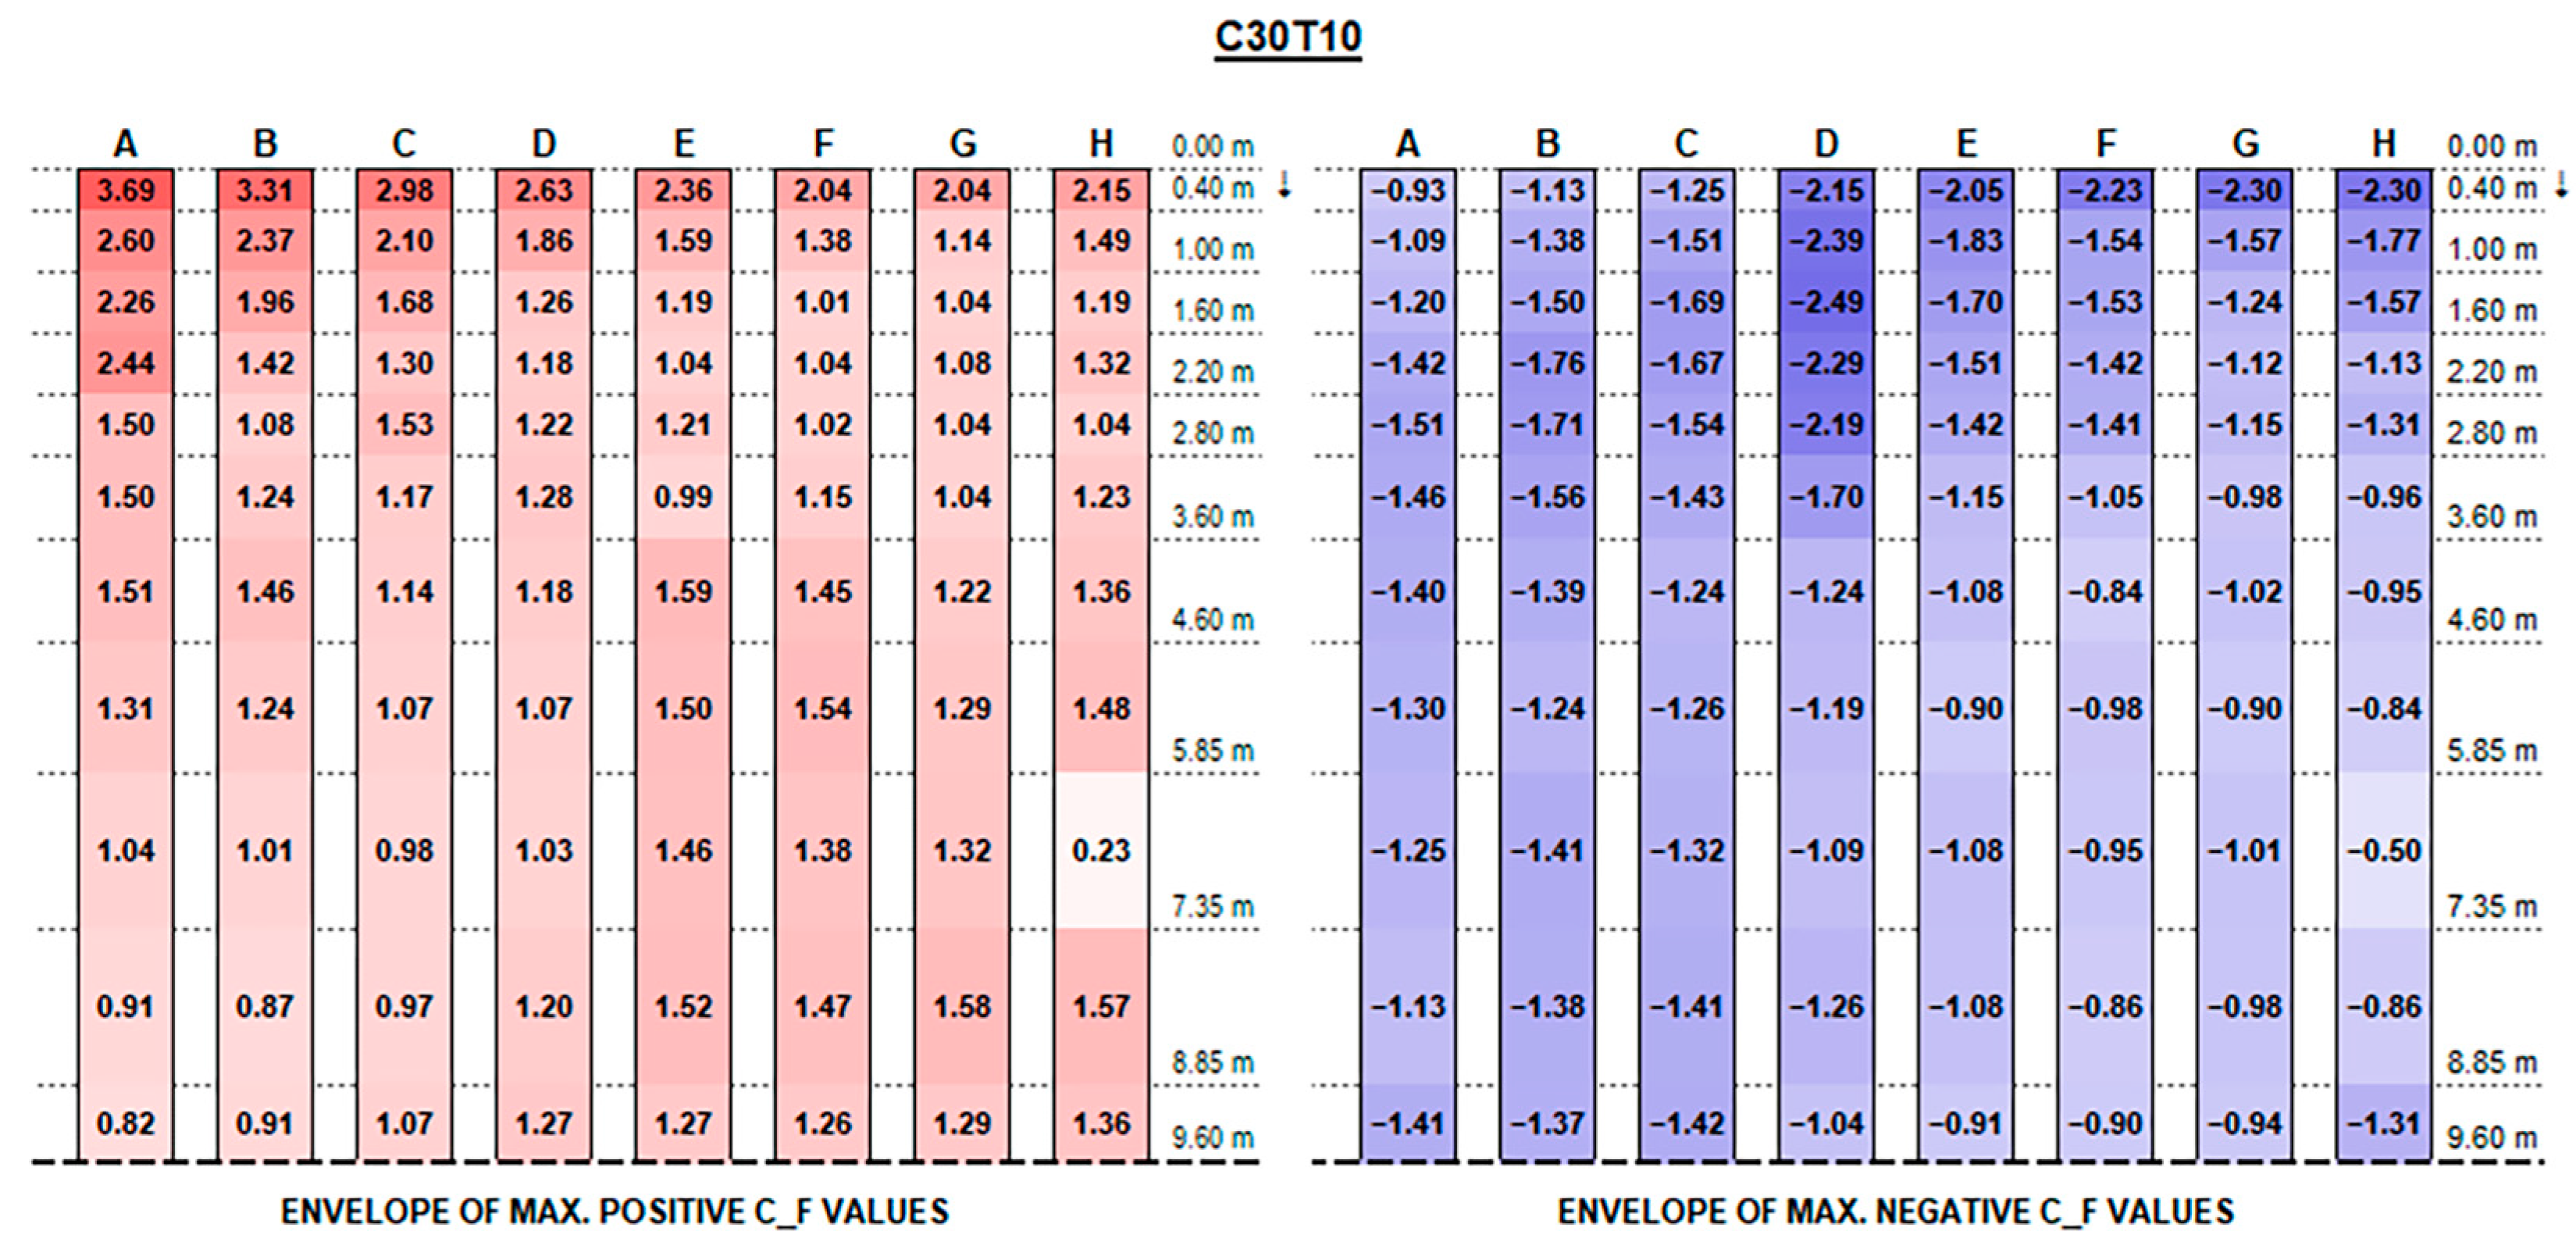
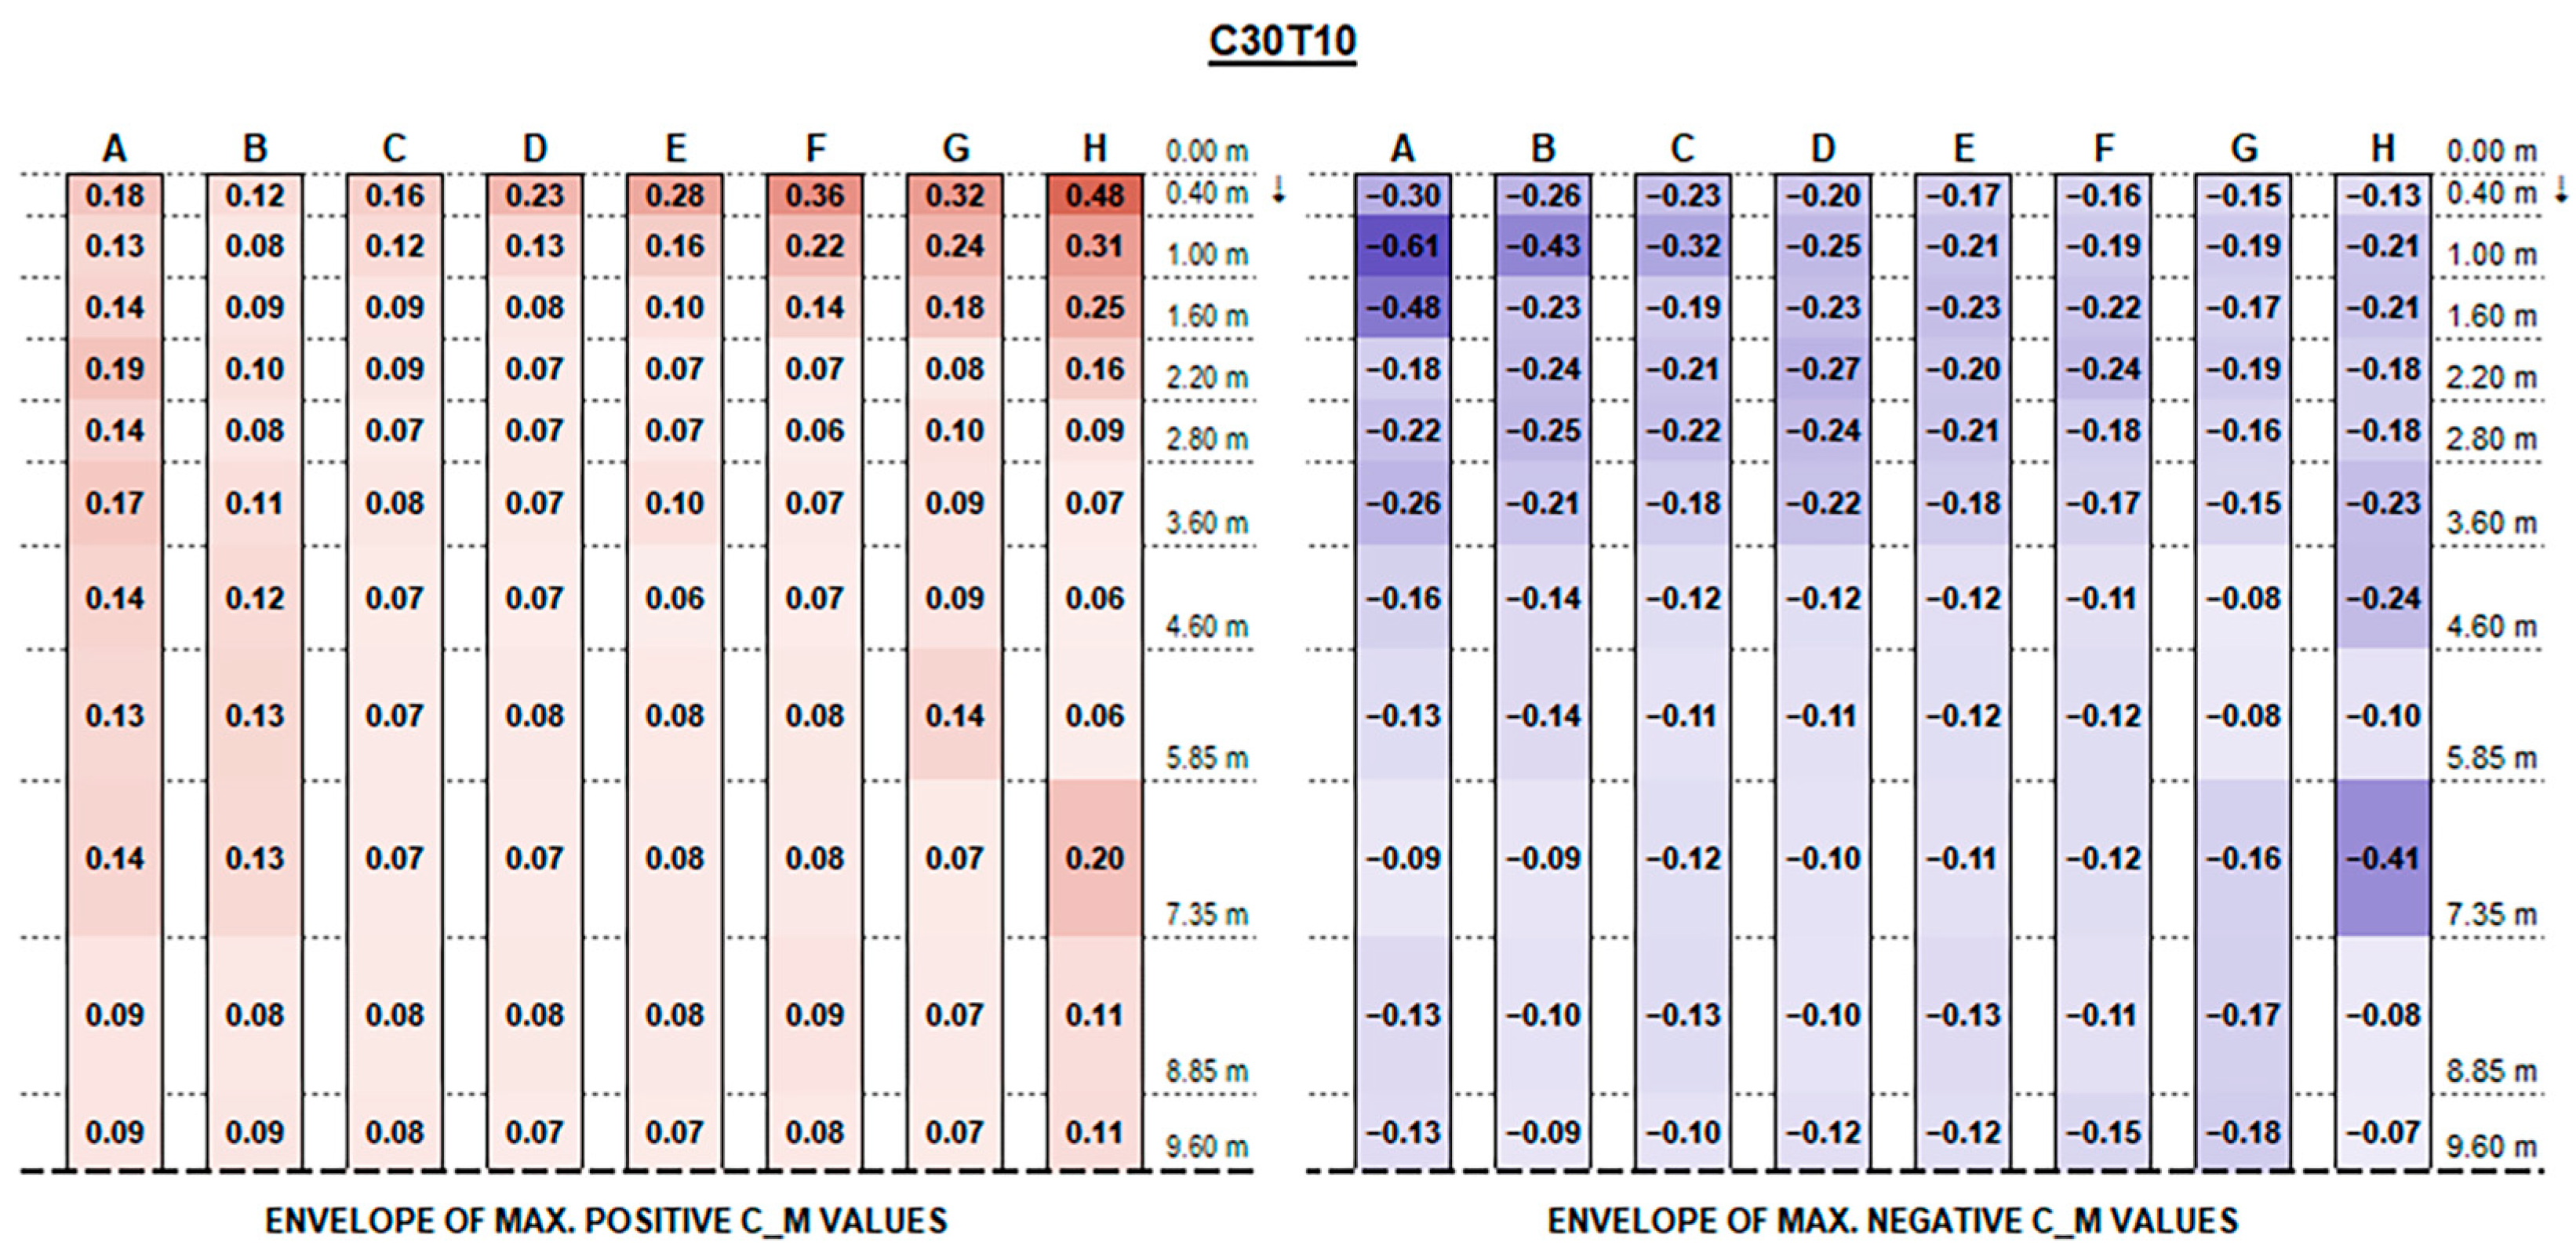
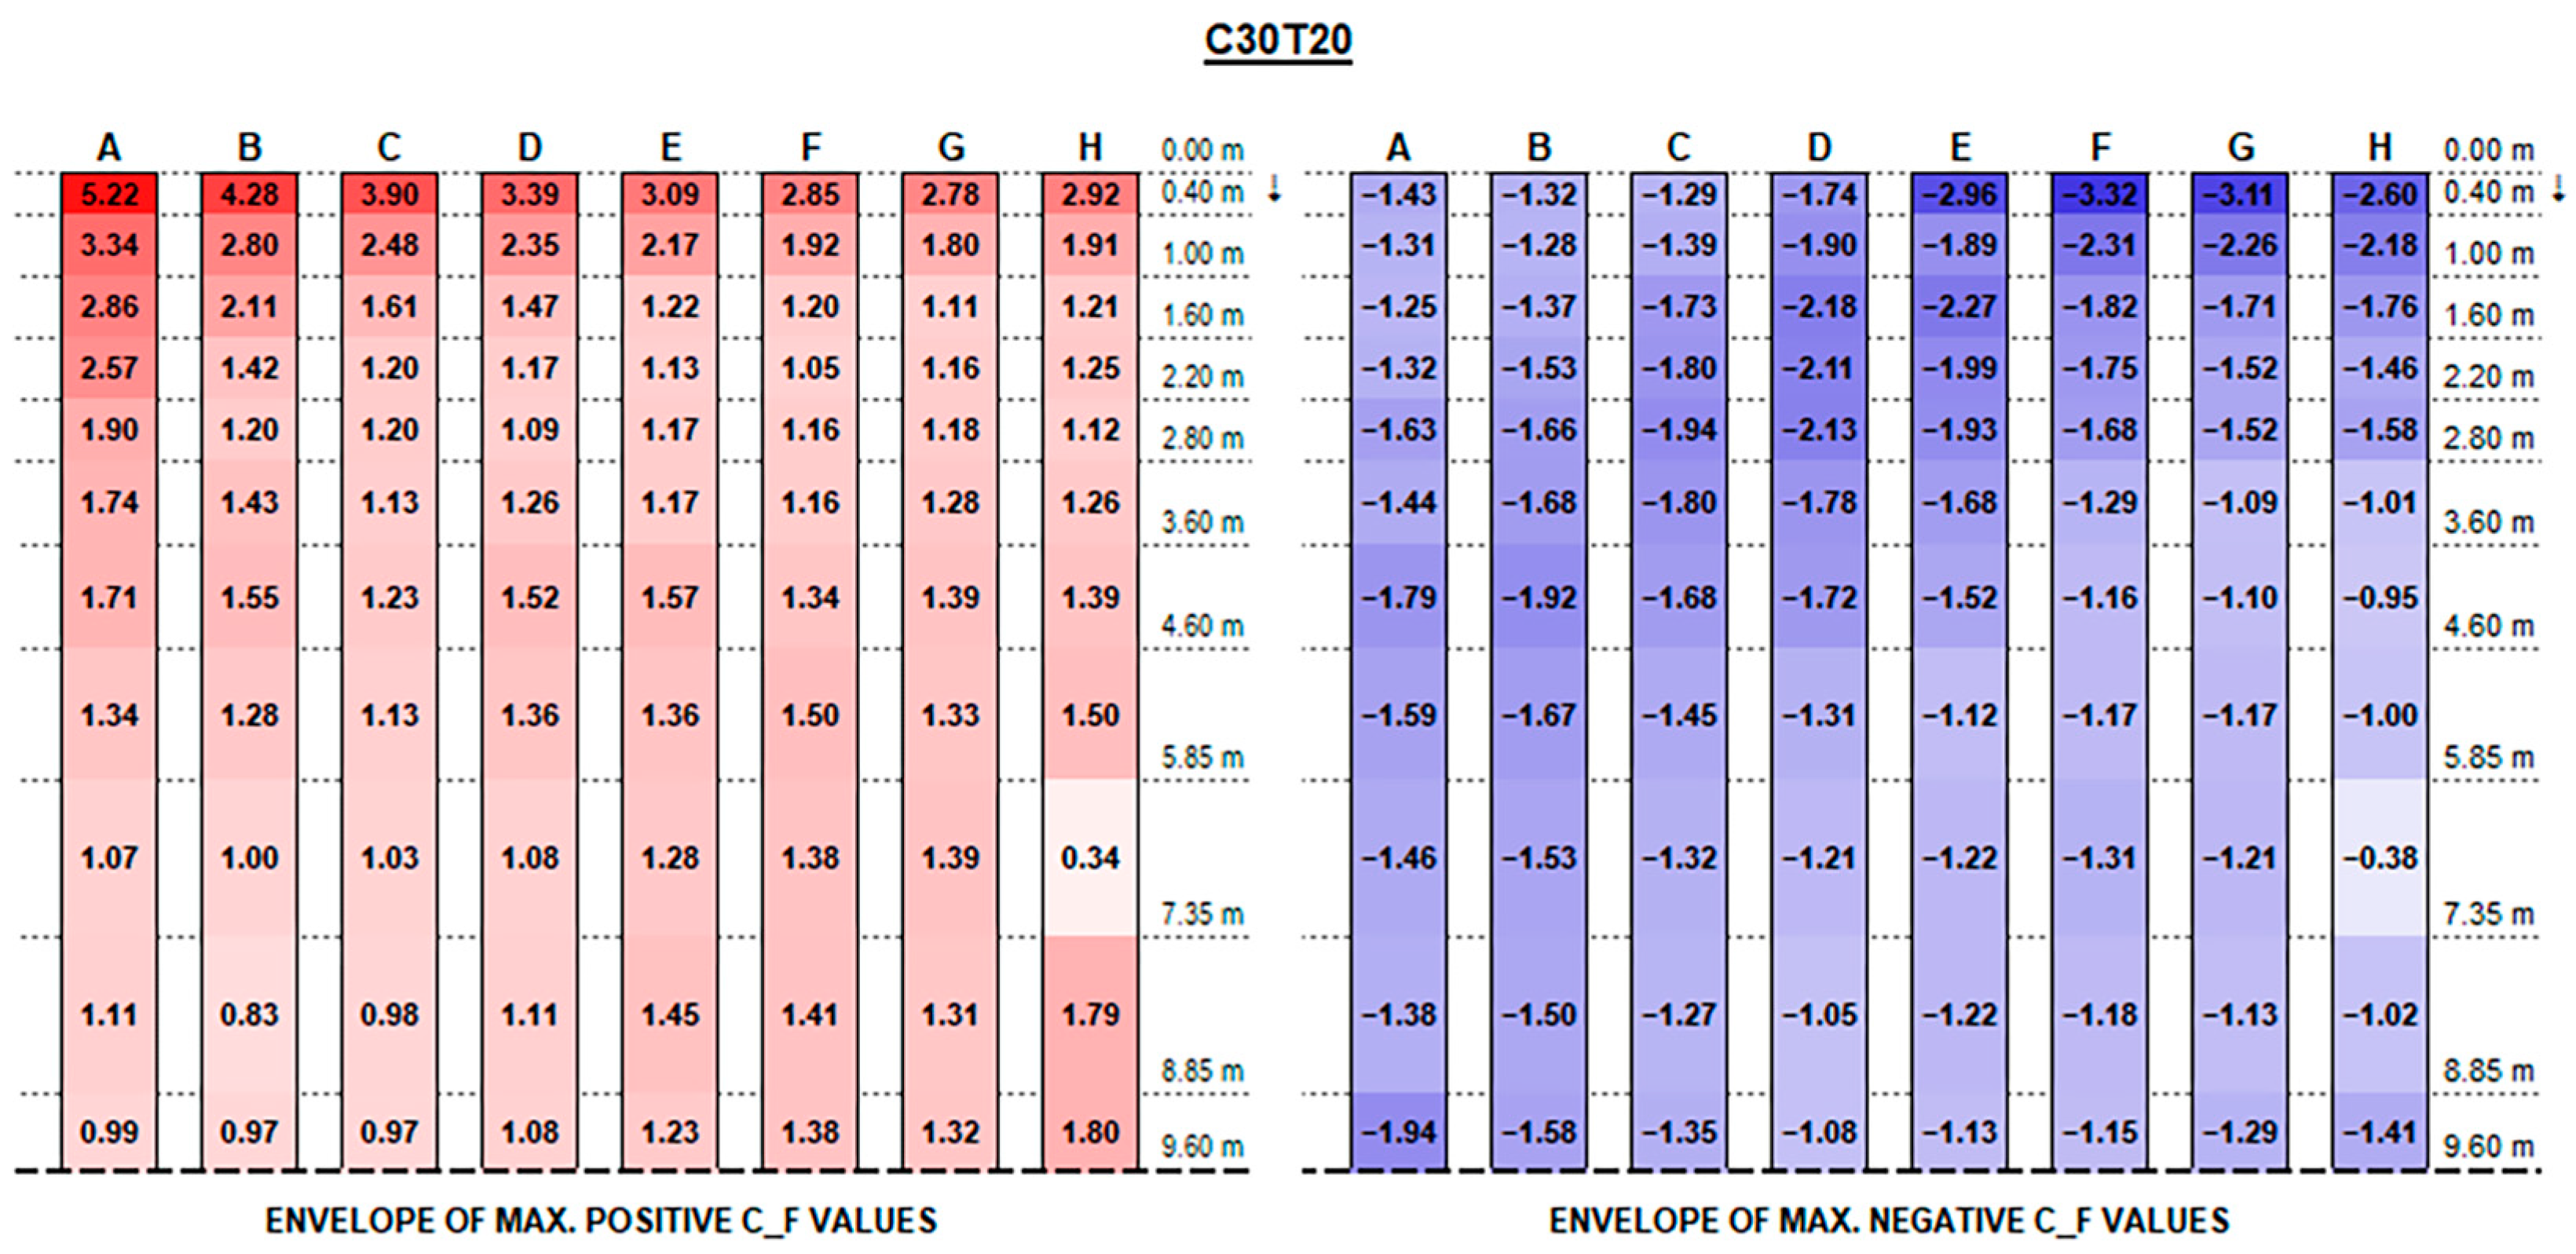
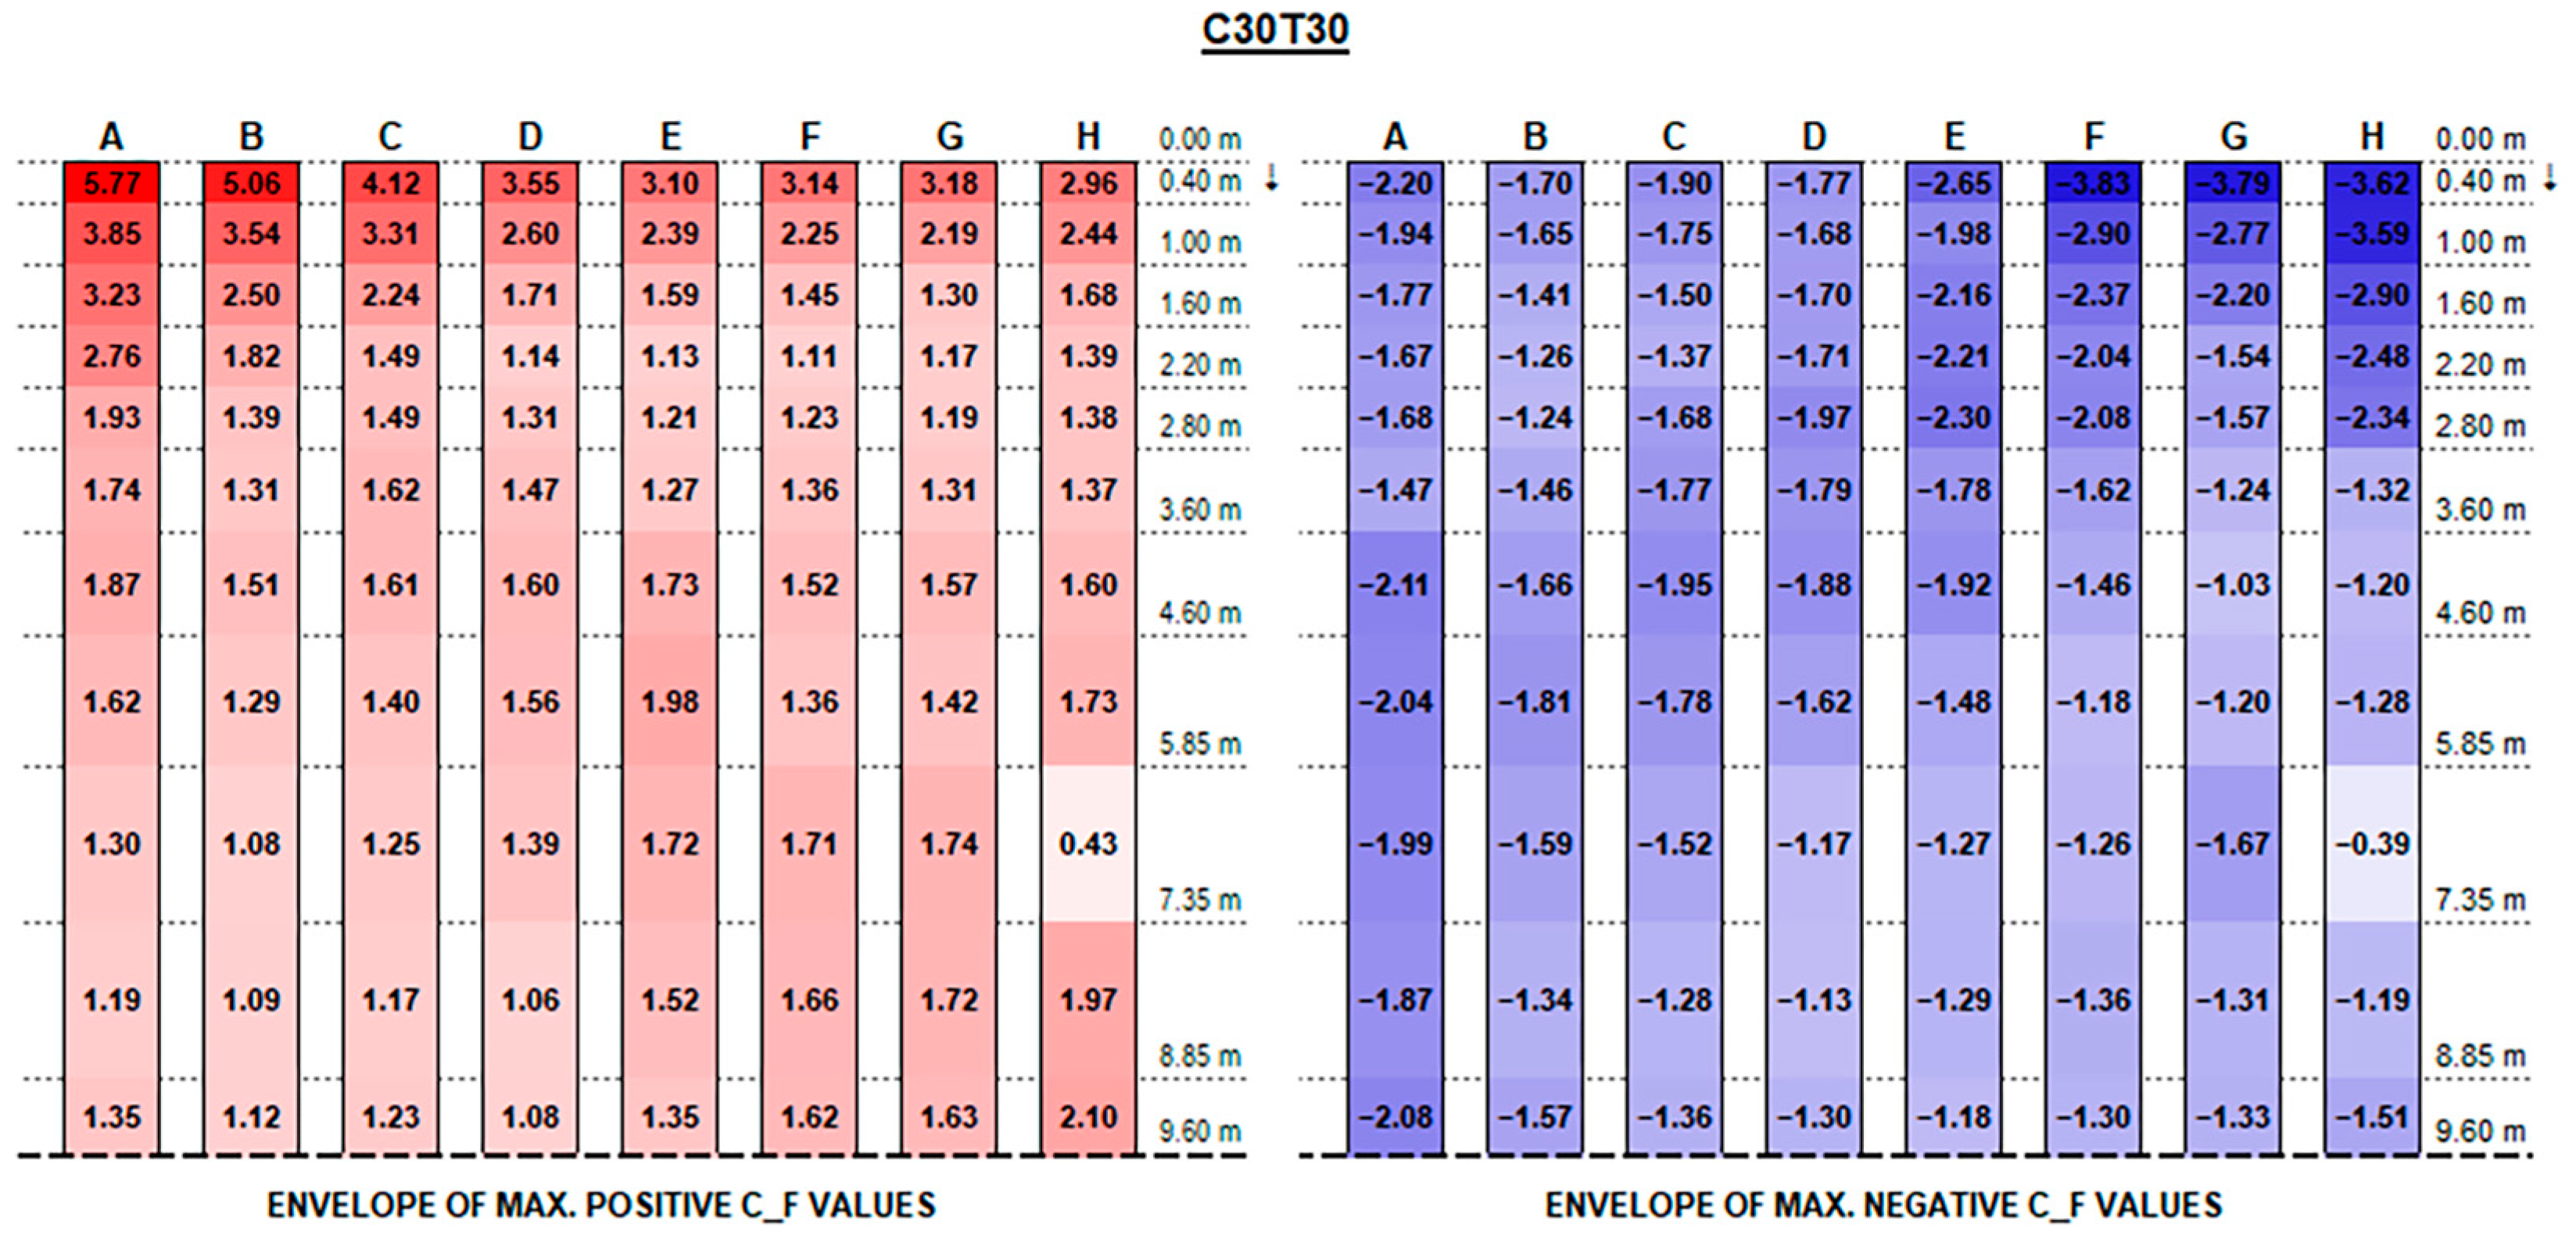
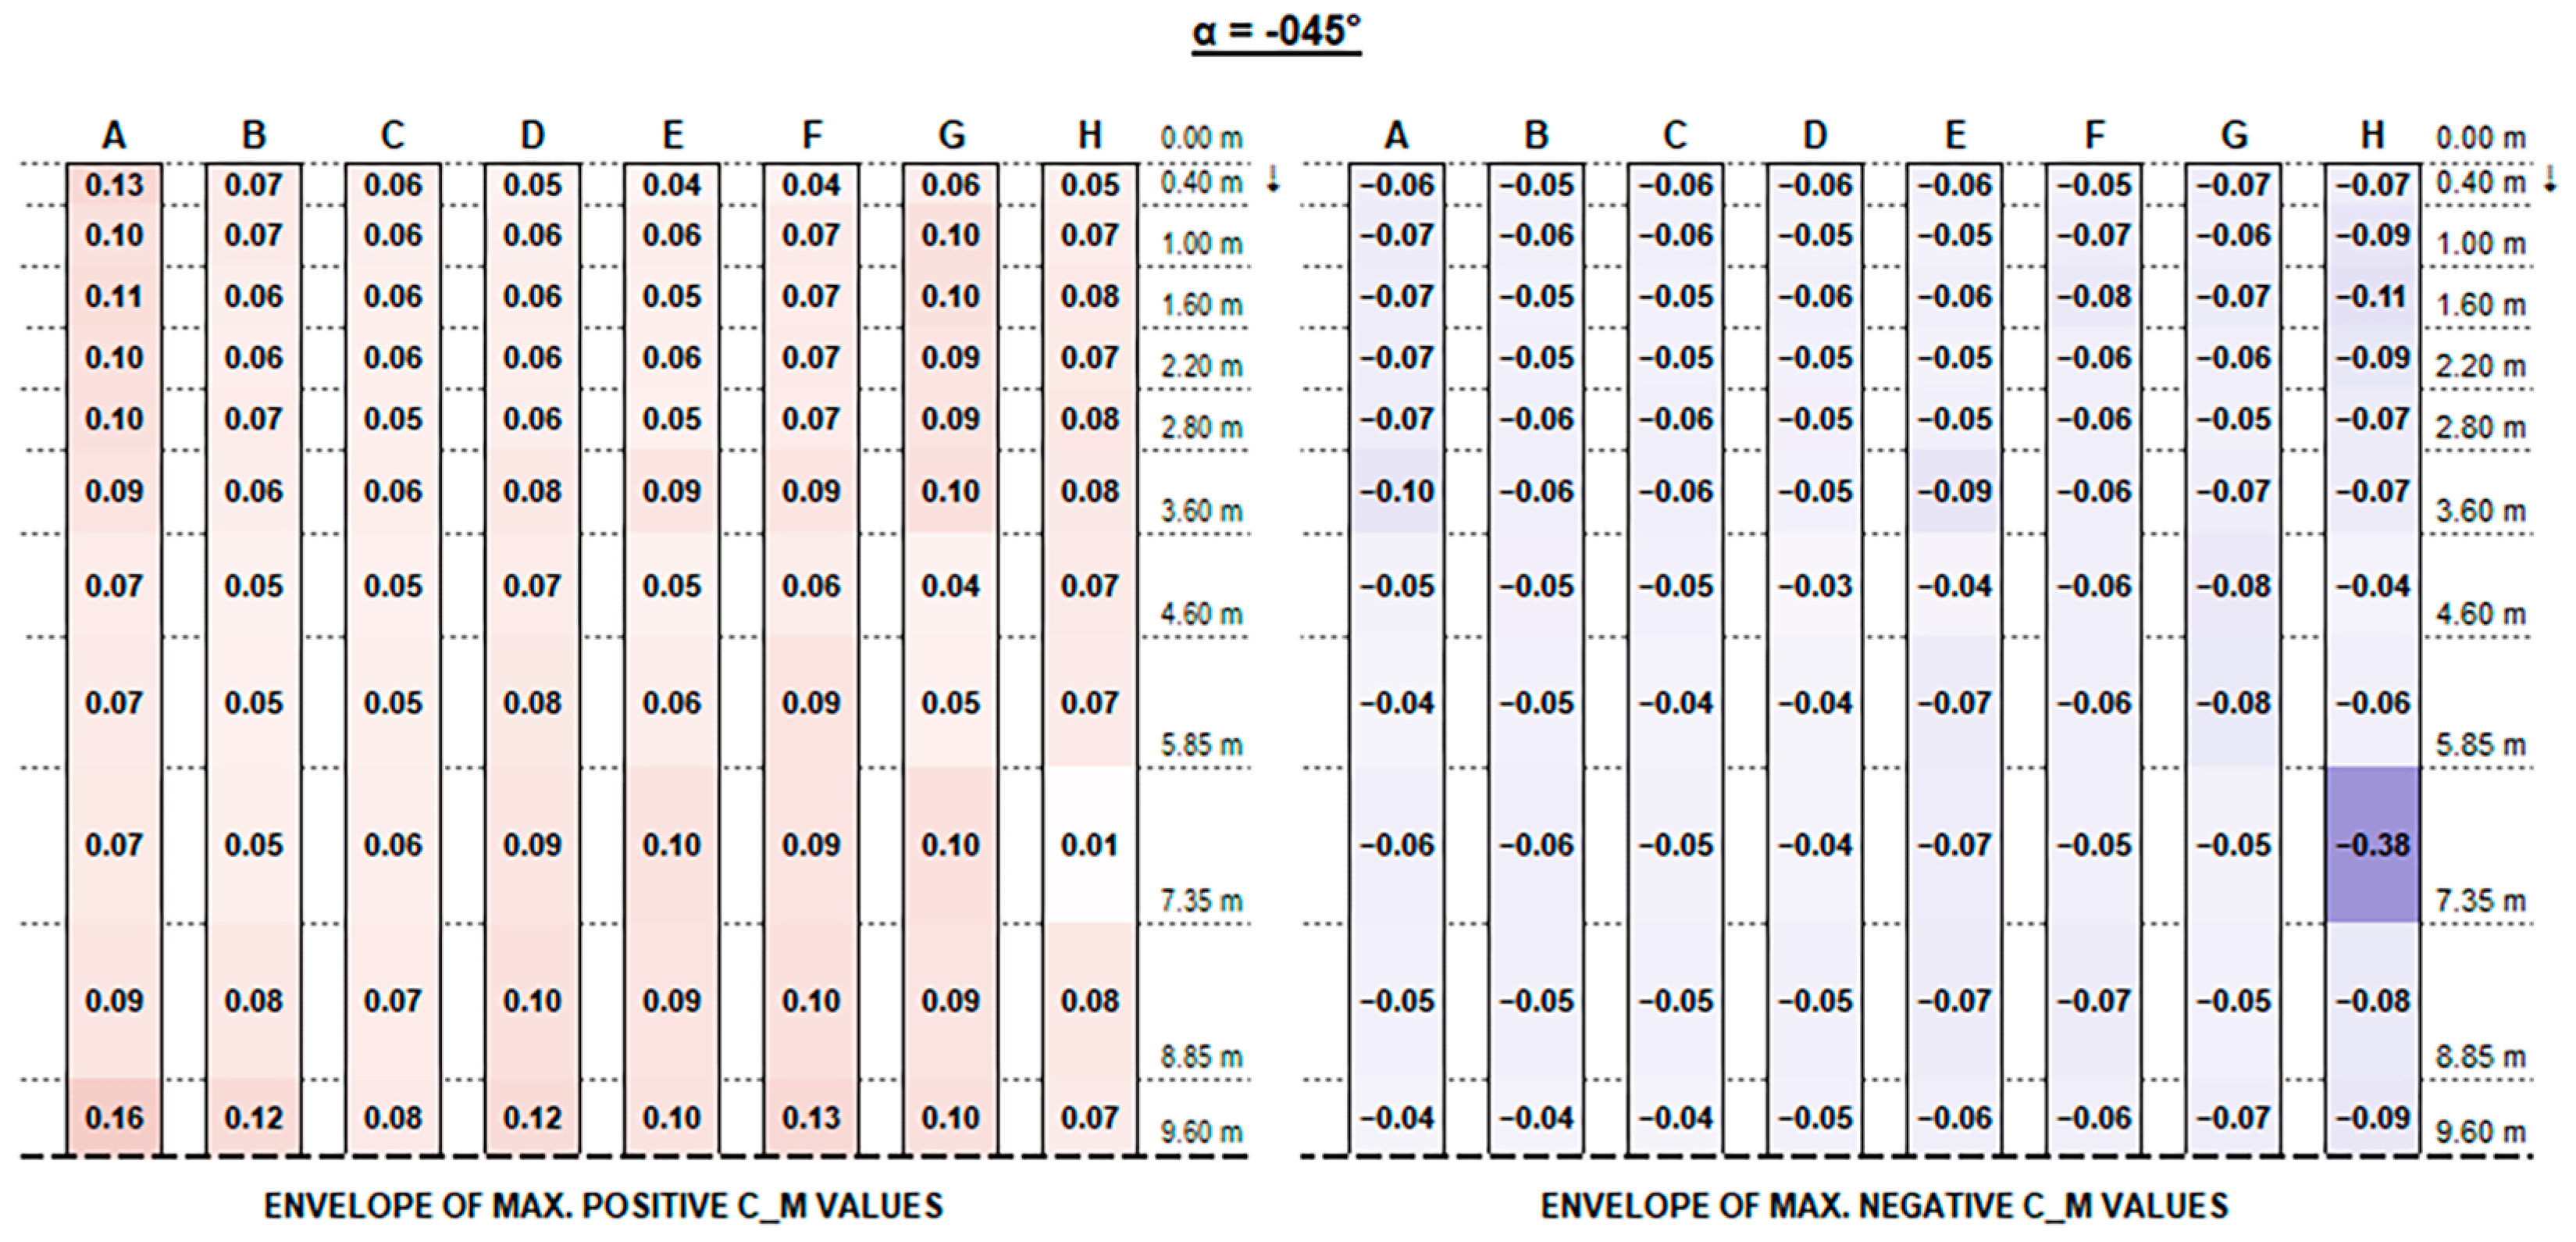
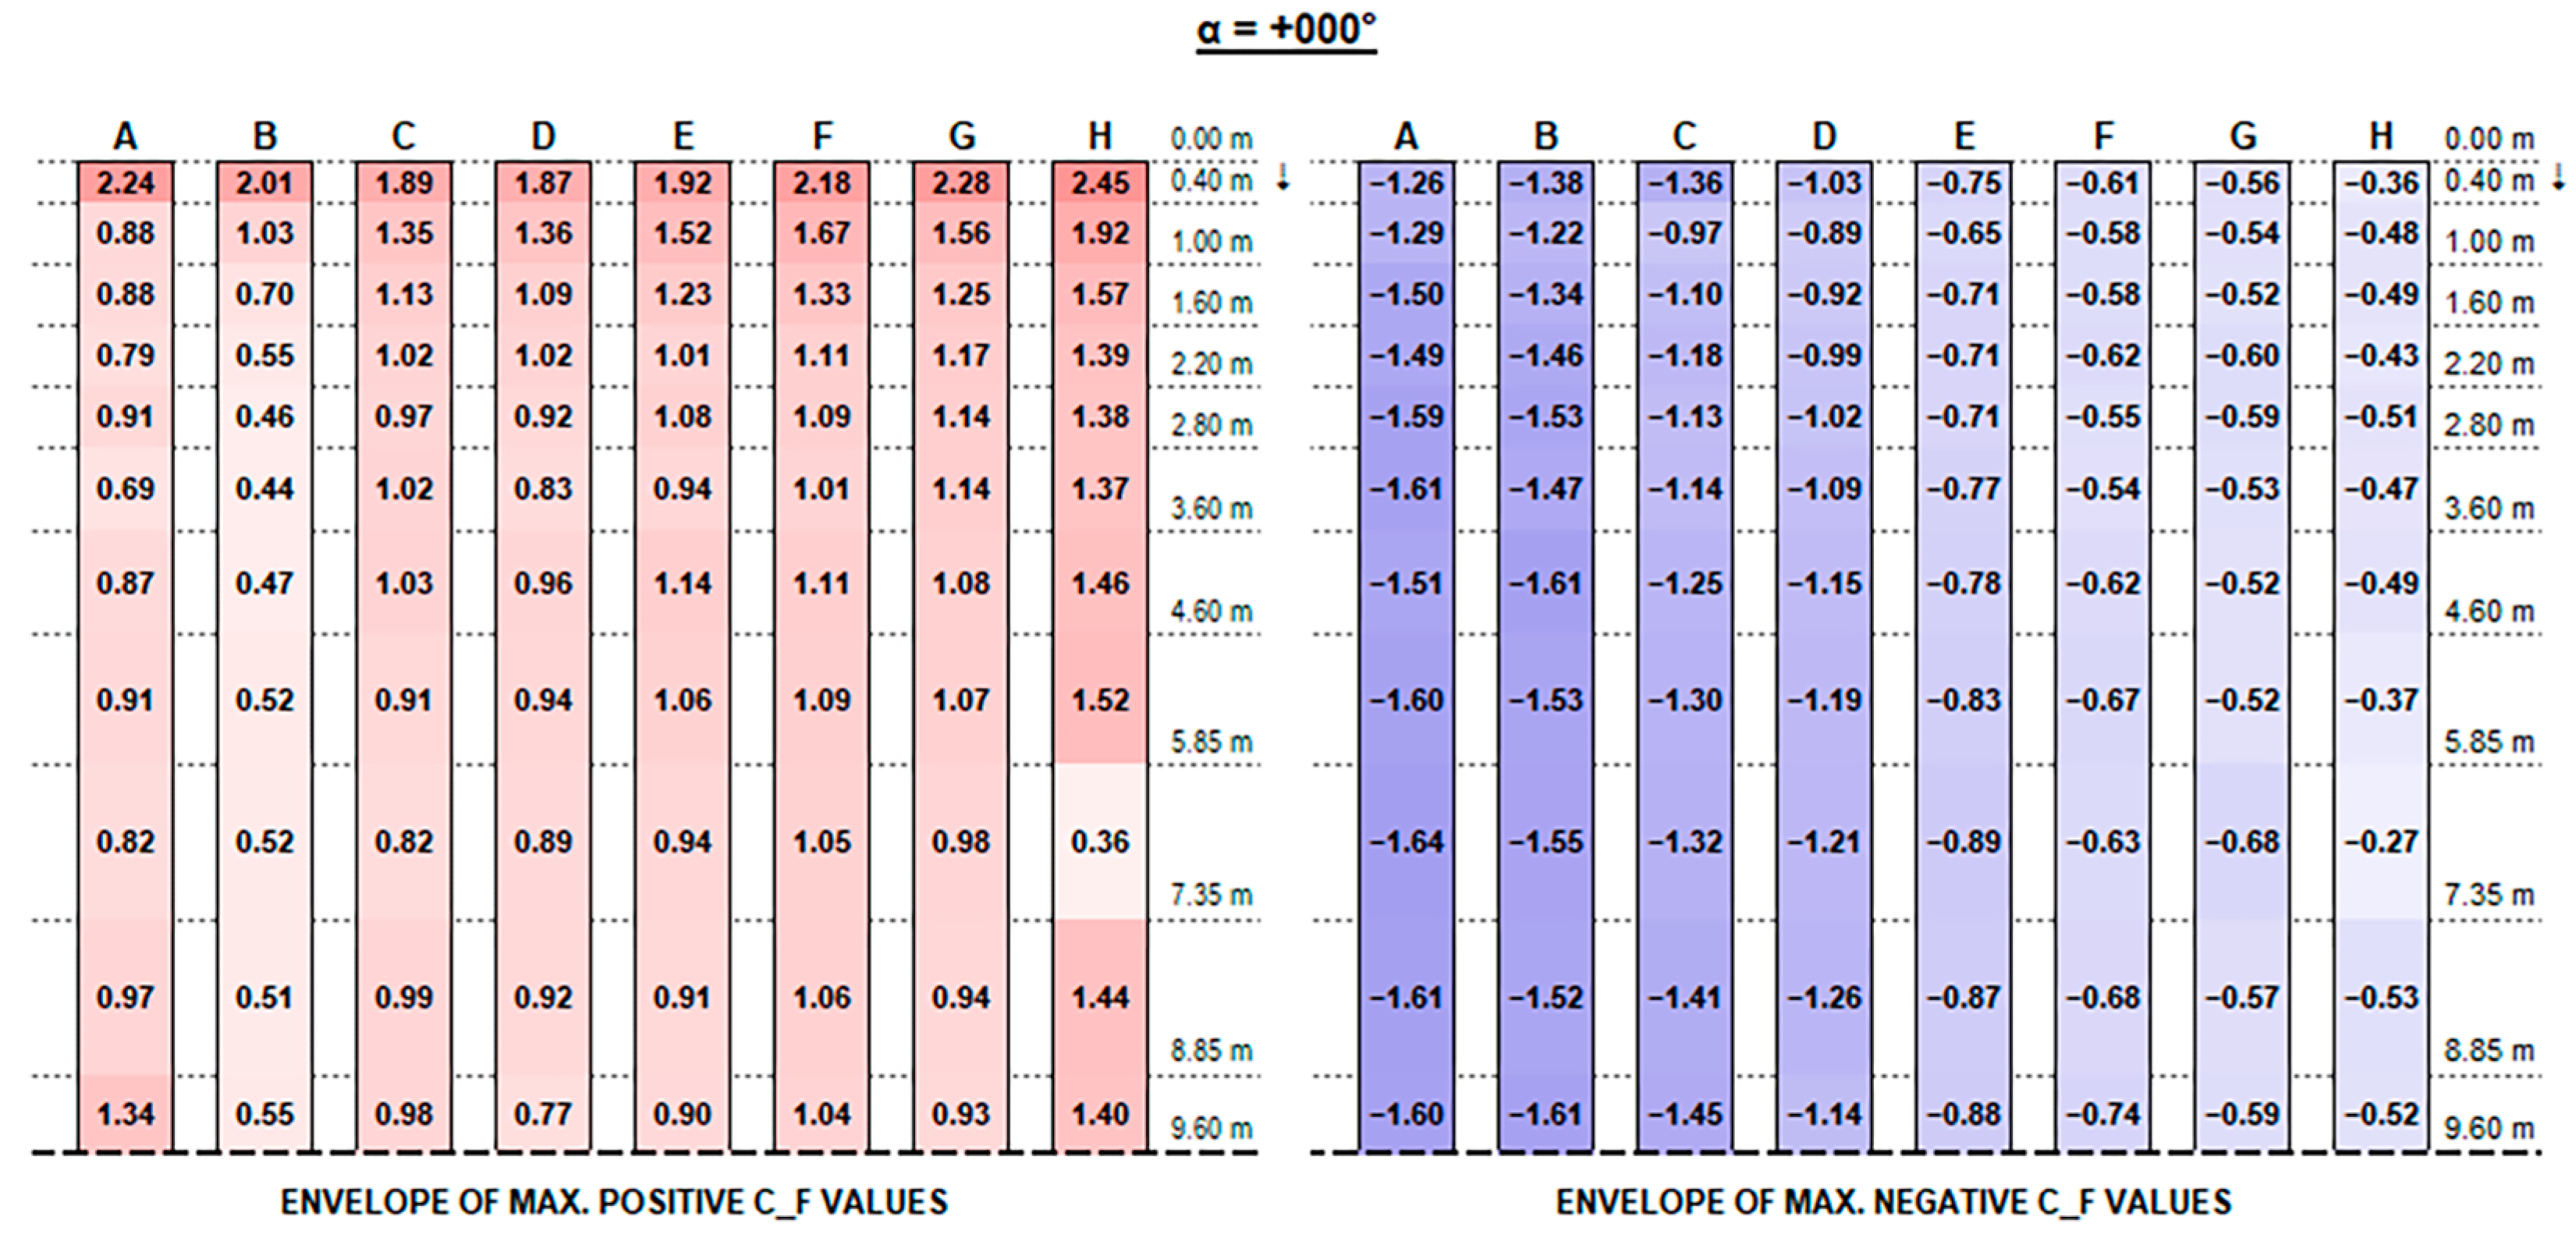
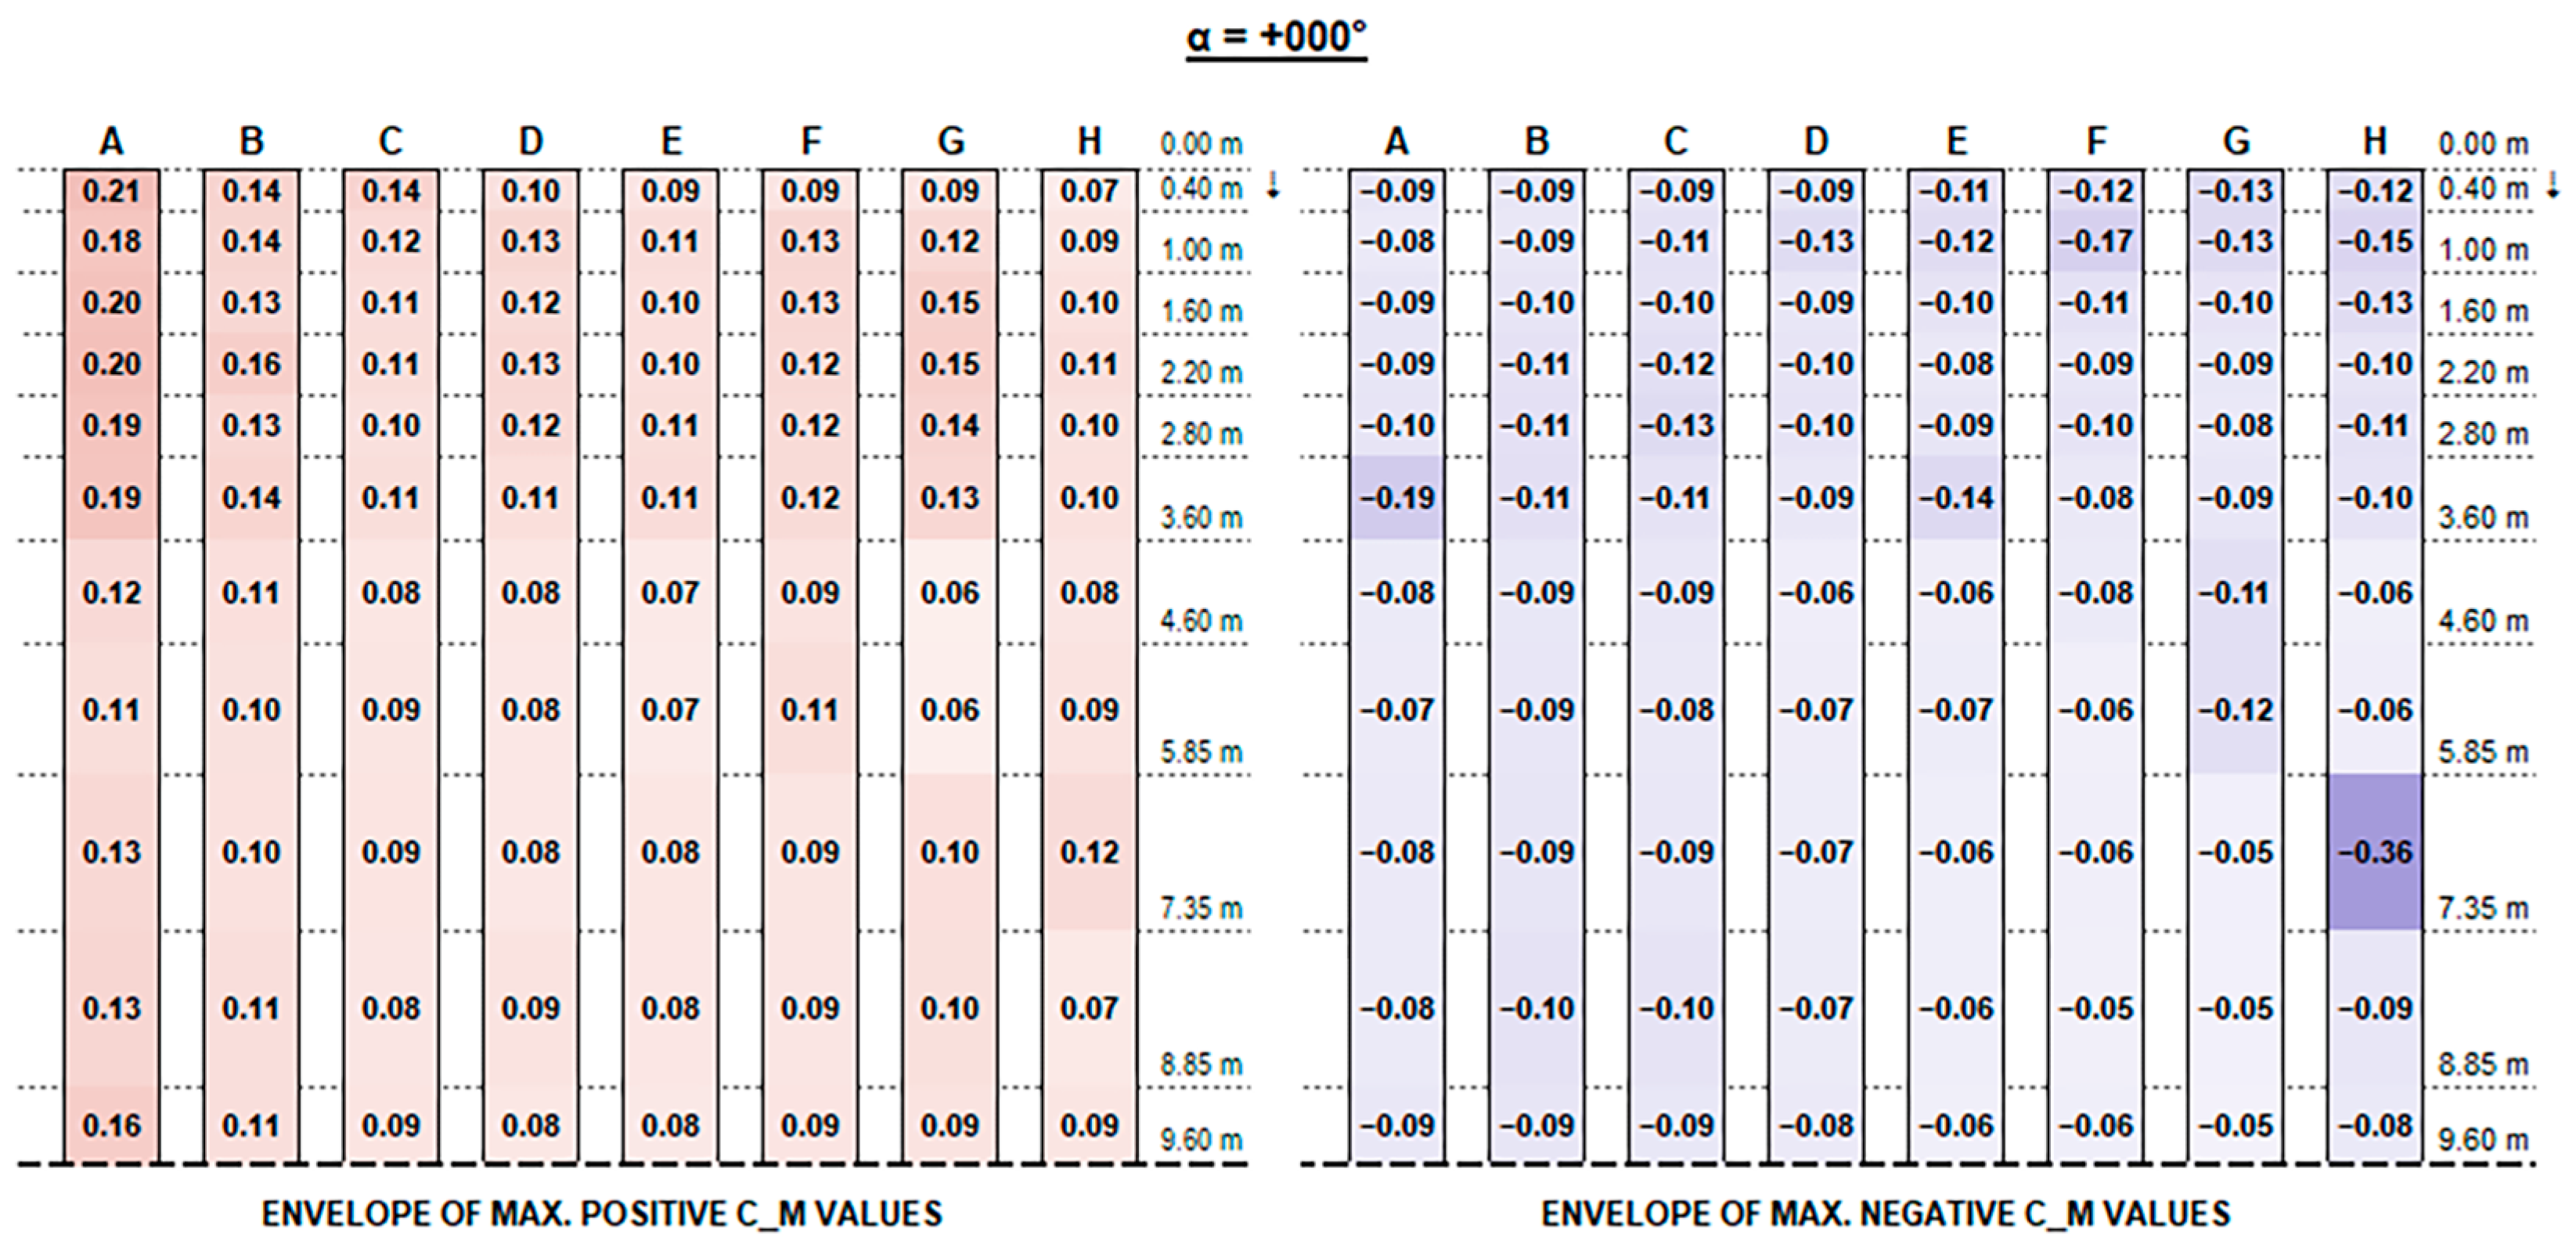
The envelopes of corrected positive and negative C
F (normalised force resultants) and C
M (normalised moment resultants) are plotted in
Figure A1,
Figure A2,
Figure A3,
Figure A4,
Figure A5,
Figure A6,
Figure A7,
Figure A8,
Figure A9,
Figure A10,
Figure A11,
Figure A12,
Figure A13,
Figure A14,
Figure A15 and
Figure A16 of
Appendix A, for each configuration ID, where strings are depicted with reference to the identification in
Figure 9, and the dotted line at the bottom of each picture represents the mid-string symmetry line.
Actual forces and moments may be derived for each row and each section by multiplying plotted values by the reference wind pressure provided by standards [
18] or, if available, environmental data logs.
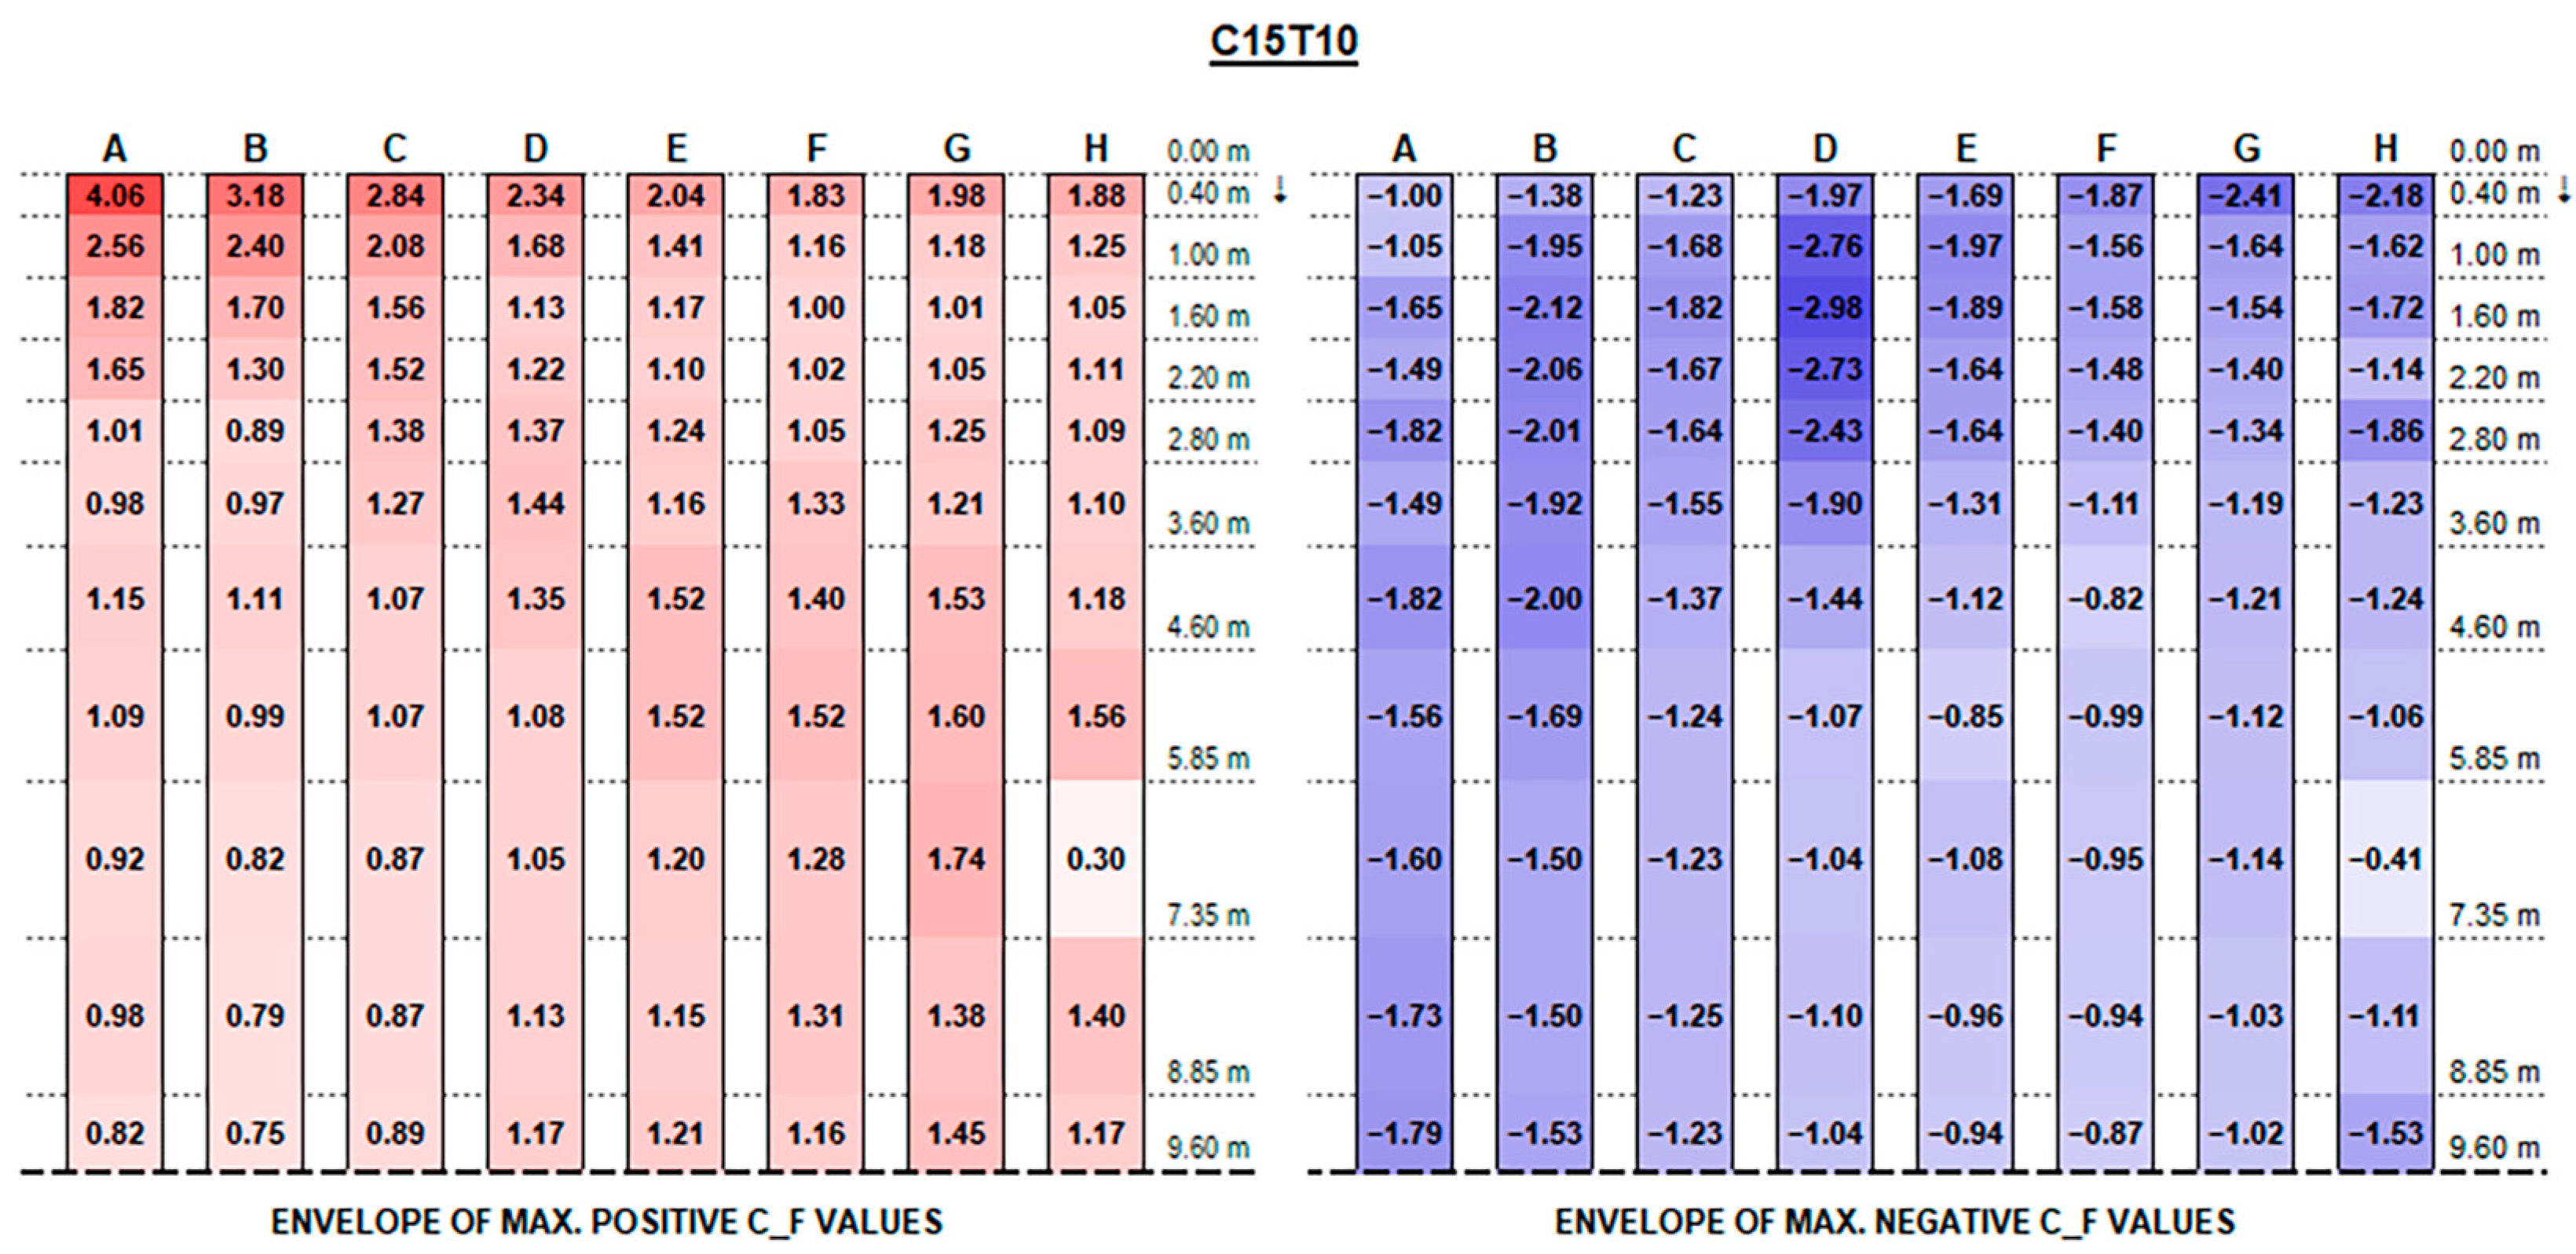
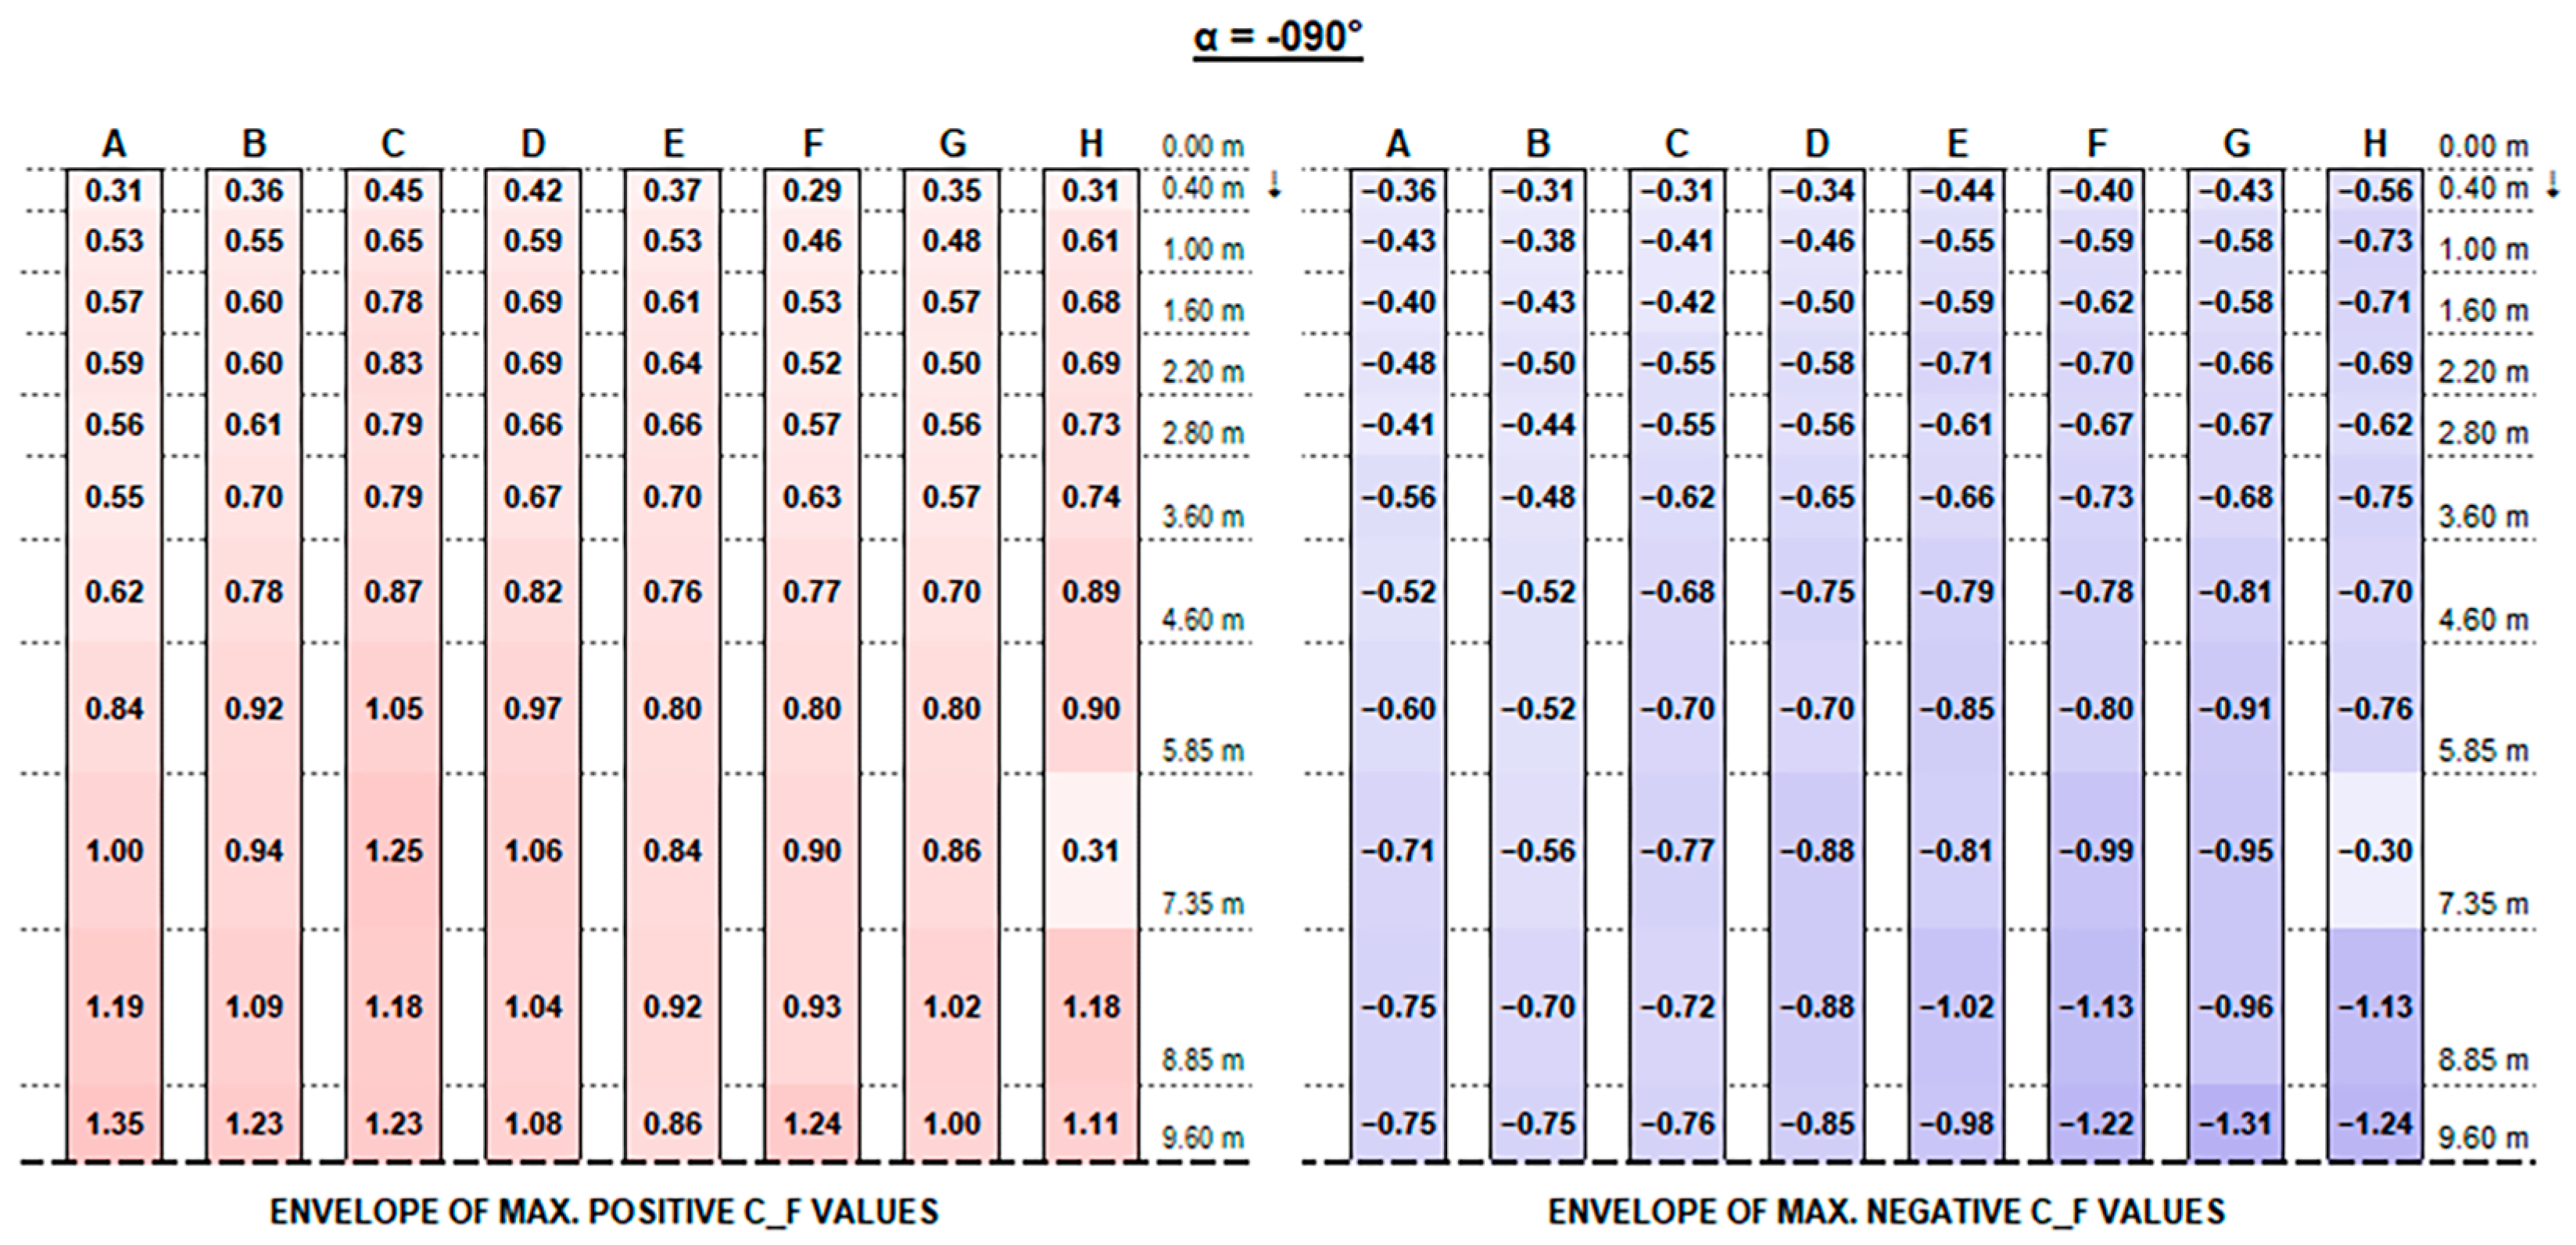
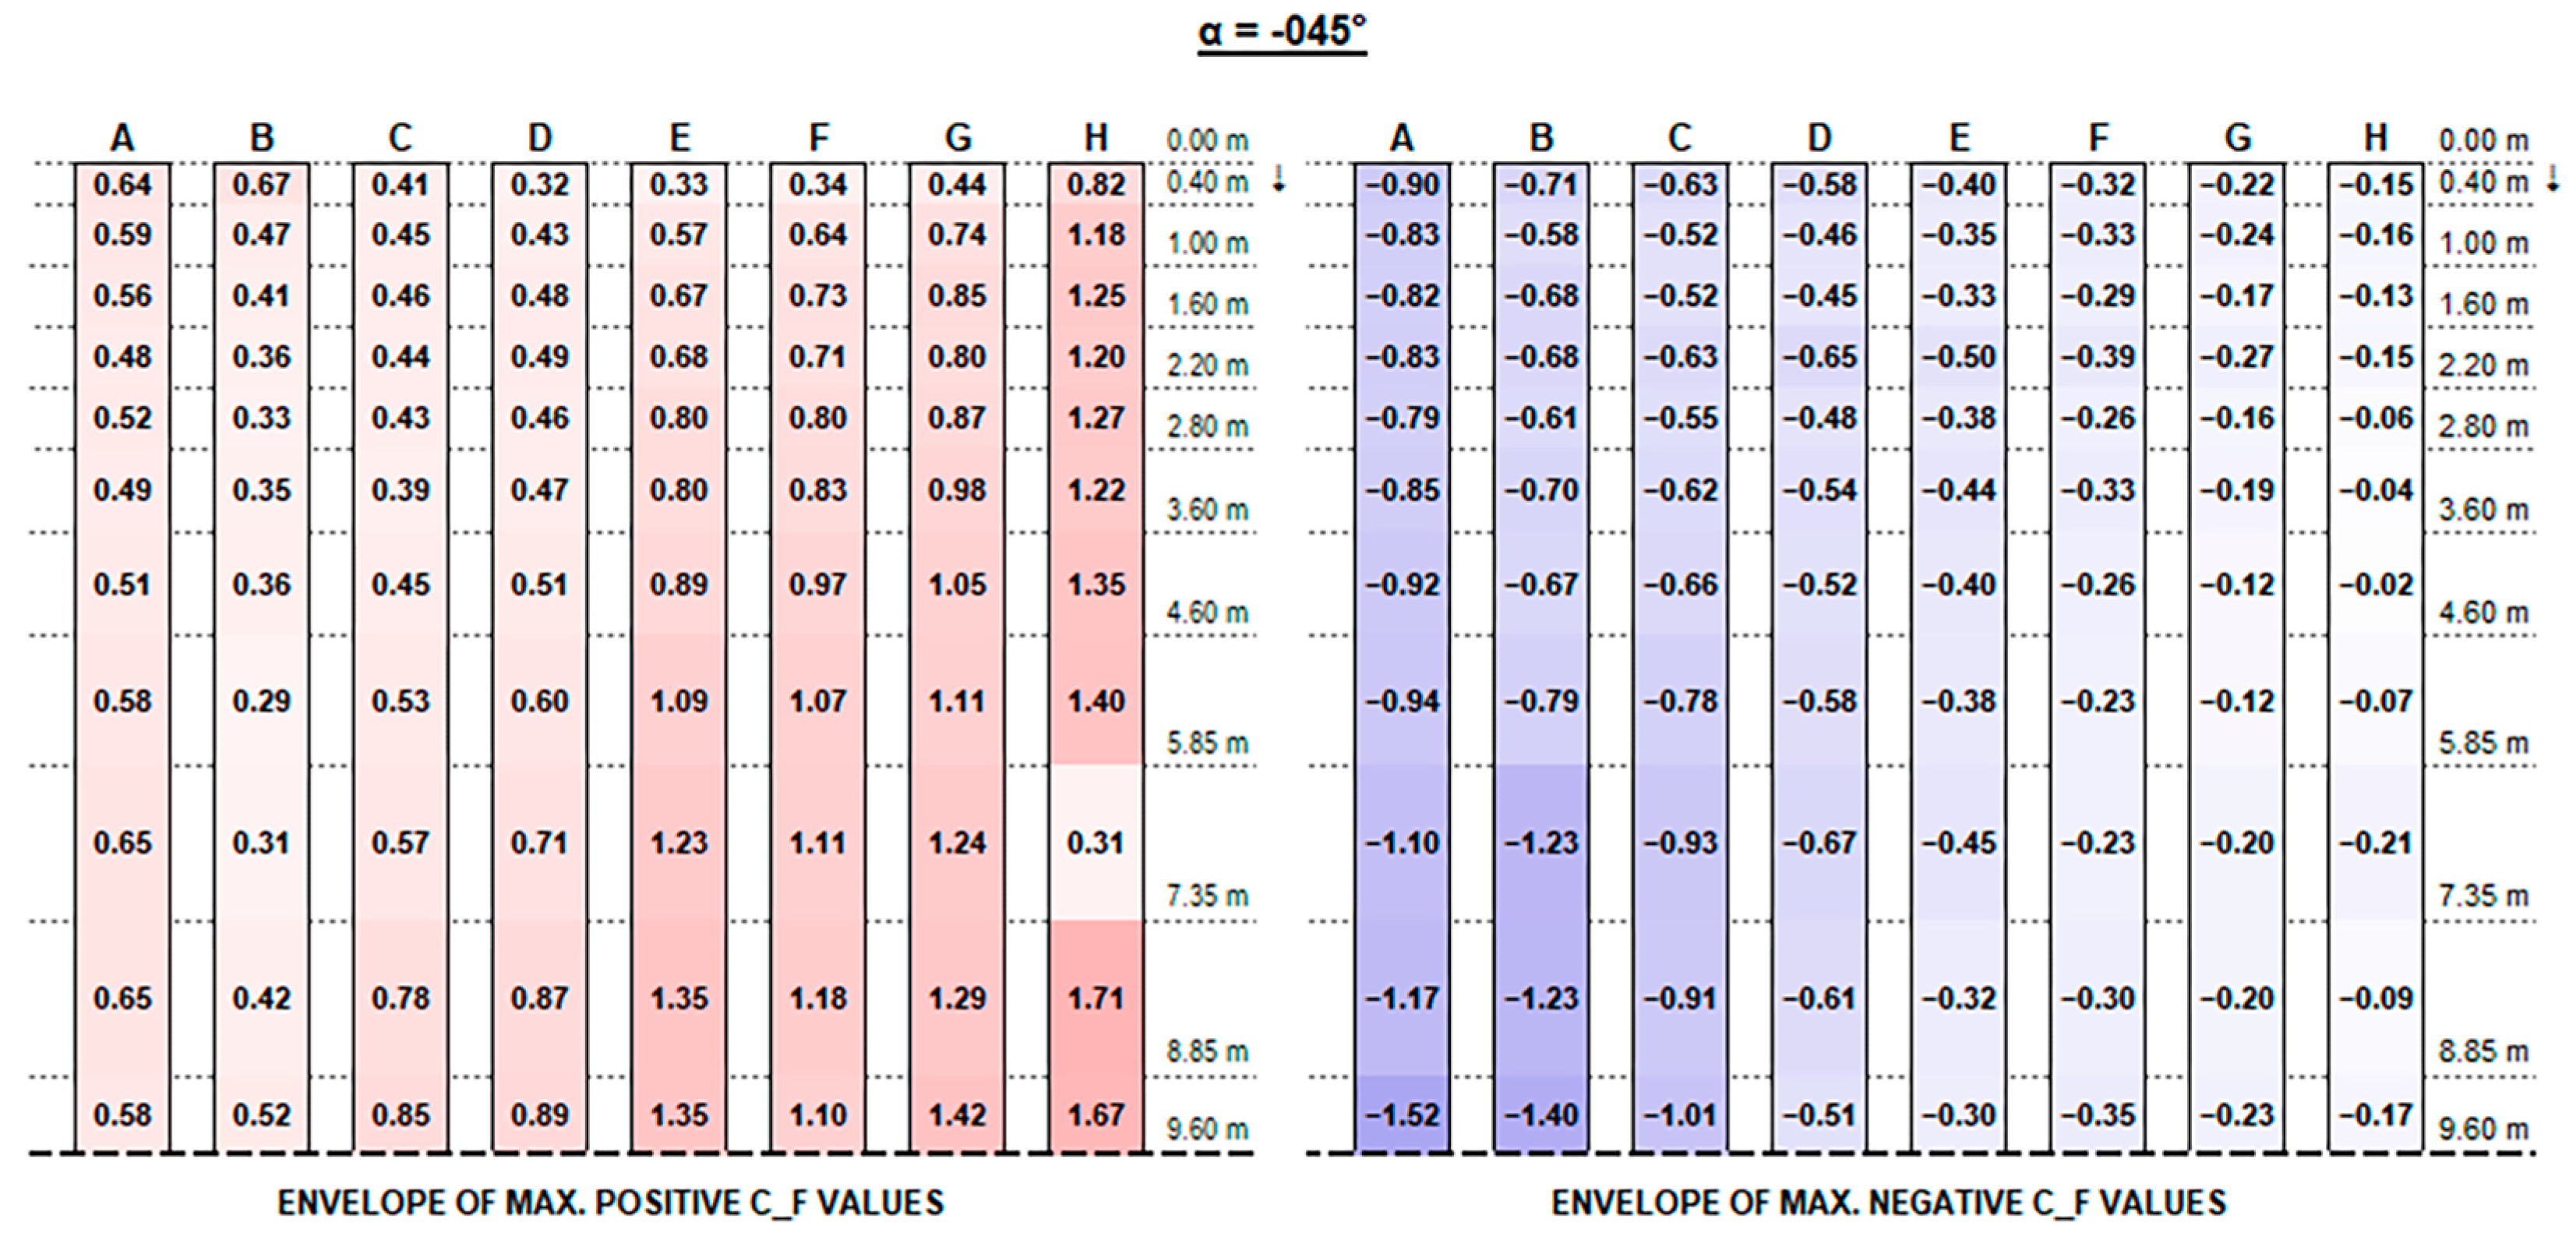
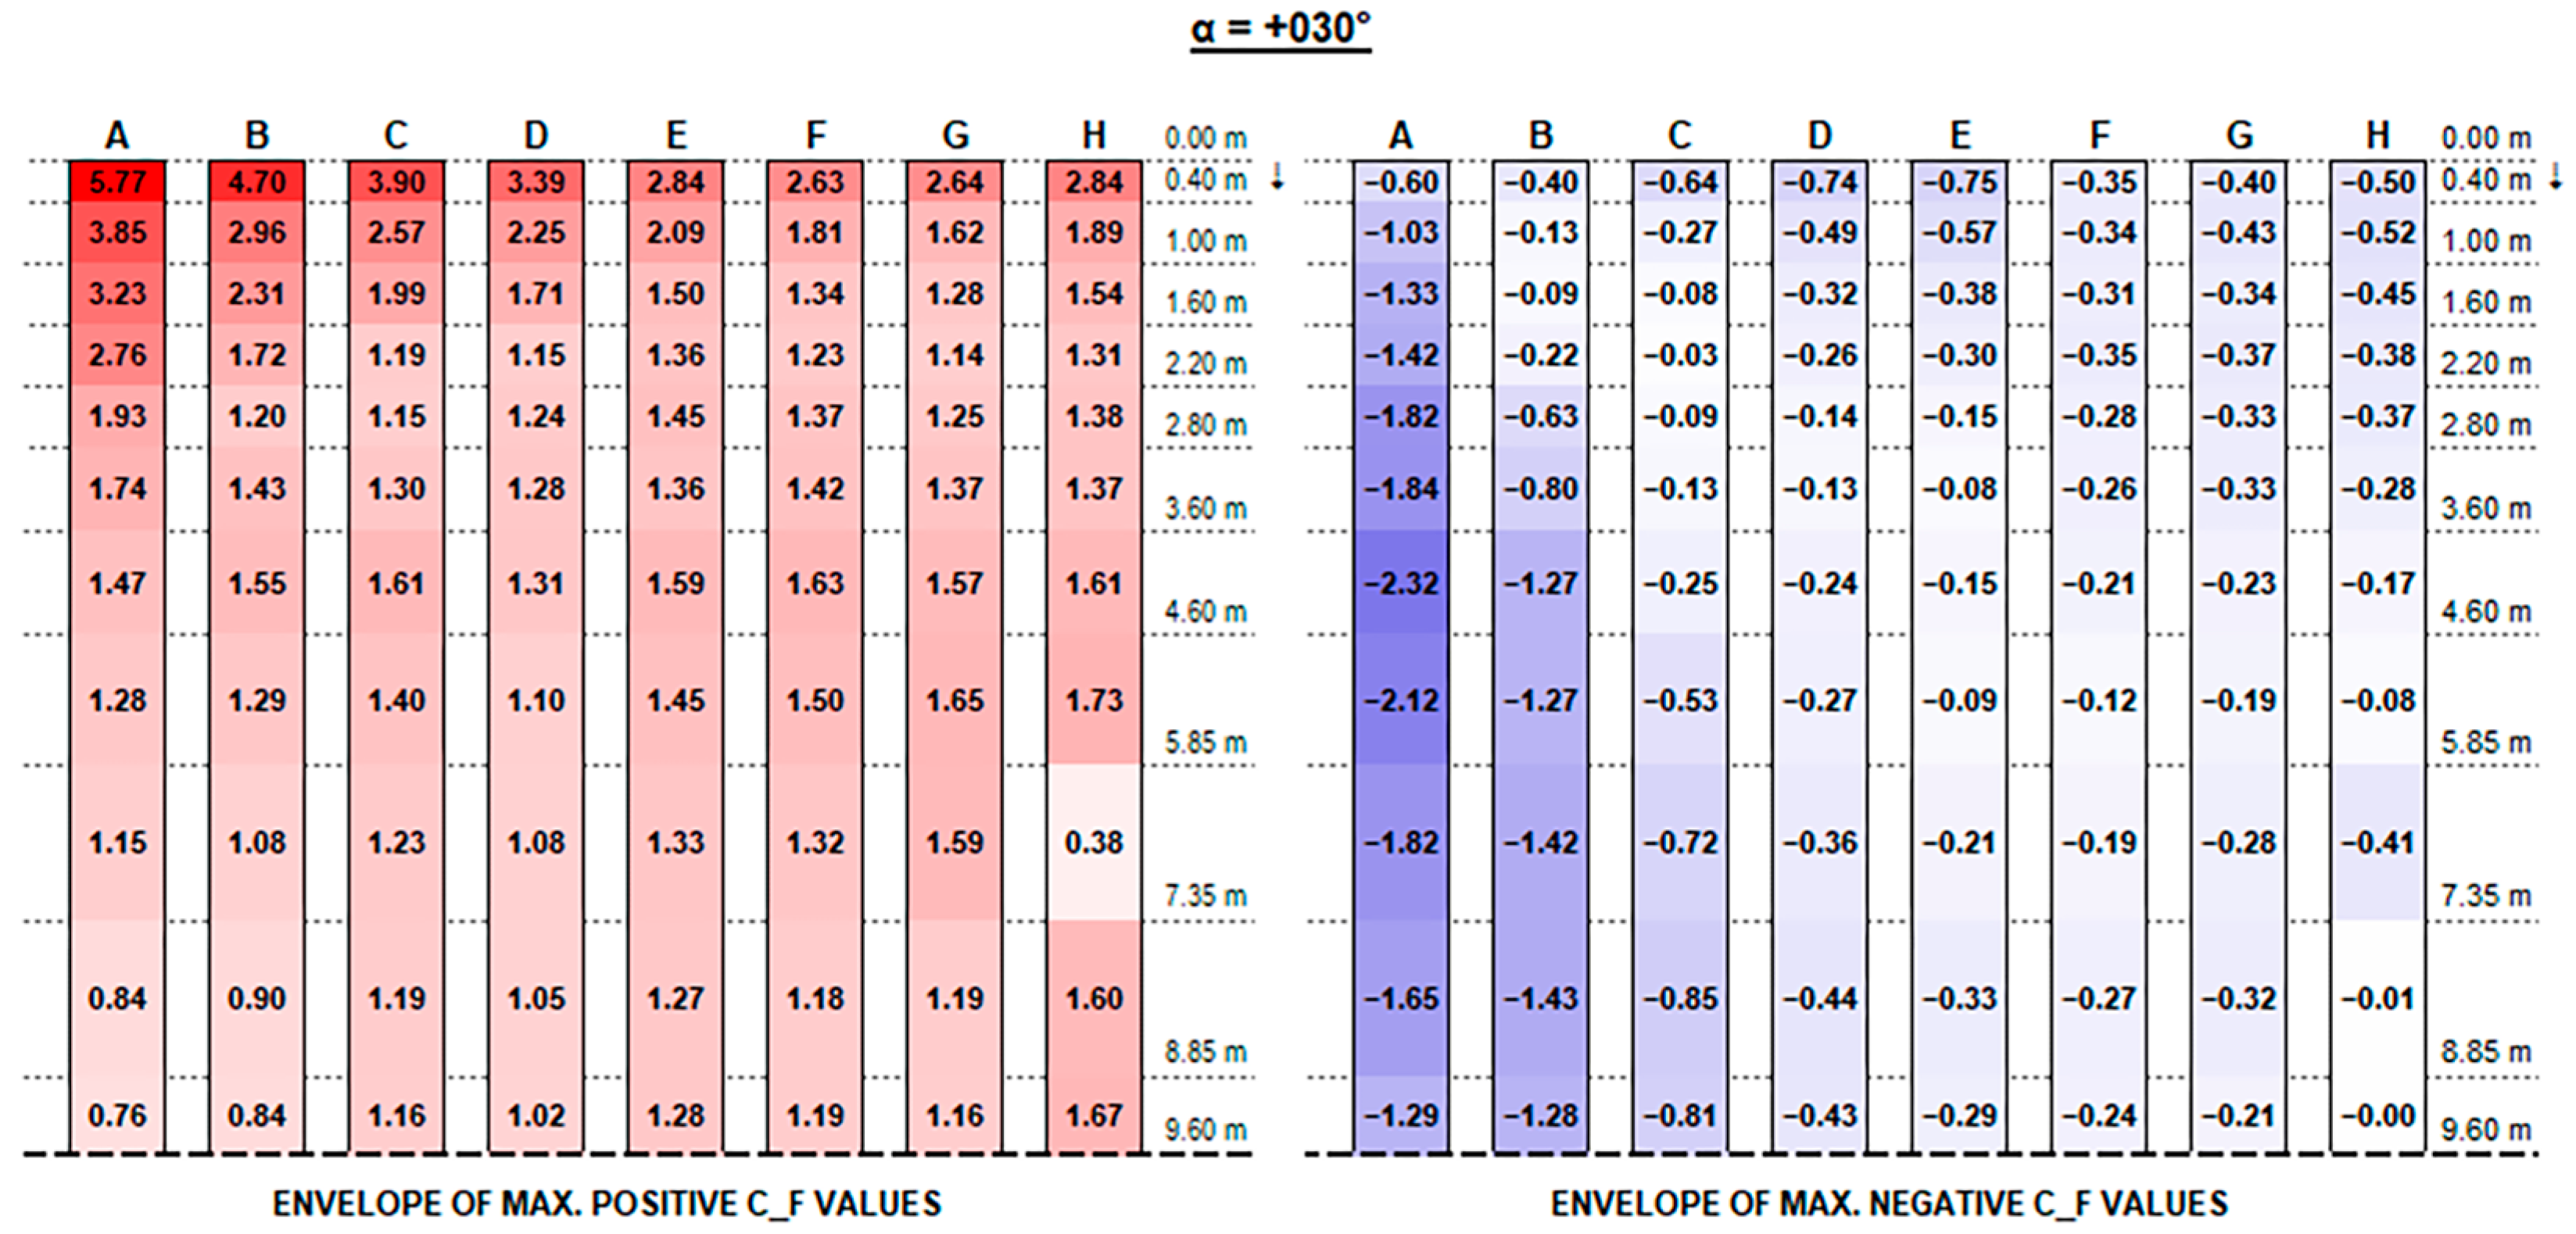
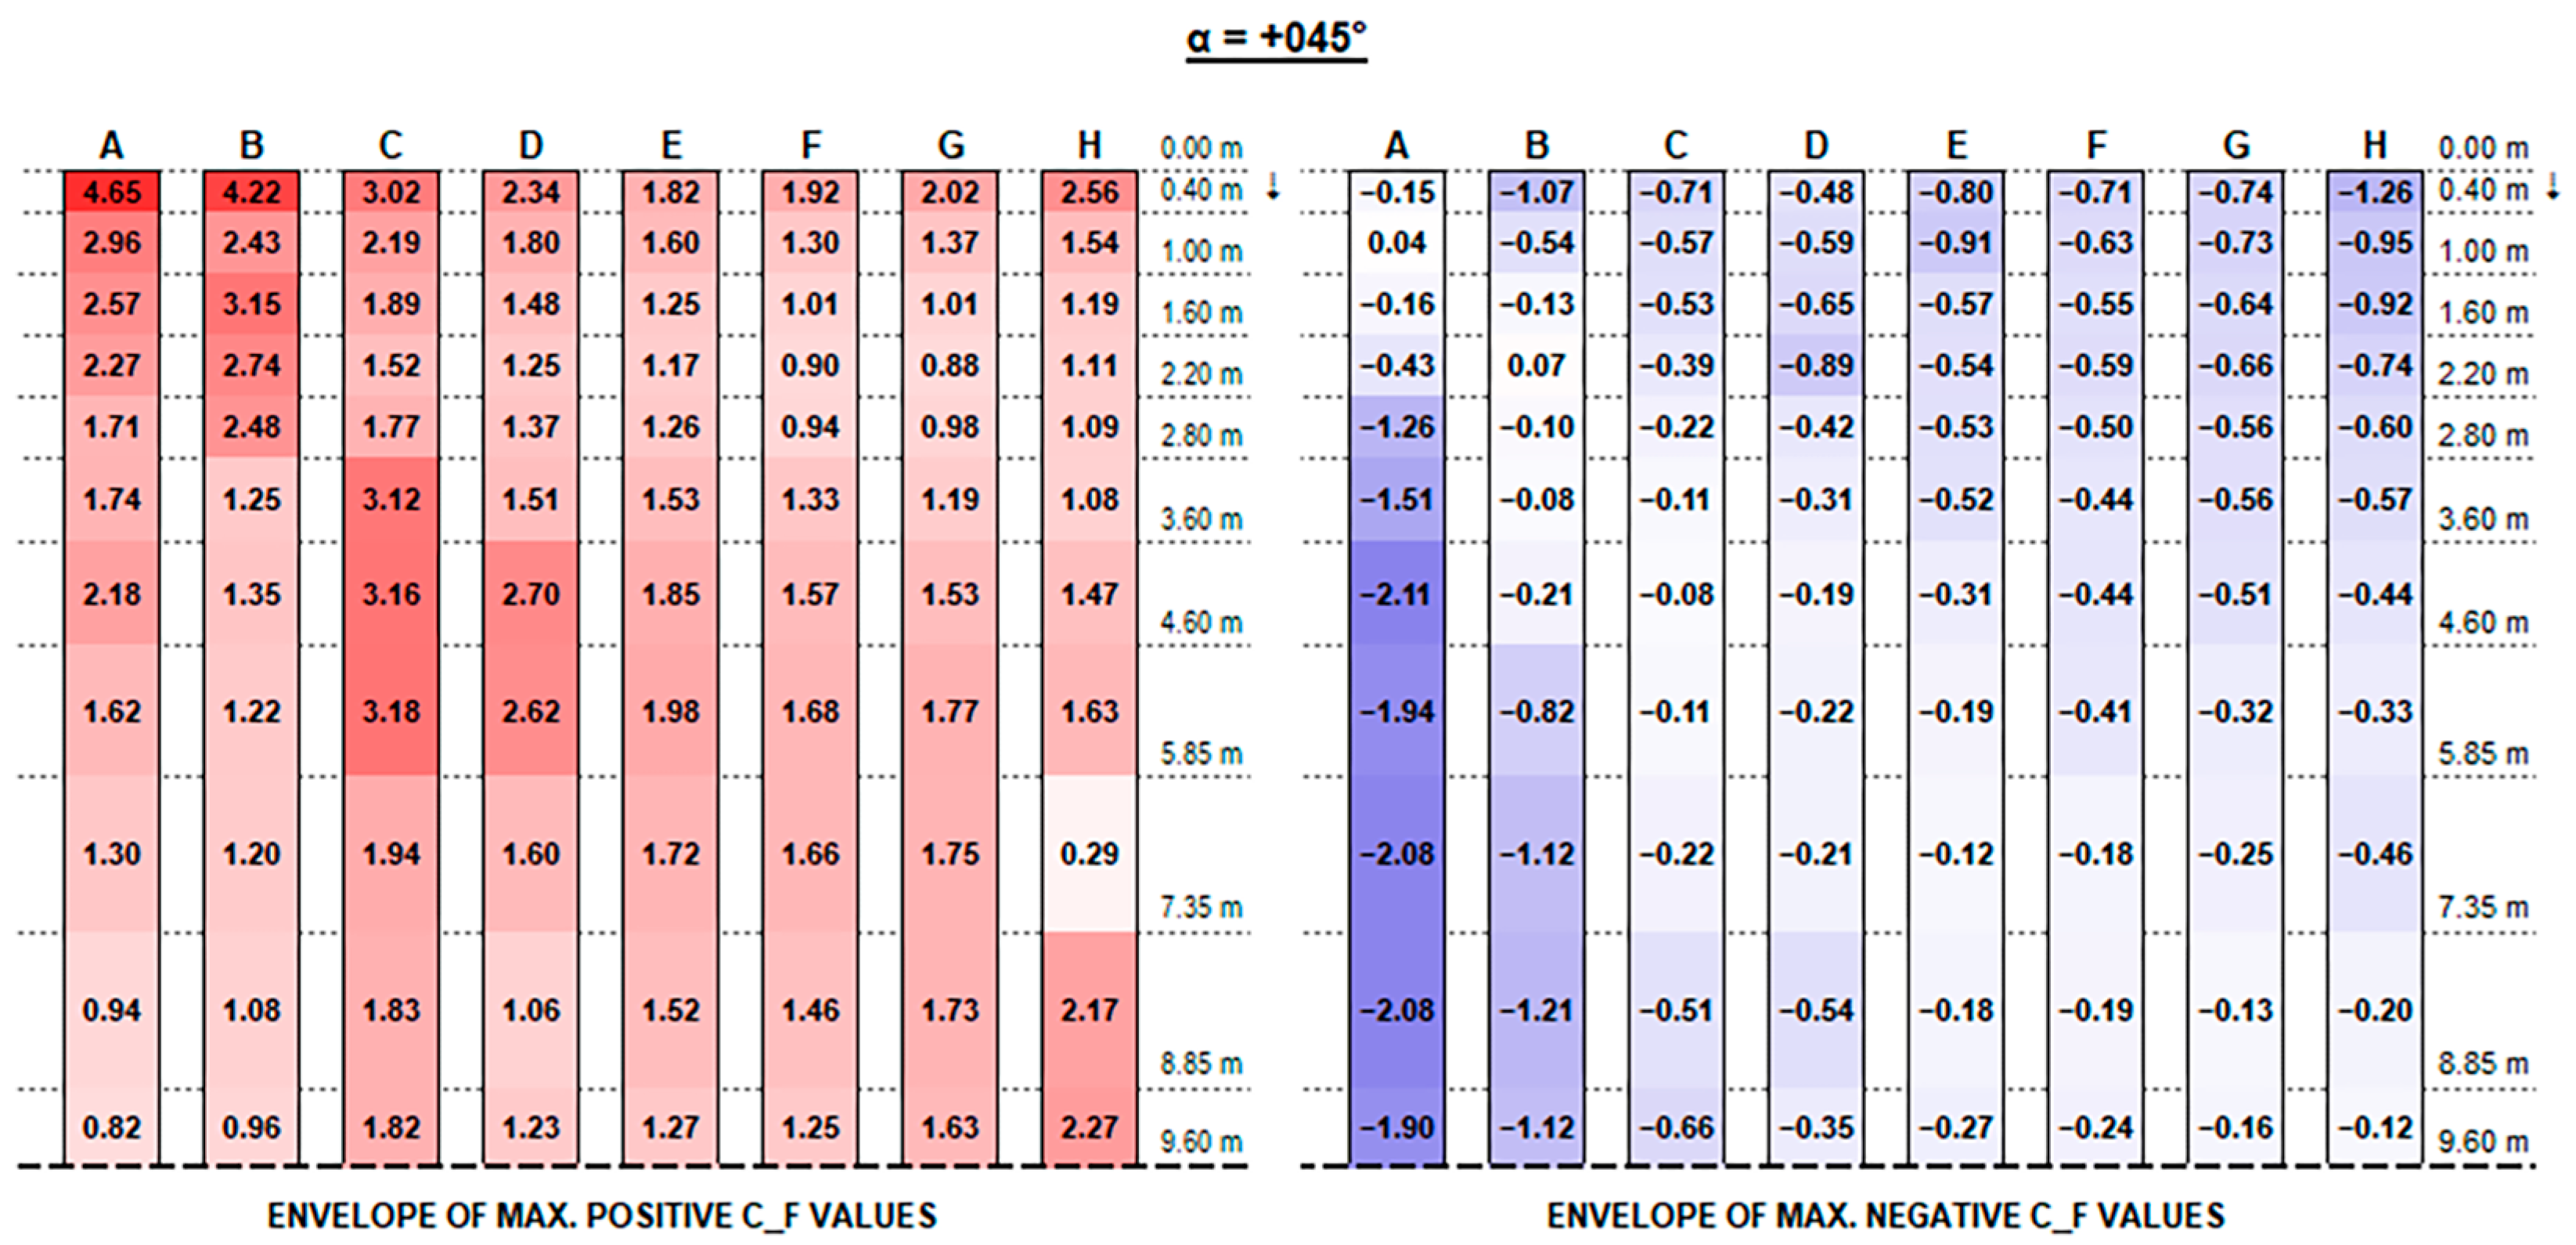
Referring to the sign convention in
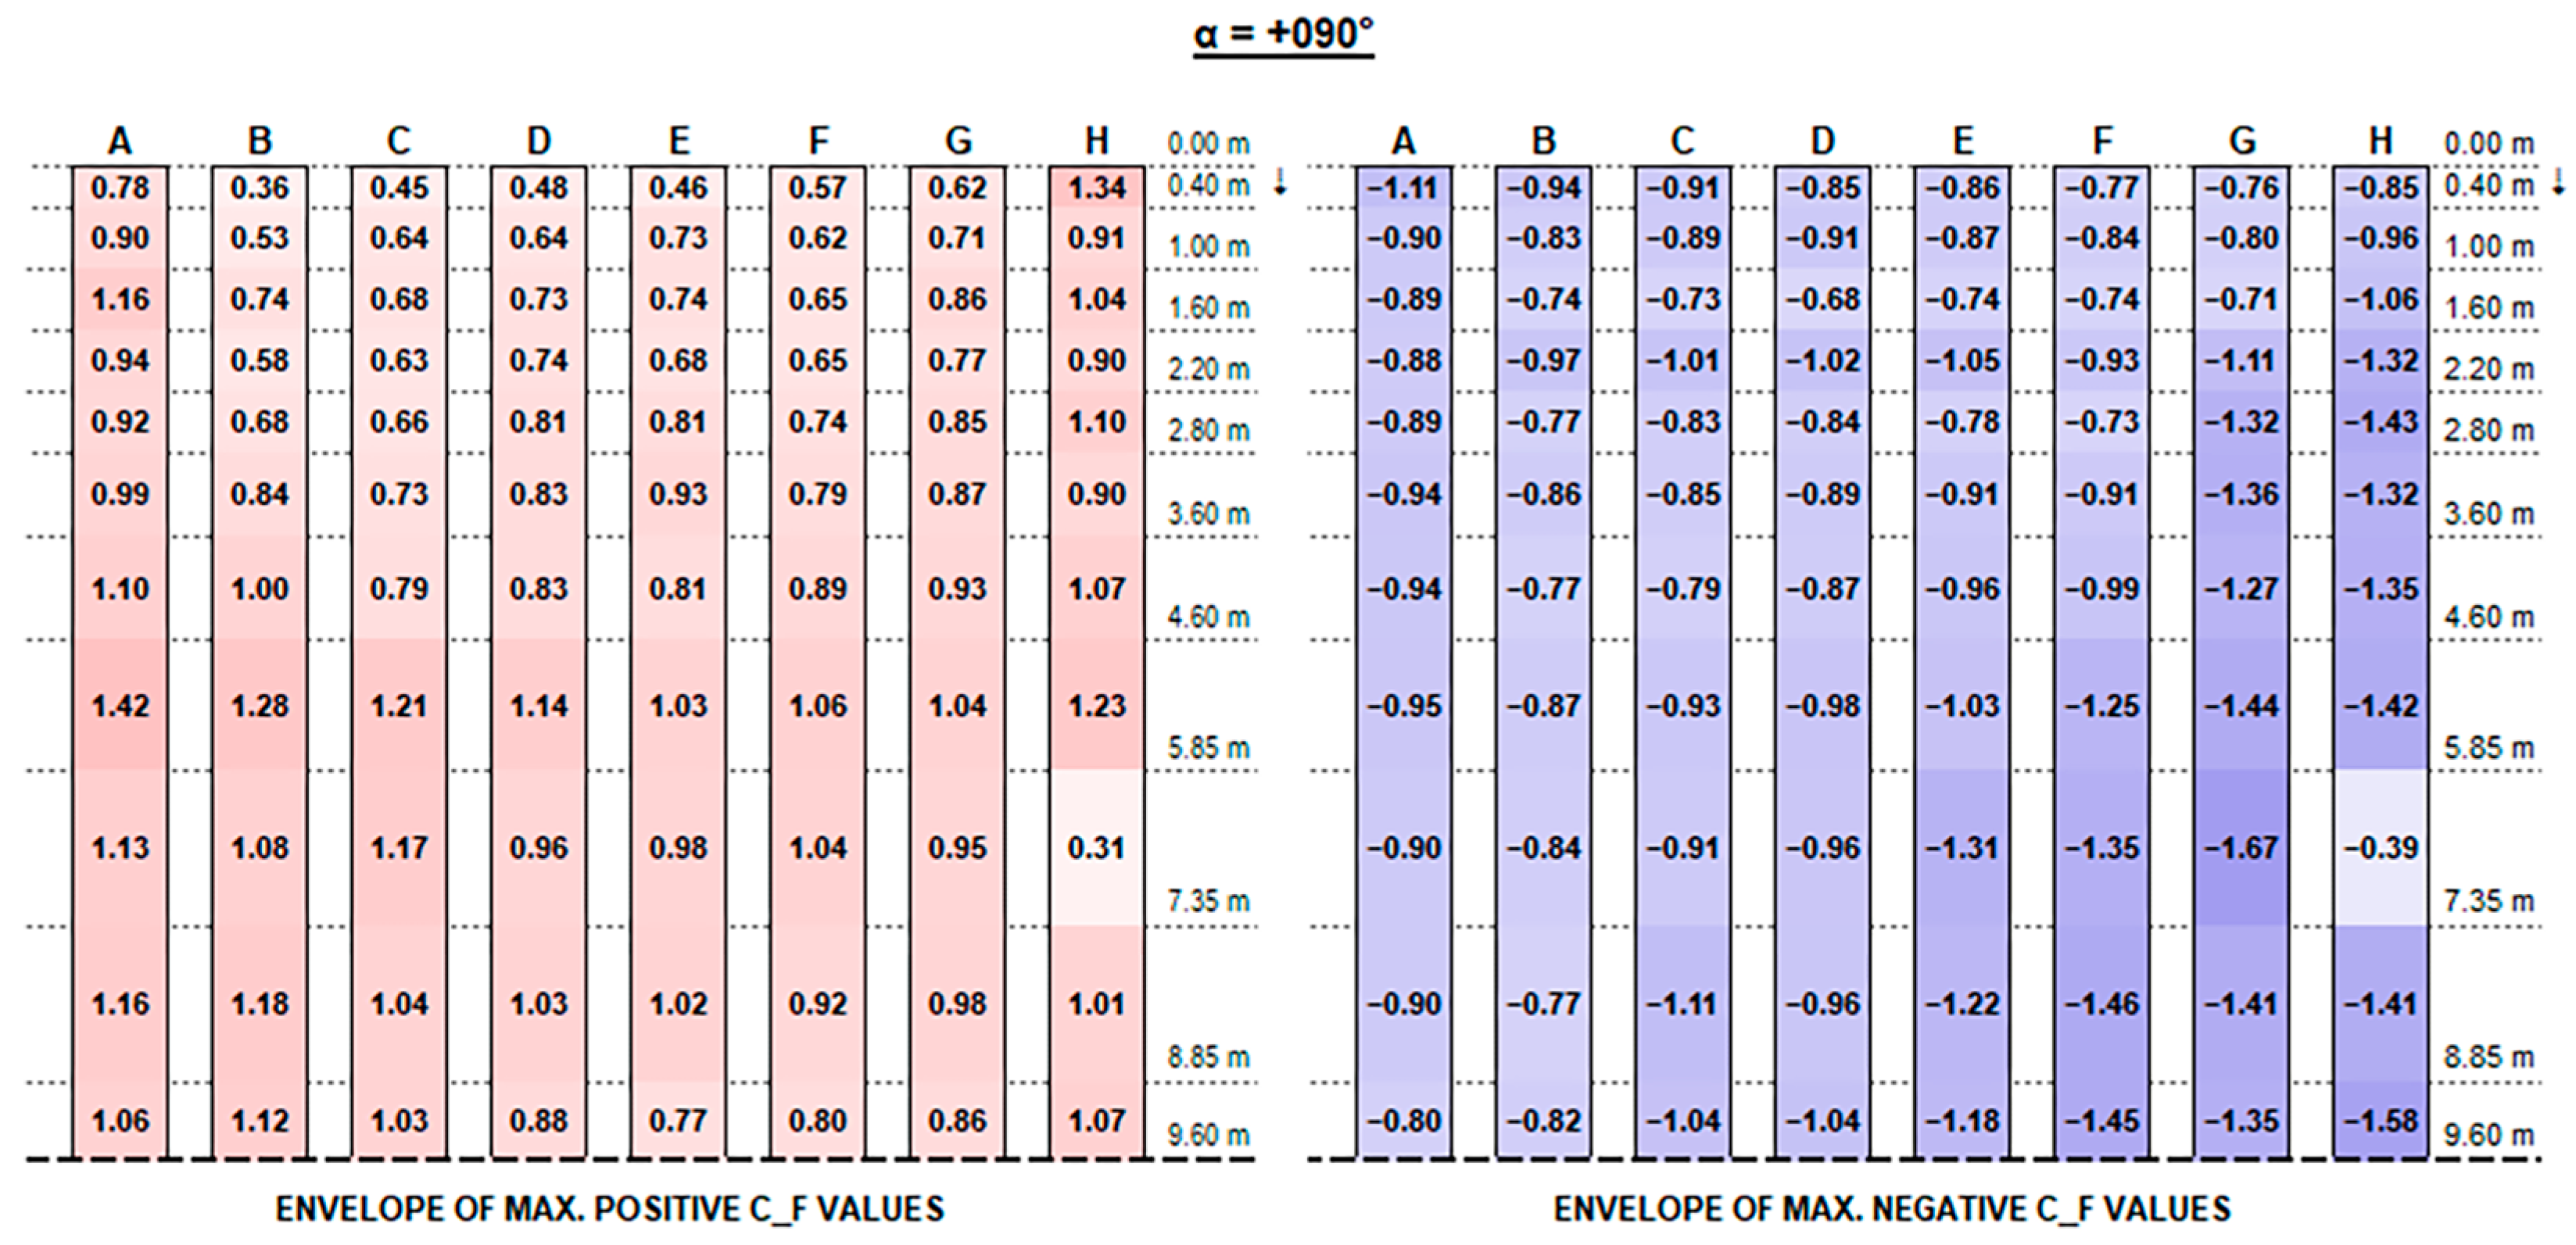
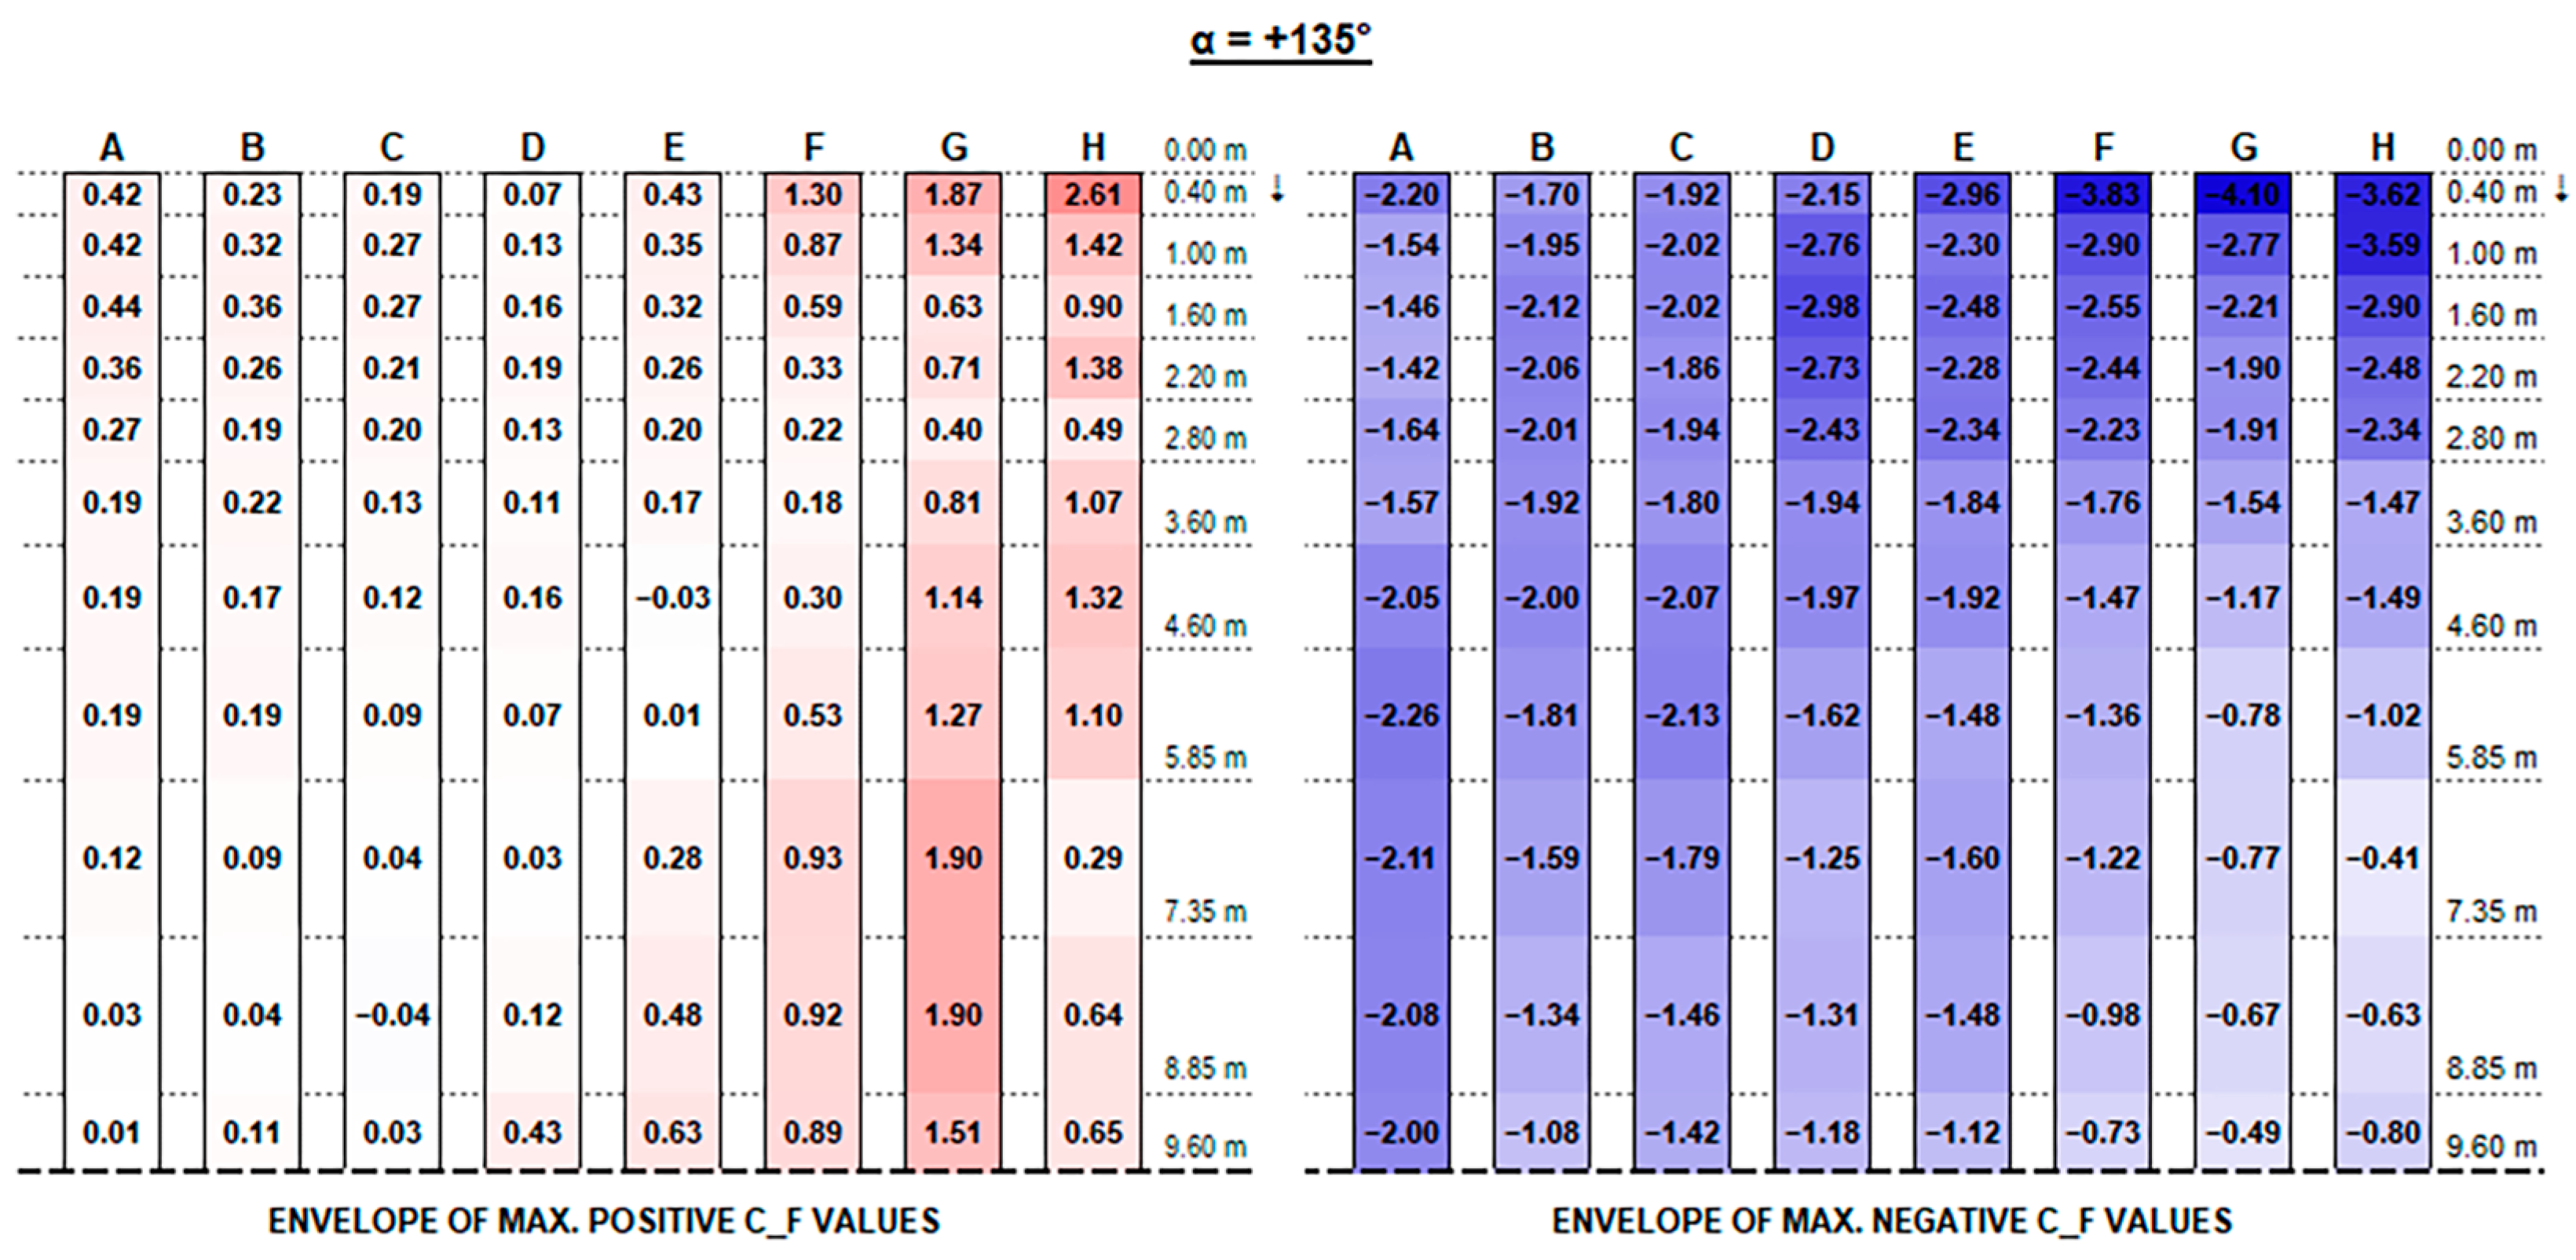
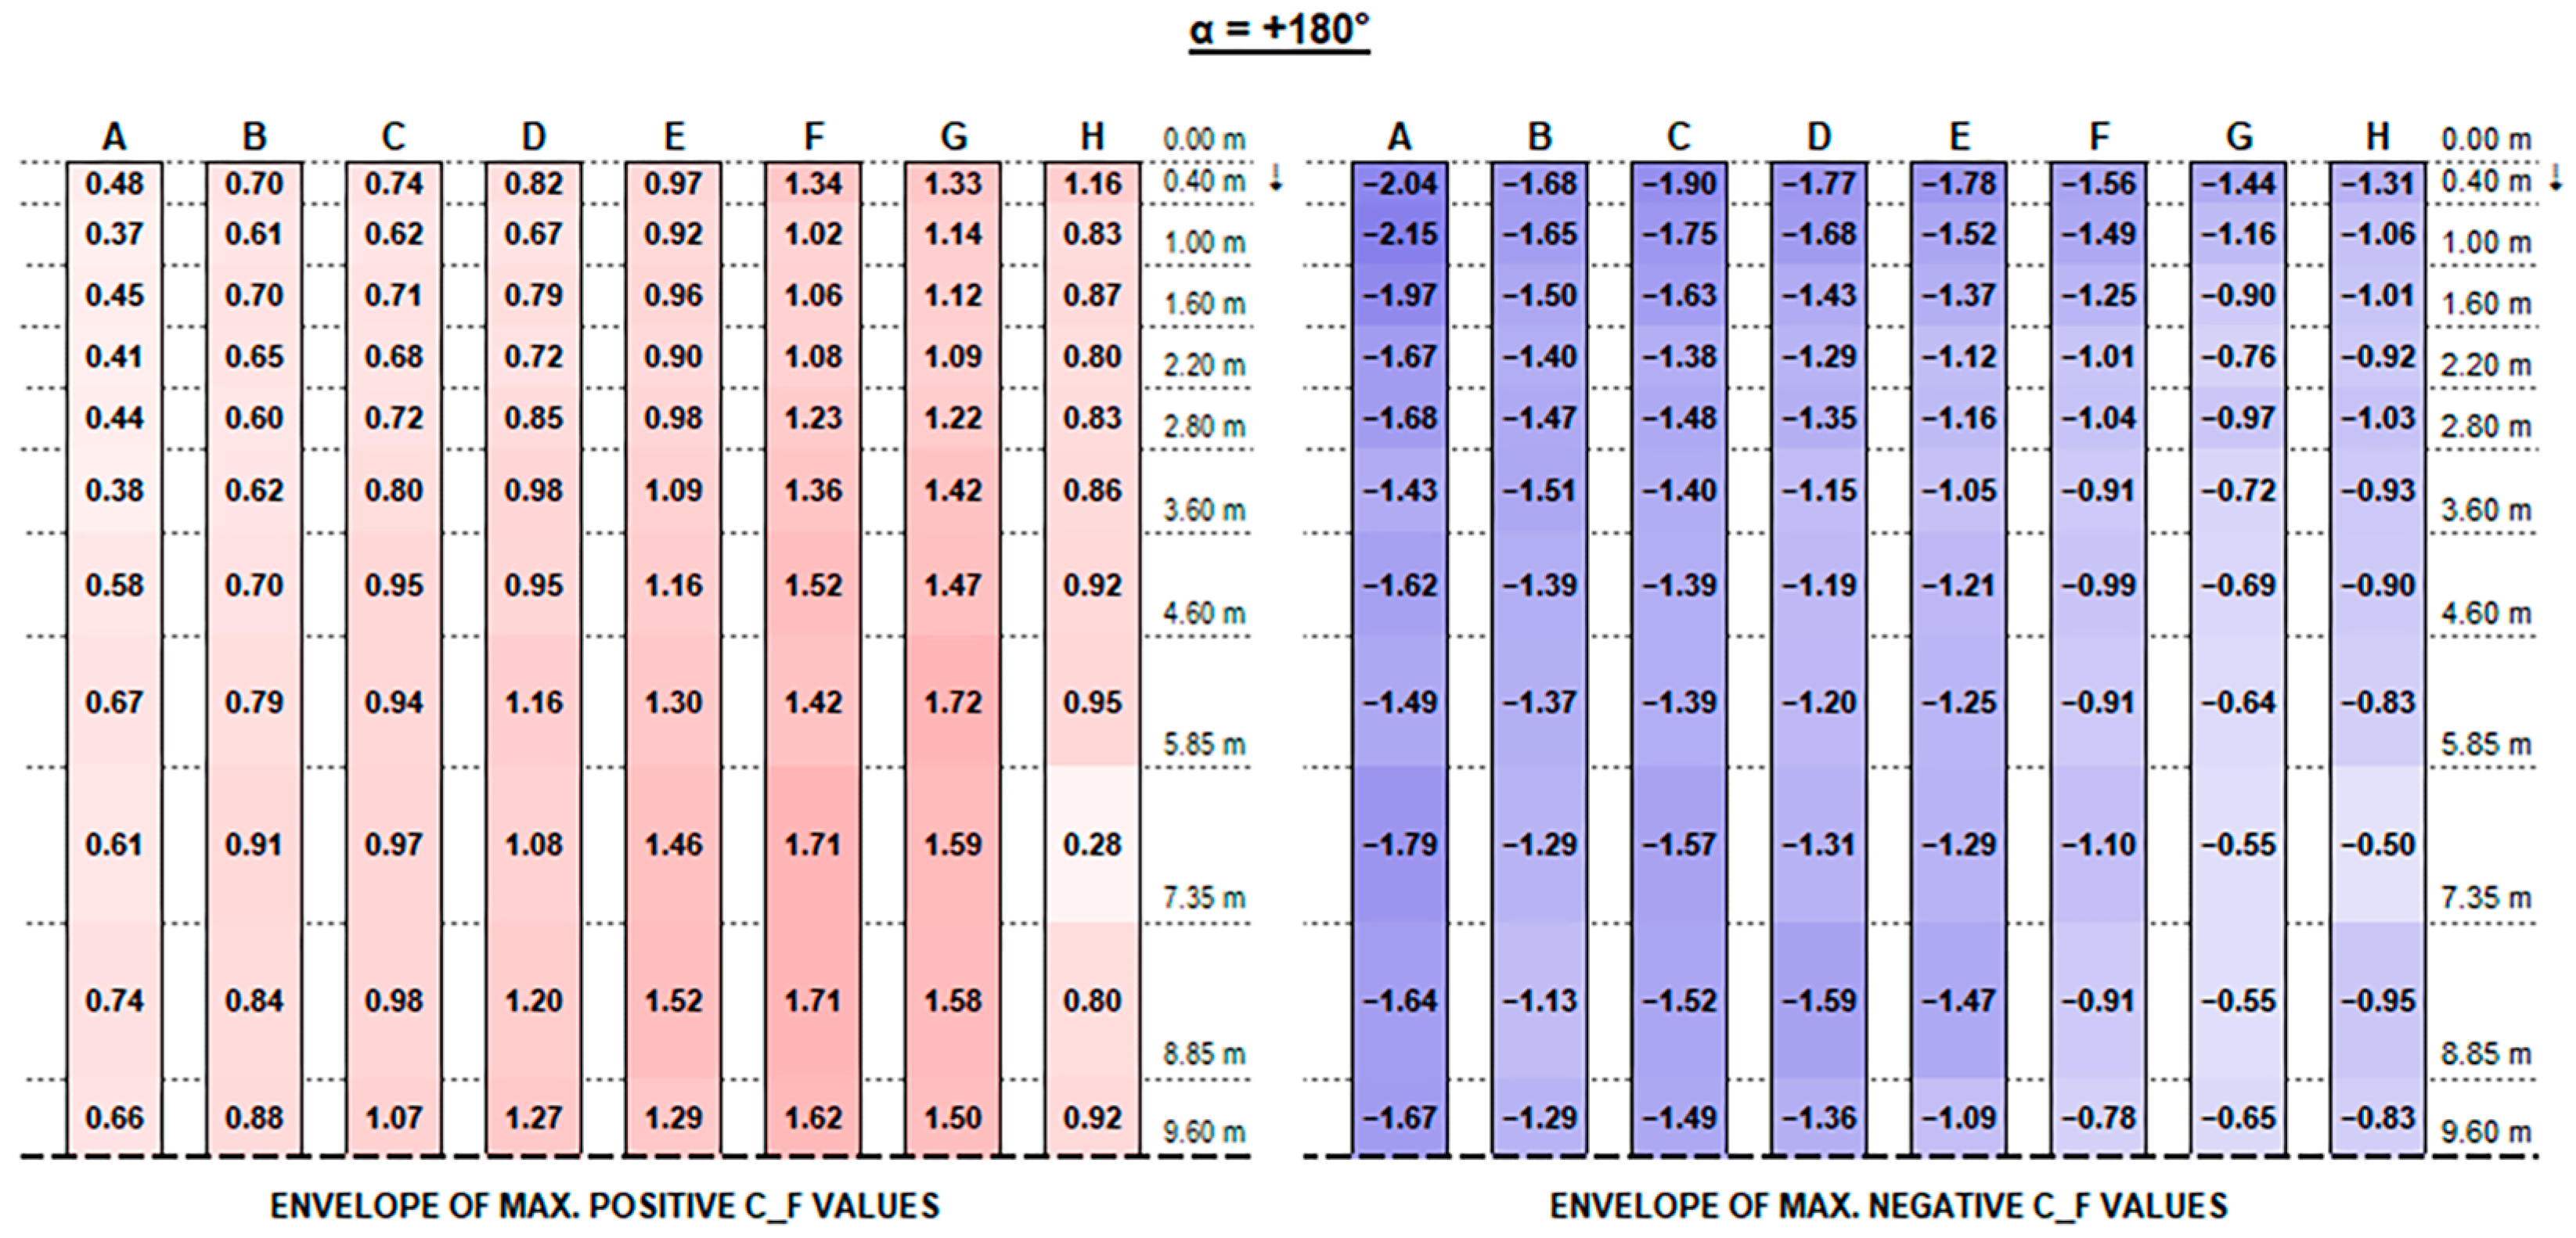
Figure 10, C
F positive peak values at strings’ free ends decrease, moving from the front row to the back rows (referring to the first string as the one upwind for a 0° wind exposure), presenting maximum peaks in proximity to the free end of each string which increase with the tilt angle and reach up to 4.90 and 5.77, respectively, for the 0.15 m and 0.30 m clearance configurations.
Instead, negative CF values at the strings’ extreme edge increase from the first row to the last ones, especially with higher tilt angles. Negative peaks are (in terms of absolute value) 30% lower, at least, than the positive ones in the same section, reaching −4.10 for 0.15 m and −3.83 for 0.30 m clearance.
In this respect, a higher clearance results in a reduction in upward forces, while presenting higher downward peak actions.
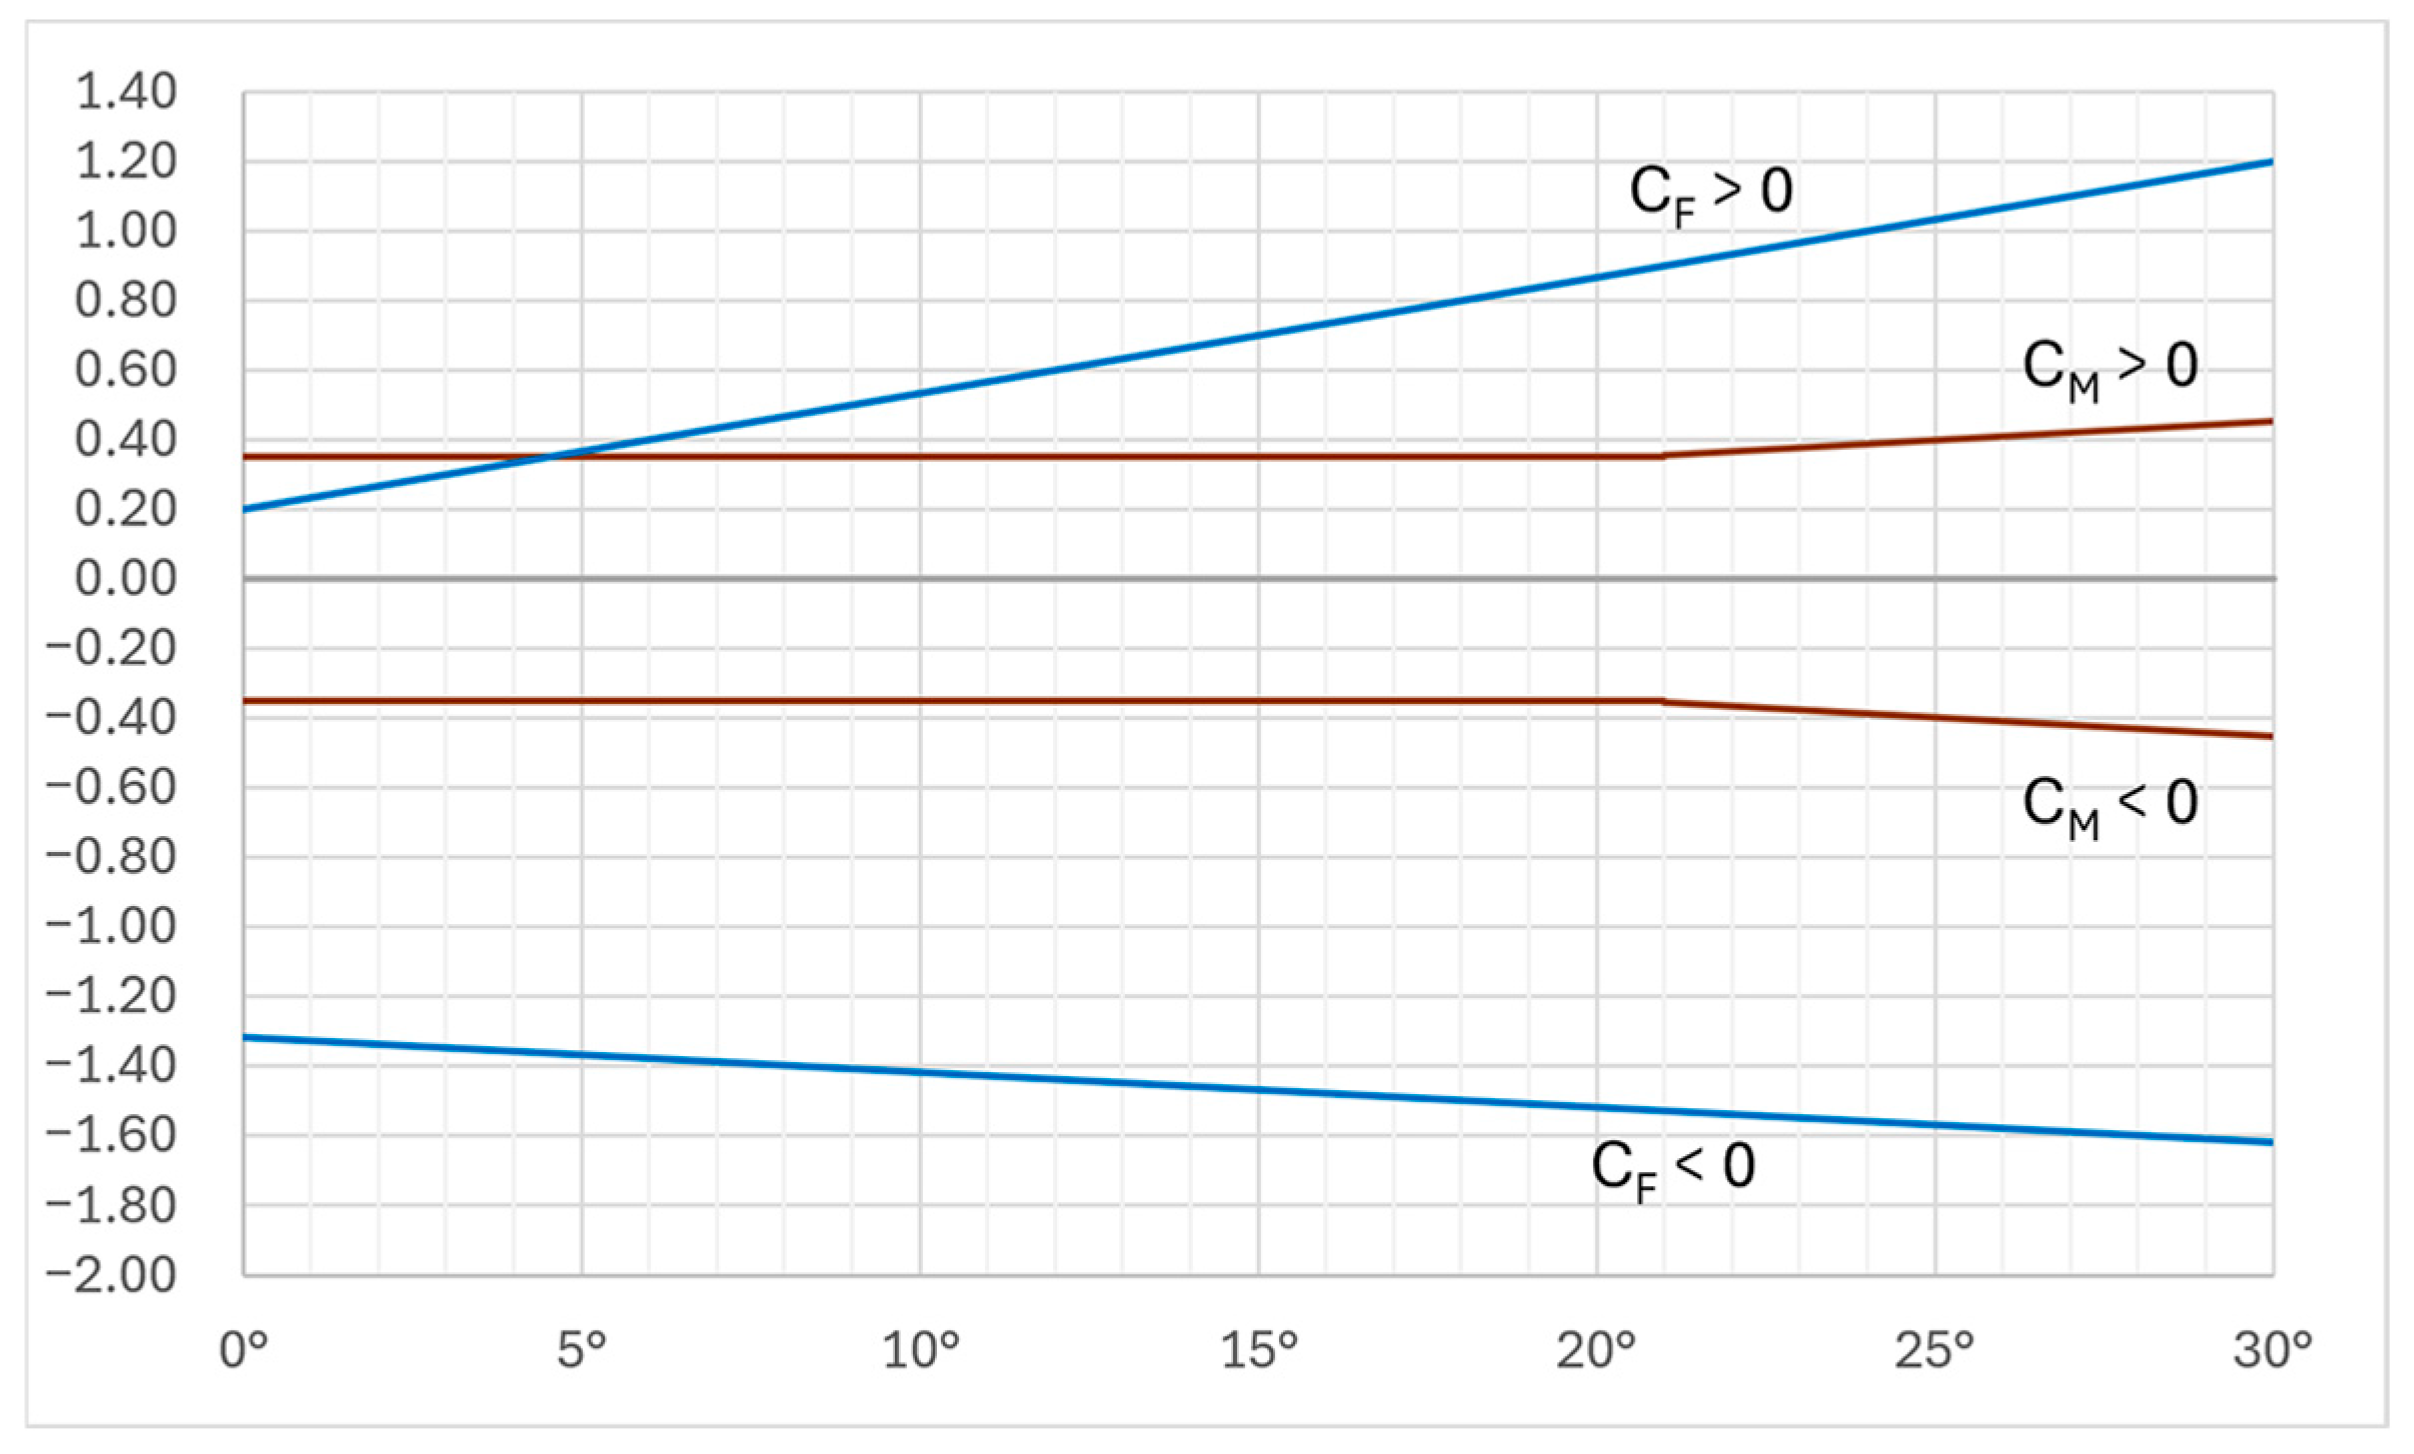
Both positive and negative C
F peaks at the very ends dissipate and tend to semi-constant values within a few metres towards the string midpoint. Such values are generally greater by those provided by Eurocode 1 (see
Figure 11) by 50 to 300% for positive (downward) forces and by 10 to 50% for negative (upward) forces.
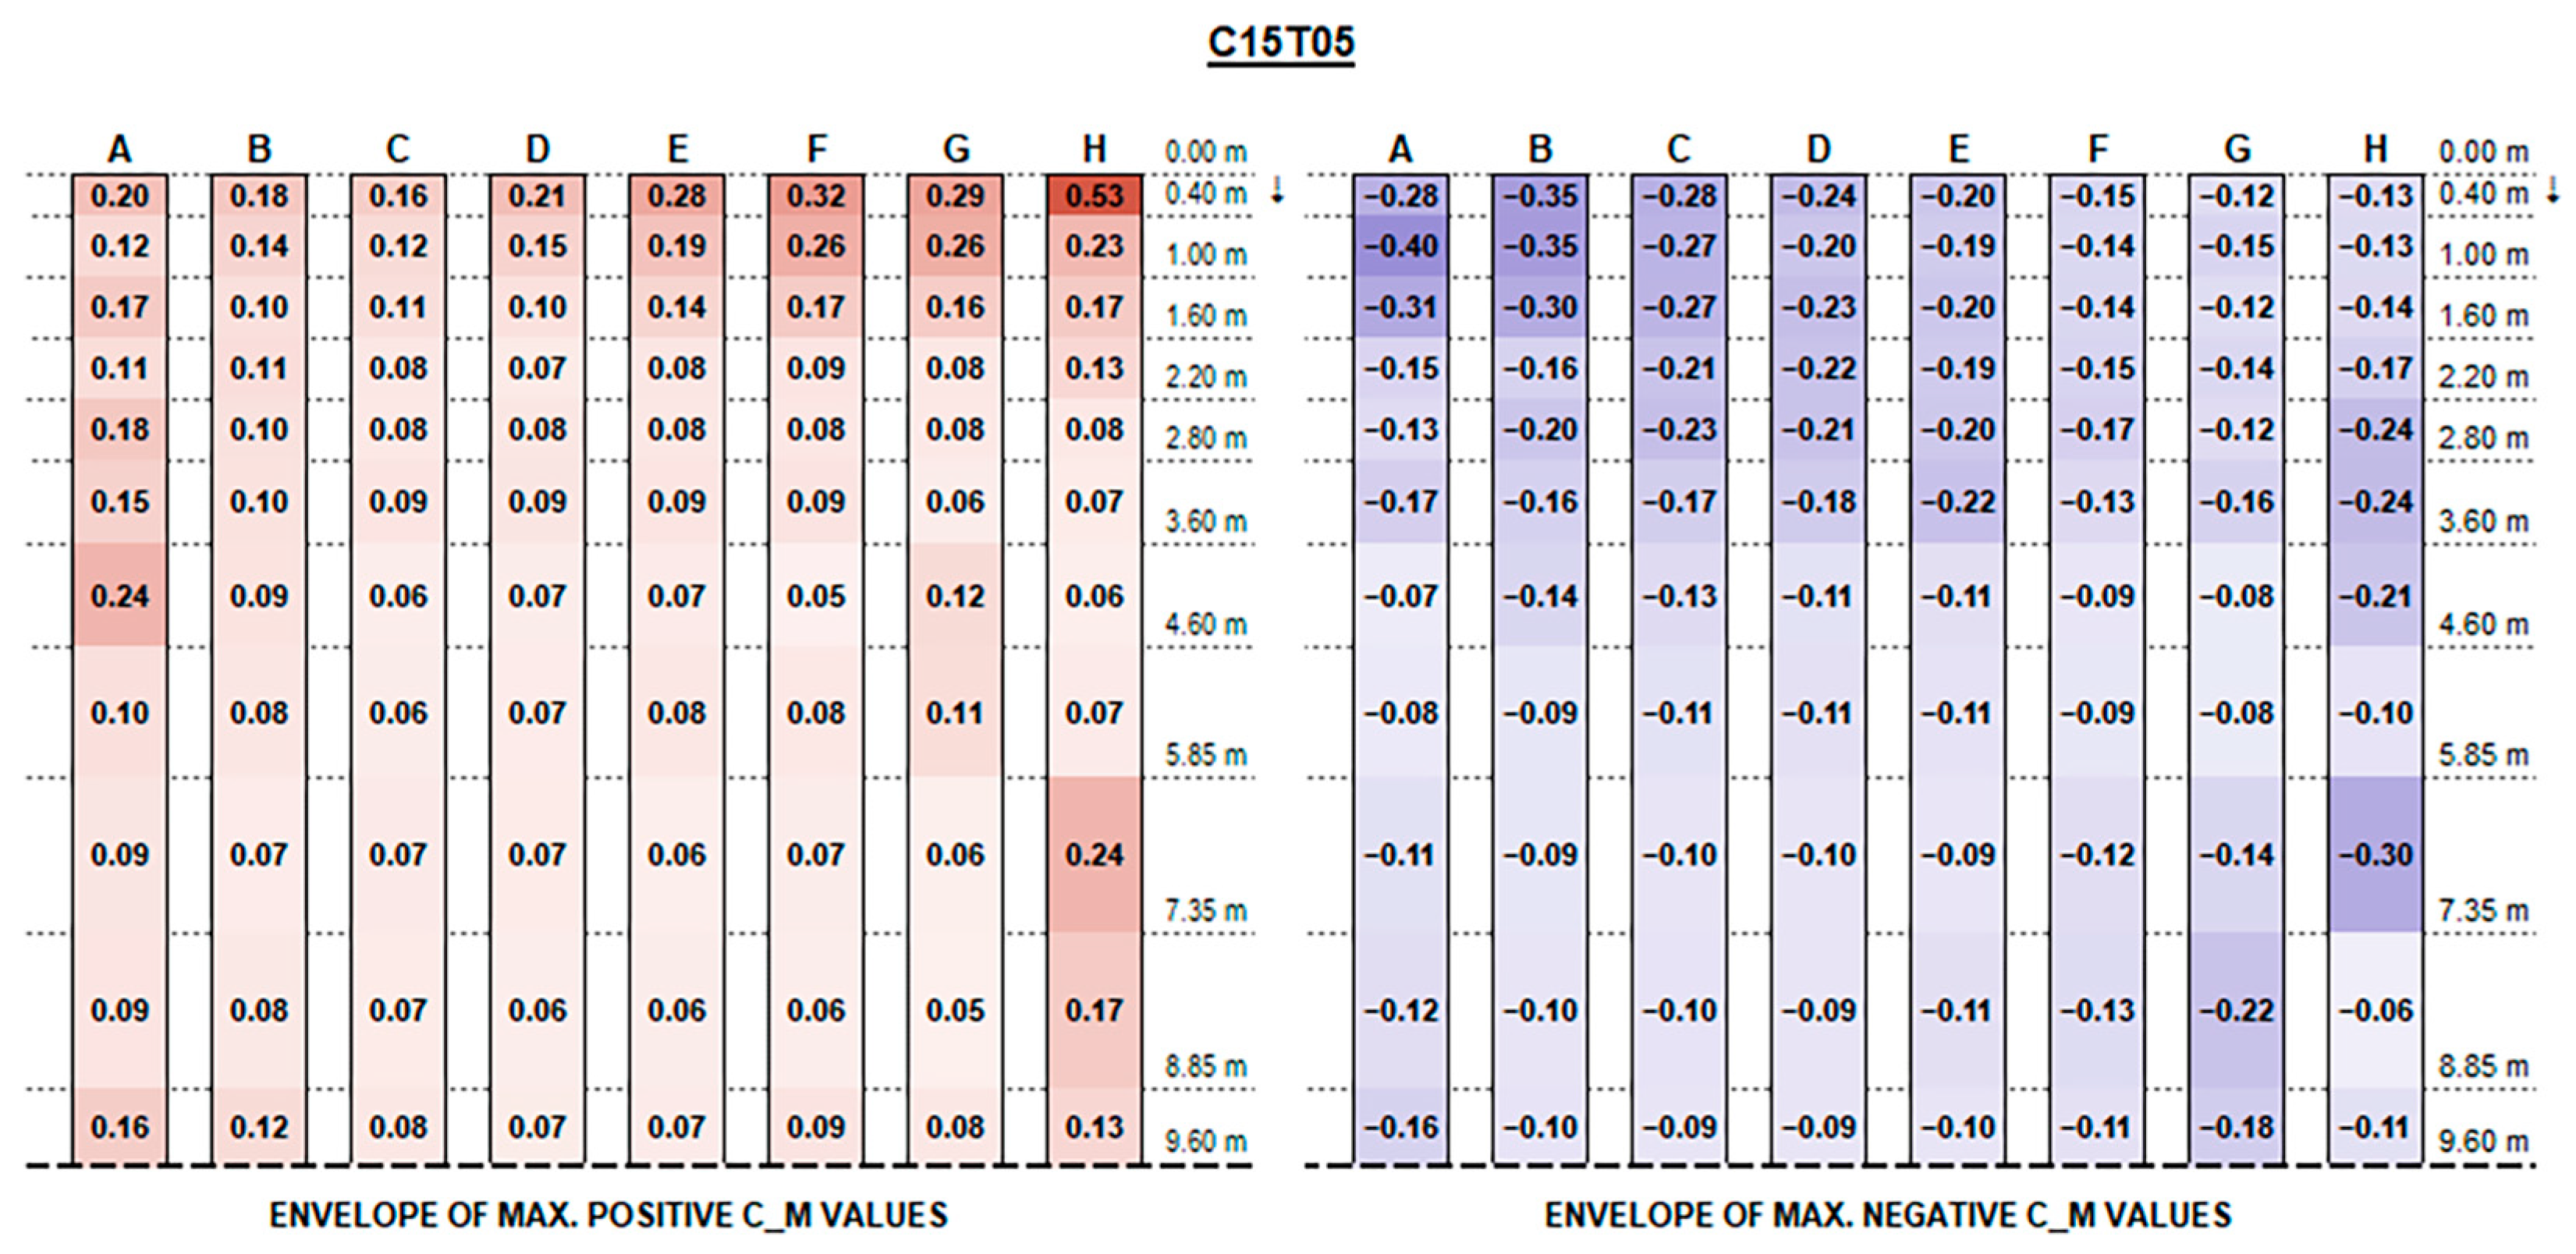
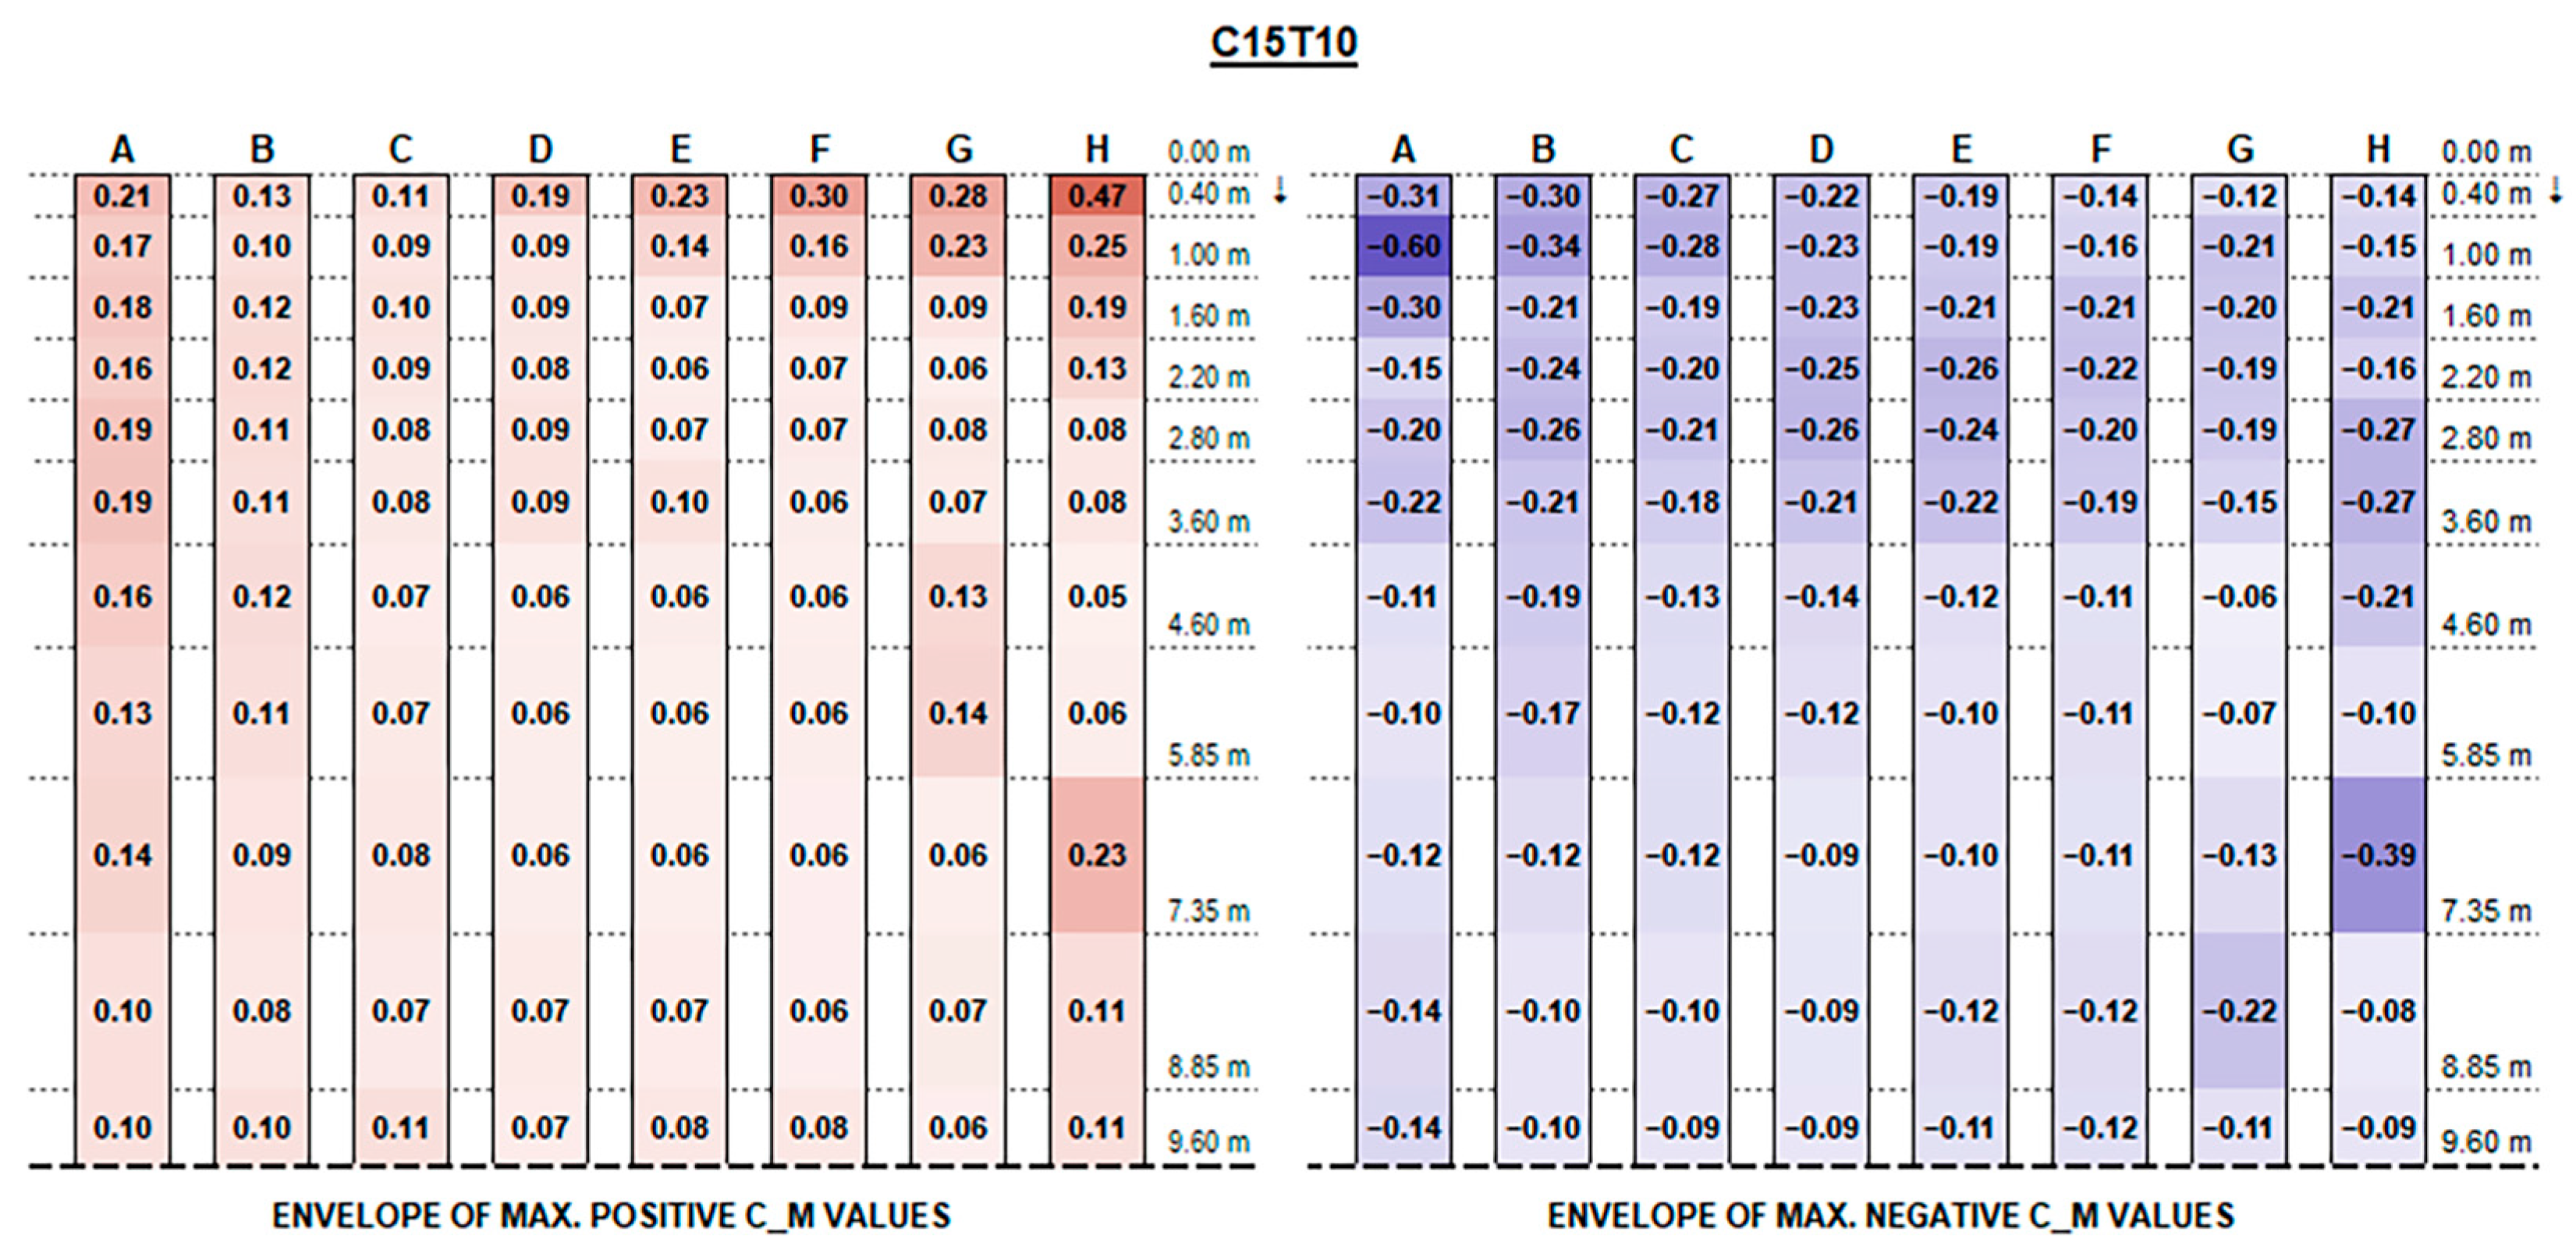
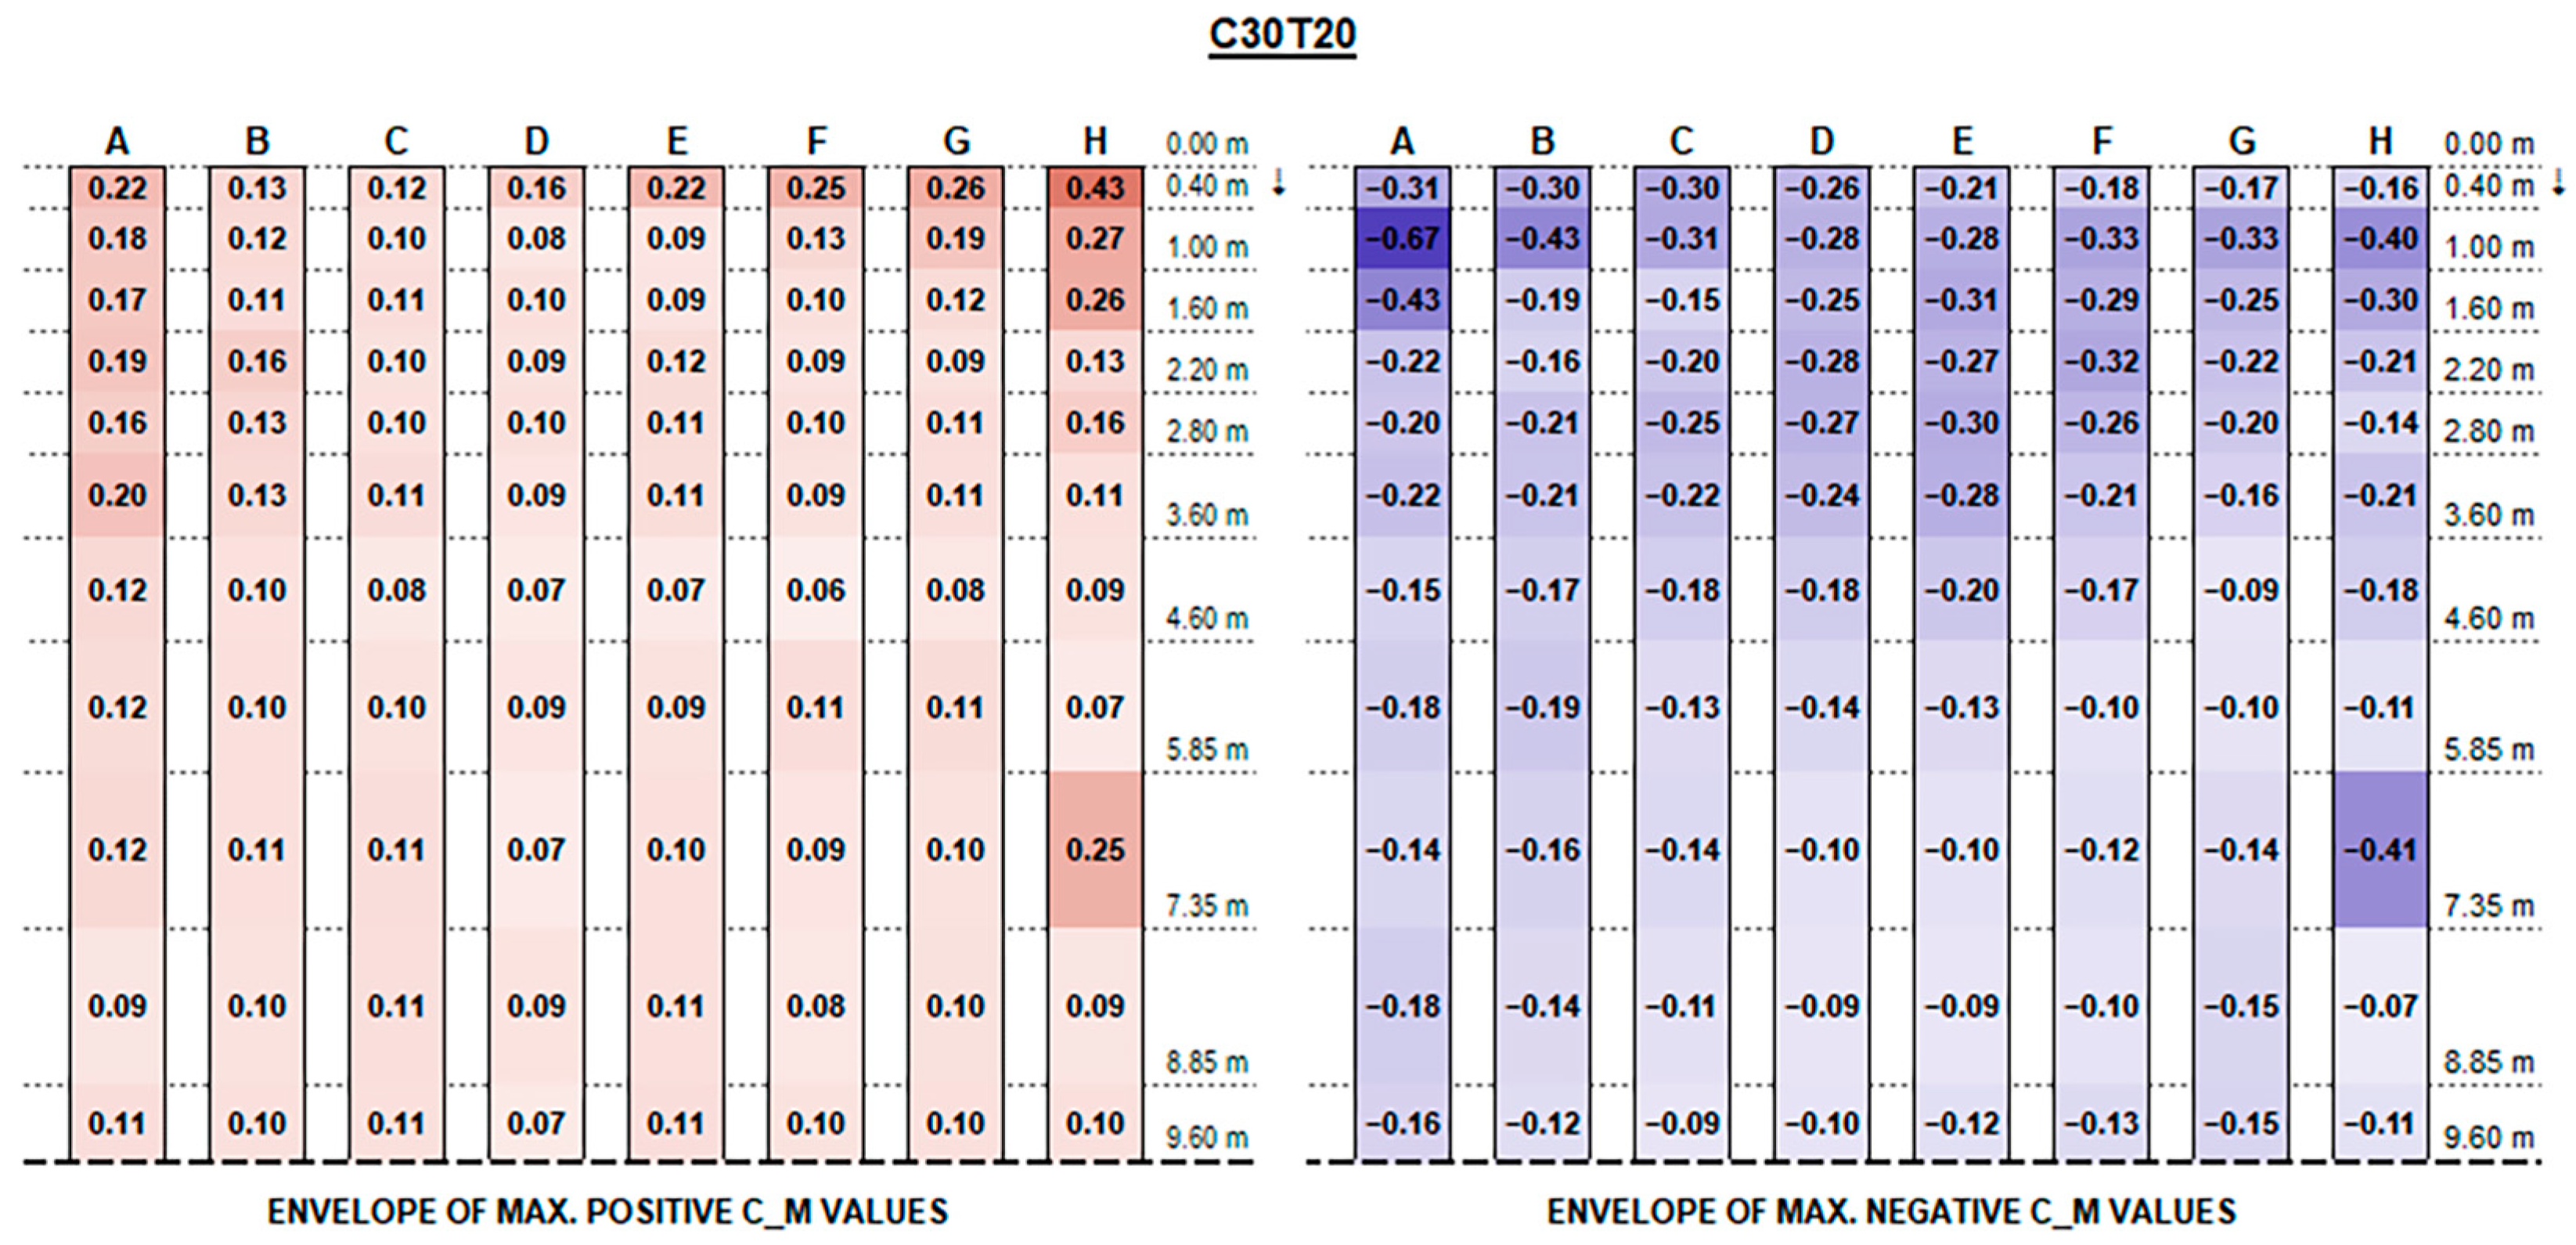
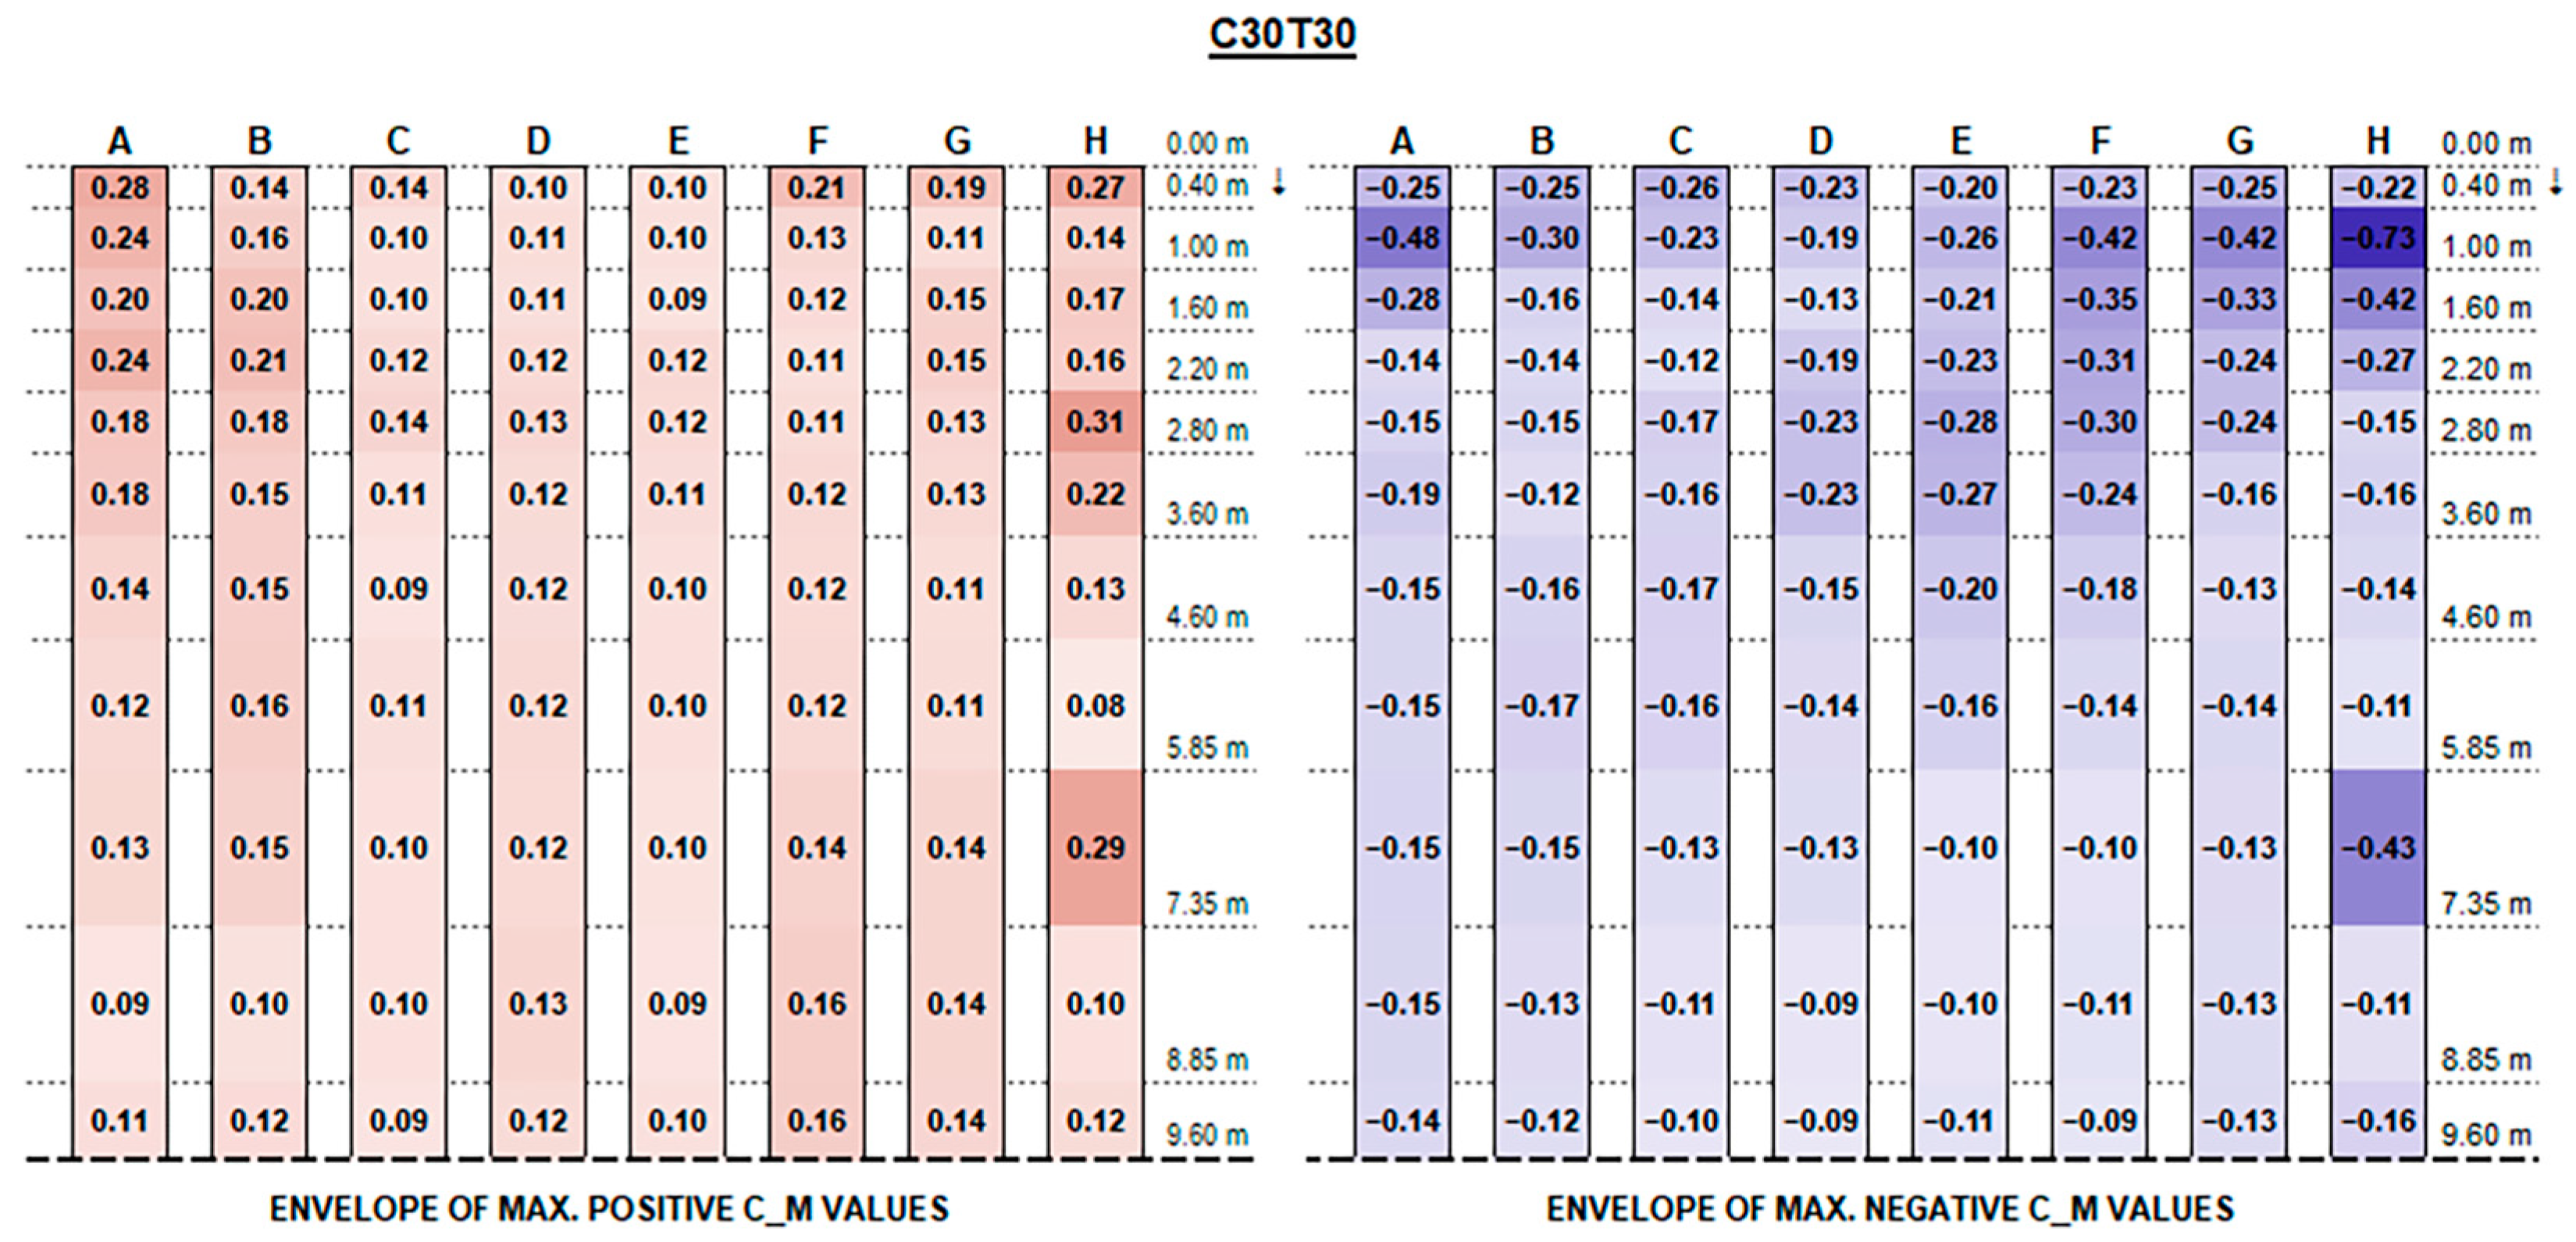
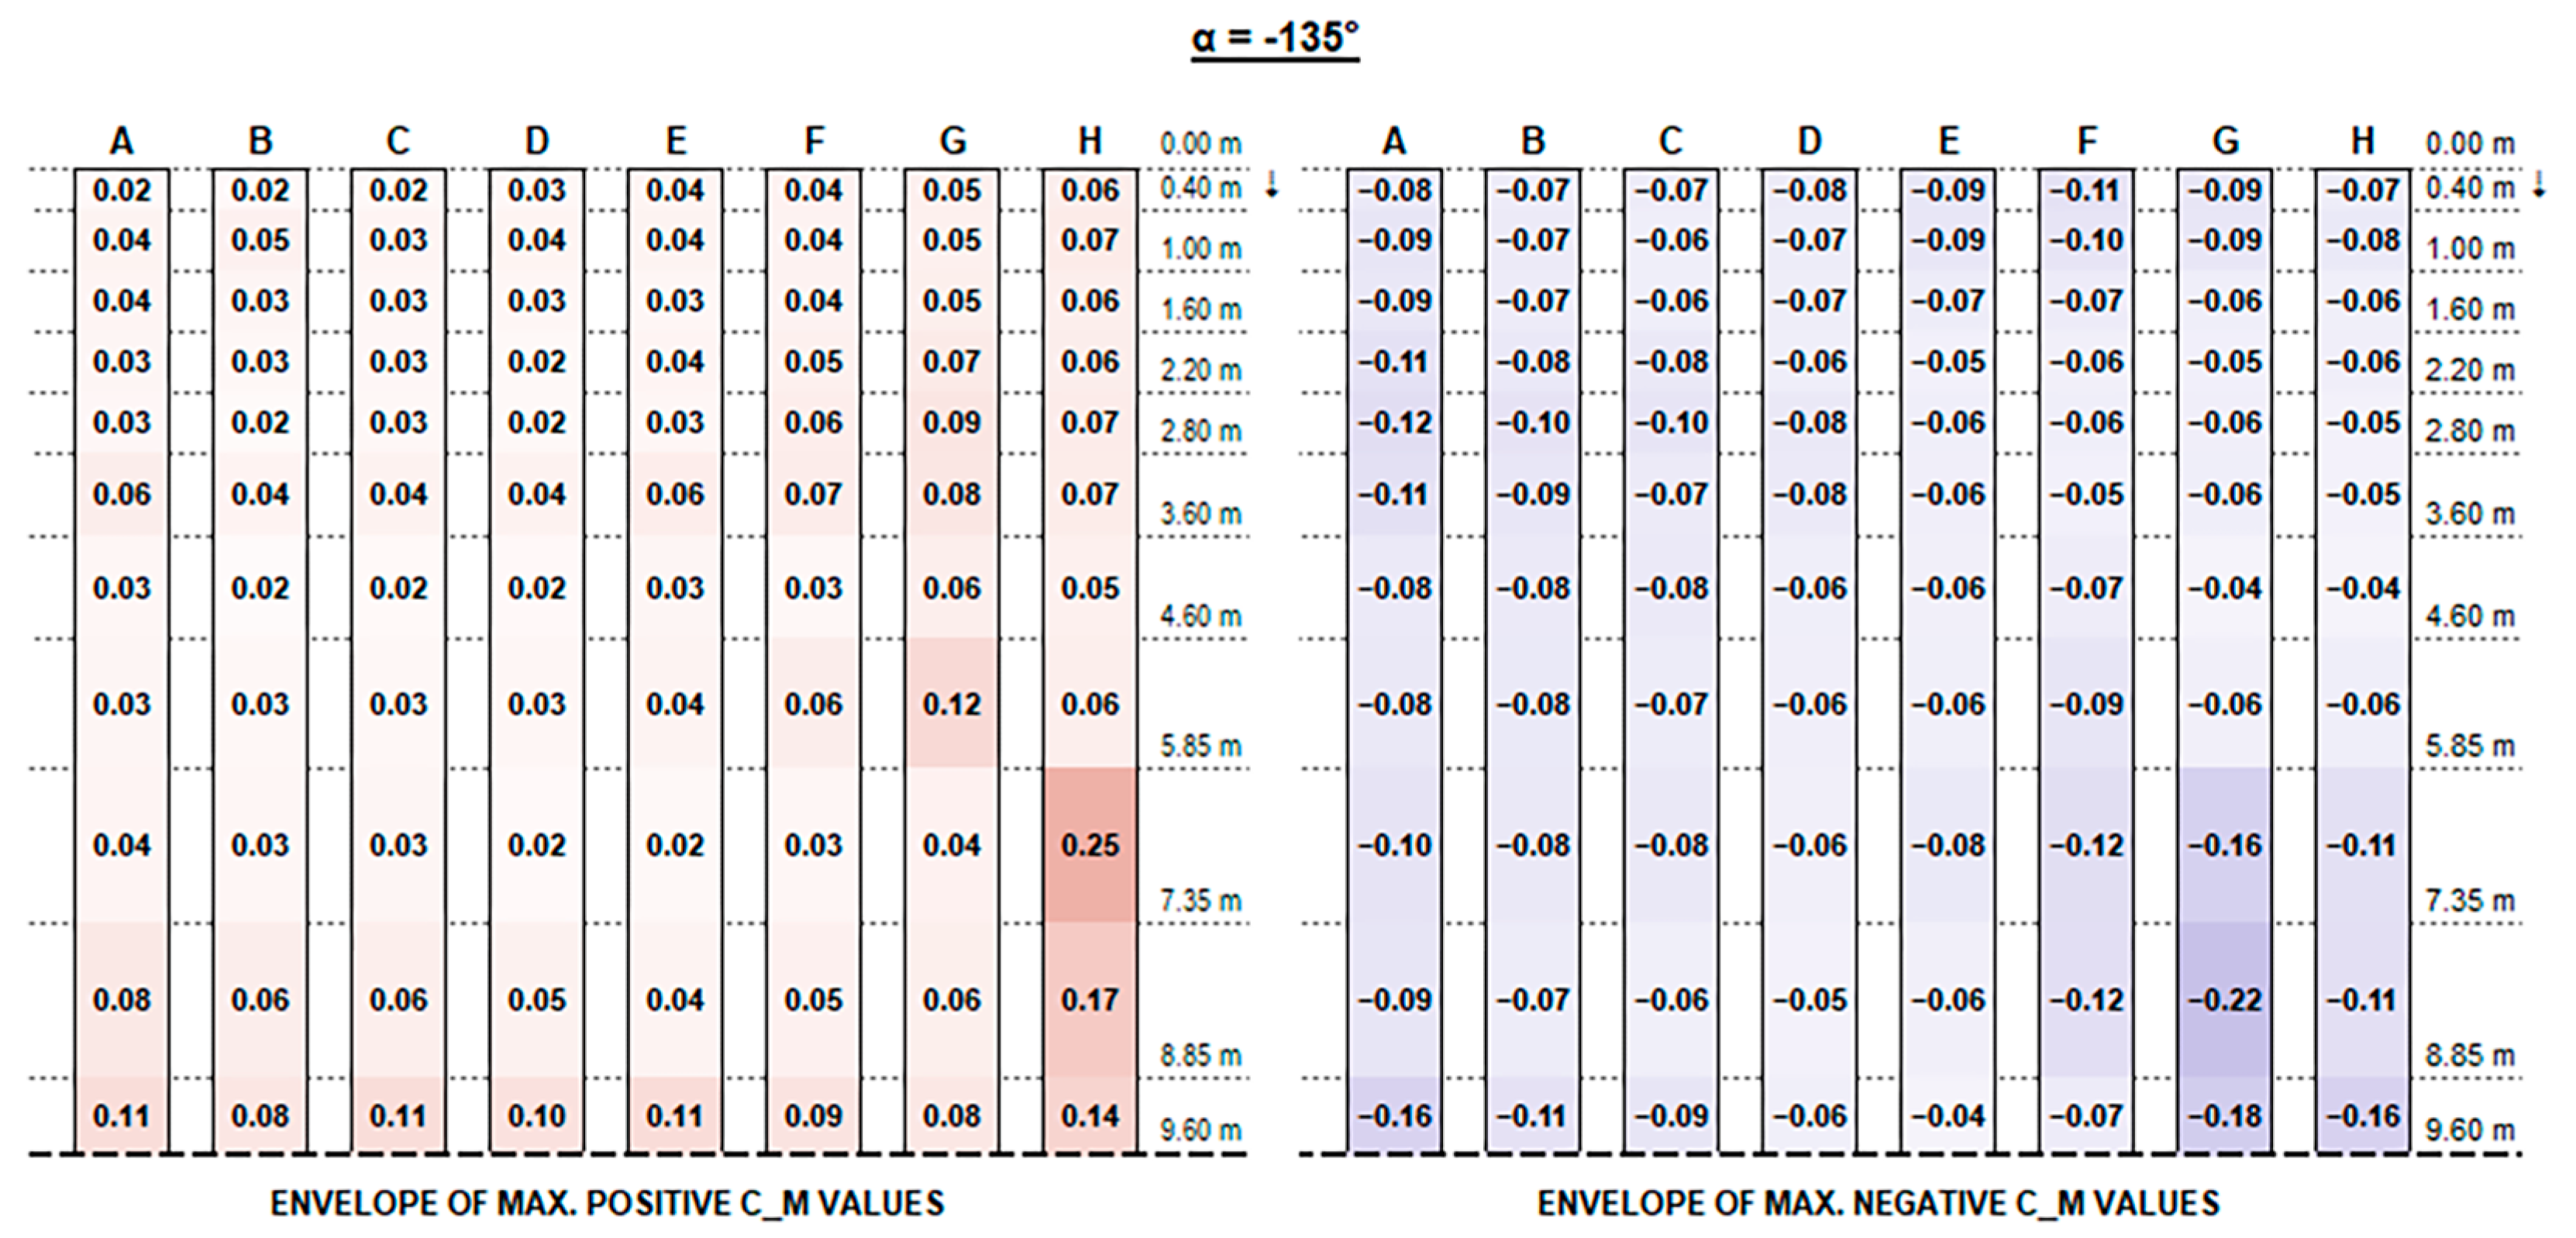
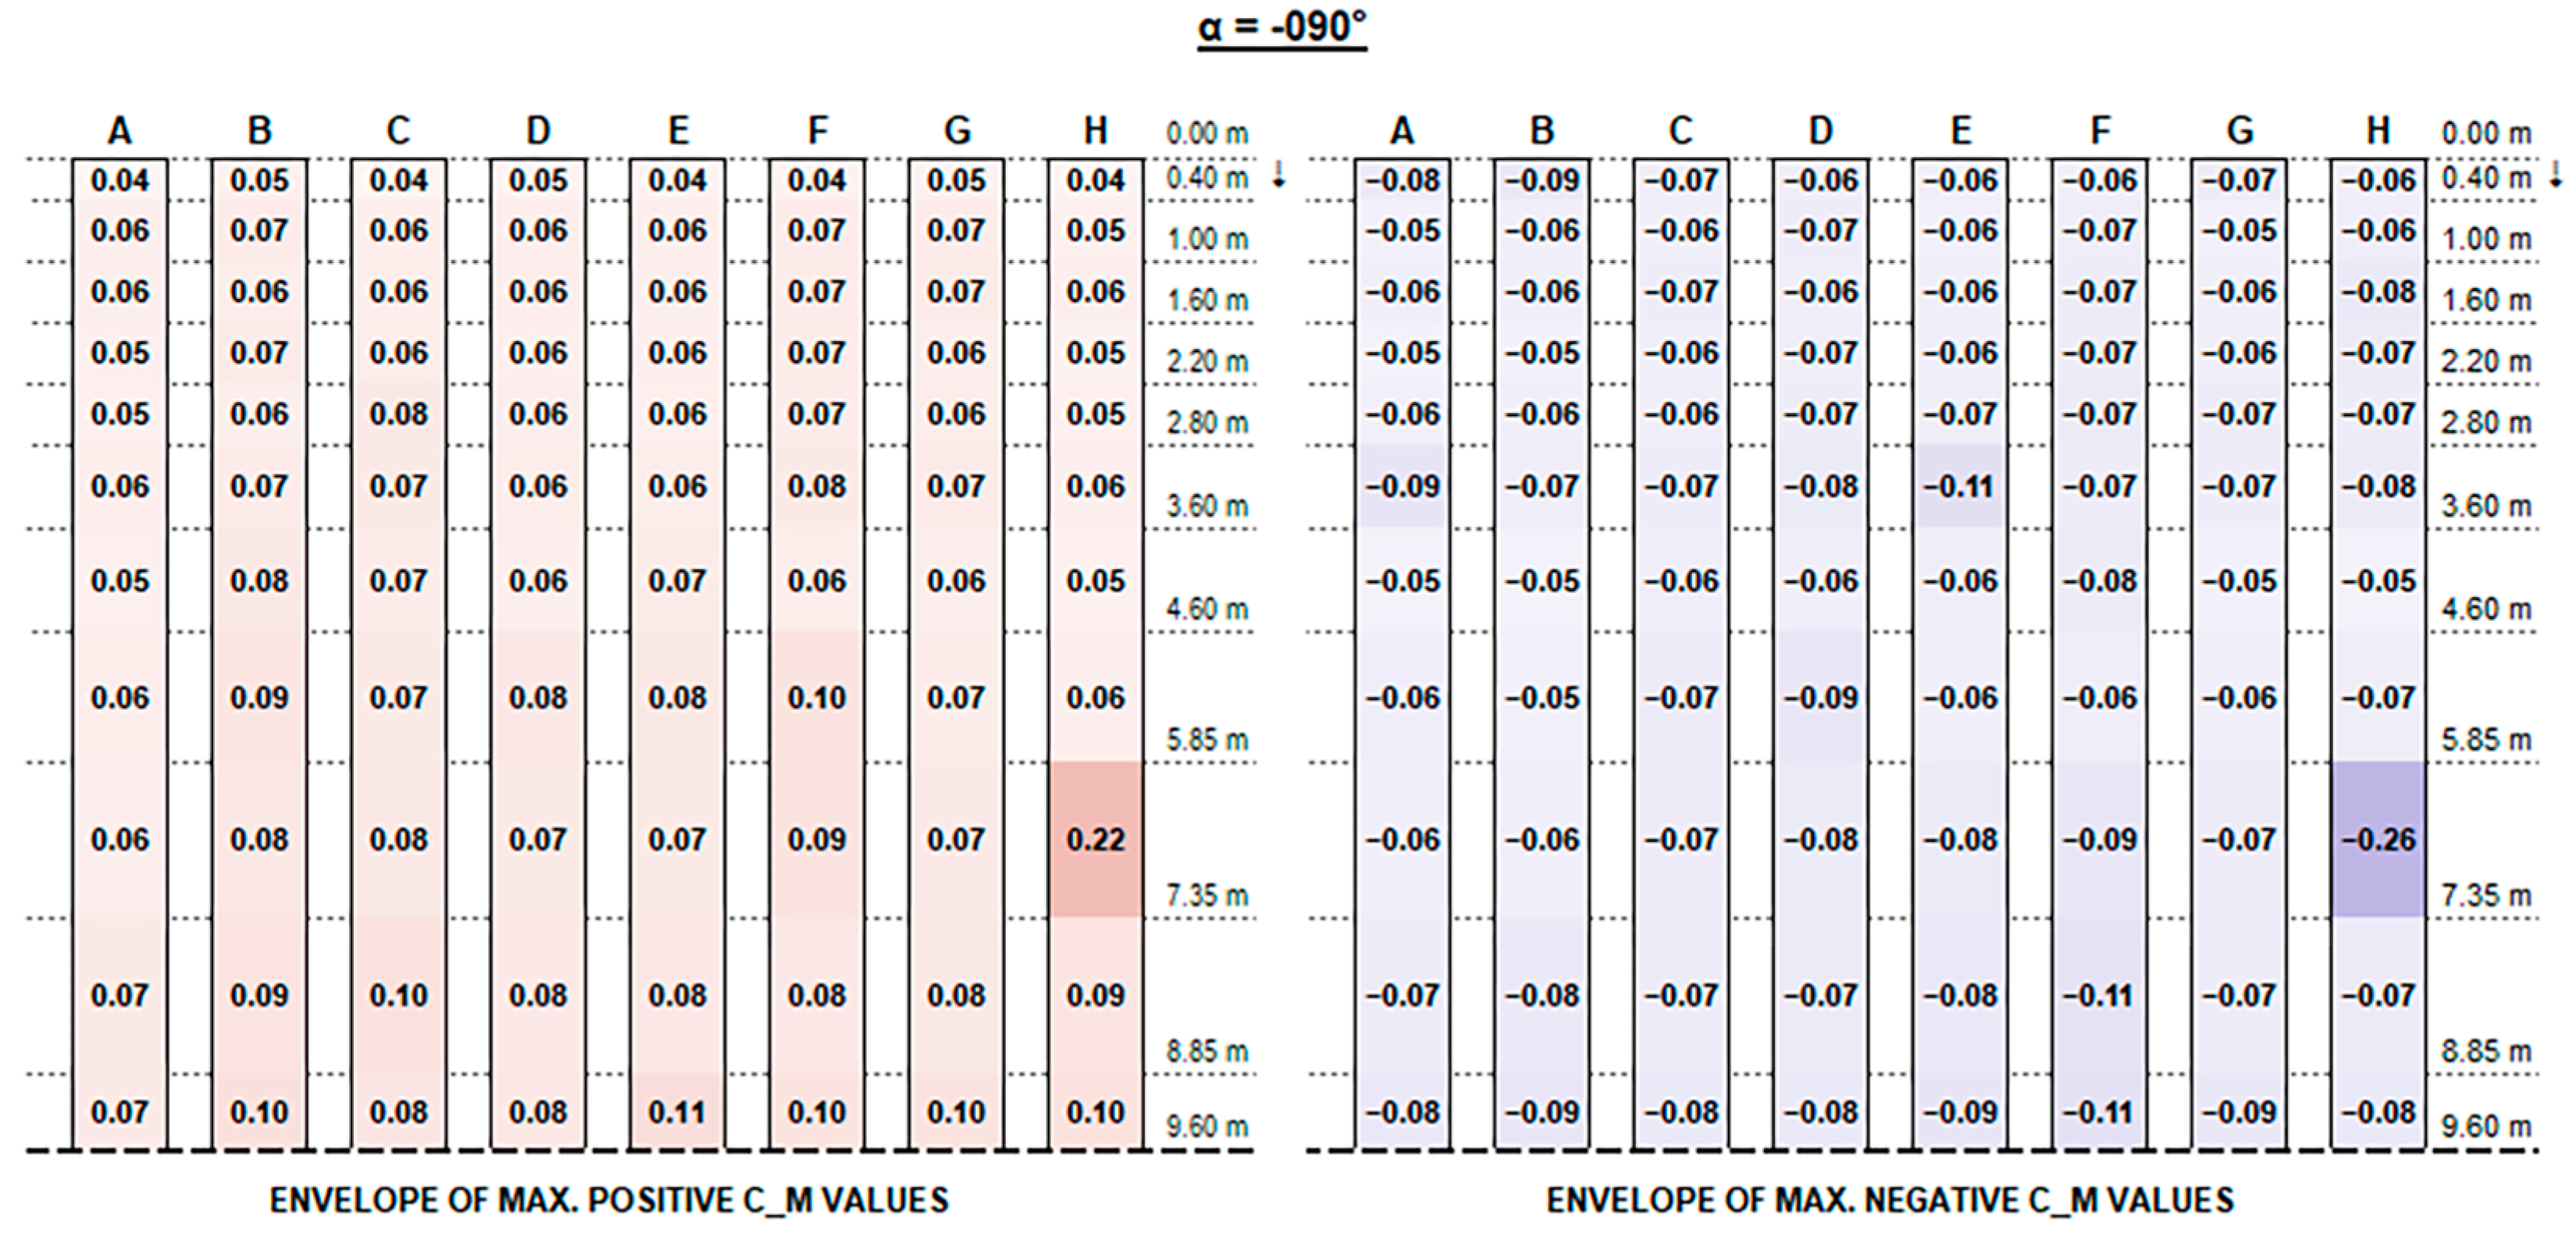
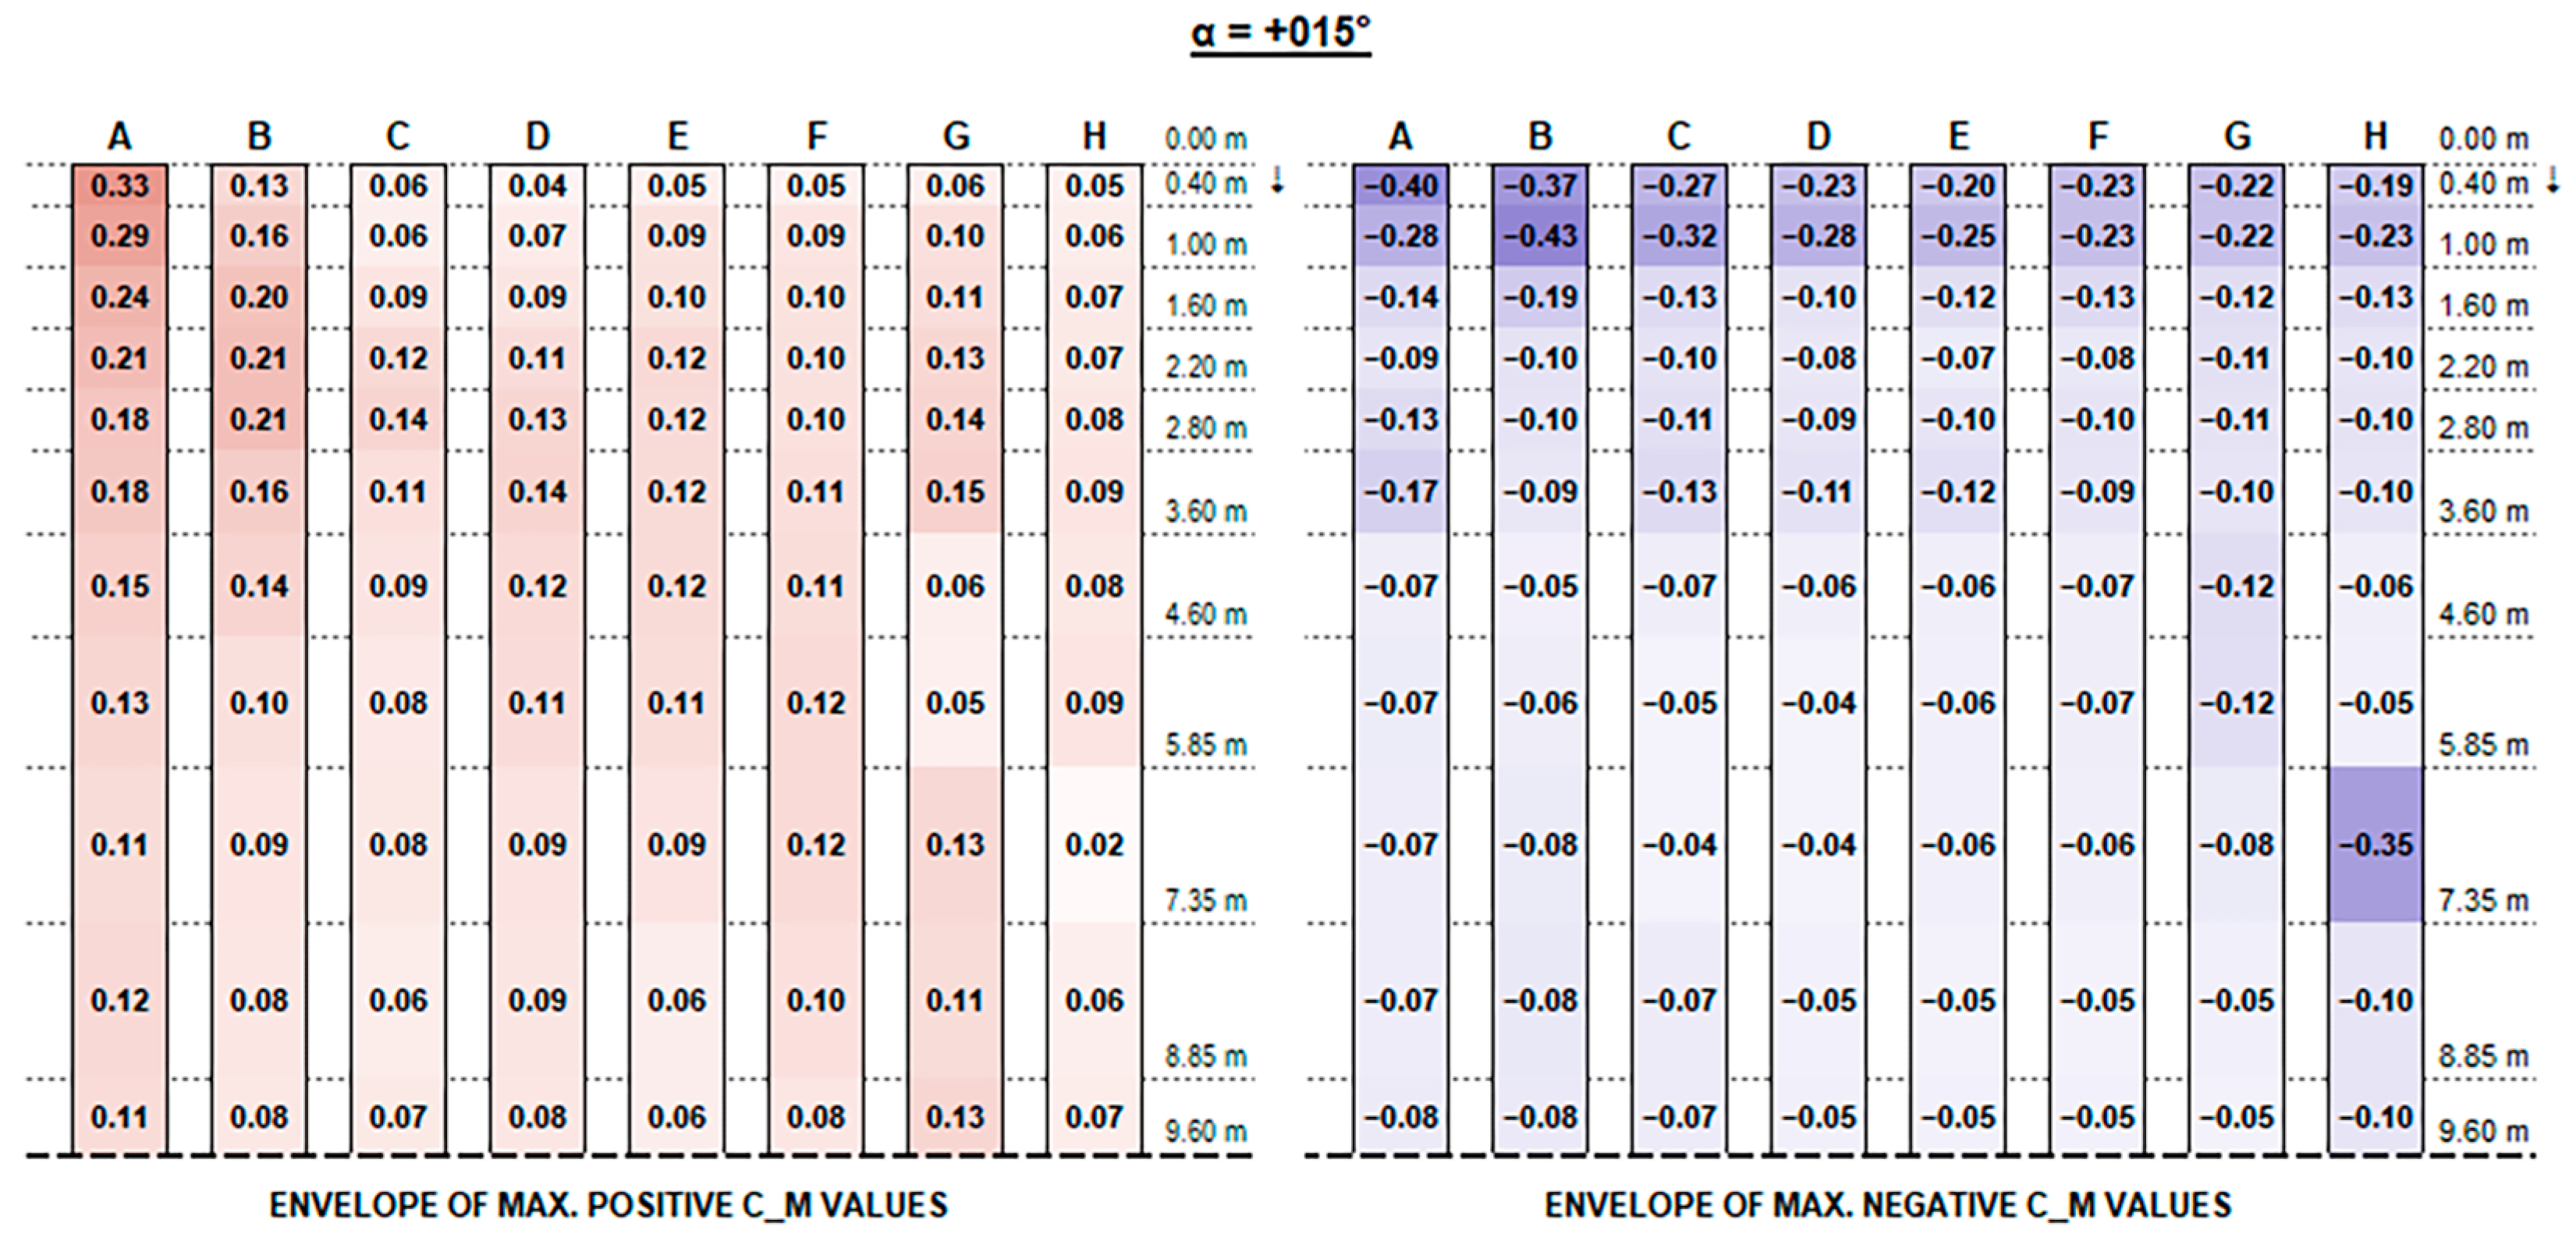
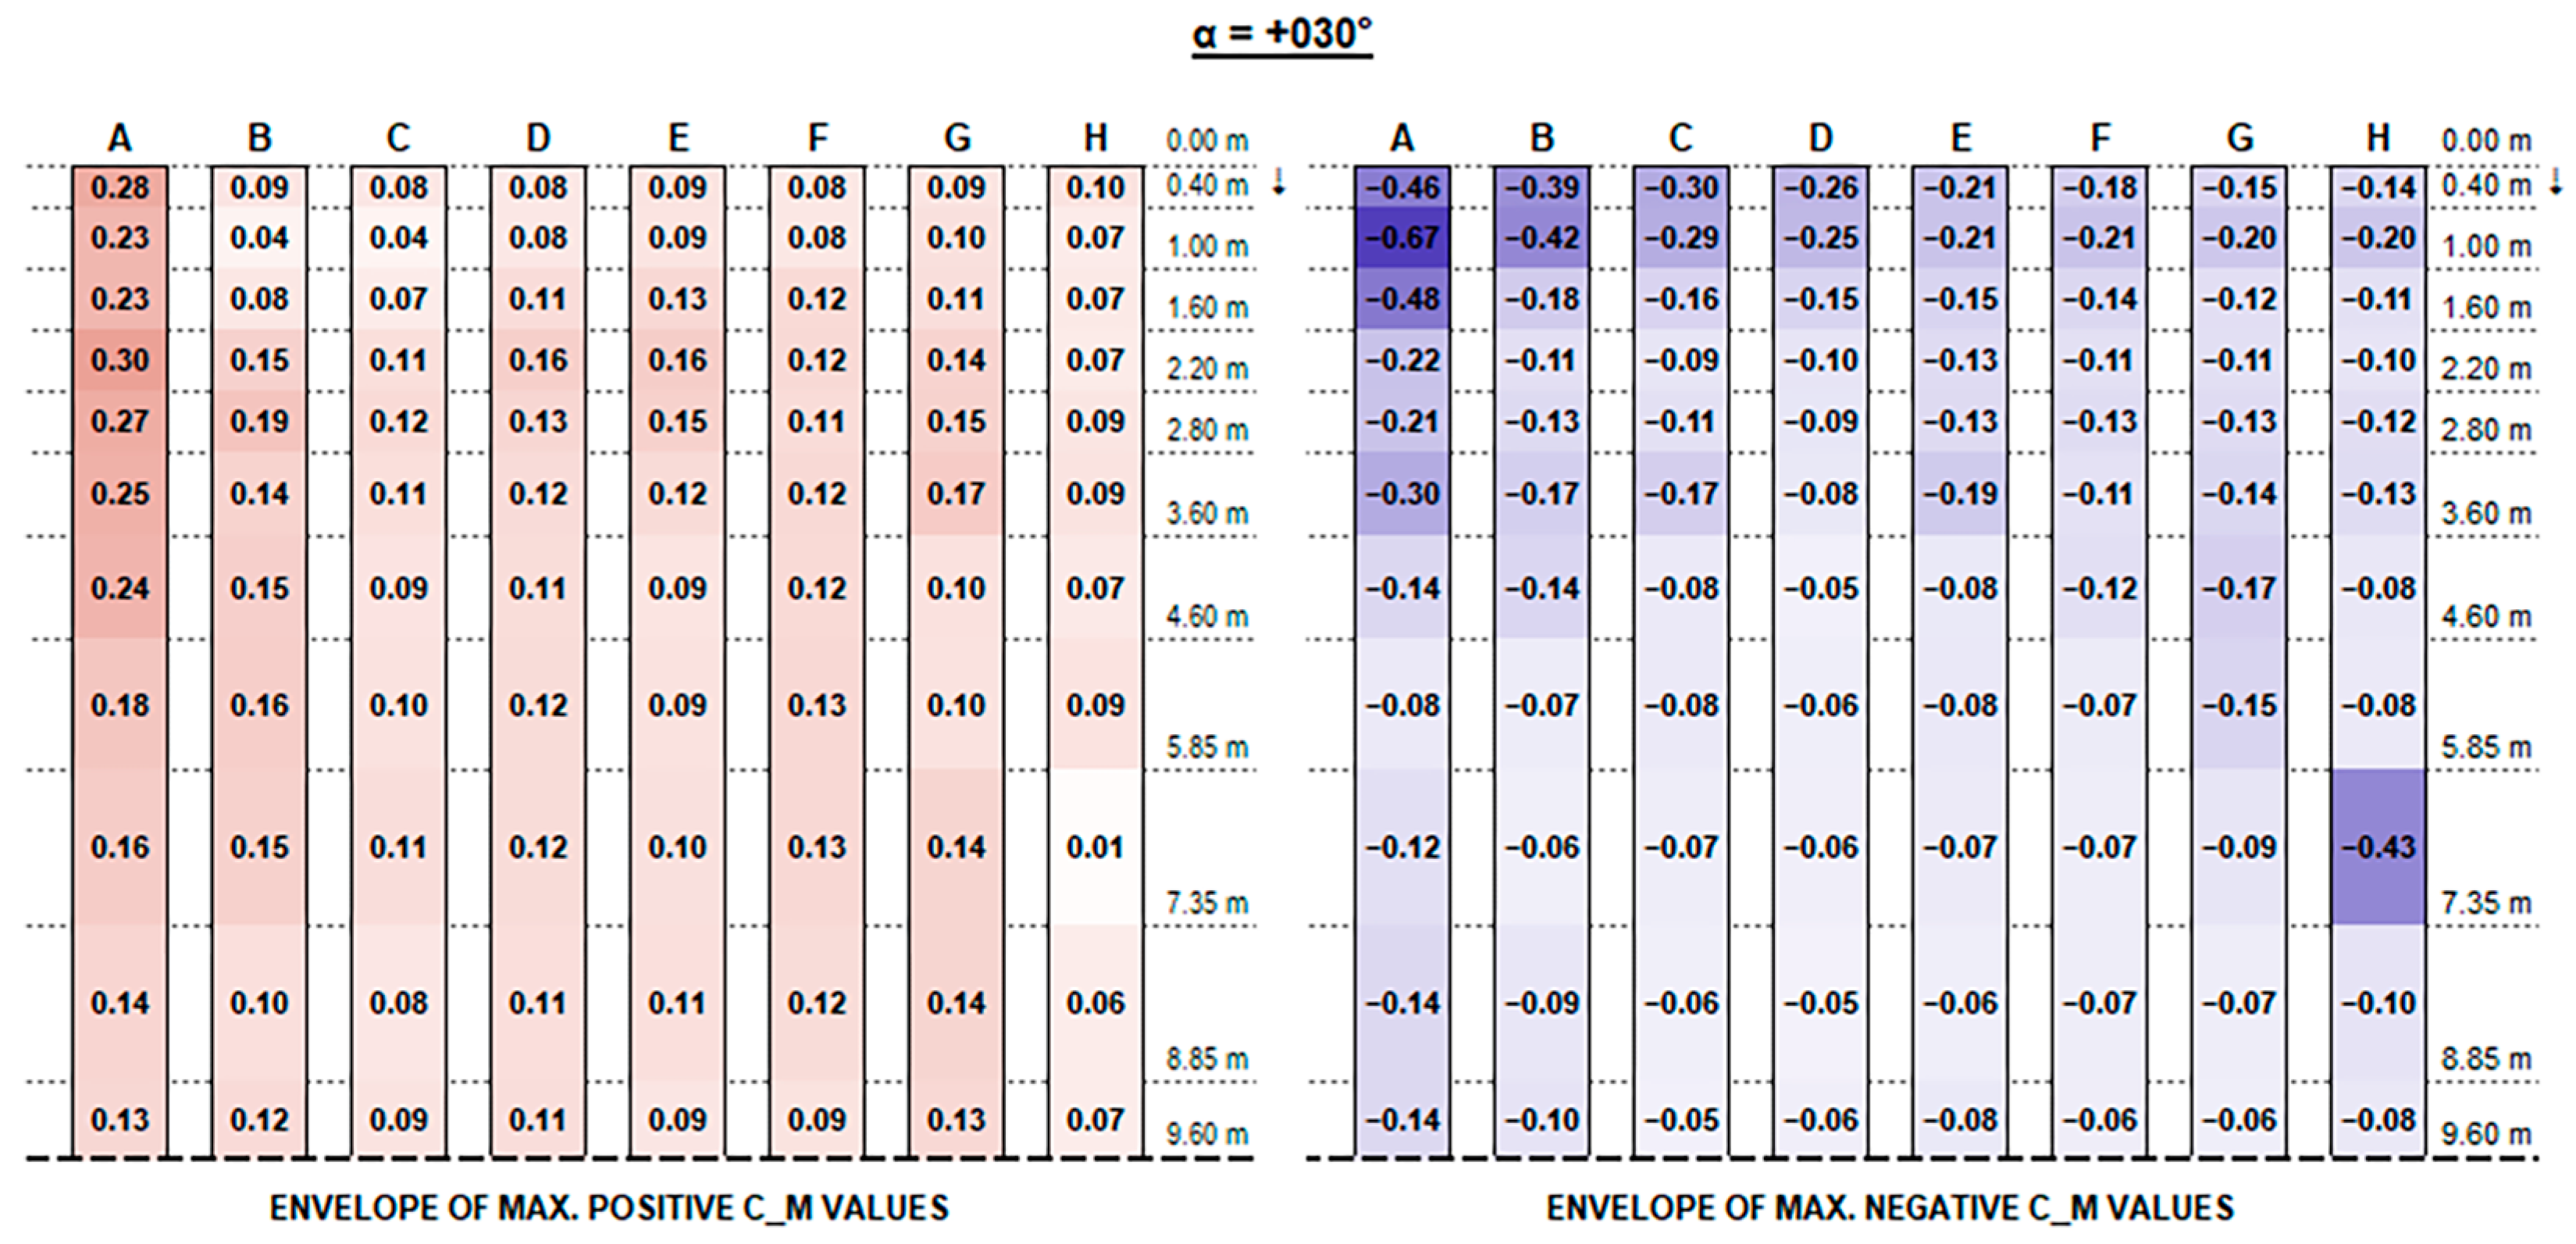
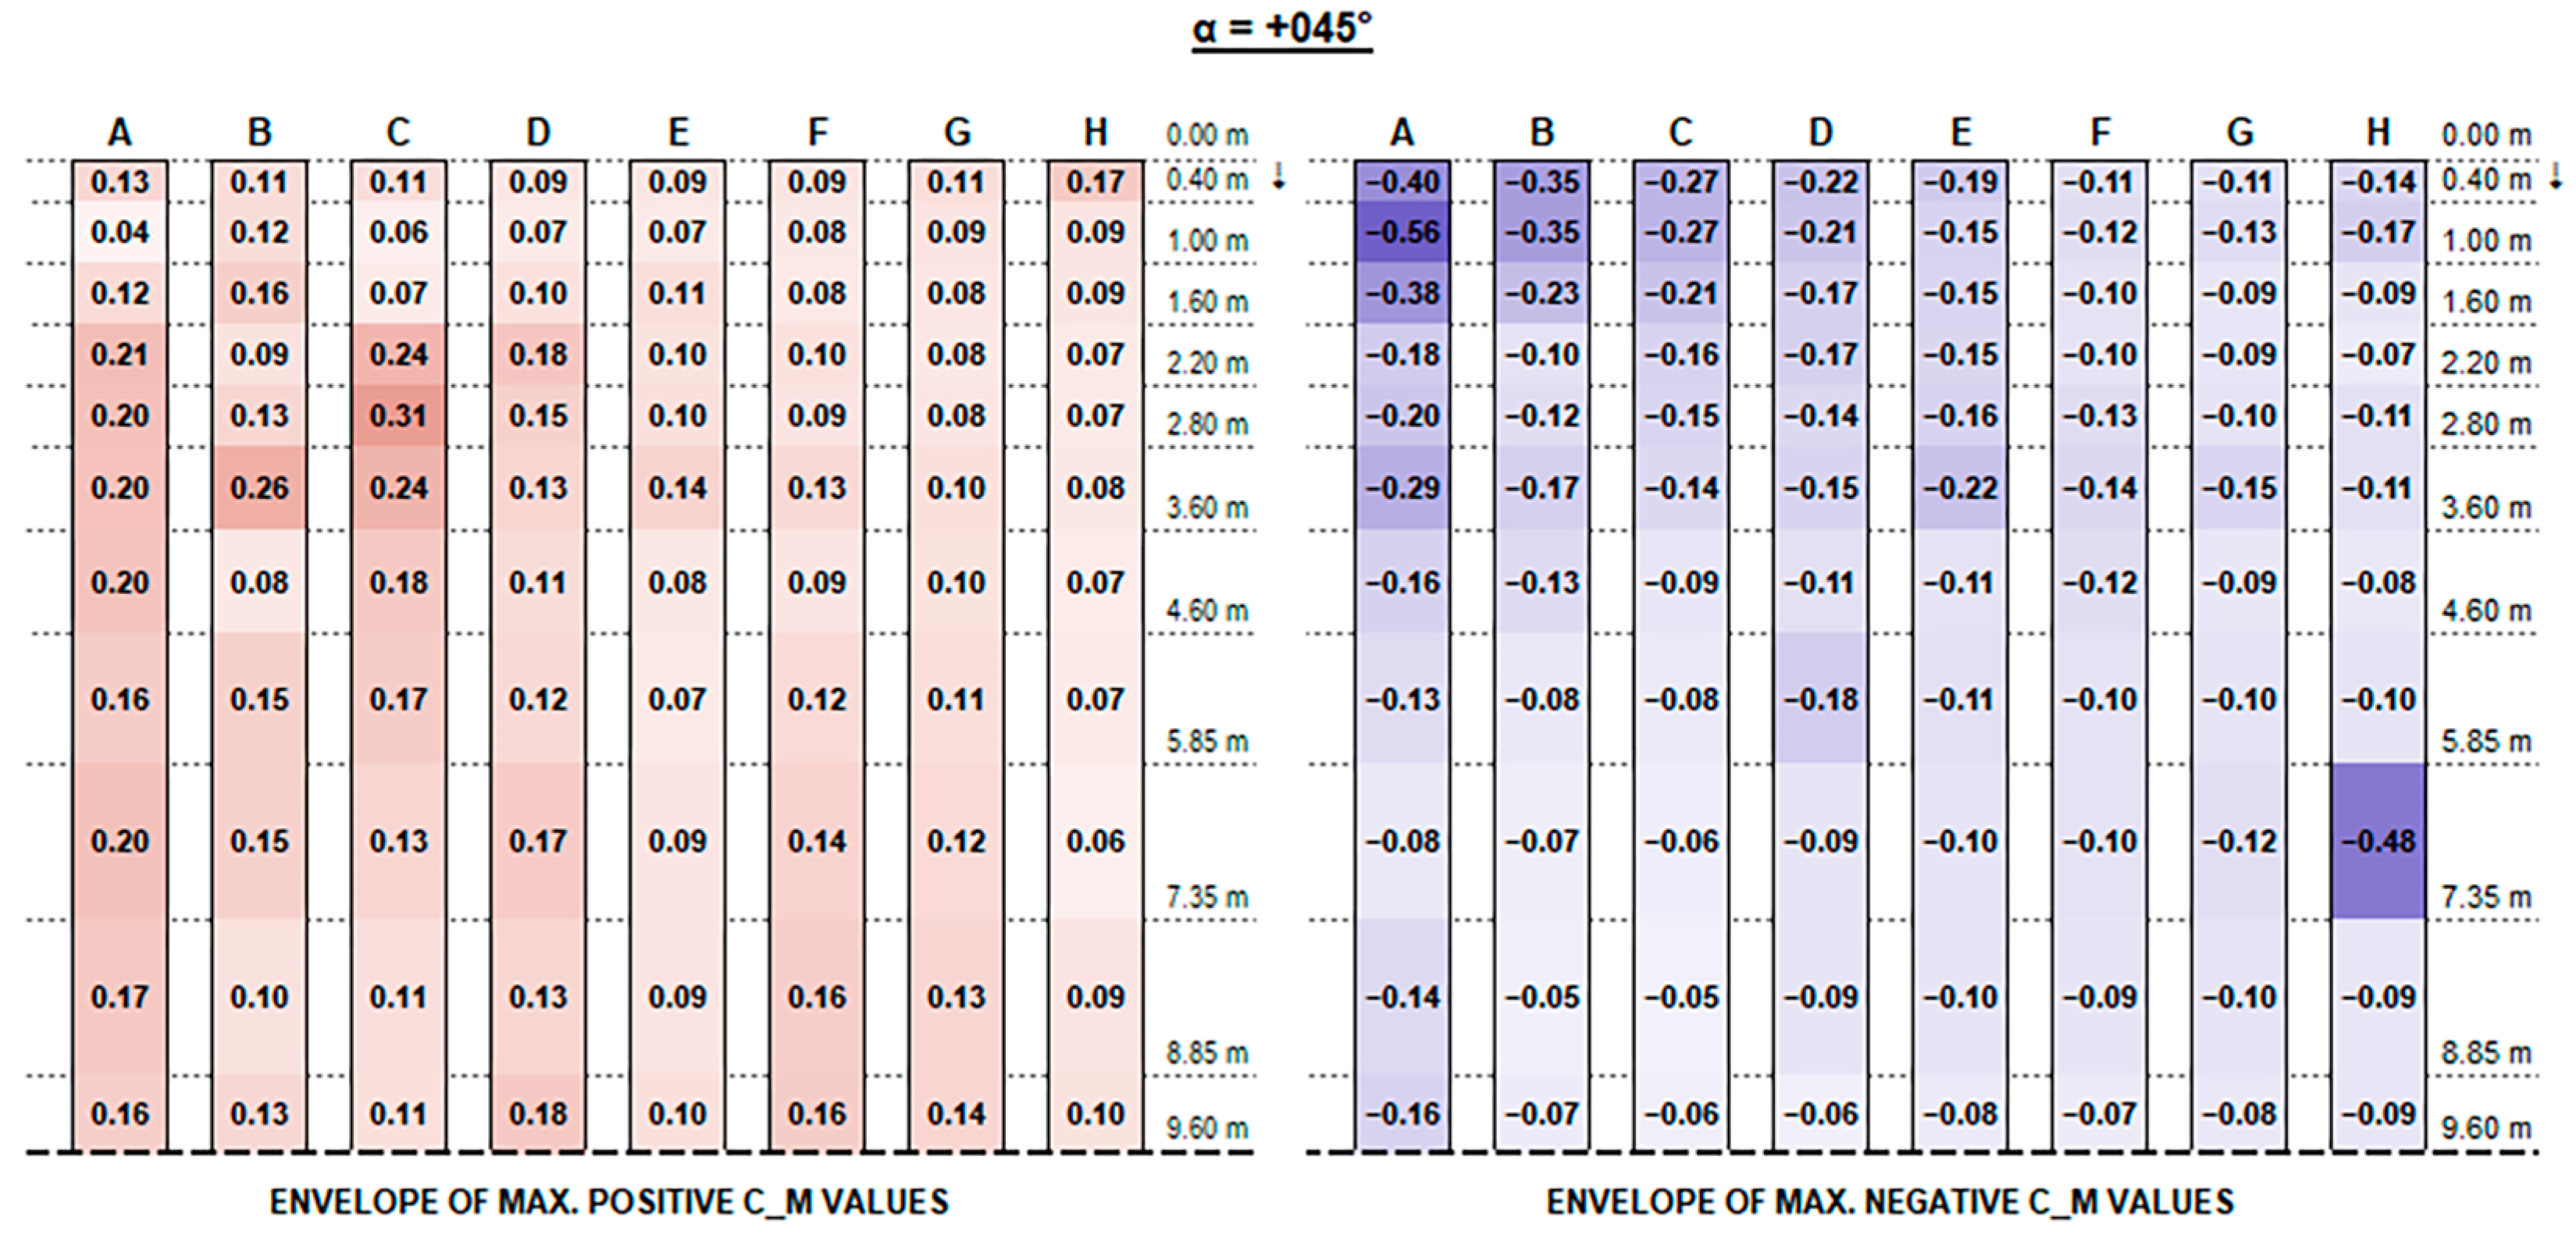
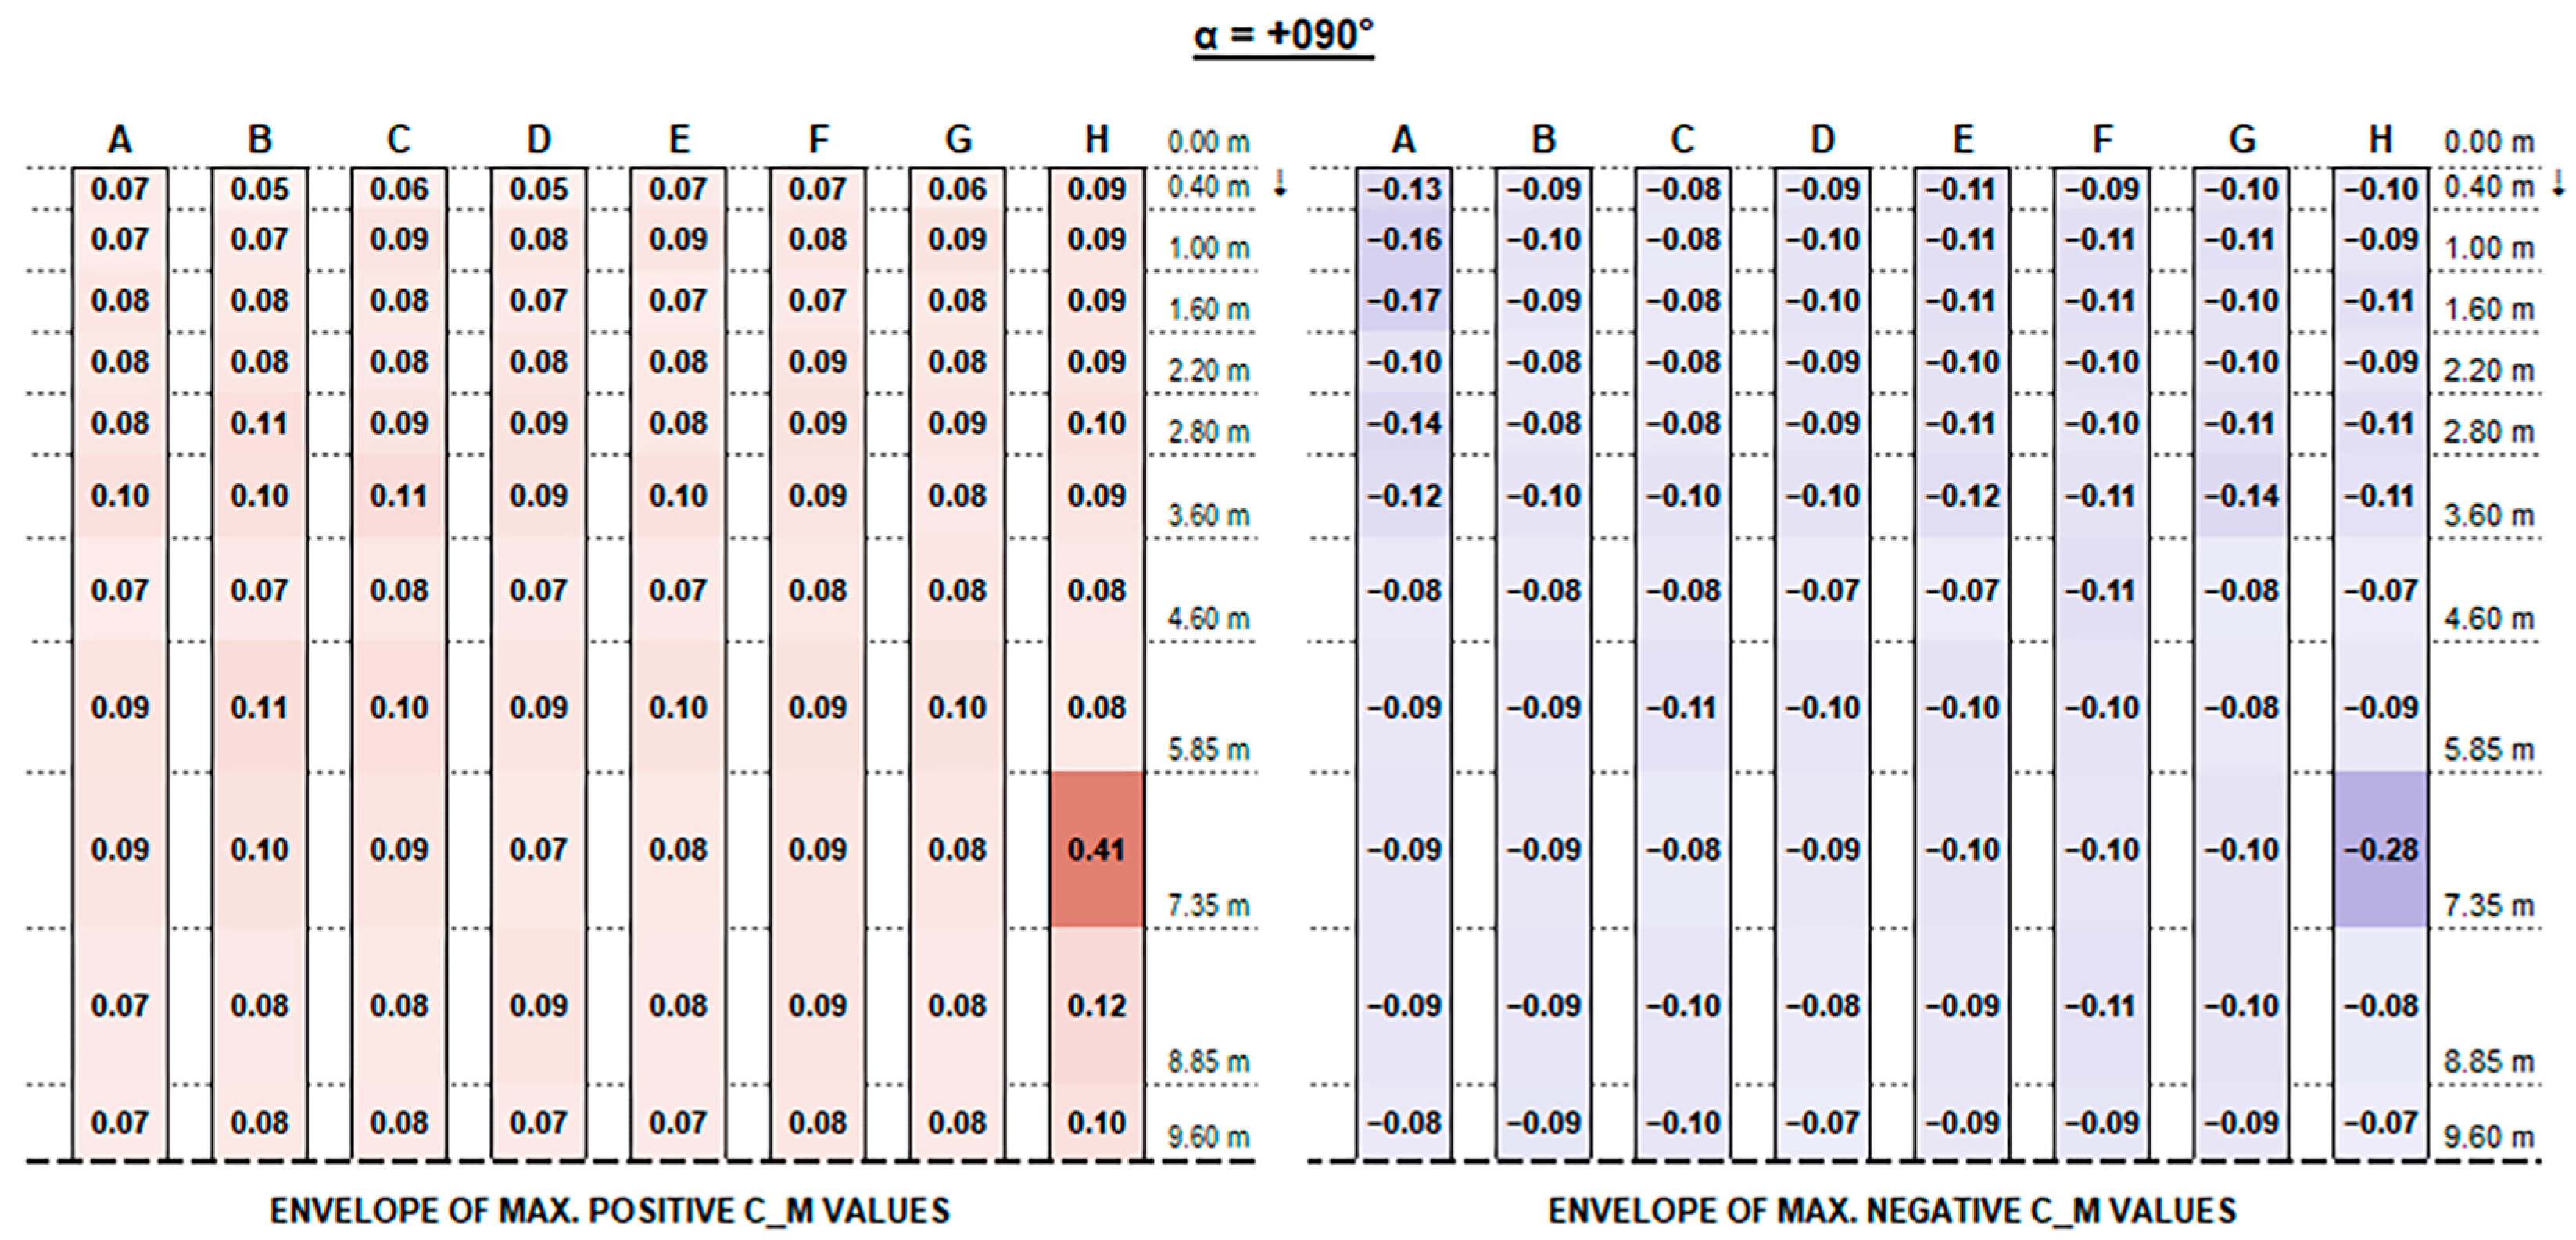
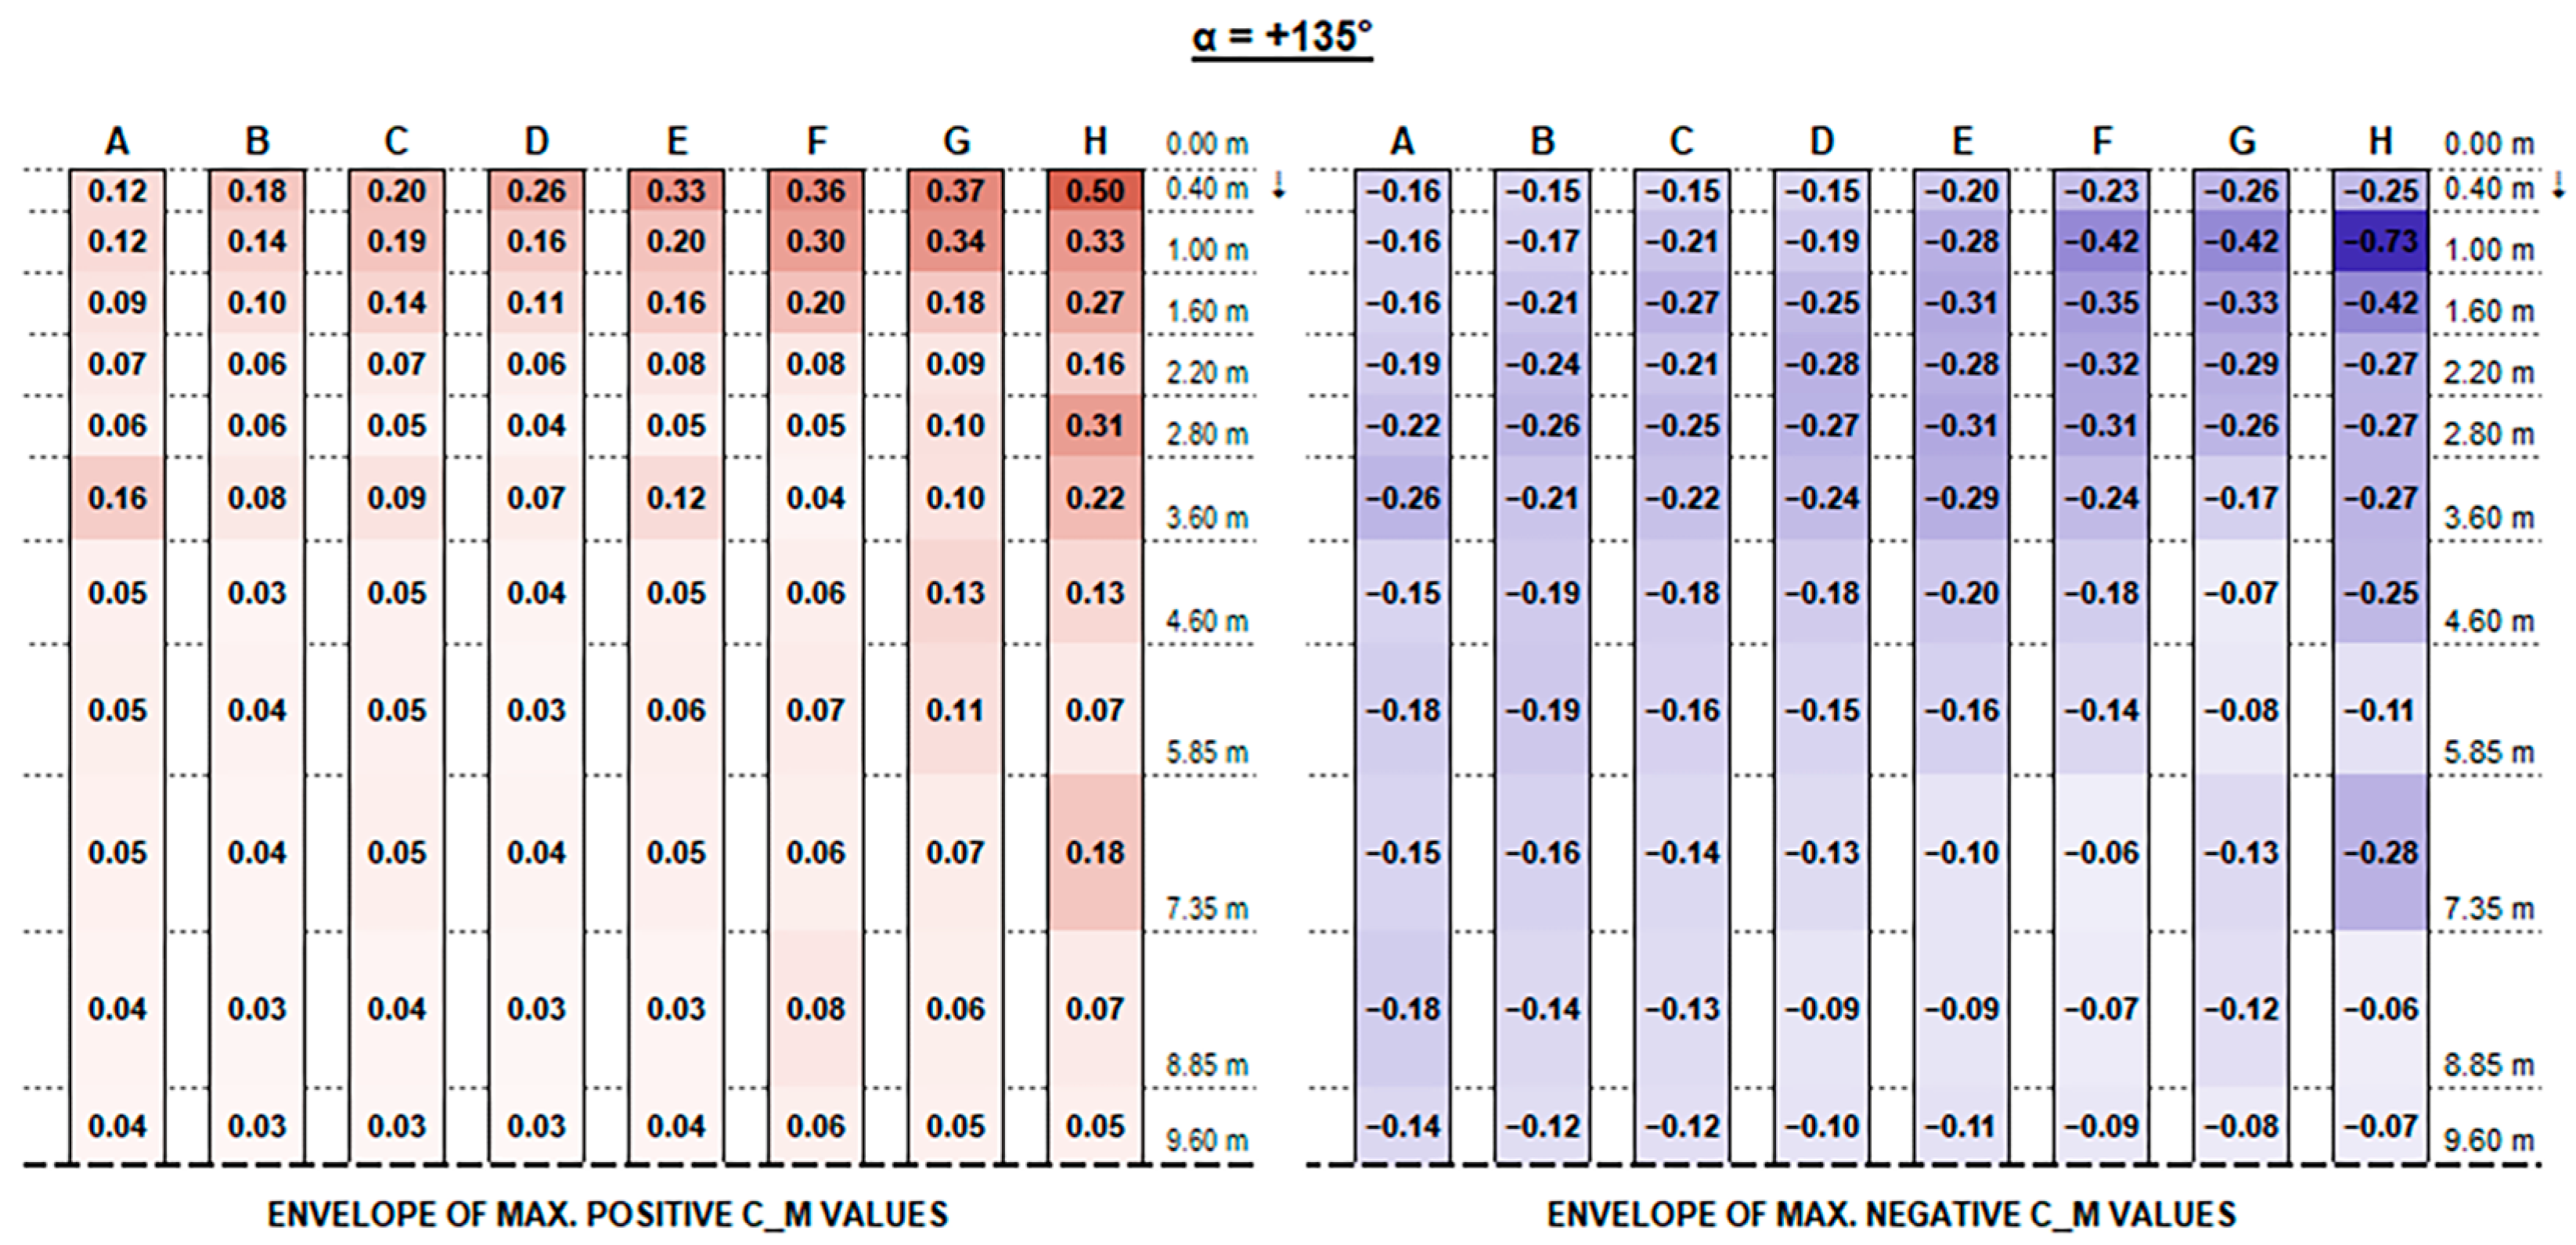
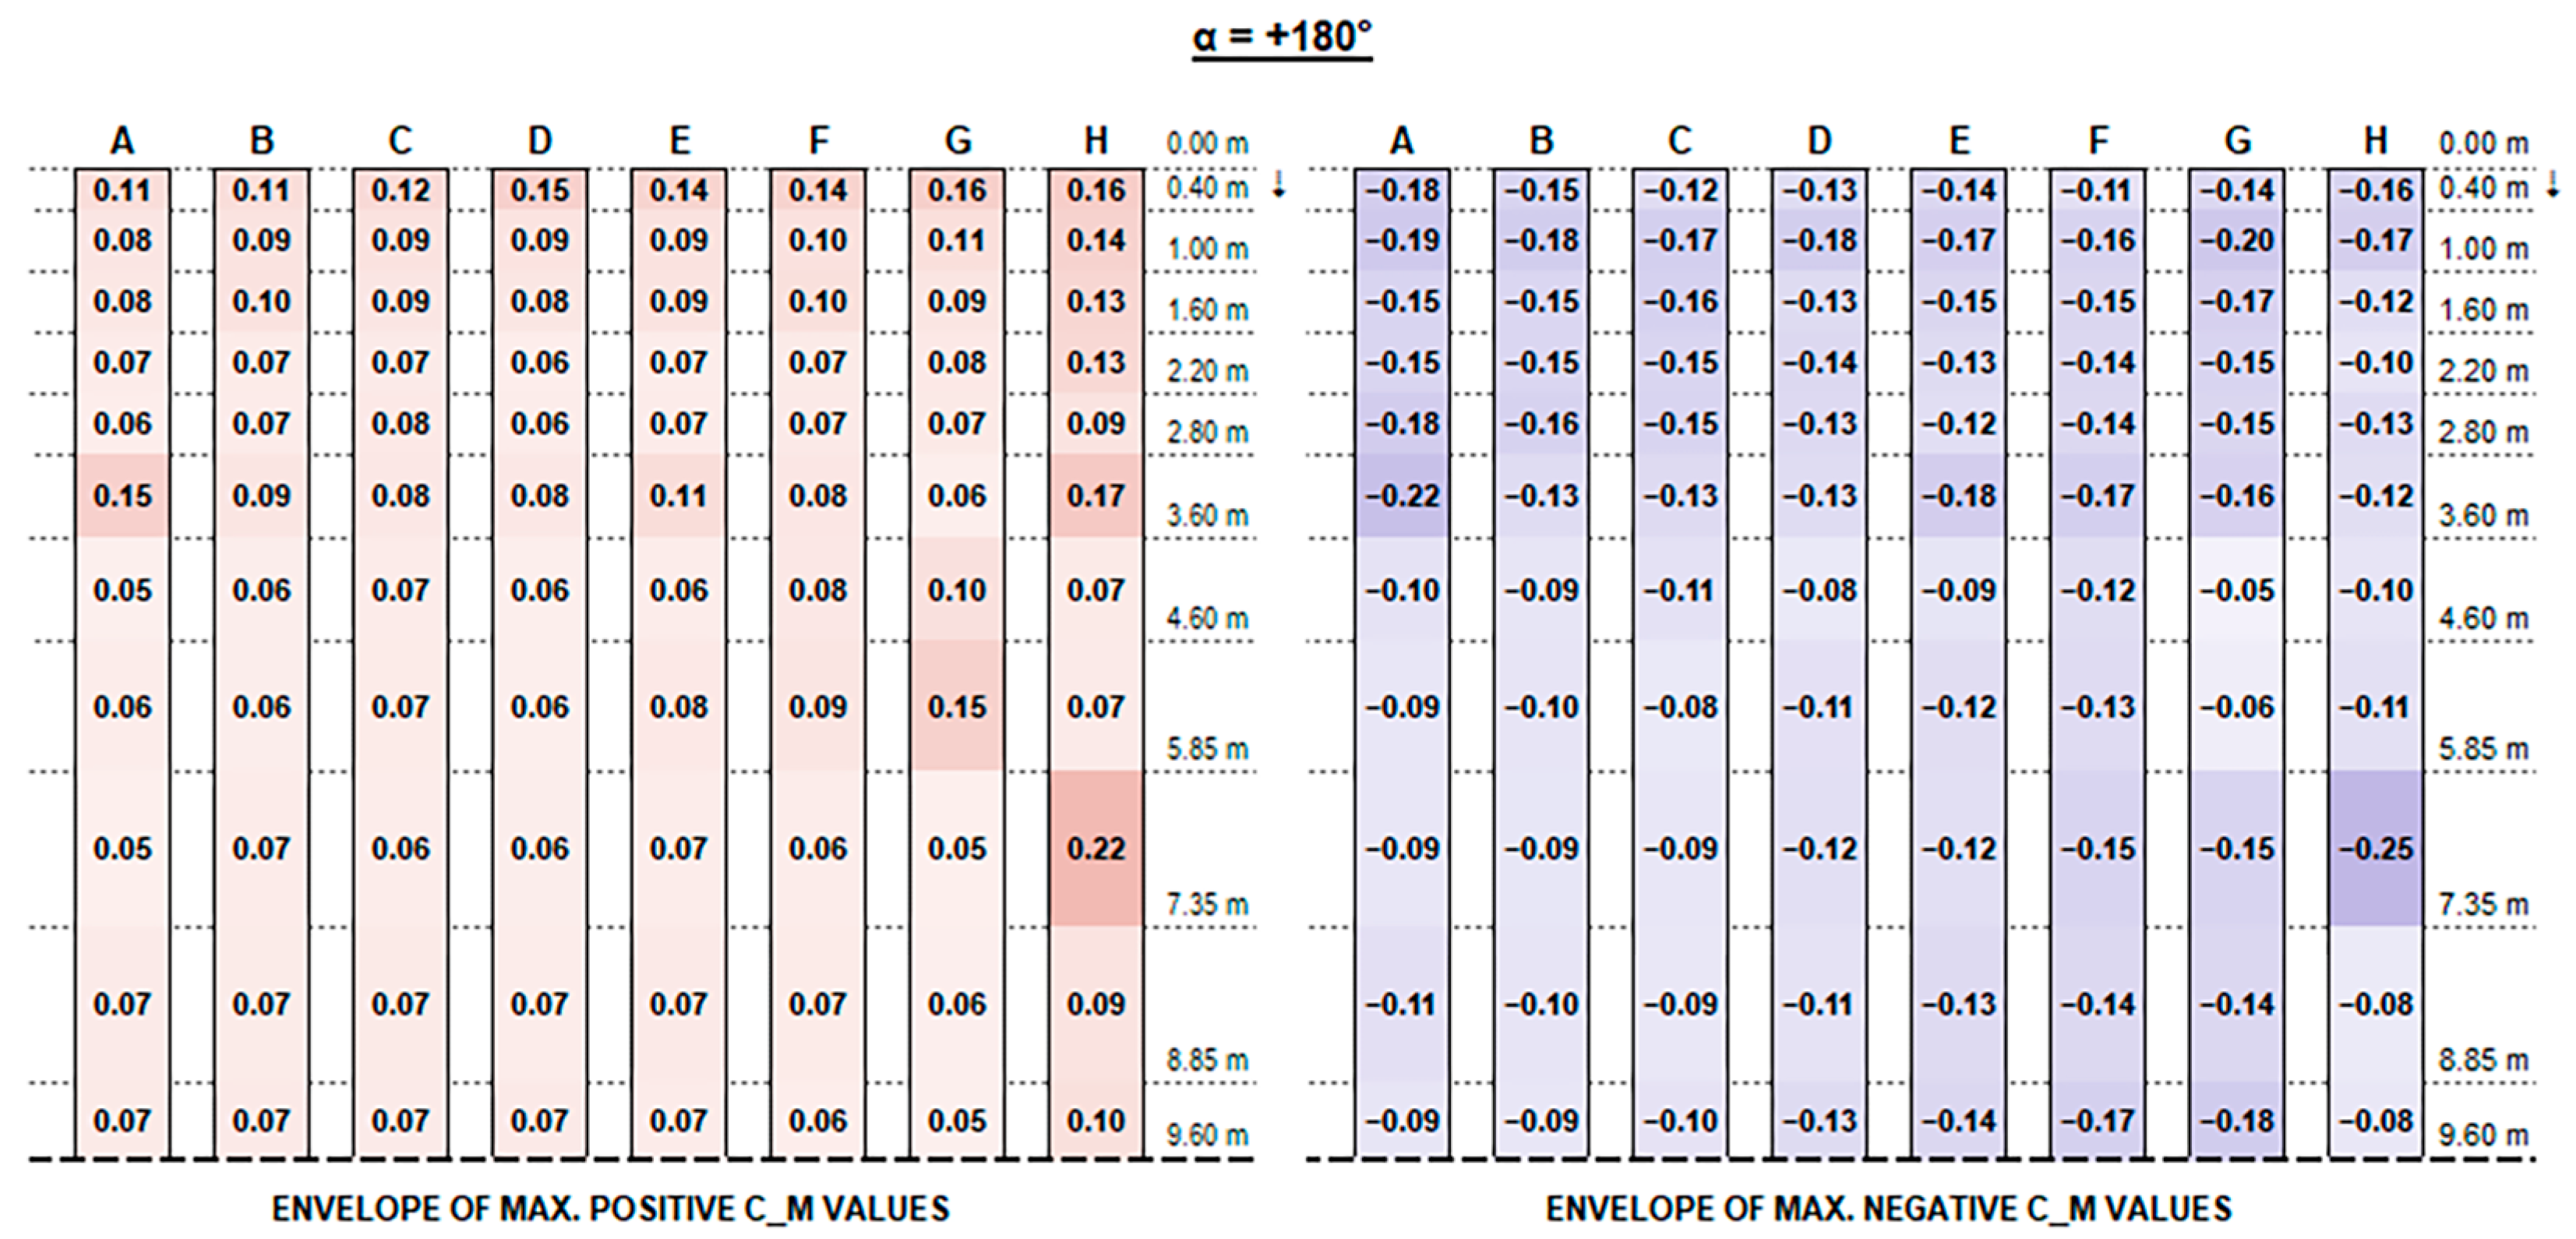
Concerning C
M values, as shown in the charts, the variation trend in different configurations is less noticeable. The high variability is mainly due to the turbulent part of the stream and the vortexes generated by flow deviations that make it difficult to describe. In general, effects are particularly evident for the free ends of each string and for the first and the last rows over their whole length, which are more exposed to the stream turbulence. However, the maximum magnitude of C
M values is fairly small and generally does not exceed 0.70, although slightly exceeding values provided by Eurocode 1 for monopitch canopies (which can be compared to rooftop tilted PV strings), as shown in
Figure 11.
The lower stream blockage on account of the larger bottom clearance results, in case of higher tilt angles, in a reduction and homogenization of the force resultants in the inner part of the strings towards the middle, but seems not to compensate for the greater positive pressure experienced, particularly by the first few rows near the strings’ extremity, while it just provides a slight reduction in the upward negative forces.
Recalling that the results plotted in
Figure A1,
Figure A2,
Figure A3,
Figure A4,
Figure A5,
Figure A6,
Figure A7,
Figure A8,
Figure A9,
Figure A10,
Figure A11,
Figure A12,
Figure A13,
Figure A14,
Figure A15 and
Figure A16 represent, for each configuration, the envelope of C
F and C
M values of all tested wind exposures, fluctuations over the string length are, in general, mainly due to specific wind exposure angles.
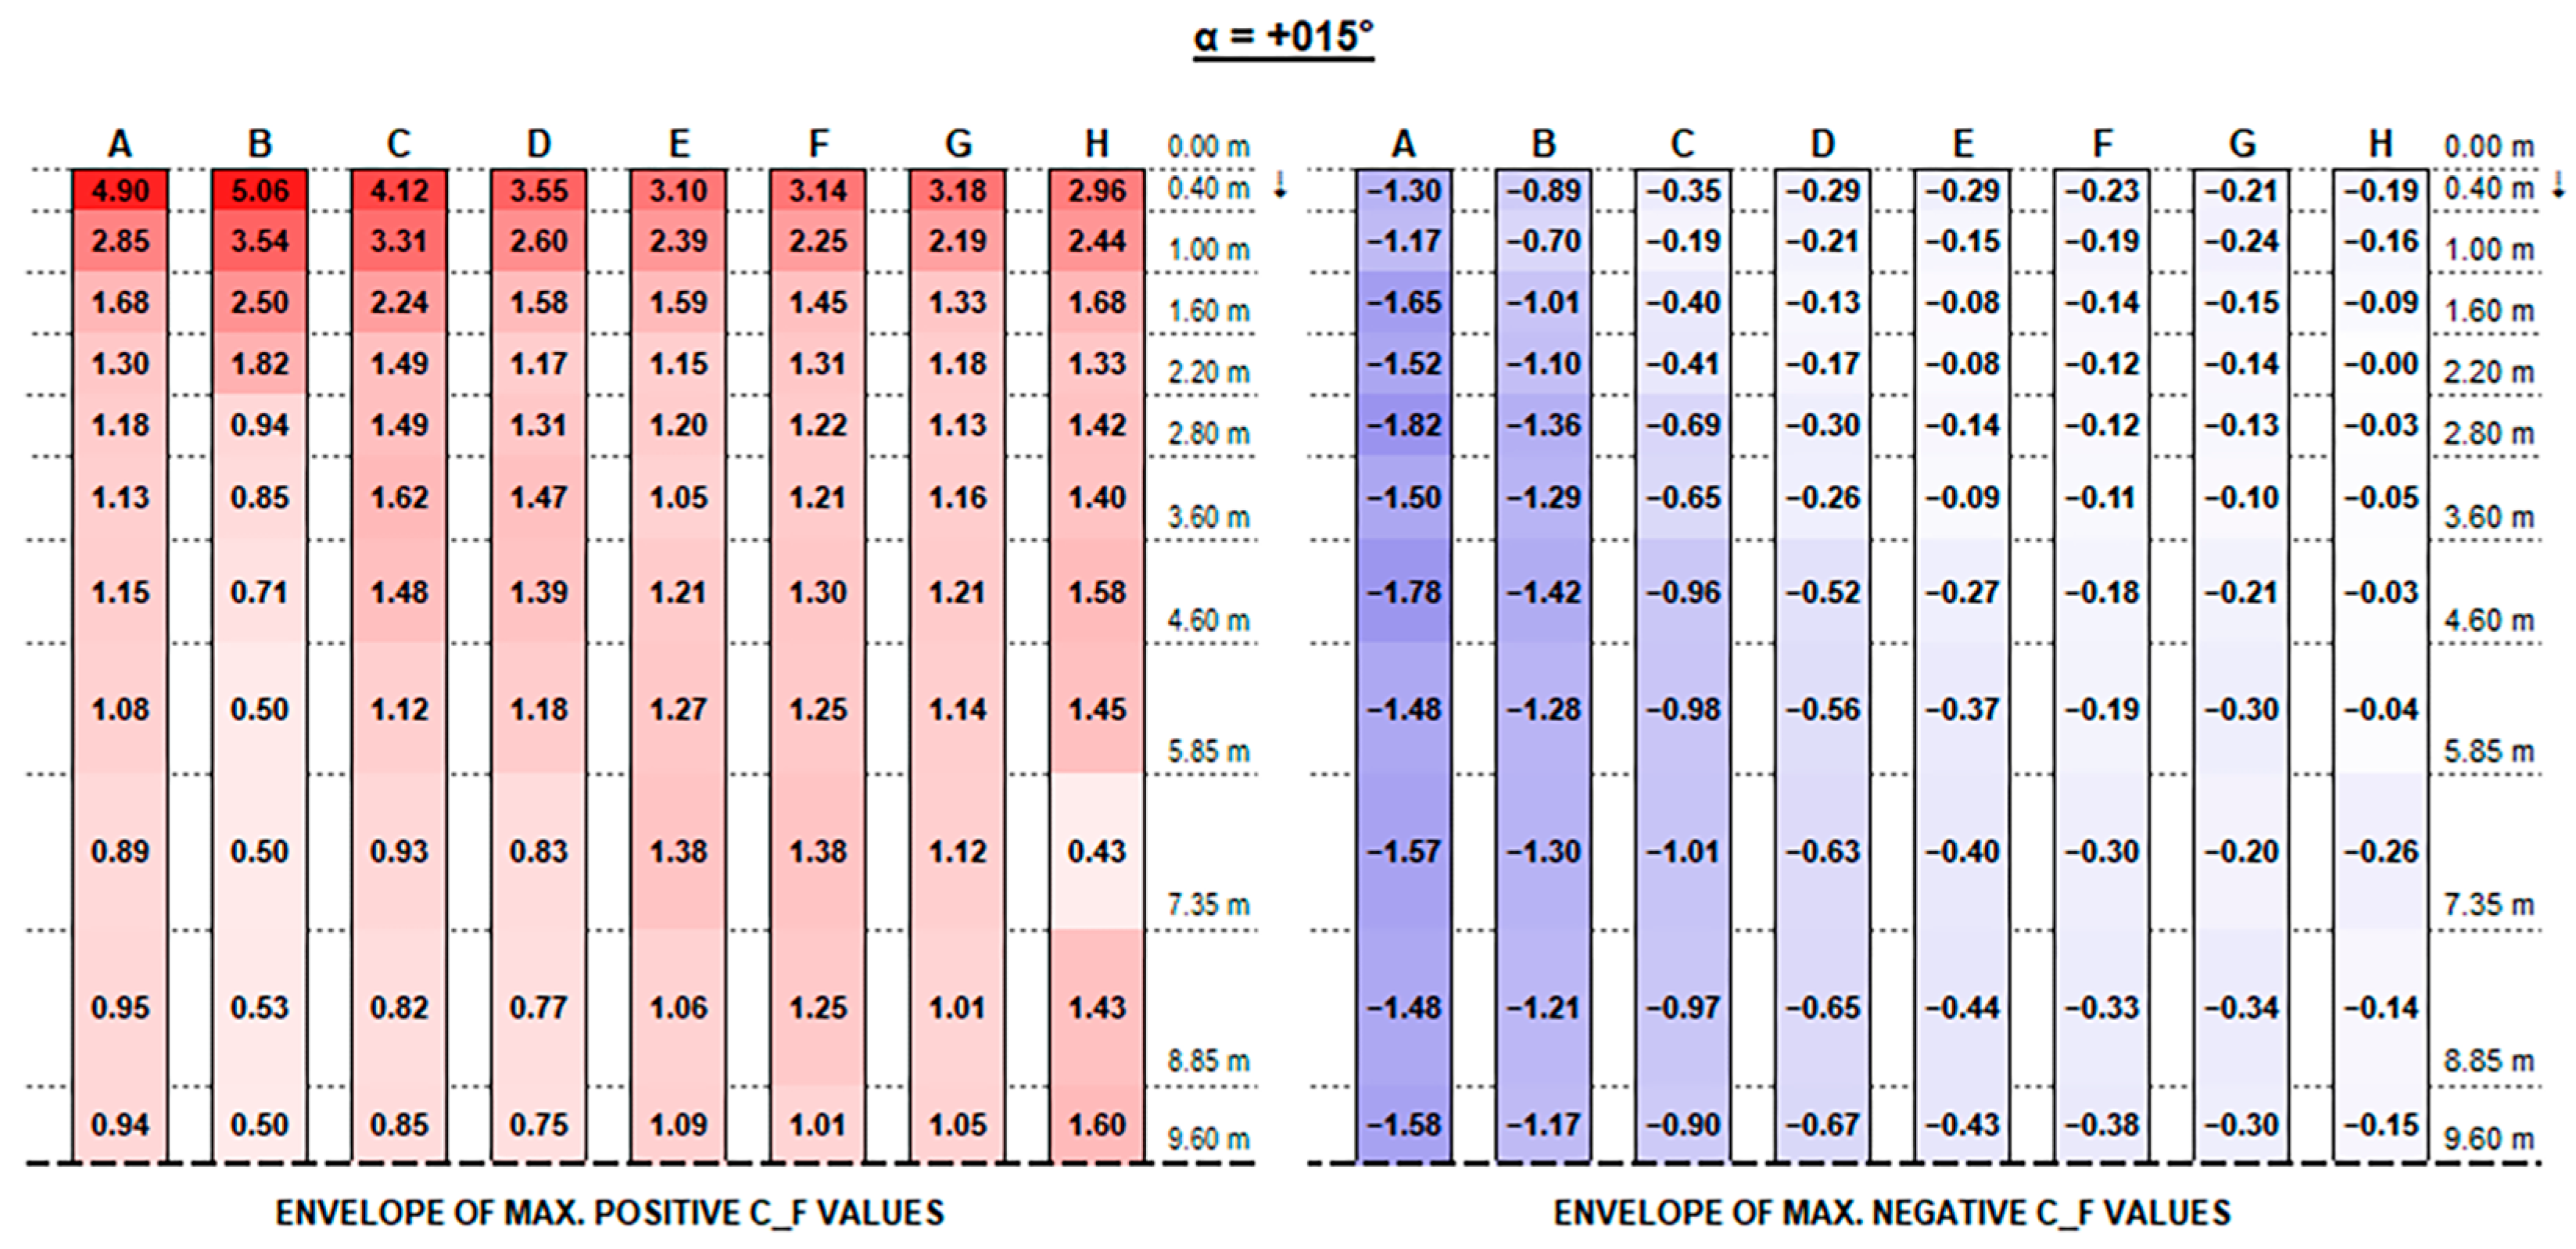
In order to better visualise the influence of wind exposure angle,
Appendix B provides plots of maximum positive/negative C
F and C
M coefficients for each direction angle (α).
Concerning positive values, as expected [
13], oblique wind-direction angles result in the most severe force resultants.
In particular, +15°, +30°, and +45° exposure angles are the most critical (see
Figure A25,
Figure A27 and
Figure A29), where the highest loads in correspondence of the first strings’ (A to D) free ends are given by +30° exposure and the most evident vortex effects are visible on the third and fourth rows for +45° exposure.
Similarly, for negative values, the most critical exposure appears to be an angle of +135°, resulting in maximum negative forces on the last strings (E to H).
4. Discussion and Conclusions
The envelope of wind-load distribution obtained by wind tunnel tests, depicted in
Appendix A, shows a significant difference between mean and peak pressure coefficients over PV strings, reaching up to a 1:4 ratio, and several fluctuations over the strings’ length for certain configurations.
Such a condition suggests the strict need of performing accurate local verifications of PV module brackets, string frames, and frame anchors/ballast which are usually calculated to resist against lower upward and downward forces derived by reference standards.
Alternatively, especially for interventions on existing buildings, PV string support structures shall be appropriately installed in order to distribute and transfer the local overloads to a greater surface area and to a higher number of anchors/ballasts.
It will therefore be the designer’s duty to evaluate the most appropriate configuration to adopt, depending on the PV support structure robustness and how this distributes and transfers the forces to the roof anchors, in order to avoid failures or detachments of PV modules or other roof components. This is particularly needed in the case of underperforming roofing systems (e.g., thin standing seam roofs, lighter support materials), especially in the light of increasingly severe wind events nowadays.
Moreover, it is reasonable to assume that for most roofing systems, the upward forces are the most critical in terms of safety, and therefore should be adopted as a design driver. In this regard, although configurations presenting a higher clearance generally result in higher downward (positive) forces, they are also characterised by lower upward (negative) forces, which is possibly the preferable condition, as it is also safer to avoid airborne debris. This is particularly true for metal roofing systems, very commonly used on large flat roofs, as their anchors generally offer limited pull-off resistance, which is just provided by a thin metal sheet, and a local failure may lead to the whole roof detachment with disastrous outcomes.
The loading patterns discussed above also proved the importance for designers of evaluating different configurations and different wind exposure angles in order to possibly adopt, only where needed, adequate means of wind-load reduction, such as porous fences, flaps, etc.
In conclusion, for the integration of tilted PV strings on large, flat roofs, particularly in sites presenting significant wind speeds, designers are recommended to refer to wind tunnel tests results to derive suitable pressure coefficients or force/moment coefficients, both for the global and local verification of string components and roof anchors.


