
The Impact of the Spatial Mobility of Marine New Qualitative Productivity Force Factors on the Coordinated Development of China’s Marine Economy


Abstract
1. Introduction
2. Internal Mechanism Analysis
2.1. Local Effects
2.2. Spatial Spillover Effect
2.3. Spatial Effects of Heterogeneous Marine Productivity Flows
3. Materials and Methods
3.1. Empirical Model Construction
3.2. Variable Selection
3.2.1. Dependent Variable: Coordinated Development of China’s Marine Economy
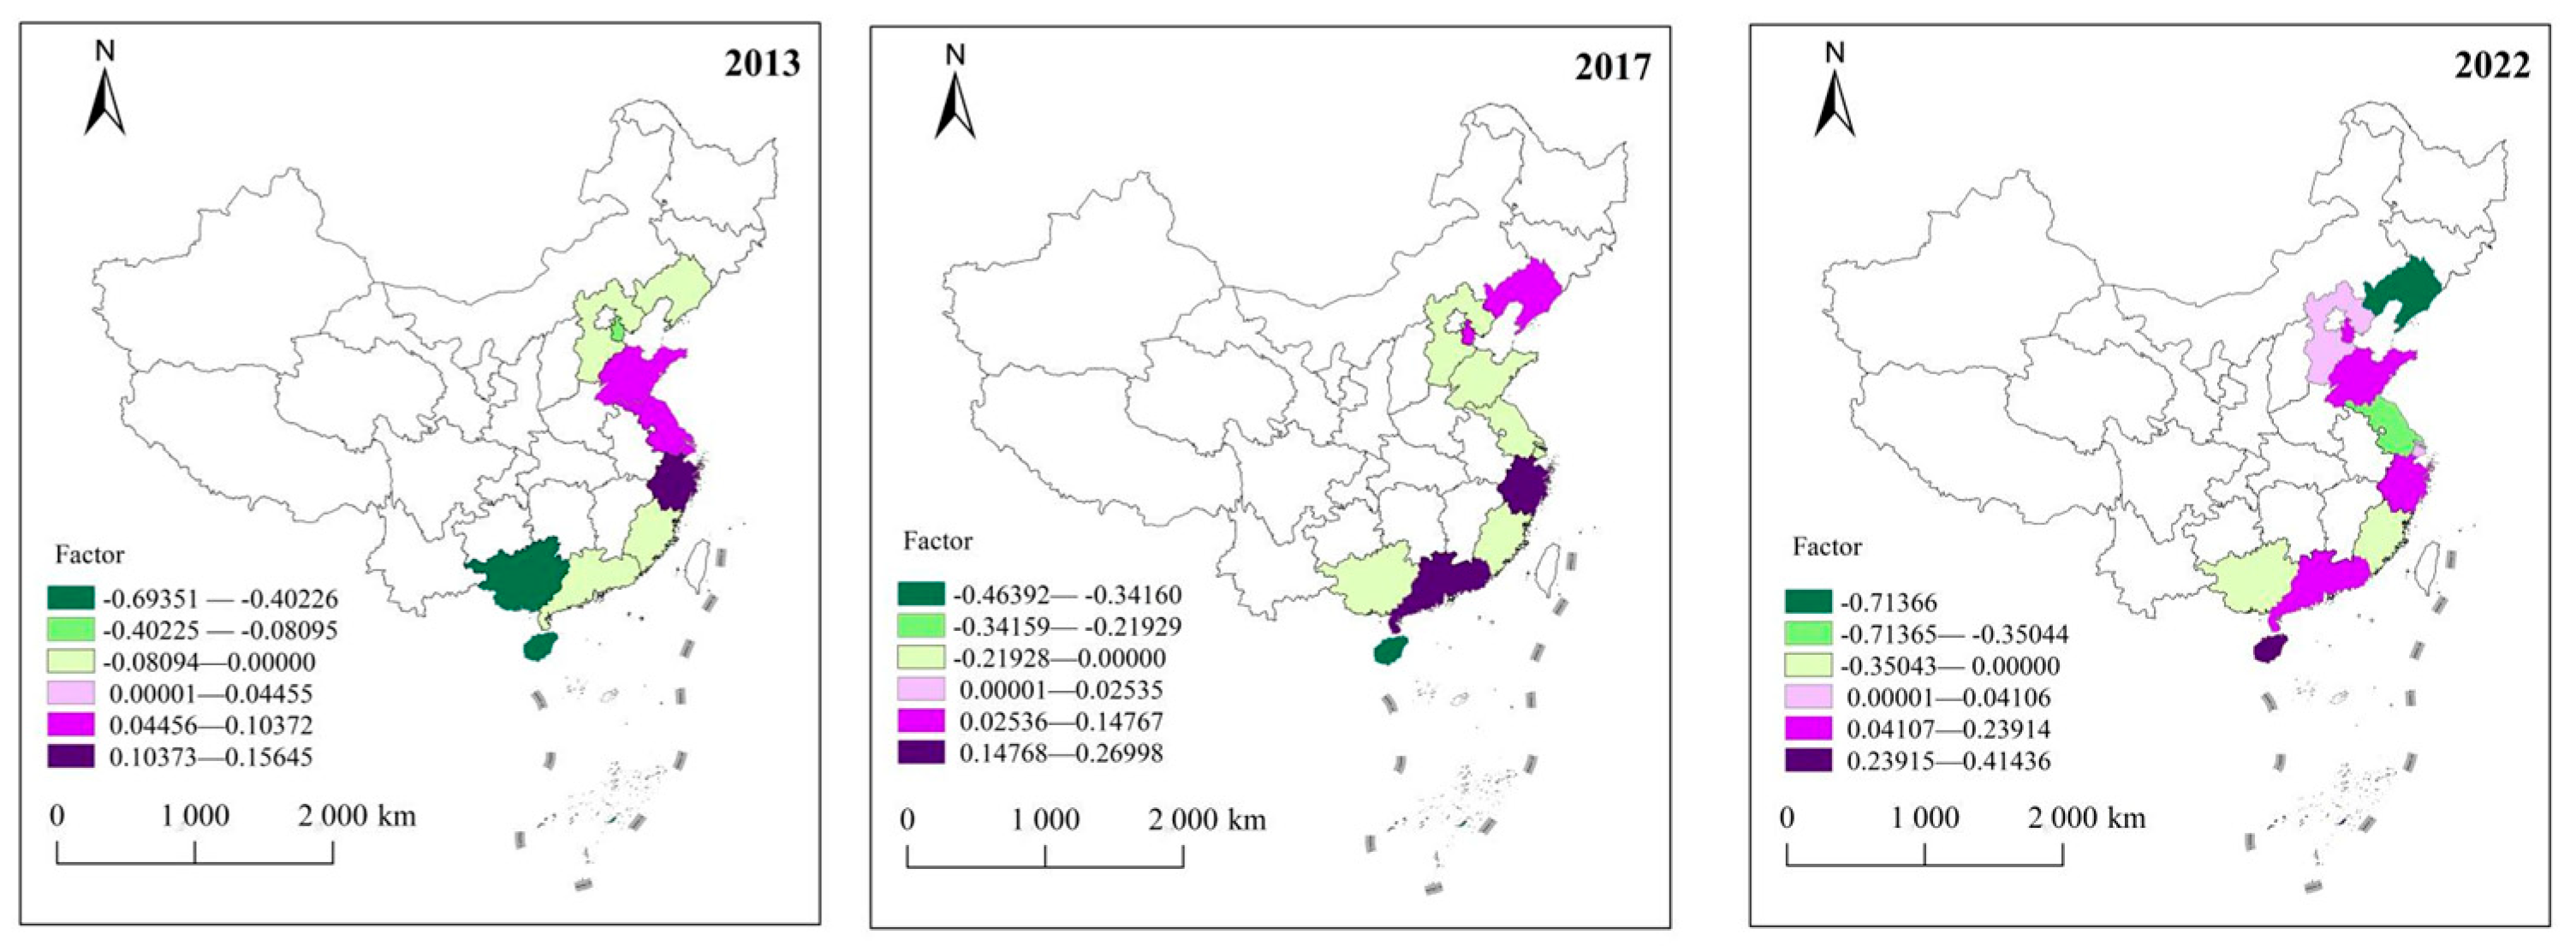
3.2.2. Core Independent Variable: Marine New Qualitative Productivity Forces
3.2.3. Control Variables
3.3. Data Sources and Descriptive Statistics
4. Empirical Results
4.1. Spatial Effect Analysis
4.1.1. Spatial Correlation Analysis
4.1.2. Spatial Markov Chain Analysis
4.1.3. Selection of Spatial Econometric Model
4.1.4. Test of the Spatial Durbin Model
4.2. Robustness Checks
4.3. Further Analysis
5. Discussion
6. Conclusions and Recommendations
6.1. Conclusions
6.2. Recommendations
Author Contributions
Funding
Institutional Review Board Statement
Informed Consent Statement
Data Availability Statement
Conflicts of Interest
References
- Xi, J.P. Developing new-quality productive forces is an essential requirement and a crucial focus for advancing high-quality development. Qiushi 2024, 4–8. (In Chinese) [Google Scholar]
- Du, D. Continuously improve the systematic, holistic, and synergistic aspects of advancing high-quality development. Chin. Qual. 2023, 17–19. (In Chinese) [Google Scholar] [CrossRef]
- Guangming Daily. Available online: https://news.gmw.cn/2024-02/22/content_37158384.htm (accessed on 4 May 2025).
- Zhang, K.Y. Promote Coordinated Regional Economic Development by Optimizing New-Quality Productive Forces Allocation. New Urban. 2024, 12. (In Chinese) [Google Scholar]
- Fang, C.L.; Sun, B. The connotation of new-quality productive forces and research priorities for driving urban-rural integrated development from the geographical perspective. Acta Geogr. Sin. 2024, 79, 1357–1370. (In Chinese) [Google Scholar]
- Liu, S.G. Strategic Research on Building the National Marine Innovation System; China Finance & Economy Media Group Press: Beijing, China, 2017. [Google Scholar]
- People’s Daily. Available online: https://www.gov.cn/gongbao/content/2019/content_5407653.htm (accessed on 1 May 2025).
- Smith, A. The Wealth of Nations: An Inquiry into the Nature and Causes of the Wealth of Nations; W. Strahan & T. Cadel Press: London, UK, 1776. [Google Scholar]
- Marx, K.H. Critique of political Economy; Franz Duncker Press: Berlin, Germany, 1859; Volume 1. [Google Scholar]
- Perroux, F. The Economy of the 20th Century; PUF: Parris, France, 1961. [Google Scholar]
- Krugman, P.R. Increasing returns and economic geography. J. Polit. Econ. 1991, 99, 483–499. [Google Scholar] [CrossRef]
- Schumpeter, J. The Theory of Economic Development; Harvard University Press: Cambridge, MA, USA, 1912. [Google Scholar]
- Xi, J.P. Navigating the New Frontier of High-Quality Development in China. Qiushi 2024, 4–15. (In Chinese) [Google Scholar]
- Feng, Y.; Zhang, S.Y. Exploring new-quality productive forces in ocean governance: Insights from China’s practices and strategic direction. Mar. Policy 2025, 176, 106656. [Google Scholar] [CrossRef]
- Fan, J. Regional Coordinated Development and Its Economic Geography Principles during the 14th Five-Year Plan and the 15th Five-Year Plan Periods. Econ. Geogr. 2025, 45, 1–7. (In Chinese) [Google Scholar] [CrossRef]
- Wang, X.L.; Fan, G. Analysis on the Regional Disparity in China and the Influential Factors. Econ. Res. J. 2004, 1, 33–44. (In Chinese) [Google Scholar]
- Guo, J.; Yuan, X.T.; Song, W.L. Driving forces on the development of China’s marine economy: Efficiency and spatial perspective. Ocean Coast. Manag. 2022, 224, 106192. [Google Scholar] [CrossRef]
- Xu, J.R.; Tian, J.; Liu, Y.J. The study of coevolution relationship among coastal marine economy, innovation, and ecology based on Chinese complex systems. Financ. Res. Lett. 2024, 65, 105549. [Google Scholar] [CrossRef]
- Tartaruga, I.; Sperotto, F.; Carvalho, L. Addressing inclusion, innovation, and sustainability challenges through the lens of economic geography: Introducing the hierarchical regional innovation system. Geogr. Sustain. 2024, 5, 1–12. [Google Scholar] [CrossRef]
- Gao, S.; Sun, H.H.; Wang, J.Y.; Liu, W. Evaluation and Countermeasures of High-Quality Development of China’s Marine Economy Based on PSO-SVM. Sustainability 2022, 14, 10749. [Google Scholar] [CrossRef]
- Feng, R.; Chen, S.; Dai, D.D.; Xin, Y.R. Examining the spatiotemporal evolution, dynamic convergence and drivers of green total factor productivity in China’s urban agglomerations. Econ. Anal. Policy 2023, 78, 744–764. [Google Scholar] [CrossRef]
- Xu, S.; Liu, Y.H. Research on the impact of carbon finance on the green transformation of China’s marine industry. J. Clean. Prod. 2023, 418, 138143. [Google Scholar] [CrossRef]
- Duranton, G.; Puga, D. Chapter 48—Micro-Foundations of Urban Agglomeration Economies. In Handbook of Regional and Urban Economics; Elsevier: Amsterdam, The Netherlands, 2004; Volume 4, pp. 2063–2117. [Google Scholar] [CrossRef]
- Hao, D.J.; Zhang, R. Factor Endowments, Agglomeration Effects, and the Transition of Economic Growth Dynamics. Economist 2018, 1, 41–49. (In Chinese) [Google Scholar] [CrossRef]
- Ethier, W.J. National and International Returns to Scale in the Modern Theory of International Trade. Am. Econ. Rev. 1982, 72, 389–405. [Google Scholar]
- Wang, B.D.; Su, J. Can the Free Flow of Factors Lead to Regional Coordinated Development? A Theoretical Hypothesis and Empirical Test Based on “Coordinated Agglomeration”. Financ. Trade Econ. 2020, 41, 129–143. (In Chinese) [Google Scholar] [CrossRef]
- Sun, C.Z.; Lisng, Z.H.; Zhai, X.Q.; Wang, L.J. Obstacles to the development of China’s marine economy: Total factor productivity loss from resource mismatch. Ocean Coast. Manag. 2024, 249, 107009. [Google Scholar] [CrossRef]
- Tombe, T.; Zhu, X.D. Trade, Migration, and Productivity: A Quantitative Analysis of China. Am. Econ. Rev. 2019, 109, 1843–1872. [Google Scholar] [CrossRef]
- Sun, T.; Bian, X.Z.; Liu, J.X.; Wang, R.; Sriboonchitta, S. The economic and social effects of skill mismatch in China: A DSGE model with skill and firm heterogeneity. Econ. Model. 2023, 125, 106345. [Google Scholar] [CrossRef]
- Fan, H.C.; Ding, G.Z.; Zhang, L.N. External Economic and Trade Shocks, Domestic Factor Mobility and China’s Economic Growth. Econ. Res. J. 2024, 59, 151–169. (In Chinese) [Google Scholar]
- Ma, S.J.; Wang, R.S. The social-economic-Natural Complex Ecosystem. Econ. Res. J. 1984, 4, 1–9. (In Chinese) [Google Scholar]
- Wang, Y.; Hu, J.F.; Pan, H.; Li, S.Y.; Failler, P. An integrated model for marine fishery management in the Pearl River Estuary: Linking socio-economic systems and ecosystems. Mar. Policy 2016, 64, 135–147. [Google Scholar] [CrossRef]
- Lloret, J.; Riera, V. Evolution of a Mediterranean Coastal Zone: Human Impacts on the Marine Environment of Cape Creus. Environ. Manag. 2008, 42, 977–998. [Google Scholar] [CrossRef] [PubMed]
- Simeoni, C.; Furlan, E.; Pham, H.V.; Critto, A.; Juan, S.D.; Trégarot, E.; Cornet, C.C.; Meesters, E.; Fonseca, C.; Botelho, B.Z.; et al. Evaluating the combined effect of climate and anthropogenic stressors on marine coastal ecosystems: Insights from a systematic review of cumulative impact assessment approaches. Sci. Total Environ. 2023, 861, 160687. [Google Scholar] [CrossRef]
- Liu, S.G.; Xu, Y.J.; Wang, J.Y. Relationship between river basin economic system opening-up and sustainable development: International experiences and implications for the Yellow River Basin high-quality development. Resour. Sci. 2020, 42, 433–445. (In Chinese) [Google Scholar] [CrossRef]
- Fernandes, M.; Larruga, F.; Alves, F.L. Spatial characterization of marine socio-ecological systems: A Portuguese case study. J. Clean. Prod. 2022, 363, 132381. [Google Scholar] [CrossRef]
- Fang, X.H.; Zhang, Y.; Yang, J.J.; Zhan, G.H. An evaluation of marine economy sustainable development and the ramifications of digital technologies in China coastal regions. Econ. Anal. Policy 2024, 82, 554–570. [Google Scholar] [CrossRef]
- Zeng, P.; Qin, Y.H.; Zhou, L.C. Measurement and spatiotemporal pattern of new-quality productive forces level in Chinese cities. Prog. Geogr. 2024, 43, 1102–1117. [Google Scholar]
- Dai, S.Y.; Che, B.A. Study on the Level of New-Quality Productive Forces and Influencing Factors in China’s Coastal Areas Based on TOPSIS-Integrated Learning Model. Ocean Dev. Manag. 2024, 41, 47–59. (In Chinese) [Google Scholar] [CrossRef]
- Zhao, X.L.; Yin, H.T. Industrial relocation and energy consumption: Evidence from China. Energ. Policy 2011, 39, 2944–2956. [Google Scholar] [CrossRef]
- Sun, X.H.; Guo, X.; Wang, J. Industrial Relocation, Elements Agglomeration and Regional Economic Development. J. Manag. World 2018, 34, 47–62. (In Chinese) [Google Scholar] [CrossRef]
- Ji, J.Y.; Liu, H.M.; Yin, X.M. Evaluation and regional differences analysis of the marine industry development level: The Case of China. Mar. Policy 2023, 148, 105445. [Google Scholar] [CrossRef]
- Harris, J.L.; Sunley, P. Multi-system dynamics in regional path upgrading: The intra- and inter-path dynamics of green industrial transitions in the Solent marine and maritime pathway. Prog. Econ. Geog. 2023, 1, 100005. [Google Scholar] [CrossRef]
- Nwani, C.; Omoke, P.C. Investing in the blue economy: Socioeconomic dynamics in the impact of government expenditure on marine ecosystem sustainability in Nigeria. Mar. Policy 2025, 178, 106701. [Google Scholar] [CrossRef]
- Wang, S.H.; Lu, B.B.; Yin, K.D. Financial development, productivity, and high-quality development of the marine economy. Mar. Policy 2021, 130, 104553. [Google Scholar] [CrossRef]
- Cadogan, J.W.; Souchon, A.L.; Procter, D.B. The quality of market-oriented behaviors: Formative index construction. J. Bus. Res. 2008, 61, 1263–1277. [Google Scholar] [CrossRef]
- Shan, H.J. Reestimating the Capital Stock of China: 1952–2006. J. Quant. Technol. Econ. 2008, 25, 17–31. (In Chinese) [Google Scholar]
- Fu, Y.; Ni, J.C.; Fang, M.W. The impact of artificial intelligence on digital enterprise innovation. J. Clean Prod. 2025, 36, 200538. [Google Scholar] [CrossRef]
- Wu, R.H.; Wang, W.; Yang, L.H.; Wu, Y. Regional Gaps, Spatial Distribution Patterns, and Evolutionary Trends of Marine New-Quality Productivity in China. Water 2025, 17, 1266–1275. [Google Scholar] [CrossRef]
- Yin, K.D.; Zhang, K.; Huang, C. Institutional supply, market cultivation, and the development of marine strategic emerging industries. Mar. Policy 2022, 139, 105045. [Google Scholar] [CrossRef]
- Porter, M.E. The Competitive Advantage of Nations; Free Press: New York, NY, USA, 1990. [Google Scholar]
- Fang, K.; Zhou, Y.H.; Wang, S.; Ye, R.; Guo, S.J. Assessing national renewable energy competitiveness of the G20: A revised Porter’s Diamond Model. Renew. Sustain. Energy Rev. 2018, 93, 719–731. [Google Scholar] [CrossRef]
- Jafeetal, A.B.; Palmer, J.K. Environmental regulation and innovation: A panel data study. Rev. Econ. Stat. 1997, 7, 610–619. [Google Scholar]
- Markou, M. Corporate Social Responsibility and Environmental Sustainability: Drivers for CSR and Sustainability Trends in the Shipping Industry. Master’s Dissertation, University of Piraeus, Pireas, Greece, 2024. [Google Scholar] [CrossRef]
- Wiegele, J.; Jones, C. Marine Energy Commercialization Review: Evaluation of the Transition from Public to Private Capital; NREL/TP-5700-912132024; National Renewable Energy Laboratory: Golden, CO, USA, 2024. Available online: https://www.nrel.gov/docs/fy25osti/91213.pdf (accessed on 24 March 2025).
- Sun, Y.; Zhou, Z.L.; Fang, Y.; Bie, M.; Sun, X.G. Analysis of Regional Disparities, Spatiotemporal Evolution and Key Influencing Factors of Marine New Productive Forces in China. Sustainability 2025, 17, 1432. [Google Scholar] [CrossRef]
- Zeng, S.L.; Fu, Q.Y.; Ji, M. Research on the theoretical connotation, realistic basis, challenges and countermeasures of new qualitative productivity forces from the perspective of innovation. J. Shanghai Univ. Int. Bus. Econ. 2024, 31, 49–63. (In Chinese) [Google Scholar] [CrossRef]
- Zheng, H.; Liu, X.D.; Xu, Y.J.; Mu, H.R. Economic Spillover Effects of Industrial Structure Upgrading in China’s Coastal Economic Rims. Sustainability 2021, 13, 3855. [Google Scholar] [CrossRef]
- An, D.; Shen, C.L.; Yang, L. Evaluation and Temporal-Spatial Deconstruction for High-Quality Development of Regional Marine Economy: A Case Study of China. Front. Mar. Sci. 2022, 9, 916662. [Google Scholar] [CrossRef]
- Zeng, S.L.; Shen, Y. New quality productivity and high-quality development of finance: Driving Logic and Implementation Path. J. Fujian Agric. For. Univ. 2024, 176, 17–26. (In Chinese) [Google Scholar] [CrossRef]
- Fan, J.; Chen, D.; Li, J.M.; Guo, R.; Chen, Z. Regional characteristics and layout laws of new-quality productive forces: A study on developing new-quality productive forces according to local conditions from a geographical perspective. Sci. Geogr. Sin. 2025, 45, 47–60. (In Chinese) [Google Scholar]
- Chiara, P.; Bearzi, G.; Christensen, V. Effects of local fisheries and ocean productivity on the northeastern Ionian Sea ecosystem. Ecol. Model. 2010, 221, 1526–1544. [Google Scholar] [CrossRef]
- Xu, Y.J.; Liao, X.C.; He, R.F.; Liu, S.G. Impact of environmental regulation intensity on the efficiency of sustainable economic growth in the European Union. J. Clean. Prod. 2024, 434, 140047. [Google Scholar] [CrossRef]


| Criteria Layer | Factor Layer | Indicator Layer | Attribute | Weight |
|---|---|---|---|---|
| Marine economic subsystem | Overall economic scale | Per capita marine GDP (CNY 108 per 104 persons) | + | 0.03139 |
| Land–sea economic linkage (%) | + | 0.03173 | ||
| Marine GDP growth rate (%) | + | 0.00549 | ||
| Economic structure | Share of marine tertiary sector (%) | + | 0.00639 | |
| Share of marine secondary sector (%) | + | 0.00619 | ||
| Share of marine primary sector (%) | − | 0.00939 | ||
| Economic vitality | Marine economic elasticity coefficient (%) | + | 0.00881 | |
| Per capita retail sales (CNY 104 per person) | + | 0.02435 | ||
| Marine labor productivity (%) | + | 0.02157 | ||
| R&D expenditure in marine institutes (CNY 104) | + | 0.06335 | ||
| External economic connectivity | Coastal import–export volume (CNY 104) | + | 0.04857 | |
| Coastal FDI (USD 104) | + | 0.06032 | ||
| Coastal overseas engineering contracts (USD 104) | + | 0.04173 | ||
| International tourism revenue (USD 106) | + | 0.05160 | ||
| Marine ecological subsystem | Ecological pressure | SO2 emissions per marine output (t per CNY 108) | − | 0.00281 |
| NOx emissions per marine output (t per CNY 108) | − | 0.00262 | ||
| Wastewater discharge per marine output (t per CNY 108) | − | 0.00515 | ||
| Ecological state | Per capita green space in coastal areas (m2 per person) | + | 0.01157 | |
| Per capita seafood yield (t per 104 persons) | + | 0.04578 | ||
| National marine parks (count) | + | 0.04753 | ||
| National nature reserves (103 ha) | + | 0.03687 | ||
| A-level tourist attractions (count) | + | 0.03370 | ||
| Ecological response | Coastal environmental protection expenditure (CNY 108) | + | 0.03160 | |
| Pollution control investment (% of GDP) | − | 0.00473 | ||
| Marine social subsystem | Social demographics | Coastal population (104 persons) | + | 0.02882 |
| Marine-related employment (104 persons) | + | 0.04493 | ||
| Quality of life | Per capita disposable income (CNY per person) | + | 0.01880 | |
| Infrastructure density (km per km2) | + | 0.01718 | ||
| Engel’s coefficient (%) | − | 0.01086 | ||
| Scientific and technological outputs | R&D projects in marine institutes (count) | + | 0.04703 | |
| Publications from marine institutes (count) | + | 0.04421 | ||
| Marine-related education | Output of marine strategic industries (CNY 108) | − | 0.06668 | |
| Master’s programs in marine fields (count) | + | 0.03072 | ||
| Marine research institutes (count) | + | 0.02247 | ||
| Per capita library collections in coastal areas (volumes per person) | + | 0.03508 |
| Criteria Layer | Factor Layer | Indicator Layer | Attribute |
|---|---|---|---|
| New-type marine laborers | Full-time equivalent (FTE) of practitioners | Marine-related employment (persons) | + |
| R&D personnel in marine research institutions (persons) | + | ||
| Talent pool capacity | Number of marine-related PhD graduates (persons) | + | |
| Number of marine-related master’s graduates (persons) | + | ||
| Number of marine-related bachelor’s graduates (persons) | + | ||
| New-type marine means of labor | Digitalization | Enterprise data utilization frequency (times) | + |
| Internet broadband access ports (104 units) | + | ||
| Advanced technology | Patents granted to marine research institutions (count) | + | |
| Robot-related patents granted to listed companies (count) | + | ||
| New-type marine objects of labor | New-type services | Postal and telecommunications revenue in coastal areas (CNY 108) | + |
| International container throughput in coastal ports (104 TEU) | + | ||
| Funding for aquaculture technology extension (CNY 104) | + | ||
| New qualitative productivity industries | Marine capital stock (CNY 108) | + | |
| Output of distant-water fisheries (tons) | + | ||
| Total FDI in coastal enterprises (USD 106) | + | ||
| Number of AI enterprises in coastal regions (count) | + |
| Variable Type | Variable Symbol | Variable Description | Obs. | Mean | Std. Dev. | Min | Max |
|---|---|---|---|---|---|---|---|
| Dependent variable | MECD | Coordinated development of China’s marine economy | 110 | 0.347 | 0.179 | 0.107 | 0.748 |
| Core explanatory variable | FACTOR | Spatial flow level of marine new qualitative productivity factors | 110 | −0.025 | 0.222 | −0.714 | 0.416 |
| Control variables | Ln GOP | Level of regional marine economic development | 110 | 8.536 | 0.834 | 6.784 | 9.869 |
| IND | Industrialization level | 110 | 0.328 | 0.083 | 0.100 | 0.434 | |
| RD | R&D intensity | 110 | 0.023 | 0.011 | 0.005 | 0.047 | |
| FIN | Financial development level | 110 | 3.501 | 1.158 | 1.279 | 6.616 | |
| MAR | Marketization degree | 110 | 9.614 | 1.680 | 5.943 | 12.864 |
| Year | Moran’s I | Z-Values | Year | Moran’s I | Z-Values |
|---|---|---|---|---|---|
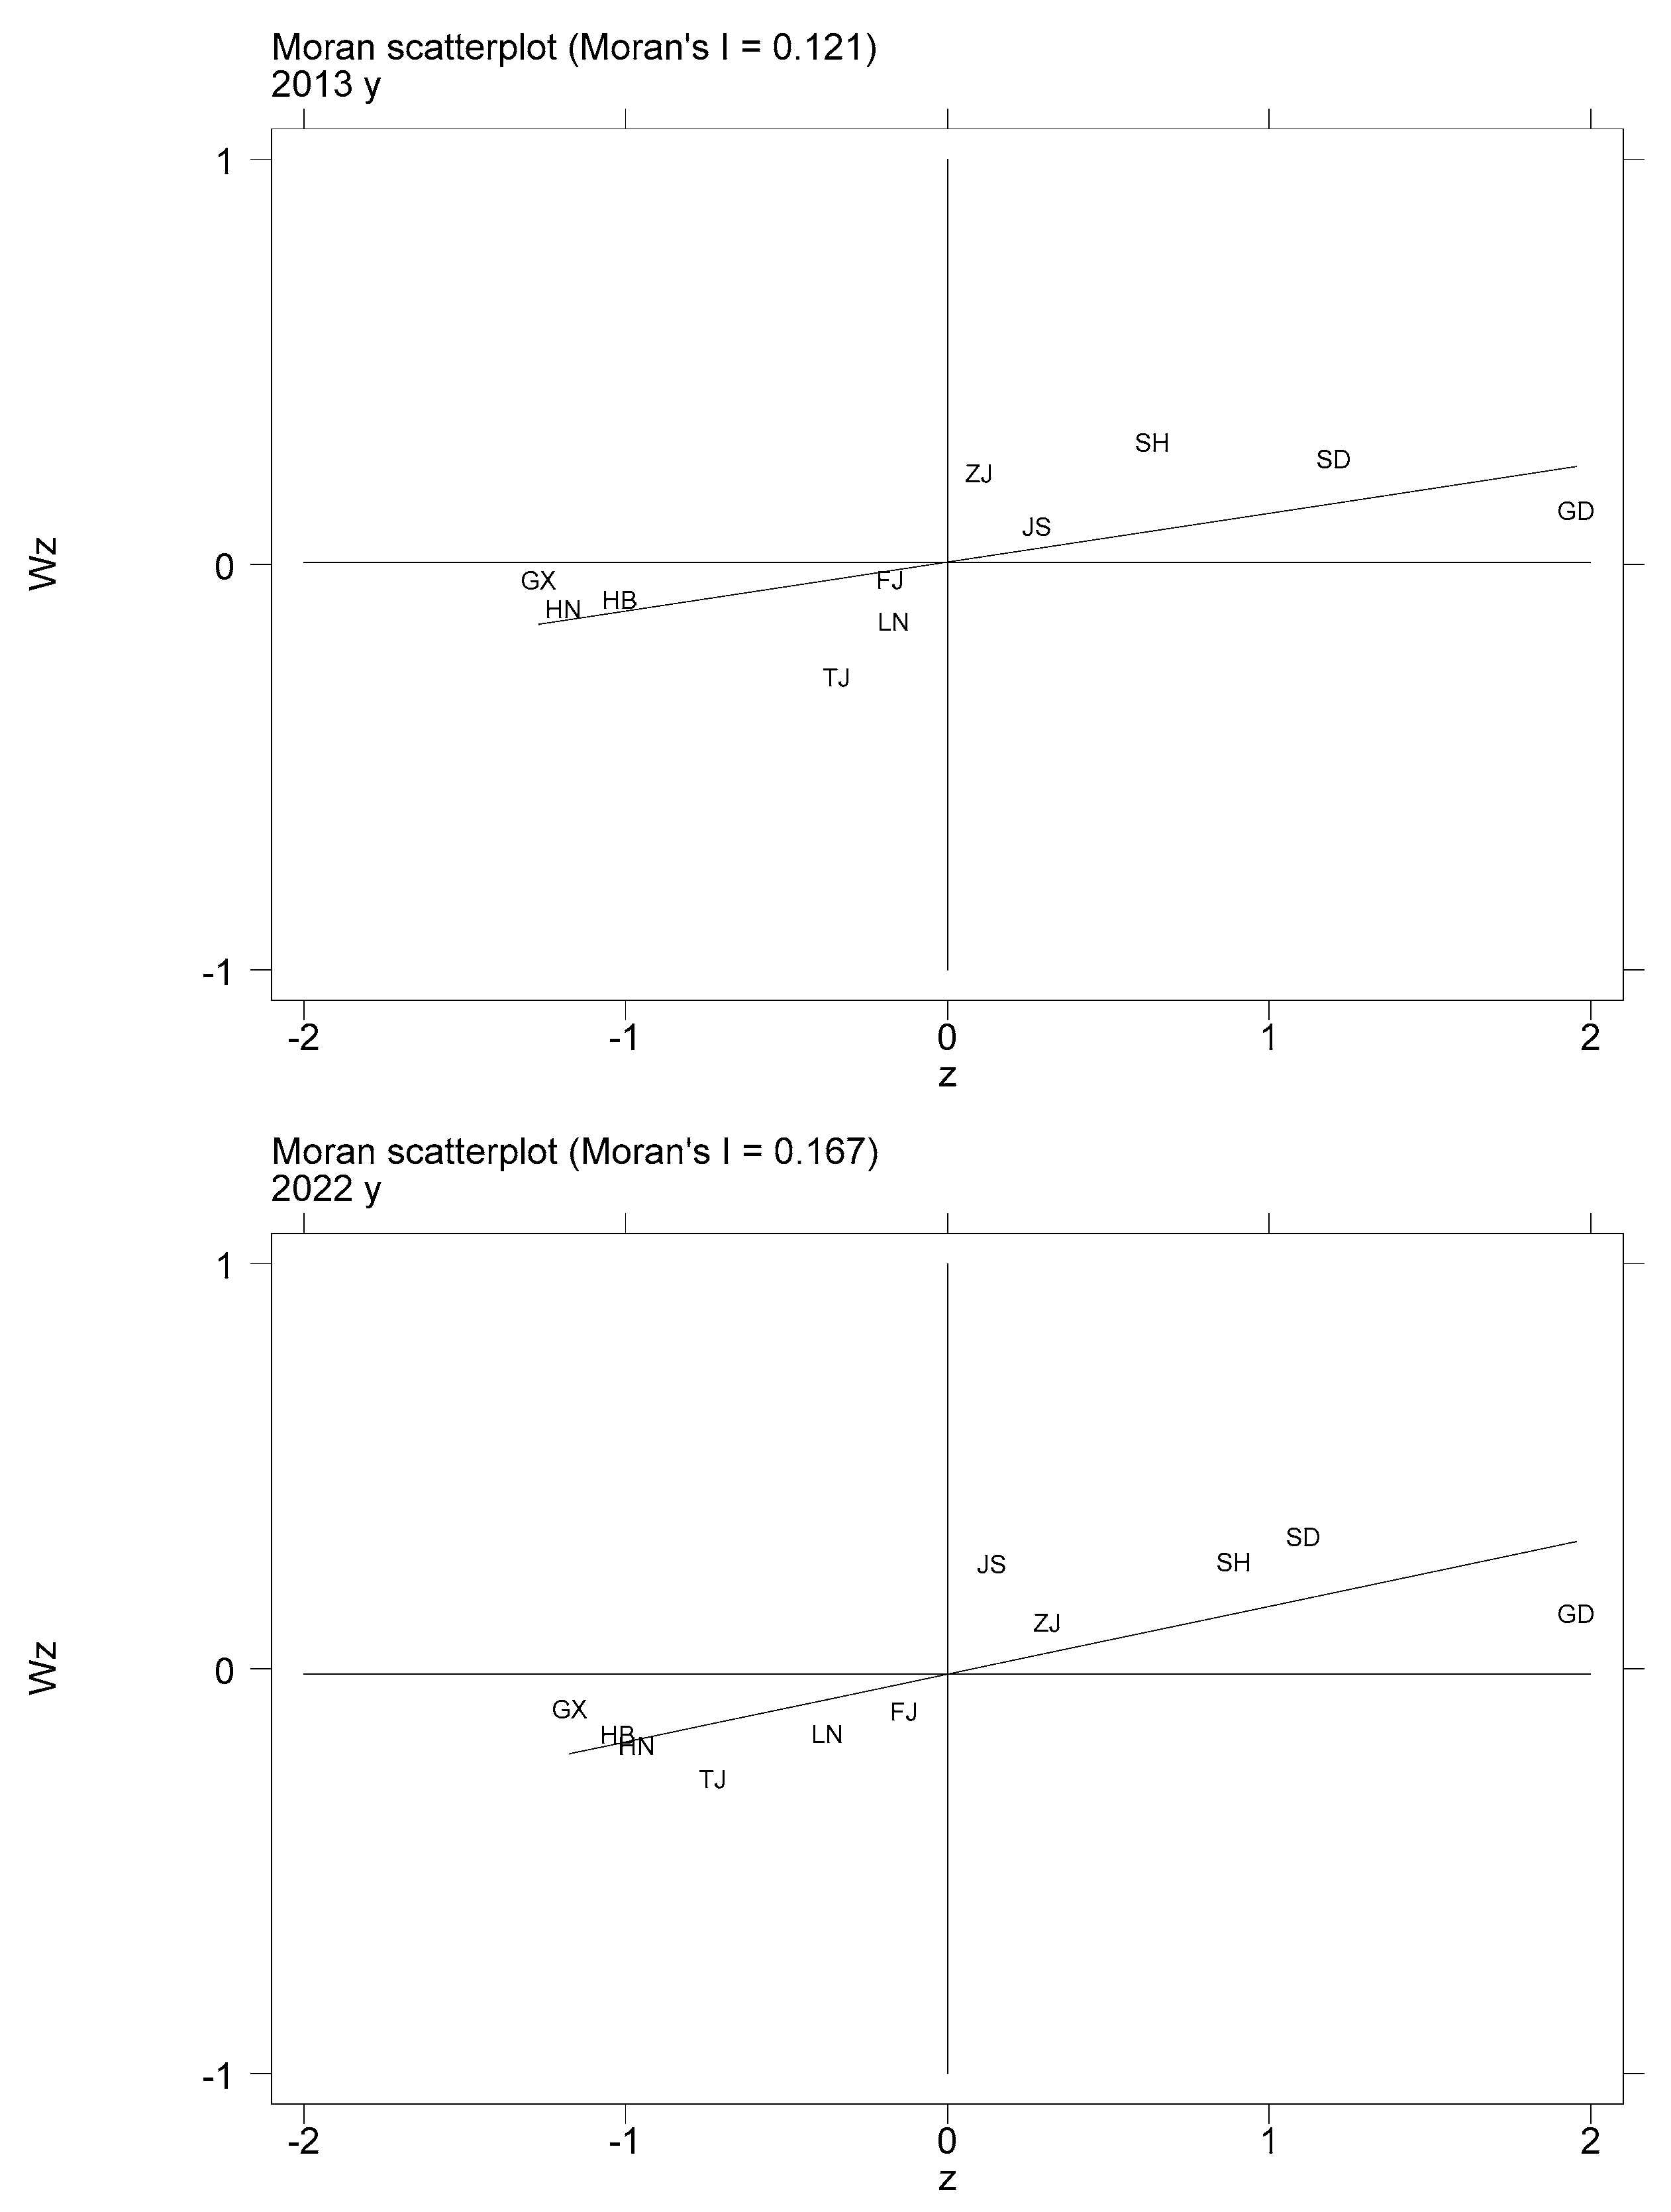
| 2013 | 0.121 * | 1.574 | 2018 | 0.121 * | 1.646 |
| 2014 | 0.122 * | 1.568 | 2019 | 0.133 ** | 1.700 |
| 2015 | 0.125 * | 1.612 | 2020 | 0.140 ** | 1.756 |
| 2016 | 0.123 * | 1.610 | 2021 | 0.158 ** | 1.833 |
| 2017 | 0.117 * | 1.590 | 2022 | 0.167 ** | 1.883 |
| Method | Spatial Lag Type | t/(t+1) | I | II | III | IV | Observed Count |
|---|---|---|---|---|---|---|---|
| Traditional | No lag | I | 0.9200 | 0.0800 | 0.0000 | 0.0000 | 25 |
| II | 0.0833 | 0.8333 | 0.0833 | 0.0000 | 24 | ||
| III | 0.0000 | 0.0769 | 0.8462 | 0.0769 | 26 | ||
| IV | 0.0000 | 0.0000 | 0.0417 | 0.9583 | 24 | ||
| Spatial | I | I | 0.0000 | 0.0000 | 0.0000 | 0.0000 | 0 |
| II | 0.0000 | 0.0000 | 0.0000 | 0.0000 | 0 | ||
| III | 0.0000 | 0.0000 | 0.0000 | 0.0000 | 0 | ||
| IV | 0.0000 | 0.0000 | 0.0000 | 0.0000 | 0 | ||
| II | I | 0.8947 | 0.1053 | 0.0000 | 0.0000 | 19 | |
| II | 0.0500 | 0.9000 | 0.0500 | 0.0000 | 20 | ||
| III | 0.0000 | 0.6667 | 0.3333 | 0.0000 | 3 | ||
| IV | 0.0000 | 0.0000 | 0.0000 | 0.0000 | 0 | ||
| III | I | 1.0000 | 0.0000 | 0.0000 | 0.0000 | 6 | |
| II | 0.2500 | 0.5000 | 0.2500 | 0.0000 | 4 | ||
| III | 0.0000 | 0.0000 | 0.9130 | 0.0870 | 23 | ||
| IV | 0.0000 | 0.0000 | 0.0417 | 0.9583 | 24 | ||
| IV | I | 0.0000 | 0.0000 | 0.0000 | 0.0000 | 0 | |
| II | 0.0000 | 0.0000 | 0.0000 | 0.0000 | 0 | ||
| III | 0.0000 | 0.0000 | 0.0000 | 0.0000 | 0 | ||
| IV | 0.0000 | 0.0000 | 0.0000 | 0.0000 | 0 |
| Diagnostic Tests | Model Selection Results | |
|---|---|---|
| Estimates | p-Values | |
| LM-lag | 5.425 | 0.020 |
| LM-error | 20.754 | 0.000 |
| Robust LM-lag | 6.828 | 0.009 |
| Robust LM-error | 22.157 | 0.000 |
| LR-lag | 41.89 | 0.000 |
| LR-error | 44.51 | 0.000 |
| Wald-lag | 51.24 | 0.000 |
| Wald-error | 28.02 | 0.000 |
| Hausman | 141.50 | 0.000 |
| LR-time | 271.53 | 0.000 |
| LR-ind | 22.79 | 0.299 |
| Variables | Test Results of the SDM | |
|---|---|---|
| Main | WX | |
| FACTOR | 0.081 *** (4.00) | 0.258 *** (3.04) |
| Ln GOP | 0.235 *** (21.80) | 0.404 *** (6.18) |
| IND | −0.604 *** (−6.48) | −3.746 *** (−8.86) |
| RD | −5.096 *** (−4.40) | −11.587 ** (−2.16) |
| FIN | 0.008 (0.86) | −0.070 ** (−2.39) |
| MAR | 0.018 ** (2.37) | 0.056 *** (2.60) |
| ρ | −0.495 *** (−2.68) | |
| Sigma2 | 0.001 *** (7.11) | |
| R2 | 0.575 | |
| N | 110 | |
| Variables | Direct Effect | Indirect Effect | Total Effect |
|---|---|---|---|
| FACTOR | 0.058 *** (2.77) | 0.170 ** (2.56) | 0.228 *** (3.41) |
| Ln GOP | 0.204 *** (12.21) | 0.222 *** (3.84) | 0.427 *** (7.43) |
| IND | −0.223 (−1.35) | −2.669 *** (−7.53) | −2.892 *** (−6.88) |
| RD | −4.227 *** (−4.59) | −6.871 * (−1.69) | −11.099 ** (−2.51) |
| FIN | 0.017 * (1.88) | −0.058 *** (−2.88) | −0.041 (−1.60) |
| MAR | 0.013 * (1.72) | 0.036 ** (2.29) | 0.049 *** (2.91) |
| Variables | Replaced Economic–Geographical Nested Matrix | 1% Winsorization Treatment | ||||
|---|---|---|---|---|---|---|
| Direct Effect | Indirect Effect | Total Effect | Direct Effect | Indirect Effect | Total Effect | |
| FACTOR | 0.055 *** (2.65) | 0.164 *** (3.38) | 0.219 *** (4.63) | 0.090 *** (3.92) | 0.135 * (1.84) | 0.225 *** (3.09) |
| Ln GOP | 0.223 *** (15.83) | 0.094 ** (2.43) | 0.317 *** (9.60) | 0.208 *** (11.60) | 0.263 *** (4.20) | 0.471 *** (7.24) |
| IND | −0.199 (−1.33) | −2.296 *** (−8.14) | −2.495 *** (−7.76) | −0.185 (−1.25) | −2.422 *** (−7.25) | −2.607 *** (−6.72) |
| RD | −4.968 *** (−5.91) | −3.528 (−1.28) | −8.496 *** (−2.90) | −4.699 *** (−4.57) | −10.271 ** (−2.25) | −14.970 *** (−2.94) |
| FIN | 0.021 *** (2.59) | −0.048 *** (−3.51) | −0.027 (−1.49) | 0.022 ** (2.46) | −0.039 * (−1.90) | −0.017 (−0.67) |
| MAR | 0.018 ** (2.56) | 0.028 ** (2.06) | 0.047 *** (3.35) | 0.009 (1.18) | 0.033 * (1.93) | 0.042 ** (2.30) |
| Variables | Test Results of Spatial Durbin Model Across Dimensions | |||||
|---|---|---|---|---|---|---|
| Main | Wx | |||||
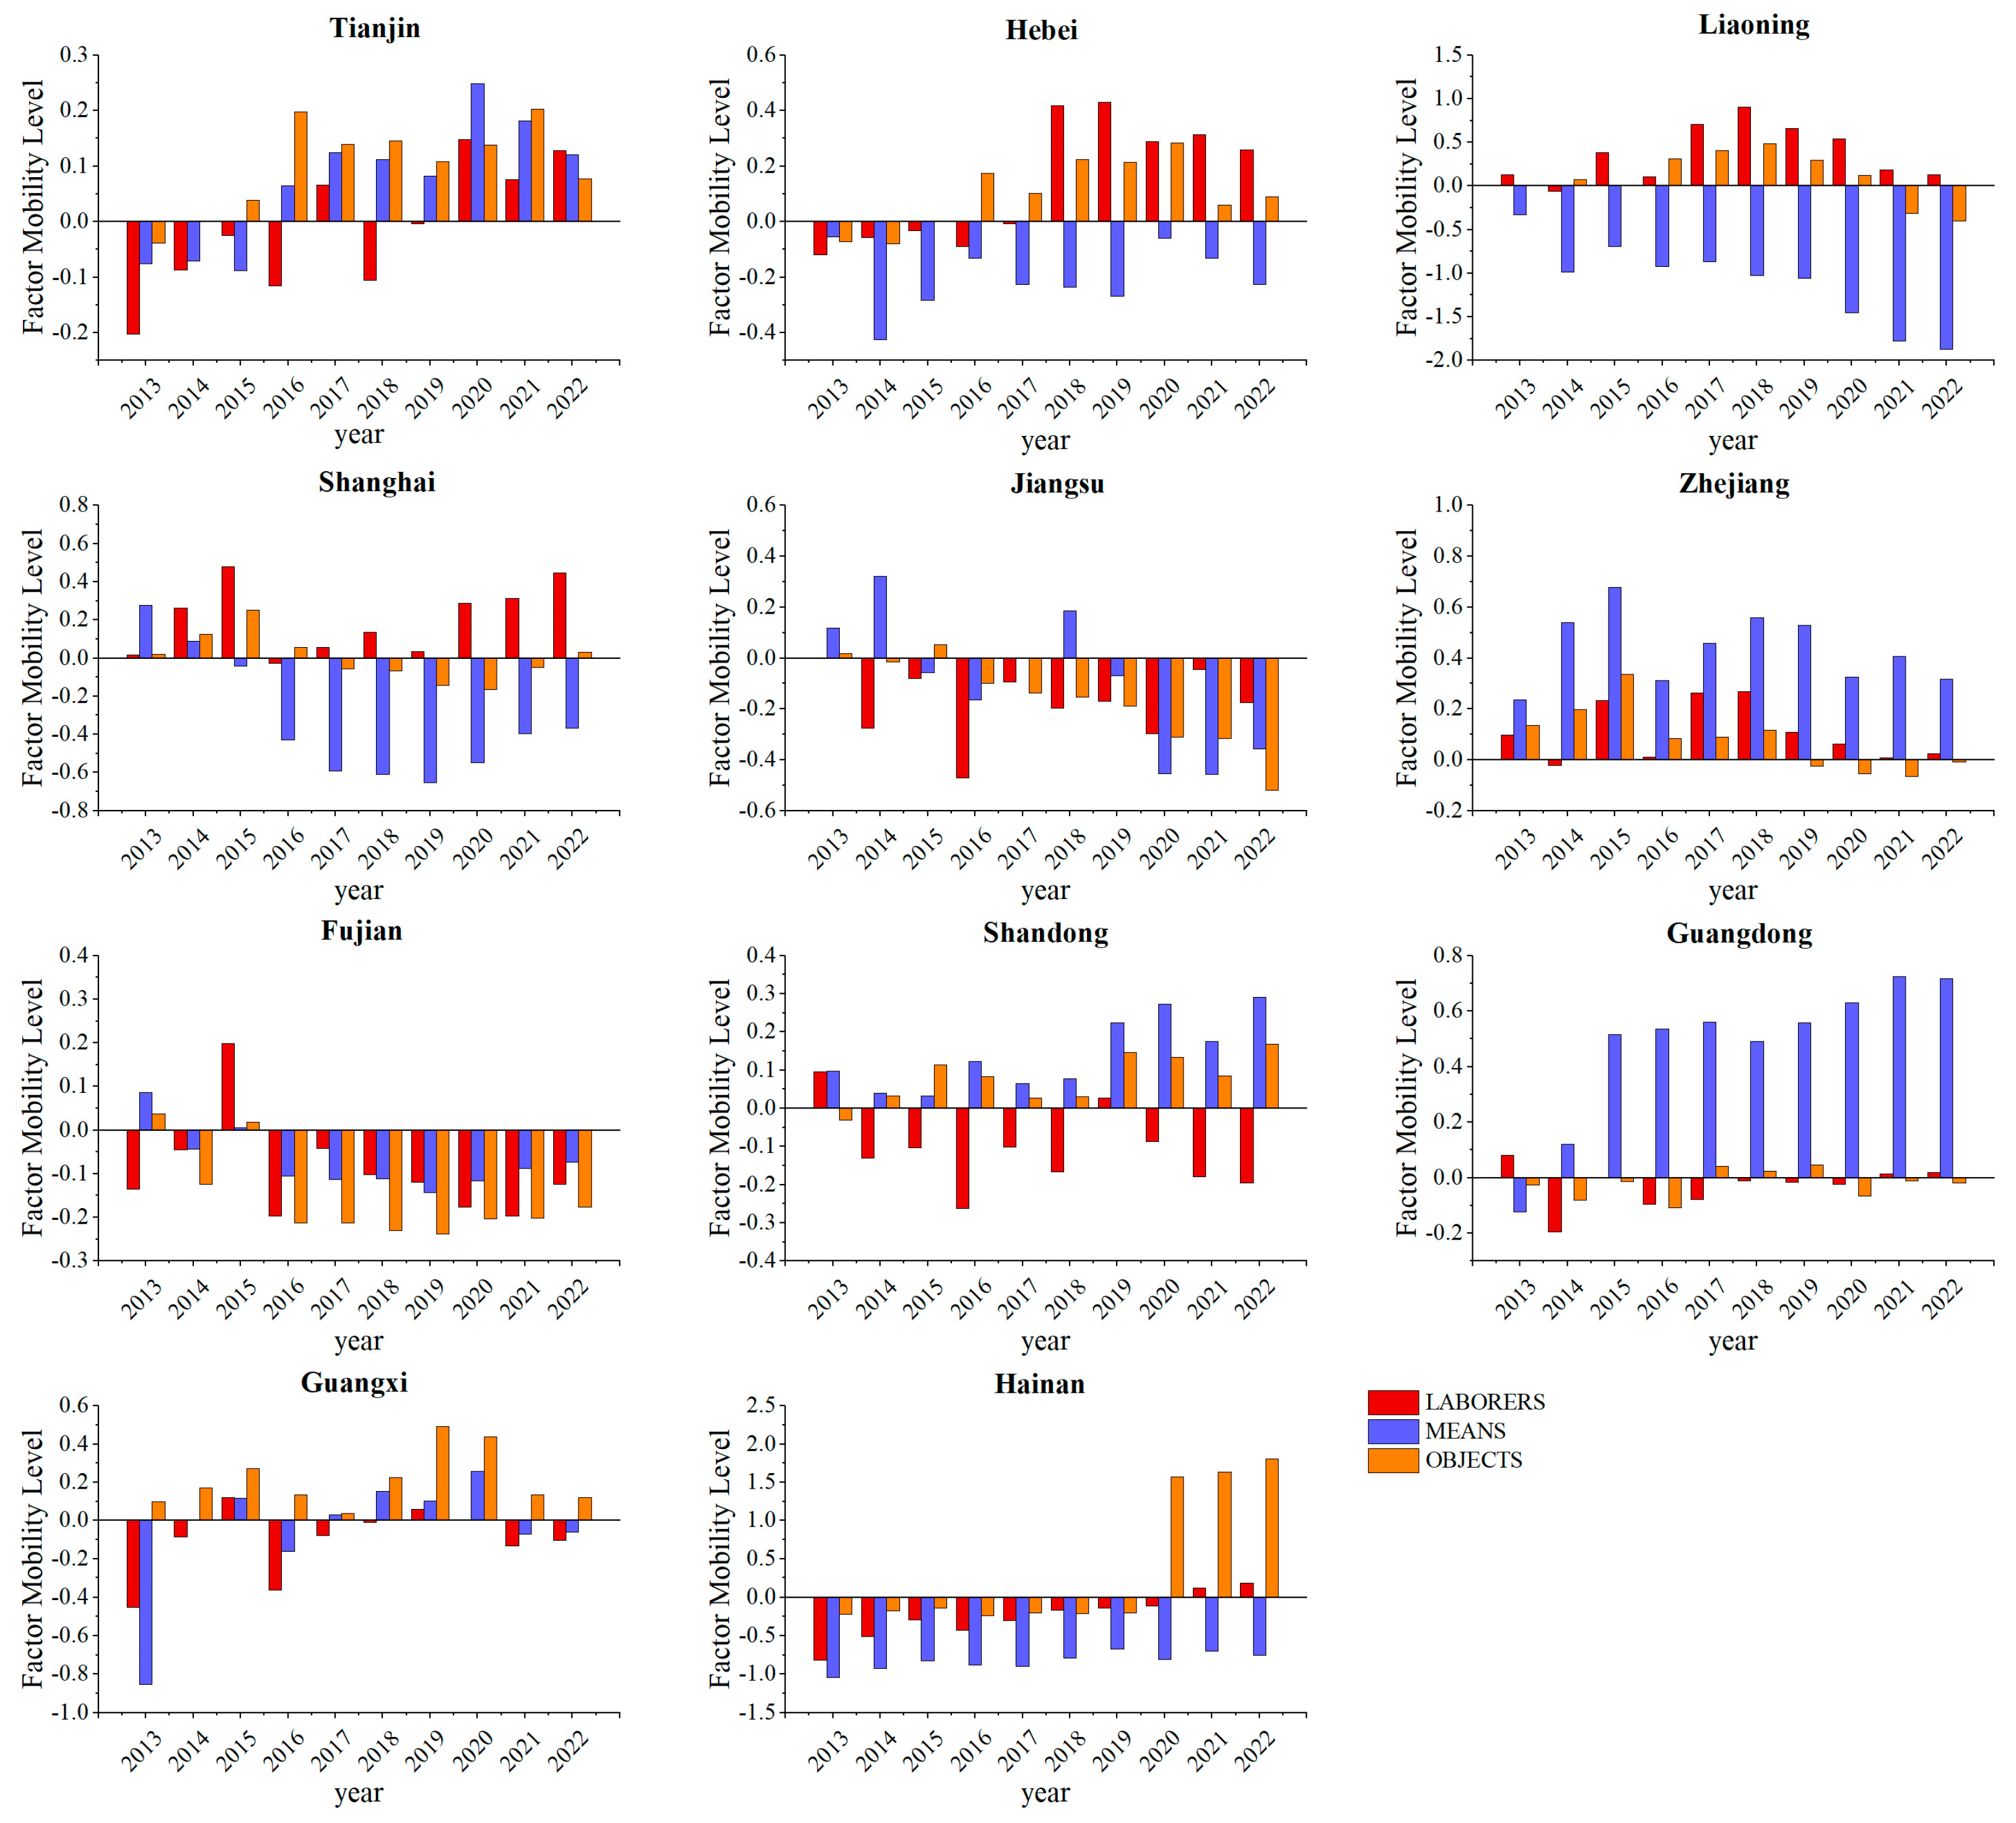
| LABORERS | −0.047 * (−1.822) | −0.209 ** (−2.061) | ||||
| MEANS | 0.061 *** (7.069) | 0.244 *** (6.619) | ||||
| OBJECTS | 0.029 * (1.792) | 0.027 (0.293) | ||||
| Control variables | Yes | |||||
| ρ | −0.268 (−1.390) | −0.615 *** (−3.652) | −0.349 * (−1.791) | −0.268 (−1.390) | −0.615 *** (−3.652) | −0.349 * (−1.791) |
| Sigma2 | 0.002 *** | 0.001 *** | 0.002 *** | 0.002 *** | 0.001 *** | 0.002 *** |
| R2 | 0.575 | |||||
| N | 110 | |||||
| Variables | Direct Effect | Indirect Effect | Total Effect | ||||||
|---|---|---|---|---|---|---|---|---|---|
| LABORERS | −0.036 (−1.284) | −0.168 * (−1.831) | −0.204 ** (−2.109) | ||||||
| MEANS | 0.032 *** (2.762) | 0.158 *** (5.232) | 0.190 *** (5.976) | ||||||
| OBJECTS | 0.028 * (1.700) | 0.012 (0.159) | 0.040 (0.542) | ||||||
| Control variables | Yes | ||||||||
| R2 | 0.509 | 0.669 | 0.506 | ||||||
| N | 110 | ||||||||
Disclaimer/Publisher’s Note: The statements, opinions and data contained in all publications are solely those of the individual author(s) and contributor(s) and not of MDPI and/or the editor(s). MDPI and/or the editor(s) disclaim responsibility for any injury to people or property resulting from any ideas, methods, instructions or products referred to in the content. |
© 2025 by the authors. Licensee MDPI, Basel, Switzerland. This article is an open access article distributed under the terms and conditions of the Creative Commons Attribution (CC BY) license (https://creativecommons.org/licenses/by/4.0/).
Share and Cite
Liu, S.; Zhang, Y.; Wang, J.; Wang, C.; Chen, S.; Liu, Y. The Impact of the Spatial Mobility of Marine New Qualitative Productivity Force Factors on the Coordinated Development of China’s Marine Economy. Sustainability 2025, 17, 5883. https://doi.org/10.3390/su17135883
Liu S, Zhang Y, Wang J, Wang C, Chen S, Liu Y. The Impact of the Spatial Mobility of Marine New Qualitative Productivity Force Factors on the Coordinated Development of China’s Marine Economy. Sustainability. 2025; 17(13):5883. https://doi.org/10.3390/su17135883
Chicago/Turabian StyleLiu, Shuguang, Yutong Zhang, Jialu Wang, Chenyun Wang, Sumei Chen, and Yuhao Liu. 2025. "The Impact of the Spatial Mobility of Marine New Qualitative Productivity Force Factors on the Coordinated Development of China’s Marine Economy" Sustainability 17, no. 13: 5883. https://doi.org/10.3390/su17135883
APA StyleLiu, S., Zhang, Y., Wang, J., Wang, C., Chen, S., & Liu, Y. (2025). The Impact of the Spatial Mobility of Marine New Qualitative Productivity Force Factors on the Coordinated Development of China’s Marine Economy. Sustainability, 17(13), 5883. https://doi.org/10.3390/su17135883