Abstract
As global energy consumption continues to rise, it is essential to adopt measures that regulate electricity use while still meeting the demands of modern society. These efforts align with the United Nations Sustainable Development Goals and are supported by various organizations. This study applies a methodology that combines the implementation of a Level 2 Energy Audit with the evaluation of the Electricity Consumption Index (ECI) at the Department of English of the Multidisciplinary Academic Unit of the Altiplano Region, Universidad Autónoma de San Luis Potosí. The study identifies strategies to reduce electricity consumption related to lighting systems and equipment operation throughout the department. Additionally, it assesses the percentage of users who promote and practice energy-saving habits. Key recommendations include transitioning the lighting system to LED technology, expected to reduce electricity consumption by 15, and implementing power factor correction measures, projected to yield an additional 6.17% in energy and cost savings. Together, these strategies could result in an estimated annual electricity savings of 21.17%, making them attractive to institutional decision-makers. Furthermore, by comparing the department’s ECI with a reference index established for educational institutions in temperate climate regions of Mexico, the study determines whether the proposed strategies should be implemented immediately or planned for the medium to long term. This decision-making framework represents the main contribution of the case study.
1. Introduction
The current need to reduce operating costs, including electricity, water, and natural gas consumption, required for delivering services and meeting social demands in both residential and non-residential spaces has led to the adoption of various tools and methodologies focused on energy efficiency and sustainability. These efforts share the common goal of reducing energy consumption and, consequently, the associated CO2 emissions [1,2,3].
Globally, energy management system regulations have been established to promote the certification of organizations that adopt them [4,5]. In parallel, programs have been developed to encourage the integration of eco-technologies in households, emphasizing the efficient and rational use of energy systems.
In residential buildings, user habits play a crucial role in determining energy efficiency [6]. A common issue is the failure to turn off lighting and electronic equipment when not in use. Additionally, the use of outdated appliances, often lacking inverter technology, can significantly increase energy consumption. Modern appliances with inverter technology can offer savings of up to 40% in systems such as air conditioners, refrigerators, washing machines, and heat pumps [7].
For example, a study in [8] conducted a descriptive statistical analysis to identify key factors contributing to inefficient electricity and water use in mosques in the United Arab Emirates. The analysis considered variables such as building age and compared data before and after energy audits. Similarly, building materials and geographic orientation are critical factors. In [9], a tool was developed to evaluate the effectiveness of thermal insulation in homes in West Virginia, using linear regression models to estimate energy consumption and detect potential air leaks, which translate into thermal losses.
In non-residential buildings, combining life cycle analysis with energy audits has proven effective. A case study in agrotourism facilities in Viterbo, Italy, identified high-efficiency scenarios involving the installation of photovoltaic systems and the replacement of gas boilers with high-efficiency heat pumps. These measures resulted in a 51% reduction in energy consumption and an 81% reduction in heating, domestic hot water, and electricity costs [10].
In academic settings, HVAC systems are a major focus of energy optimization. In [11], a study in southern Italy applied Multi-Objective Optimization (MOO) and Multi-Criteria Decision-Making (MCDM) tools to modernize a university classroom’s HVAC system. Controlled ventilation strategies were found to reduce energy consumption by 5% to 38%. Another study [12] reported that air conditioning accounted for 79% of electricity use in educational buildings, followed by 14% for other devices and 7% for lighting. This highlights the importance of prioritizing HVAC efficiency while also improving thermal insulation in walls, ceilings, and windows.
In Malaysia, an energy performance contract based on regression analysis from an energy audit estimated electricity savings of 25.6% and a reduction of 3,771,061.22 kg of CO2 emissions per year [13].
Although most energy-saving strategies are implemented during building operations, a significant opportunity lies in integrating such measures during the design phase. Sustainable architecture should evaluate educational building archetypes using energy simulation tools and return-on-investment methods. For instance, ref. [14] identified 28 factors influencing energy consumption in university buildings in Beijing. Using different tools, they developed predictive models for different architectural archetypes and assessed the impact of nine key factors.
In Mexico, there are approximately 260,262 educational institutions across all levels of basic, secondary, and higher education [15]. Of these, only 483 are Higher Education Institutions, including the Multidisciplinary Academic Unit of the Altiplano Region (UAMRA) of the Universidad Autónoma de San Luis Potosí (UASLP). These institutions require a constant electricity supply for lighting, equipment, air conditioning, and other needs.
In recent decades, attention has turned to the magnitude and patterns of electricity consumption across residential, commercial, and industrial sectors, including education. These institutions are subject to various electricity tariffs regulated by the Federal Electricity Commission (CFE). In fact, the total electricity consumption of educational institutions in Mexico reached 6.7 TWh [16], representing a cost of over 0.379 billion USD, based on an average price of 0.056 USD per kWh. This scenario presents a significant opportunity: the implementation of energy efficiency strategies could lead to substantial economic savings.
In 2017, the Trust for the Saving of Electric Energy (FIDE) published the Electricity Consumption Index (ECI) for eight types of non-residential buildings, including hotels, restaurants, offices, shops, supermarkets, hospitals, and schools. The results, categorized by building type and climatic region, highlight the ECI for schools, as shown in Table 1. This index ranges from 40.5 kWh/m2-year in temperate climate regions to 169.8 kWh/m2-year in dry climate regions. The state of San Luis Potosí, Mexico, is classified as a temperate climate region [16].

Table 1.
Electricity consumption rates by building type and climatic region (kWh/m2-year).
This index offers a practical and straightforward method to identify electricity consumption trends in Mexican educational institutions based on the surface area they occupy, as expressed in Equation (1), where E represents the electricity consumed, ECI the Electricity Consumption Index, and S the surface area in square meters:
To further emphasize the importance of electricity-saving strategies, data obtained through the Mexiquense Information Access System [17] revealed that in 2022, approximately USD 7,612,776.41 was allocated to electricity costs for elementary and high schools in the State of Mexico. However, the number of schools included in this expenditure was not specified. According to the National Education System, the State of Mexico has 19,373 elementary schools and 2313 high schools.
To promote environmental awareness and build a sustainable future, FIDE has implemented energy-saving initiatives targeting basic-level students in Mexico City. These include workshops on energy conservation, training on renewable energy use, and awareness campaigns on energy efficiency conducted during the first quarter of 2024 [18]. Despite these efforts, many initiatives remain insufficient. Therefore, specialized studies using advanced equipment are necessary to identify actionable strategies that educational institutions can adopt to reduce electricity consumption and operational costs.
One of the most effective tools for linking consumption with energy efficiency is the energy audit (EA). Globally, EAs have proven effective in diagnosing and improving energy performance across residential, commercial, and industrial sectors [19,20,21,22]. While definitions vary depending on context, several authors offer similar perspectives. For instance, ref. [23] defines an EA as a systematic procedure for analyzing energy consumption profiles and identifying potential savings from both technical and economic standpoints. Similarly, ref. [24] describes it as a tool for assessing an organization’s energy performance, and [25] emphasizes its basis in the measurement and observation of energy use and efficiency.
Energy audits are classified based on the level of detail, effort, and data collection involved, which directly affects the time, cost, and resources required. According to [26], the classifications are as follows:
- Level 0: A preliminary review of facilities to identify energy-consuming equipment and processes. Observations guide the identification of potential improvements, serving as a foundation for more detailed audits.
- Level 1: Involves reviewing key equipment and processes supported by institutional data. It identifies energy-saving opportunities, estimates investment costs, and prioritizes strategies for further analysis.
- Level 2: A detailed evaluation involving data collection, operational profiling, and measurement of energy variables. It enables comprehensive consumption studies, savings estimations, and pre-feasibility analyses, including investment projections.
- Level 3: Builds on previous levels with more precise data collection and measurements. It provides a detailed energy balance and well-justified proposals for improving energy efficiency.
The type of audit conducted determines the scope of electricity-saving strategies that can be proposed. In this study, a Level 2 energy audit was conducted at the University English Department (UDI) of UAMRA. Unlike a Level 1 audit, which offers a broad overview, Level 2 evaluates energy usage profiles using specialized measurement equipment. This approach ensures sufficient data accuracy while avoiding the operational disruptions that would result from a more detailed Level 3 audit. In addition, calculate its ECI and compare it with the average for educational buildings in temperate climate regions. This comparison helps determine whether the UDI’s energy consumption is below, at, or above the regional average, which in turn indicates whether immediate action is required or if other university spaces should be prioritized.
The study employed a Fluke 435 Series II® power quality analyzer, with measurements taken on May 9, 2024, from 8:00 a.m. to 6:00 p.m. Lighting levels were assessed using an Amprobe LM-120® lux meter. Additional data on energy-consuming equipment was collected during facility walkthroughs. Furthermore, a statistical analysis was conducted using data from a random survey of students enrolled in UAMRA programs to evaluate the energy-saving practices implemented by staff within the UDI. The goal is to identify and propose energy-saving strategies based on the collected data, with the building’s ECI serving as a key parameter in determining the urgency and priority of implementing these measures.
In addition to establishing energy-saving strategies, as documented in the literature, the main contribution of this study is to prioritize the proposed measures based on a comparative analysis using the ECI. Furthermore, it aims to enhance electricity use efficiency within the UDI before implementing renewable generation systems, thus enabling a smaller and more cost-effective photovoltaic system.
2. Materials and Methods
To ensure accurate, reliable, and concise results during the implementation of an EA, it is essential to follow a structured methodology. The primary goal is to gather comprehensive information about the institution’s energy consumption, including user behavior. An audit team is formed for this purpose, led by a designated lead auditor, who is responsible for planning and overseeing each stage of the process.
According to the standard, an EA consists of five stages [27]. However, this study proposes an additional step to determine whether the recommended improvements should be implemented immediately if the building’s ECI exceeds the average for similar buildings, or whether they can be scheduled for the medium or long term, depending on stakeholder priorities. These stages are illustrated in Figure 1 and described below.
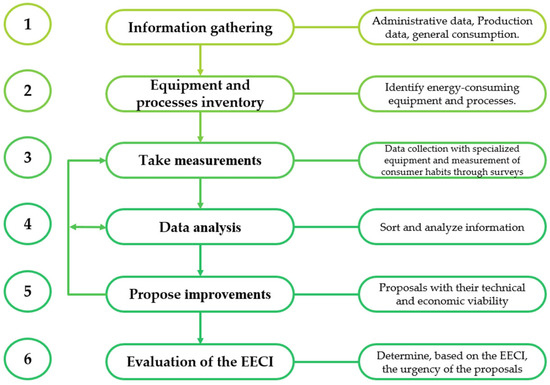
Figure 1.
Stages of the proposed methodology.
2.1. Information Gathering
In this initial stage, the audit team meets with the institution’s management to establish mutual commitment and define the audit’s scope. A schedule is proposed, key areas or processes of interest are identified, and the required level of detail is determined.
A Level 2 EA was selected for the UDI due to its ability to provide a detailed assessment of electricity consumption. This includes evaluating variables such as voltage profiles, current, consumption trends, lighting levels, and energy-saving habits. It is also important to assess the availability of necessary measurement equipment, as these instruments are often expensive and not widely accessible.
2.2. Equipment and Process Inventory
During early interactions with institutional representatives, data is collected on energy costs and consumption patterns. The more comprehensive the data, the better the understanding of the institution’s energy profile, enabling the identification of potential savings.
Key data collected includes:
- Responsible entity for energy management.
- Results of previous energy audits.
- Electricity and gas bills.
- Description of primary activities or services.
- Inventory of energy-consuming equipment (e.g., motors, computers, HVAC systems).
- Single-line electrical diagrams.
Although this step is standard, such information is often incomplete in educational institutions in Mexico. Energy managers are rarely designated, and previous audits or electrical diagrams are typically unavailable. If no energy monitoring system is installed, consumption data must be obtained during the measurement stage using specialized equipment, as was the case at UDI.
2.3. Measurements
Depending on the audit scope, measurements are taken at electrical panels or directly at key equipment terminals. Instruments used include:
- Power Quality Analyzer: Measures voltage, current, active/reactive power, power factor, harmonics, and phase imbalances. A Fluke 435 Series II® analyzer (FLUKE Corporation, Everett, WA, USA) was installed on the distribution board supplying the UDI. Configured for a three-phase star topology with grounded neutral, it recorded data every five minutes from 8:00 a.m. to 6:00 p.m. on 9 May 2024. Measurements were conducted over a single day to avoid interrupting UDI’s regular activities and due to safety concerns associated with leaving monitoring equipment unattended near exposed electrical panels in shared utility spaces.
- Lux Meter: Measures lighting levels in various areas. Four readings were taken per space using an Amprobe LM-120® (Amprobe, Everett, WA, USA), with artificial lighting on and measurement height adjusted to the work plane (e.g., desks or lab tables). Results were compared with NOM-025-STPS standards [28].
- Multimeter: A Fluke 375 FC® multimeter (FLUKE Corporation, Everett, WA, USA)) was used during analyzer installation to validate configuration and ensure accurate readings.
In addition to technical measurements, it is essential to assess energy management practices. Surveys were administered to students and administrative staff to evaluate habits such as:
- Unplugging unused devices.
- Turning off equipment after use.
- Maximizing natural lighting.
- Performing regular maintenance.
2.4. Data Analysis
Collected data is analyzed to evaluate current energy usage and identify improvement opportunities. This includes:
- Database and statistical analysis.
- Graphical comparisons.
- Benchmarking against standard consumption values.
If results are inconclusive, additional data may be reviewed or new measurements taken.
2.5. Proposal of Improvements
Based on the analysis, recommendations are developed to optimize energy use. These may include:
- Upgrading lighting systems.
- Maintaining or replacing HVAC units.
- Replacing outdated equipment.
- Implementing renewable energy sources.
- Correcting power factor issues.
- Reducing harmonic distortion.
- Balancing electrical loads.
- Regulating voltage profiles.
- Installing smart energy management systems.
- Promoting energy-saving behaviors among staff.
Recommendations should prioritize not only economic savings but also improvements in comfort and environmental impact. Even when financial savings are modest, the benefits in sustainability and user well-being can be significant [24].
2.6. Evaluation of the ECI
Before addressing this final step, the audit team must present the proposed energy-saving measures, identified during the implementation of the energy audit, to the institution’s stakeholders. While these proposals may represent optimal solutions for improving electricity consumption in academic spaces, it is essential to establish a reference parameter to determine the urgency of their implementation.
To this end, the results obtained from the data analysis are used to calculate the ECI of the UDI using Equation (1). This value is then compared with the average ECI for educational buildings located in temperate climate regions.
This comparison provides a standardized benchmark to assess whether the building under analysis exhibits excessive energy consumption. If the UDI’s ECI exceeds the regional average, the proposed measures should be prioritized and implemented immediately. Conversely, if the ECI is below the average, the implementation of these measures can be scheduled for the medium or long term, depending on institutional priorities and available resources.
3. Results
A Level 2 EA was conducted at the UDI, part of the UAMRA. The UDI provides English instruction to approximately 1300 students. Instruction is delivered in six classrooms, as well as in designated computer and karaoke areas and administrative offices, distributed across three floors with a total area of approximately 3405 m2. The UDI also shares its facilities with laboratories from the Chemical Engineering program, specifically the Chemical Engineering Lab and the Food Pilot Plant, which were included in the audit. The UDI operates Monday through Friday from 8:00 a.m. to 6:00 p.m.
The audit was conducted from 6 May to 10 May 2024 and included the following key activities:
- Lighting measurements across all UDI spaces, including Chemical Engineering laboratories.
- Scheduled walkthroughs to collect data on electrical and electronic equipment used in academic and administrative activities.
- A random survey administered to building users to assess energy-saving practices.
The scope of the Level 2 EA focused on lighting assessments, technical specifications of energy-consuming equipment, user behavior regarding energy use, and daily consumption profiling. Based on the collected data, key areas of opportunity for improving energy efficiency were identified, along with specific proposals for implementation.
Initial findings revealed that the UDI had not previously undergone an energy audit or implemented any formal energy management or control program. Furthermore, the institution does not have a designated energy manager, which limited the availability of preliminary data that could have served as a baseline. The equipment inventory showed that the main energy-consuming systems include computing equipment, multimedia devices, and cooling systems.
A detailed inventory was compiled, including information such as device type and brand, power rating, nominal voltage, location, year of installation, and maintenance history. This information is systematically presented in Table 2.
Table 2.
UDI’s equipment inventory.
The UDI primarily uses a combination of fluorescent tube lamps and LED lamps, with fluorescent lighting being more prevalent. Table 3 presents the average lighting levels measured in various areas of the UDI using a lux meter. Measurements were taken during working hours with artificial lighting turned on in each space.
Table 3.
Lighting measurements in UDI facilities.
The recorded lighting levels were compared against the minimum requirements established by the Mexican standard NOM-025-STPS, which defines appropriate lighting conditions in workplaces to ensure visual comfort and safety for different types of activities [28].
It is also important to note that one of the main sources of energy waste in buildings is the failure to turn off lights when they are not in use [22].
To assess electricity usage patterns among UDI occupants, a total of 41 randomly selected surveys were conducted, 38 with students and 3 with administrative staff. The survey focused on energy-saving practices promoted or adopted by users, yielding the following key findings:
- Lighting habits: Only 23% of users reported consistently turning off lights when leaving a space. Meanwhile, 45% said they sometimes check, and 33% admitted they do not check or do not consider it important.
- Perception of lighting systems: 43% of respondents considered the lighting system adequate, while 28% viewed it as inadequate or outdated. The remaining 30% were unsure.
- Knowledge of lighting technology: While 78% of users were familiar with LED technology and its benefits, 23% were either unaware or uncertain about its advantages.
- Use of electronic devices: Regarding televisions and computers used for academic purposes, 70% of users reported turning them off after use, 23% did so occasionally, and 8% never checked.
- Laboratory equipment usage: In shared spaces, 75% of users reported turning off equipment after use, 18% did so occasionally, and 8% never turned it off.
- Interest in energy-saving workshops: 53% of users expressed interest in participating in workshops on energy-saving practices, 40% were potentially interested, and only 8% were not interested.
- Suggested energy-saving measures: When asked about potential improvements, 33% recommended installing photovoltaic systems, 28% suggested maximizing natural lighting, 23% proposed motion-sensor lighting controls, 11% supported improving thermal insulation, and 4% mentioned other measures.
To evaluate the UDI’s electricity consumption profile, measurements were conducted using a power quality analyzer. The device was installed at the main electrical panel supplying power to the UDI and operated during regular working hours on 9 May 2024, from 8:00 a.m. to 6:00 p.m. Key electrical parameters monitored included voltage, current, active power, power factor, energy consumption, and harmonic distortion of current.
The data collected was processed and analyzed using MATLAB® (Version 2023, MathWorks, Natick, MA, USA), with raw data exported from Power Log 430-II® software (Version 5.9, FLUKE Corporation, Everett, WA, USA). The resulting consumption profiles are illustrated in Figure 2, Figure 3, Figure 4 and Figure 5.
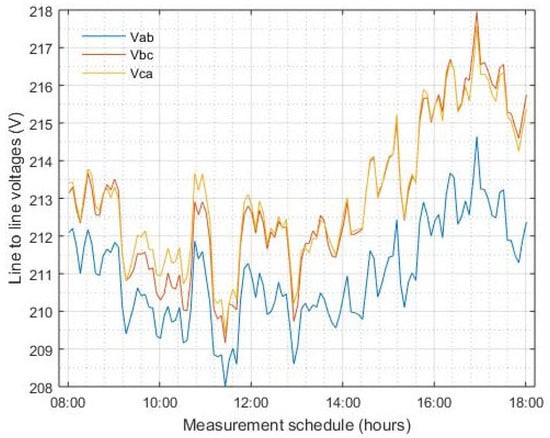
Figure 2.
Line voltage profile supplied to UDI electrical loads.
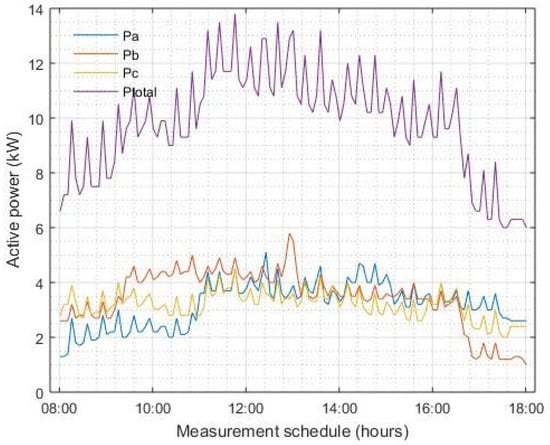
Figure 3.
Active power consumption profile.
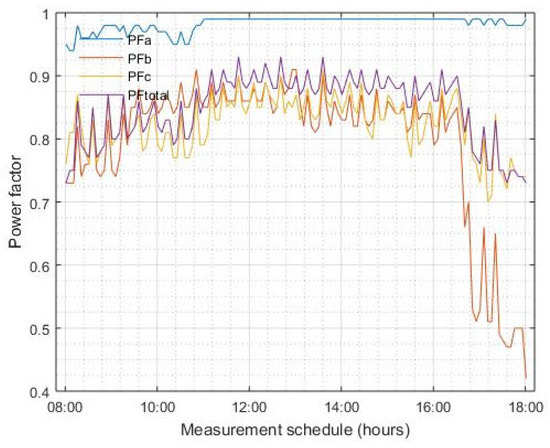
Figure 4.
Power factor profile.
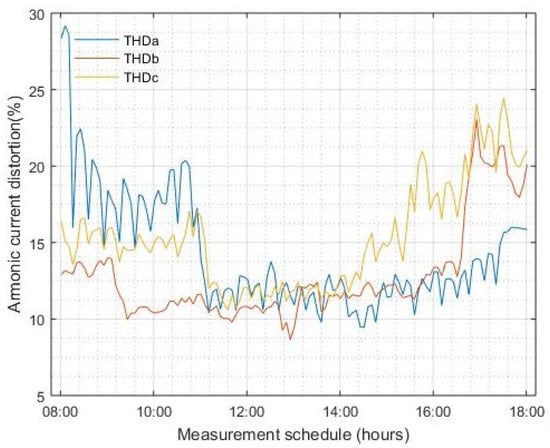
Figure 5.
Harmonic distortion percentage profile of current.
Based on the data and measurements presented in the previous sections, the following key findings were identified:
- (a)
- Total Electrical Load.
The total electrical load of the UDI building is 46,524 W, of which 62.18% corresponds to infrastructure supporting English courses and internal services, while 37.82% is attributed to equipment in the chemistry laboratories. Most equipment is approximately 12 years old, yet only 17 devices have received at least one maintenance intervention. This lack of maintenance can negatively impact energy efficiency, as operational cost-effectiveness depends on proper equipment design, operation, and upkeep. Routine tasks such as cleaning, inspection, and repair are essential for optimizing performance and reducing unnecessary energy consumption [29].
- (b)
- Voltage Profile.
Measurements from the energy analyzer indicate that the line voltage supplied to the UDI remains within the acceptable ±10% tolerance. As shown in Figure 2, the minimum voltage recorded was 208.01 V (94.55% of the nominal 220 V), and the maximum was 217.96 V (99.07%). A slight overload was observed in Phase B, likely due to uneven distribution of single-phase loads or varying load operation, resulting in a neutral current profile like that of Phase B.
- (c)
- Power Consumption Profile.
According to Figure 3, the maximum power consumption occurred at 11:46 a.m., reaching 13,800 W, coinciding with peak activity hours. Even during low-demand periods, a baseline consumption of 6000 W was recorded, indicating consistently high energy use. As suggested in [30], installing sub-meters in different facility areas could help track energy costs, identify inefficiencies, and optimize usage. Additionally, adjusting schedules and space availability could help reduce peak demand.
- (d)
- Power Factor.
As shown in Figure 4, the average power factor at UDI is 84.80%, below the 90% threshold set by the CFE. Falling below this threshold can result in penalties of up to 120% of the energy cost. In this case, the estimated penalty is 3.67%, equivalent to approximately USD 111.76 per year [31]. The low power factor is primarily due to the high number of electronic devices, which distort the current waveform and reduce efficiency.
- (e)
- Harmonic Distortion.
Figure 5 shows that total harmonic distortion remains within acceptable limits (5–20%), depending on the relative impedance at the connection point. Since UDI’s contracted demand does not exceed 1 MW, it is currently exempt from penalties related to harmonic distortion.
- (f)
- Lighting System.
The lighting system predominantly uses fluorescent lamps. Studies such as [32] indicate that lighting accounts for 30–35% of a building’s total energy consumption, and [33] reports that switching to LED lighting can yield savings of up to 50%. For UDI, this transition could reduce energy consumption by 15%, equivalent to USD 456.79 annually.
- (g)
- Lighting Levels.
As shown in Table 3, most UDI spaces exceed the minimum lighting levels recommended by NOM-025-STPS, with some areas reaching up to three times the required illumination. Only 5 out of 23 spaces fall below the standard. Optimizing the distribution of luminaires could further reduce energy use. Software tools can assist in redesigning lighting systems based on building archetypes and actual lighting needs.
- (h)
- User Behavior.
As in residential settings, electricity consumption at UDI is influenced by user habits. While most users report turning off lights and equipment after use, 33% do not consistently turn off lights, and 8% do not turn off equipment, highlighting the need for awareness and behavioral change.
The recommended strategies to be adopted in order of priority are:
- Promote energy-saving habits: Conduct workshops to encourage responsible energy use among staff and students. This low-cost measure can have a broad impact across all university spaces.
- Transition to LED lighting: replace fluorescent lamps with LED technology and optimize luminaire placement to meet regulatory standards efficiently.
- Power factor correction: Improve the power factor to avoid penalties and potentially earn bonuses of up to 2.5% on electricity bills.
- Preventive and corrective maintenance: Implement a structured maintenance program to extend equipment lifespan, reduce downtime, and improve energy efficiency.
- Install photovoltaic systems: A grid-connected photovoltaic system is a viable long-term solution, given the average daily solar potential of 6.6 PSH [34]. This equates to a required PV capacity of 15.14 kW. However, it is advisable to implement this system after initial efficiency measures are in place, thus reducing the required system size and investment.
A preliminary estimate suggests that the estimated savings are:
- LED lighting could reduce energy costs by 15% (USD 456.79/year).
- Power factor optimization could yield an additional 6.17% savings (USD 187.89/year).
Together, these measures could reduce annual electricity expenses by USD 644.68, representing a 21.17% reduction.
Through the implementation of a level two EA in the UDI, several strategies to reduce electricity consumption have been identified. The scope of this audit conducted at UDI included:
- A complete inventory of electricity-consuming equipment.
- Lighting level measurements across all functional spaces.
- Evaluation of key electrical parameters at the main distribution panel.
- Assessment of user behavior and energy-saving practices.
With the energy-saving proposals defined and prioritized, the ECI was calculated based on the total constructed area of the UDI, which spans 3405 m2 across three floors, and the projected annual electricity consumption of 35,973.72 kWh. Using these values, the ECI for the UDI was determined to be:
This value represents only 26.07% of the average ECI for educational buildings located in temperate climate regions in Mexico, which is 40.5 kWh/m2-year. This significant difference indicates that the UDI operates with a much lower energy consumption than the national benchmark for similar institutions.
This finding introduces a shift in the traditional approach to energy audits. While implementing energy-saving measures is always beneficial, having a reliable benchmark like the ECI allows stakeholders to make informed decisions about the urgency and prioritization of such measures.
In this case study, the low ECI suggests that immediate implementation of all proposed measures is not necessary. Instead, a phased approach is recommended, beginning with low-cost, high-impact actions, such as conducting workshops or training sessions to promote energy-saving habits among UDI users.
4. Conclusions
This study presented a methodology that integrates a Level 2 Energy Audit with the evaluation of the Electricity Consumption Index, applied to the UAMRA, of the UASLP. The objective was to analyze electricity consumption patterns and propose strategies to reduce energy use while also determining whether these measures should be implemented immediately or deferred based on institutional priorities.
For example, the administrative building alone, which is one of the largest at UAMRA, has an average daily consumption of 212.403 kWh and a projected annual consumption of 76,465.08 kWh, more than double that of the UDI. Therefore, the magnitude of potential economic and environmental savings would be greater if the same issues were present. To confirm this, the proposed methodology should be applied to the remaining buildings within UAMRA.
It is also important to recognize that energy-saving measures requiring large investments are not always the most effective starting point. Promoting good energy-use practices among building users can lead to meaningful improvements with minimal cost.
Such approaches not only help identify opportunities to improve operational efficiency and reduce consumption but also provide a framework for prioritizing actions based on stakeholder needs. It is important to emphasize that the methodology implemented does not seek to assign blame for current consumption patterns. Rather, it promotes a culture of shared responsibility and collective action. By fostering this commitment, tangible improvements can be achieved, contributing to institutional sustainability goals and broader environmental conservation efforts.
Author Contributions
Conceptualization: H.A.Á.M., R.P.G. and J.Á.P.S.; Methodology: H.A.Á.M., R.P.G., and J.Á.P.S.; Software: H.A.Á.M.; Validation: H.A.Á.M. and R.P.G.; Formal analysis: H.A.Á.M., R.P.G., A.H.R., J.C.A.G., C.S.M., and J.Á.P.S.; Investigation: H.A.Á.M. and R.P.G.; Resources: H.A.Á.M.; Data curation: H.A.Á.M.; Writing—original draft preparation: H.A.Á.M. and R.P.G.; Writing—review and editing: H.A.Á.M., R.P.G., A.H.R., J.C.A.G., C.S.M., and J.Á.P.S.; Visualization: H.A.Á.M.; Supervision: R.P.G.; Project administration: R.P.G. and H.A.Á.M.; Funding acquisition: H.A.Á.M., R.P.G., A.H.R., J.C.A.G., C.S.M. and J.Á.P.S. All authors have read and agreed to the published version of the manuscript.
Funding
This research received no external funding.
Institutional Review Board Statement
Ethical review and approval were waived for this study due to current institutional regulations do not require formal approval from an ethics committee for this type of instrument based on anonymous and non-interventional surveys.
Informed Consent Statement
Written informed consent has been obtained from the participants to publish this paper.
Data Availability Statement
The data presented in this study are available on request from the first author.
Acknowledgments
The authors would like to express their gratitude to the Universidad Autónoma de San Luis Potosí for providing the necessary facilities for this research.
Conflicts of Interest
The authors declare no conflict of interest.
References
- Lee, G.; Kim, H.; Min, K.; Hwang, T.; Kim, E.; Lee, J.; Kang, D. Carbon Emission Reduction Strategies in Urban Water Sectors: A Case Study in Incheon Metropolitan City, South Korea. Sustainability 2025, 17, 1887. [Google Scholar] [CrossRef]
- Dehghan, F.; Amores, C.P. Simulation-Based Multi-Objective Optimization for Building Retrofits in Iran: Addressing Energy Consumption, Emissions, Comfort, and Indoor Air Quality Considering Climate Change. Sustainability 2025, 17, 2056. [Google Scholar] [CrossRef]
- Fang, Z.; Liu, Z. Digital Innovations Driving Urban Sustainability: Key Factors in Reducing Carbon Emissions. Sustainability 2025, 17, 2186. [Google Scholar] [CrossRef]
- Ribeiro, L.M.L.; Scolaro, T.P.; Ghisi, E. LEED Certification in Building Energy Efficiency: AReviewofIts Performance Efficacy and Global Applicability. Sustainability 2025, 17, 1876. [Google Scholar] [CrossRef]
- Esteves, F.; Cardoso, C.J.; Leitão, S.; Pires, E.J.S. Energy Audit in Wastewater Treatment Plant AccordingtoISO50001: Opportunities and Challenges for Improving Sustainability. Sustainability 2025, 17, 2145. [Google Scholar] [CrossRef]
- Li, J.; Panchabikesan, K.; Yu, Z.; Haghighat, F.; Mankibi, M.E.; Corgier, D. Systematic data mining-based framework to discover potential energy waste patterns in residential buildings. Energy Build. 2019, 199, 562–578. [Google Scholar] [CrossRef]
- Geo Innova. Available online: https://geoinnova.org (accessed on 30 May 2025).
- AlAli, M.; Mattar, Y.; Alzaim, M.A.; Beheiry, S. Analysis of Electricity and Water Consumption in Existing Mosque Buildings in the UAE. Buildings 2023, 13, 1007. [Google Scholar] [CrossRef]
- Vaish, P.; Means, K.; Gopalakrishnan, B.; Li, H.; Recktenwald, J.J. Sustainability-Based Development of a Remote Technique to Assess the Effectiveness of Thermal Insulation in Households in West Virginia. Sustainability 2025, 17, 1845. [Google Scholar] [CrossRef]
- Bigiotti, S.; Costantino, C.; Marucci, A. Agritourism Facilities in the Era of the Green Economy: A Combined Energy Audit and Life Cycle Assessment Approach for the Sustainable Regeneration of Rural Structures. Energies 2024, 17, 1101. [Google Scholar] [CrossRef]
- D’Agostino, D.; Minelli, F.; Minichiello, F. HVAC System Energy Retrofit for a University Lecture Room Considering Private and Public Interests. Energies 2025, 18, 1526. [Google Scholar] [CrossRef]
- Alfaoyzan, F.A.; Almasri, R.A. Benchmarking of Energy Consumption in Higher Education Buildings in Saudi Arabia to Be Sustainable: Sulaiman Al-Rajhi University Case. Energies 2023, 16, 1204. [Google Scholar] [CrossRef]
- Munir, Z.H.M.; Ludin, N.A.; Junedi, M.M.; Affandi, N.A.A.; Ibrahim, M.A.; Teridi, M.A.M. A Rational Plan of Energy Performance Contracting in an Educational Building: A Case Study. Sustainability 2023, 15, 1430. [Google Scholar] [CrossRef]
- Wang, J.; Zhu, Z.; Zhao, J.; Li, X.; Liu, J.; Yang, Y. Research on the Energy Consumption Influence Mechanism and Prediction for the Early Design Stage of University Public Teaching Buildings in Beijing. Buildings 2024, 14, 1358. [Google Scholar] [CrossRef]
- Gobierno de México, Secretaría de Educación Pública. Available online: https://www.gob.mx/sep/articulos/boletin-175-mas-de-24-millones-de-estudiantes-de-educacion-basica-inician-el-ciclo-escolar-2023-2024/#:~:text=La%20Secr-tar%C3%ADa%20de%20Educaci%C3%B3n%20P%C3%BAblica,en%20las%2032%20entidades%20federativas (accessed on 27 January 2025).
- Secretaría de Energía; Comisión Nacional para el Uso Eficiente de la Energía. Consumo de Electricidad de Edificios No Residenciales en México: La Importancia Del Sector de Servicios, 1st ed.; Secretaría de Energía (SENER): Mexico City, Mexico, 2019; pp. 5–8.
- MILENIO. Escuelas de Nivel Básico Y Media Superior Gastan 153 Mdp Por Electricidad en Edomex. Available online: https://www.milenio.com/politica/comunidad/edomex-escuelas-gastan-153-mdp-electricidad (accessed on 10 January 2025).
- Fideicomiso Para el Ahorro de Energía Eléctrica. Promueve el FIDE Ahorro de Energía Entre Estudiantes de Primaria y del INEA. Available online: https://www.fide.org.mx/?page_id=49813 (accessed on 15 January 2025).
- Tanasic, N.; Jankes, G.; Stamenić, M.; Nikolić, A.; Trninić, M.; Simonović, T. Potentials for reducing primary energy consumption through energy audit in the packaging paper factory. In Proceedings of the 3rd International Symposium on Environmental Friendly Energies and Applications (EFEA), Paris, France, 19–21 November 2014; pp. 1–5. [Google Scholar] [CrossRef]
- Kaddari, M.; El Mouden, M.; Hajjaji, A.; Semlali, A. Reducing energy consumption by energy management and energy audits in the pumping stations. In Proceedings of the Renewable Energies, Power Systems & Green Inclusive Economy, Casablanca, Morocco, 23–24 April 2018; pp. 1–6. [Google Scholar] [CrossRef]
- Mubarok, H.; Priyatama, W.A. Solar Cell-Wind Turbine Hybrid Generation as a Solution of the Energy Audit Analysis at Hospital. In Proceedings of the International Seminar on Research of Information Technology and Intelligent Systems (ISRITI), Yogyakarta, Indonesia, 21–22 November 2018; pp. 544–549. [Google Scholar] [CrossRef]
- Singh, H.; Seera, M.; Idin, M.A.M. Electrical energy audit in a Malaysian university—a case study. In Proceedings of the International Conference on Power and Energy (PECon), Kota Kinabalu, Malaysia, 2–5 December 2012; pp. 616–619. [Google Scholar] [CrossRef]
- Fundación de la Energía de la Comunidad de Madrid. Procedimiento de Auditorías Energéticas en El Sector Industrial de la Comunidad de Madrid; Gráficas Arias Montano: Madrid, Spain, 2009; pp. 17–28. [Google Scholar]
- Niras ip Consult GmbH. Guía Para Realizar Una Auditoría Energética; Plurinational State of Bolivia Vice Ministry of Electricity and Alternative Energy General Directorate of Alternative Energy: Lapaz, Bolivia, 2019; pp. 1–16. [Google Scholar]
- Secretaría Central de ISO. Auditorías Energéticas—Requisitos Con Orientación Para Su Uso, 1st ed.; ISO Central Secretariat: Geneva, Switzerland, 2014. [Google Scholar]
- Balderrama, R.; Gopel, S.; Lobo, J.; Menéses, P.; Pérez, K. Guía Metodológica de Auditoría Energética en Edificación, 1st ed.; Agencia de Sostenibilidad Energética, Ministerio de Energía: Santiago, Chile, 2019; pp. 7–9. [Google Scholar]
- Carmen, P.S. Experto en Energías Renovables Y Eficiencia Energética; Universitat Politécnica de Catalunya: Barcelona, Spain, 2017. [Google Scholar]
- Secretaria de Trabajo y Previsión Social. Norma Oficial Mexicana NOM-025-STPS-2008; Condiciones de Iluminación en Centros de Trabajo, 1st ed.; The Secretaría del Trabajo y Previsión Social (STPS): Mexico City, Mexico, 2008; pp. 3–5.
- Fracttal. El Mantenimiento y la Eficiencia Energética. Available online: https://www.fracttal.com/es/blog/mantenimiento-y-eficiencia-energetica (accessed on 28 January 2025).
- Jadhav, V.; Jadhav, R.; Magar, P.; Kharat, S.; Bagwan, S.U. Energy conservation through energy audit. In Proceedings of the International Conference on Trends in Electronics and Informatics, Tirunelveli, India, 11–12 May 2017; pp. 481–485. [Google Scholar] [CrossRef]
- Comisión Federal de Electricidad. Instructivo Para la Interpretación Y Aplicación de Las Tarifas Para El Suministro Y Venta de Energía Eléctrica, 3rd ed.; Comisión Federal de Electricidad (CFE): Mexico City, Mexico, 2004; pp. 34–36.
- Latif, M.H.; Ahmed, T.; Khalid, W.; Anis, M.; Mahmood, T. Energy Audit, Retrofitting and Solarization in Educational Institutes of Pakistan: An Effective Approach Towards Energy Conservation. In Proceedings of the International Conference on Engineering and Emerging Technologies (ICEET), Lahore, Pakistan, 21–22 February 2019; pp. 1–6. [Google Scholar] [CrossRef]
- Ríos, A.; Taipe, D.; Otorongo, M. Optimización del Consumo Eléctrico de los Sistemas de Iluminación en Espacios Interiores de la Universidad Técnica de Ambato. Rev. Técnica Energía 2018, 15, 70–79. [Google Scholar] [CrossRef]
- Gallardo, R.P.; Ríos, A.M.; Ramírez, J.S. Analysis of the solar and wind energetic complementarity in Mexico. J. Clean. Prod. 2020, 268, 122323. [Google Scholar] [CrossRef]
Disclaimer/Publisher’s Note: The statements, opinions and data contained in all publications are solely those of the individual author(s) and contributor(s) and not of MDPI and/or the editor(s). MDPI and/or the editor(s) disclaim responsibility for any injury to people or property resulting from any ideas, methods, instructions or products referred to in the content. |
© 2025 by the authors. Licensee MDPI, Basel, Switzerland. This article is an open access article distributed under the terms and conditions of the Creative Commons Attribution (CC BY) license (https://creativecommons.org/licenses/by/4.0/).