Abstract
The driving mechanism of new qualitative productivity forces for coordinated development, which constitutes an inherent requirement of high-quality development, requires creative factor allocation through spatial flows, and the same is true for new maritime qualitative productivity forces. In this study, we constructed an evaluation indicator system to assess the impact of spatial flows of marine new qualitative productivity force factors on economic coordinated development in China’s coastal regions. Using panel data from 11 coastal provinces (2003–2022), we quantified new qualitative productivity force factor spatial flows and marine economic coordinated development levels, visualized their spatial–temporal patterns, and empirically examined their interaction mechanisms. The key findings include the following: (1) From 2013 to 2022, marine new qualitative productivity force factor spatial flows in coastal China transitioned from clustered “block-style” to scattered “multi-point” distribution patterns, with marine economic coordination exhibiting steady growth alongside pronounced spatial polarization. (2) Marine new qualitative productivity force factor spatial flows demonstrate significant positive direct effects on local marine economic coordination. (3) The notable spatial spillover effects of marine new qualitative productivity force factor spatial flows enhance coordinated development in neighboring regions. (4) Heterogeneous impacts emerge across marine new qualitative productivity force factor dimensions, where the spatial flows of new-type marine objects of labor and means of labor exert particularly significant influences. These findings provide policy insights for optimizing the spatial allocation of marine new qualitative productivity force factors to advance China’s marine economic coordination.
1. Introduction
New qualitative productivity forces place a stronger emphasis on the innovation and quality enhancement of economic factors. In practice, they have formed and demonstrated a strong driving force and support for high-quality development [1]. An inherent requirement for high-quality development is coordinated development. This coordination must occur not only in the economic system but also between the economic system and the ecological and social systems [2]. The advancement of productivity urgently necessitates improved efficiency in factor allocation. In addition, promoting the smooth flow of high-quality factors toward new qualitative productivity forces is essential. Existing production factors also require reorganization and allocation among different departments [3]. In geography, the emergence of new qualitative productivity forces introduces both opportunities and challenges [4,5]. China operates as an economic powerhouse with significant terrestrial and marine capabilities; its marine GDP accounted for 7.8% of the national GDP in 2024. Policies emphasize the importance of the marine sector. The 19th National Congress of the Communist Party of China proposed “Adhering to the coordinated development of land and sea and accelerating the construction of a maritime power.” Furthermore, the Third Plenary Session of the 20th Central Committee clearly advocated for “improving the system and mechanism for promoting the development of the marine economy.” These directives demonstrate that developing the marine industry and increasing maritime power constitute integral parts of the great rejuvenation of the Chinese nation. Such development is also a necessary requirement for China’s current stage of socio-economic progress [6]. The President of the People’s Republic of China, Xi JP, has expounded the mechanism driving economic development through productivity factor innovation and macroeconomic operation regulation, and he has formally proposed the concept of new qualitative productivity forces, which represent an advanced form of productivity characterized by innovation-driven development, transcending traditional growth paradigms and embodying three defining attributes—high technology, superior efficiency, and premium quality—aligning with the new development philosophy. In addition, he also offered significant incentives for seeking new, locally adaptive models of marine economic development [1,7].
The relationship between the spatial flow of productivity factors and regional economic development represents a crucial scope of study, drawing on multiple disciplines, including neoclassical economics and new economic geography. Adam Smith (1776), in The Wealth of Nations, proposed the division of labor theory, which involves concentrating productive factors in coastal regions and utilizing maritime transportation to enhance efficiency through the division of labor [8]. Marx (1857) critically built upon existing productivity theory. He first proposed that the basic connotation of “labor productivity” comprises workers’ average proficiency; the level of social technological development and its manufacturing application; and the scale, efficiency, and natural environment of labor production materials [9]. Perroux’s (1961) view holds that production factors flow toward regions with superior production conditions. This flow rapidly achieves regional economic growth, forming a local growth pole which then radiates outward, driving other regions’ development [10]. Entering the 21st century, Krugman (1991) developed the Core Periphery Model (CP Model). This model explains the phenomenon of the spatial agglomeration of economic activities and systematically clarifies labor force migration and spatial distribution [11]. Schumpeter (1912) explained economic development as driven by innovative recombination of productive factors, in which enterprises and entrepreneurs serve as the primary agents of innovation [12], Furthermore, Schumpeter’s innovation theory, applied to China’s marine sector, drives cross-regional resource integration and disruptive practices, directly linking marine productivity dynamics with coordinated economic development. In China, General Secretary Xi JP emphasized that China’s economic development is undergoing historic changes, with unbalanced and insufficient development being a manifestation of low development quality. Advanced productivity aligning with the new development concept has already formed and practically demonstrated a strong driving force and support for economic development [13].
The Chinese academic community has long focused on this topic. First, the definition and characteristics of marine new qualitative productivity forces have been considered: expanding on the Marxist productivity theory’s paradigm allows marine new qualitative productivity forces to be defined as the structural transition form of traditional productivity’s three factors (laborers–labor, materials–labor, and objects) in the marine economy. Measurement results indicate that China’s overall marine new qualitative productivity force level is relatively low, exhibiting obvious regional differentiation [14].
Second, research has been conducted concerning the path to realizing coordinated marine economic development: regional coordinated development acts as an important channel for promoting national modernization [15]. The cross-regional coordinated agglomeration of factors has significantly spurred China’s economic growth [16]. Revitalizing the marine industry through science and education fosters new qualitative productivity forces, particularly requiring the promotion of rational cross-sector flow and market-oriented allocation of new-type resources such as marine data and environmental factors [17,18,19].
Finally, the literature has explored the reasons for uneven regional marine economic development: significant differences in marine economic regions drive regional discrepancies in the level of economic development in coastal areas [20]. The total factor productivity of marine resources in coastal areas of China demonstrates significant spatial and phased differences [21,22].
A review of the literature indicates few studies specifically analyzing the impact of the spatial flow of marine new qualitative productivity force factors on the coordinated development of China’s marine economy. Theoretically, this paper defines marine new qualitative productivity forces as the extension of new qualitative productivity forces into the ocean domain, guided by new development concepts to enhance all-factor productivity and optimize factor combinations. It leverages technological revolutions to drive innovation and structural upgrading in marine enterprises, catalyzes marine new business forms and models, promotes optimal marine industrial spatial distribution, and advances coordinated regional marine “economic–ecological–social” development. Against the backdrop of new qualitative productivity force development, it integrates spatial models from new economic geography with Smith Adam’s economic analysis frameworks and applies this integrated approach to China’s marine sector. Empirically, the study examines whether the spatial flow and agglomeration of marine factors can boost local marine economies while generating spatial spillover effects on neighboring provinces and investigates the mechanisms linking the spatial flow of new, heterogeneous marine qualitative productivity forces to coordinated marine economic development, thereby exploring and empirically testing their spatial effects from a factor mobility perspective.
2. Internal Mechanism Analysis
2.1. Local Effects
Factor allocation and factor endowment influence the content and nature of factor agglomeration, according to the modern factor agglomeration theory model [23] and the work of Hao DJ and Zhang R. [24]. By introducing the factor matching degree index and combining it with Smith’s theorem, we constructed a regional coordinated development model. This model aims to test the factor agglomeration theory’s applicability in the marine economy field.
Assume there are i (i = 1, 2, …, φ) economies in a region where two development factor types exist: non-regional factors and regional factors. Non-regional factors, such as capital, labor, and technology, possess high mobility and tradability, whereas regional factors, such as unique scarce resources and legal policies, are inherent and non-tradable characteristics of a region. Different factor combinations yield varying production efficiencies. The model output is set as the optimal output function under conditions of effective factor allocation. This setup intends to indicate that improved economic efficiency, which is created by optimizing the allocation of non-regional and regional factors, represents an endogenous driving factor for high-quality economic development. Accordingly, the total output function for regional economies can be established as Equation (1):
where q(i) represents the intermediate input product, Q signifies the total output of the economies, and φ denotes the quantity of intermediate products. Q is the intermediate product resulting from combining the ith economy’s non-regional and regional factors. The value of φ reflects the level and degree of matching between regional and cross-regional factors. Larger values for q(i) and φ suggest better economic development in a region. Inputting q(i) into the production function Q derives the region’s output situation. The production function demonstrated by Ethier in 1982 was used [25]. Its general properties for formal competitive firms are as follows: The Q function exhibits constant returns to scale for a given number of intermediate products. The Q function demonstrates gradually increasing returns to scale when the number of intermediate products changes, reflecting the tendency of factor flow to agglomerate, a concept which is central to this paper.
Assume that the intermediate product q(i) of the ith economy in a region is sold at a unit price of p(i) and that the expenditure of the total output of the region is U. represents the price of intermediate products after price indexation, U represents regional gross output. The output function of economy i can be expressed as Equation (2):
Equation (2) can be substituted into Equation (1) to obtain Equation (3), and according to Equation (3), U is any real number greater than 0. When ε > 1, the total regional output is positively correlated with the quantity of intermediate products, and then 0 > ε > 1, exhibiting a negative relationship.
The input quantity of non-regional factors necessary for the optimal production of intermediate products q(i) in economy i is represented as Equation (4), where μ represents the marginal demand for non-regional factors, k denotes the fixed input level of non-regional factors, and r(i) satisfies the property of increasing returns to scale.
Assume that C(i) is the total cost price of non-regional factors, According to the first-order condition, the optimal input demand can be obtained as Equation (5):
Thus, the total revenue of the economy is shown in Equation (6), and the total expenditure is shown in Equation (7).
And the price index for the intermediate goods-producing sector can be expressed as Equation (8):
Let ε = (1/1 − ρ) be the substitution elasticity between variables. Furthermore, under the condition of perfect competitive equilibrium, the equilibrium output can be expressed as Equation (9):
Meanwhile, assuming that the agglomeration scale of non-regional factors is ω, the agglomeration scale of regional factors is shown in Equation (10):
The factor demand function r* is substituted into Equation (10), which is rewritten as Equation (11):
The value of φ* signifies the efficiency in allocating regional and non-regional factors. This value indicates that for regional economies experiencing stable and sustainable growth, the quantity of intermediate products is an inverse relationship with fixed costs, k, but with a same-direction change with non-regional factor inputs. Therefore, the increased agglomeration of non-regional factors in a specific economic space contributes to reduced costs for fixed inputs of non-regional factors, an enhanced level of factor optimization allocation, and a higher overall output level for the regional economy. Therefore, we hypothesized that expanding the agglomeration scale of non-regional marine new production factors can facilitate the coordinated development of the marine economy, for the reasons detailed below.
First, we consider the regional division of labor effect among marine new qualitative workers. We define marine new qualitative workers as specialized talents dedicated to the scientific and technological advancement of China’s strategic frontier marine industry. Marx’s theory of the regional division of labor, which considers labor as a starting point, suggests that labor division and cooperation expand the spatial scope of work while concentrating production activities. Additionally, close communication cultivates the spillover of marine professional knowledge and aids skill dissemination. The specialized division of labor, accordingly, enhances efficiency.
Second, the agglomeration effect pertains to marine new qualitative labor objects. These objects are marine new resources and marine new formats that are developed and used and integrate production with new production factors. Marine resources are fundamental production factors promoting marine economy growth. The spatial concentration of companies with specialized, refined, distinctive, and innovative characteristics further optimizes resource allocation and upgrades industrial structure. This is crucial for enhancing industrial chain resilience and advancing the coordinated development of the marine economy.
Third, marine new qualitative labor materials generate positive externalities. The concept of marine new qualitative labor materials covers the digital transformation of marine new materials and the research, development, and production of new technologies, alongside modern marine industry development. R&D activities and technological factors shared between industries exhibit strong positive externalities. Even under patent protection, the decryption, imitation, and surpassing of these innovations can occur in a short timeframe. An increase in the total factor productivity of the ocean thus results from the intra-regional flow of marine new technology factors.
Accordingly, we propose Hypothesis 1: the spatial flow of marine new qualitative productivity factors enhances the coordinated development level of the marine economy in the region.
2.2. Spatial Spillover Effect
Marine new qualitative productivity forces represent a novel productivity concept arising from marine economy development in the new era. They also constitute a new type of marine production capacity and development model that reflects the marine industry’s traits and is adapted to the information age. The spatial effect of developing marine new qualitative productivity forces on the coordinated development of the regional marine economy is reflected in two aspects.
The first aspect is the enhancement of coordinated economic development levels in coastal areas via the free flow of marine new productivity. A cyclic accumulation mechanism, as cited in [26], can be observed from the spatial aggregation of economic activities: The spatial aggregation of factor flow induces endogenous optimization growth, prompting a new round of factor flow, which leads to higher-level spatial flow. The continuous expansion of regional economic scales, optimization of economic structure, and improvement in economic efficiency define this upward spiral of spatial agglomeration. For latecomer coastal provinces, consider the following: On one hand, new qualitative productivity force factors derived from disruptive and cutting-edge technologies flowing to developed coastal provinces achieve a higher marginal return rate than in local regions. This is mediated through agglomeration advantages and scale dividends. Developed coastal provinces gain enhanced influence through the implementation of major regional strategies, thereby creating greater driving force. On the other hand, after marine factors flow out from underdeveloped coastal provinces, the marginal productivity of the remaining non-outflow marine factors, combined with the agglomeration effect among these factors, increases the factor return rate in those provinces. The stimulation of further economic growth results from the rise in both the marginal return rate and factor return rate, facilitated by releasing market demand; this action helps narrow the development gap between regions. A transition from agglomeration to coordination regarding spatial interconnectivity and agglomeration externalities is expected for the marine economy. Similarly, spatial correlation effects and agglomeration externalities point to the marine economy moving from agglomeration toward coordination.
The development of marine new productivity offers a second major spatial impact: it can broaden the scope of coastal regional cooperation and simultaneously enhance the effectiveness of this cooperation. Marine new qualitative productivity forces associated with technologies such as digitization, networking, and intelligence can partially overcome distance-related impediments. These factors connect regions with differing types, development stages, and locational conditions, ultimately promoting marine economic integration. The importance of this spatial correlation effect highlights the interdependence and interactivity of marine economic activities dominated by marine new qualitative productivity forces between regions. It also highlights the coordinated development of factors and regions as a necessity to address imbalance and inadequacy [27].
Therefore, we propose Hypothesis 2: the spatial flow of marine new productivity factors has a significant positive spatial spillover effect on the coordinated development of the marine economy.
2.3. Spatial Effects of Heterogeneous Marine Productivity Flows
The application of advanced equipment, including deep-sea exploration robots, intelligent aquaculture cages, and ocean databases, characterizes the new type of marine labor materials; these are developed through the deep integration of advanced technologies (e.g., big data, cloud computing, and artificial intelligence) with modern marine industries. High mobility is a feature of these materials, referring to their capability to quickly overcome spatial barriers for dissemination and application. The exploration of deep-sea biological resources and the sustainable use of renewable energy, centered on green technologies, constitute the new type of marine labor objects. Their development necessitates combination with and adaptation to traditional marine resources, following a trend toward increased diversification and optimization [14]. Strong mobility also characterizes the new type of marine labor objects, akin to the new labor materials; China’s emphasis and marine industry policy strengthen this mobility. A key distinction can be observed concerning the workforce involved. In comparison to traditional technical workers engaged mainly in simple, repetitive tasks, the personnel participating in marine new qualitative productivity forces are high-quality laborers capable of rapid knowledge iteration and the proficient use of modern technology and equipment. Above all, enabling the inter-provincial migration of these workers involves covering family migration costs. Specifically, in China, inter-provincial labor migration incurs notable costs due to constraints imposed by the household registration system. Moreover, high-quality labor migrants with accompanying family members will therefore face substantially higher costs in such cases [28]. Meanwhile, the temporal misalignment between higher-education program offerings and evolving labor market demands results in skills mismatches, which subsequently undermines the mobility incentives of high-quality human capital factors [29]. Therefore, this paper suggests their limited mobility [30]. Assessing the overall spatial flow of marine productivity factors alone cannot accurately explain the impact exerted by marine new factors, which have varying flow rates, on the coordinated development of coastal provinces.
Therefore, we propose Hypothesis 3: there is heterogeneity in the effect of spatial flow of marine new qualitative productivity force factors on the coordinated development of the marine economy in different dimensions.
3. Materials and Methods
3.1. Empirical Model Construction
Theoretical models suggest that marine new labor factors—represented by new laborers, new labor materials, and new labor objects in the marine sector—expand their agglomeration scale through flow. This flow also improves allocation efficiency and enhances the coordination and agglomeration of the marine economy. To verify our hypotheses, a spatial panel model was employed. This model (12) tested the effect of the spatial flow of marine productivity factors on the high-quality development of the marine economy.
Here, r and t represent provinces and time. MECDrt denotes the level of coordinated development of the marine economy. Factorrt expresses the factor flow index of marine new qualitative productivity forces in coastal provinces, which has three dimensions (namely the new labor factor flow index, LABORERSrt, the new labor material factor flow index, MEANSrt, and the new labor object factor flow index, OBECTESrt). W conveys the spatial weight, and α is the constant term. Controlsrt explains the control variable. urt and vrt depict the fixed region and fixed time, respectively. ℇrt is the random error term.
3.2. Variable Selection
3.2.1. Dependent Variable: Coordinated Development of China’s Marine Economy
We first evaluated the coordinated development of China’s marine economy (MECD). The operation of the ecological economic system has been viewed as a process wherein humans purposefully develop and use ecological resources and the environment. Meanwhile, they achieve the rational allocation and scientific utilization of production factors. The ecological scholars Ma SJ et al. (1984) [31] proposed the “ecology–economy– society” composite ecosystem concept; this aimed to revise and supplement the previous ecosystem concept, better aligning it with scientific research logic. An evaluation index system for coordinated development from the ocean perspective was constructed, building upon relevant research. This construction process accounted for the aforementioned concepts and the current state of China’s marine economy, which stresses land–sea coordination and sustainable development. The internal logic involves several characterizations. First, it defines the marine economic subsystem dimensions based on overall economic size and structure, economic vitality, and external connectivity [17,32]. Second, it constructs the marine ecological subsystem dimensions founded on ecological pressure, ecological foundation, and ecological response requirements [33,34,35]. Third, it establishes the marine social subsystem dimensions using social population, quality of life, technological output, and ocean-related education conditions and levels [36,37]. Data availability constraints led to the establishment of a specific indicator set, detailed in Table 1, which includes 3 criterion layers, 11 factor layers, and 35 specific indicators. The entropy method represents an objective assignment method derived from information entropy theory. Its application overcomes the potential bias from determining indicator weights through a single method; hence, it is commonly used in complex panel data analysis. Accordingly, this study utilized the entropy method to measure the coordinated development level of the marine economy in coastal provinces from 2013 to 2022.

Table 1.
Evaluation indicator system for MECD.
In order to visualize the spatial characteristics of the coordinated development of China’s marine economy, we used Argis 10.8 software to draw spatial distribution maps of MECD in the years 2013, 2017, and 2022, as shown in Figure 1, which demonstrate that the level of coordinated development of the marine economy in most of China’s coastal provinces has significantly improved compared with 2013. However, there is a large gap in the quality of the marine economy among provinces, and spatial polarization is evident. For example, as comprehensive, strong provinces in the marine economy, Guangdong (0.71→0.73) and Shandong (0.57→0.57) have maintained stable and leading positions in coordinated marine economic development over the past decade. It is still necessary to pay attention to the coastal provinces with lower levels of marine economic coordination, such as Liaoning (0.32→0.28), Hainan (0.13→0.17), and Guangxi (0.12→0.13). It is essential to identify the causes of regional imbalance in marine economic development and strive to achieve spatial equilibrium across coastal areas.
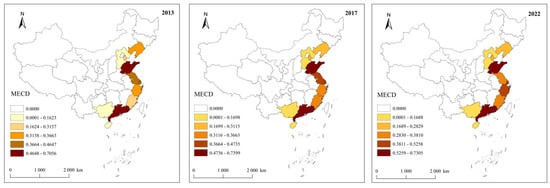
Figure 1.
Spatial distribution of MECD in China for the years 2013, 2017, and 2022. The maps were obtained from the Standard Map Service Website of the Ministry of Natural Resources of China http://bzdt.ch.mnr.gov.cn (accessed on 2 March 2025).
3.2.2. Core Independent Variable: Marine New Qualitative Productivity Forces
Next, we evaluated marine new qualitative productivity forces (MNQPFs). Guided by the scientific connotation of new qualitative productivity forces and drawing on research concerning its integrated evaluation index system [38,39], a framework was formed consisting of 3 criteria-level indicators, 6 element-level indicators, and 16 specific indicators. The factor layer comprises the full-time equivalent of practitioners, talent reserves, digitization, high technology, new services, and new qualitative industries. China’s marine human capital iteration is primarily reflected in the full-time equivalent of practitioners and talent reserves. Innovation concerning marine labor materials in the new era mainly takes the forms of digitization and high technology. Key areas for upgrading marine labor objects include new services and new qualitative industries, as detailed in Table 2.
Table 2.
Evaluation indicator system of MNQPFs.
Following this, we measured the spatial flow level of marine new qualitative productivity force factors. Significant academic debate exists regarding the methods used to explore economic factor flow patterns, partly due to data availability challenges. In this study, we designated the years before factor flow occurred as the research base period, referencing calculation methods for intra-regional industrial transfer by Zhao and Yin [40] and Sun XH et al. [41]. Additionally, the factor flow level was measured, utilizing the relative changes in economic indexes before and after the flow. An attempt was also made to incorporate a variable reflecting the proportion of a region’s economic output to the total coastal area output, aiming to remove interference from existing regional disparities. Equation (13) displays the improved marine factor spatial flow index developed for this purpose:
where FRri,t represents the improved factor flow index, m is the total number of factors examined, and qri,t denotes the scale of factor i in region r in year t. If FRri,t > 0, it indicates that the scale of factor i in region t experienced inflow relative to the initial stage. When FRri,t < 0, the scale of factor i in region r experienced outflow relative to the initial stage. Therefore, calculations using the enhanced factor flow index derive results that indicate both the direction and the magnitude of factor flow. The entropy method was employed for level measurement on the calculated spatial index values concerning marine new qualitative productivity force factor flow; this followed for an approach similar to that used for the coordinated development index of the marine economy. In addition, the weighted mean factor index was integrated into the new ocean labor mobility, labor object mobility, and labor material indices, which is consistent with the theoretical framework detailed earlier in this paper.
Meanwhile, to further explore the spatial–temporal evolution characteristics of marine new qualitative productivity forces in China in 2013, 2017, and 2012, Arc gis 10.8 software was used to make a spatial visualization map, as shown in Figure 2.
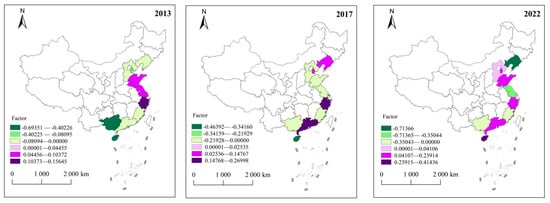
Figure 2.
Spatial distribution of the spatial flow index for MNQPF factors in China in 2013, 2017, and 2022. The map was obtained from the Standard Map Service Website of the Ministry of Natural Resources of China http://bzdt.ch.mnr.gov.cn (accessed on 2 March 2025).
To more intuitively depict the spatial flow characteristics of marine factors in different regions, a bar chart was created using origin 2021. This chart illustrates the sub-item conditions of the flow index of marine new qualitative productivity force factors in the 11 coastal provinces over the past decade, as shown in Figure 3.
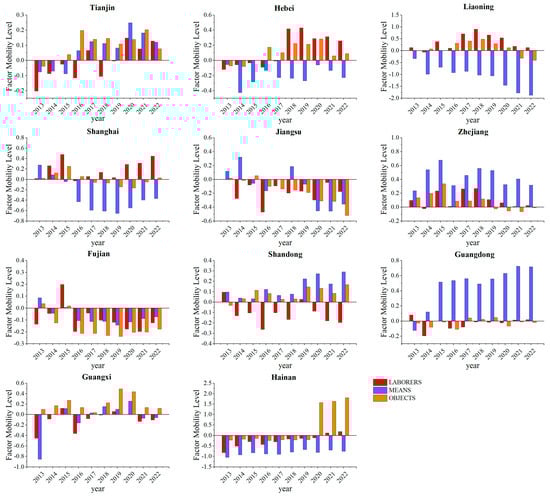
Figure 3.
Breakdown of spatial flow of MNQPF factors.
We made the following observations for the period from 2013 to 2022: ① In terms of the overall changes in marine new-type laborers (LABORERS), Shanghai (0.4460), Hebei (0.2593), and Tianjin (0.1276) generally developed a trend of inflow of marine elements. Provinces in the Yangtze River Delta region, due to their status as economic leaders, attracted a rapid influx of marine new-type talents. Meanwhile, the inflow of elements in provinces in the Beijing–Tianjin–Hebei region was closely related to the concentration of marine-related higher-education institutions. In contrast, Shandong (−0.1960), Jiangsu (−0.1756), and Fujian (−0.1961) overall showed a trend of outflow of marine elements. ② Regarding the overall changes in marine new-type means of labor (MEANS), Guangdong (0.7172), Zhejiang (0.3172), and Shandong (0.2907) demonstrated an inflow of marine elements. These regions, which host numerous global maritime cities and benefit from advanced layouts of high-tech marine applications, have become benchmark areas for China’s digital marine economic development. In contrast, Hainan (−0.7484) and Jiangsu (−0.3574) showed an outflow of elements. ③ In terms of the overall changes in marine new-type objects of labor (OBJECTS), Hainan (1.8083) and Shandong (0.1678) generally showed an inflow of marine elements. Hainan, which is located in the southern marine economic circle, has experienced rapid growth, primarily driven by policy bonuses from national strategies and open cooperation in upgrading its blue industries. Meanwhile, Jiangsu (−0.5183) and Fujian (−0.1758) have developed into provinces with an outflow of marine elements.
3.2.3. Control Variables
Referring to previous research results [42,43,44,45,46], we employed the gross ocean product (GOP) to characterize the level of regional marine economic development. The industrialization level (IND) is defined as the proportion of industrial added value relative to the regional GDP. We measured R&D intensity (RD), using the ratio between internal R&D expenditure and the regional GDP. The financial development level (FIN) corresponds to the proportion represented by deposit balances in financial institutions compared to the GDP. For the marketization degree (MAR), data from the Fan Gang Marketization Index report were applied to determine the total marketization indices from 2013 to 2022 as a static measure.
3.3. Data Sources and Descriptive Statistics
For this study, we selected panel data covering 11 coastal provinces in China for the period 2013 to 2022, with primary data sources drawn from relevant statistical yearbooks published in China. Additional data came from annual financial reports issued by the China National Intellectual Property Administration, the National Bureau of Statistics, and relevant companies. We obtained the output value for emerging strategic marine industries through a conversion method. Separately, the land–sea economic correlation index calculation involved determining the proportion of ocean GDP relative to coastal GDP. Following the approach detailed by Shan HJ (2008) [47] and applying the proportional conversion method, we derived the stock of ocean capital. To determine the utilization level of corporate data factors, we summed the disclosure frequencies in corporate financial reports for indices concerning artificial intelligence, cloud computing, big data applications, and blockchain [48]. Logarithmic processing was also applied specifically to the control variable representing the level of marine economic development. Table 3 presents the descriptive statistical analysis for each variable. Analysis of the coordinated development level of the marine economy indicated a maximum value of 0.748 and a minimum of 0.107. The standard deviation for this measure was 0.179, which points to significant gaps in this development level across the coastal provinces. Differences in the regional marine economy’s development and industrialization levels result in significant differences among coastal provinces’ coordination levels during the flow of marine new productivity factors. Significant differences among provinces are also evident from the standard deviations calculated for each variable; this observation supports the reasonableness of the chosen control variables.
Table 3.
Descriptive statistics of variables.
4. Empirical Results
4.1. Spatial Effect Analysis
4.1.1. Spatial Correlation Analysis
To test whether there is a significant spatial correlation in the coordinated development of the marine economy among the 11 coastal provinces in China, that is, whether there is a similarity, difference, or independence between any two provinces, we used Equation (14):
where Wij represents the spatial weight matrix and employs an inverse distance spatial weight matrix, n is the total number of provinces covered in the coastal region, Yi and Yj are the attribute values of any two non-adjacent provinces, and S2 is the variance of the coordinated development level of the marine economy. The test results using the global spatial autocorrelation analysis method are shown in Table 4. From 2013 to 2022, Moran’s I was greater than 0 and significant at the 10% and 5% levels, indicating a clear spatial correlation in the coordinated development level among the coastal provinces of China. Additionally, the increasing trend of Moran’s I over the years suggests that the coordinated development level of the marine economy among the coastal provinces is improving year by year.
Table 4.
Moran’s I test results.
Furthermore, a local spatial autocorrelation test was conducted on the coordinated development of the marine economy to examine its overall distribution trends and characteristics. Local Moran’s I scatter plots for the coordinated development of the marine economy were drawn for the years 2013 and 2022, as shown in Figure 4. In 2013 and 2022, the provinces in the first quadrant of the coastal region of China with high marine economic efficiency were Guangdong (GD), Shandong (SD), Shanghai (SH), Zhejiang (ZJ), and Jiangsu (JS). These provinces exhibit a “high–high” spatial correlation pattern, where provinces with higher levels of coordinated marine development are surrounded by other provinces with higher coordination levels. Spatially, they tend to cluster together, promoting mutual advancement. In contrast, the provinces of Fujian (FJ), Liaoning (LN), Tianjin (TJ), Hebei (HB), Hainan (HN), and Guangxi (GX) were located in the third quadrant, indicating a “low–low” spatial correlation pattern. These provinces with lower levels of marine economic coordination are similarly surrounded by other provinces with lower coordination levels and, thus, exert negative spatial influences on each other.
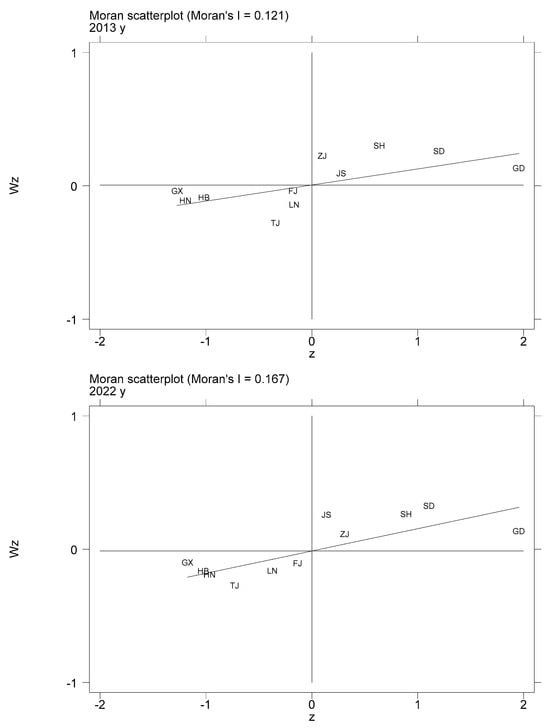
Figure 4.
Moran’s I scatter plots of MECD in coastal provinces (2013 vs. 2022).
4.1.2. Spatial Markov Chain Analysis
To further capture the internal directional shifts and positional transition features of marine economic coordinated development, this study introduces both traditional and spatial Markov transition probability matrices for analysis, with the results presented in Table 5. The analysis of the traditional Markov chain shows that diagonal elements consistently exceed off-diagonal elements. Specifically, provinces classified within low, moderately low, moderately high, and high coordination tiers exhibit persistence probabilities of 92%, 83.3%, 84.62%, and 95.83%, respectively, after one year. This indicates significant stability in marine economic coordination across development tiers, demonstrating a club convergence phenomenon. Moreover, persistence probabilities at both distribution extremes surpass intermediate values, revealing reinforced convergence tendencies for low- and high-tier provinces. Low-tier and high-tier persistence probabilities remain notably elevated at 92% and 95.83%. All observed transitions occur solely between adjacent tiers, confirming that development follows step-by-step progression rather than leapfrogging transitions. Critically, downward transition probabilities measure 8.33% for moderately low to low tier, 7.69% for moderately high to moderate tier, and 4.17% for high to moderately high tier. This inverse relationship indicates elevated regression risks for less-developed provinces, necessitating vigilance against developmental regression in coastal regions with fragile coordination foundations.
Table 5.
Traditional and spatial Markov transition probability matrices.
These findings necessitate the integration of spatial dimensions, leading to the construction of spatial Markov transition matrices detailed in Table 5. Crucially, the four transition matrices diverge significantly across distinct spatial lag types. This divergence confirms that when neighboring provinces exhibit heterogeneous coordination levels, the transition probabilities of a local province’s economic coordination become fundamentally reconfigured. Furthermore, diagonal elements in all matrices consistently surpass off-diagonal values. This pattern reveals substantial persistence in marine economic coordination status, implying a high probability of low-tier lock-in under spatial spillovers. Concurrently, non-zero off-diagonal elements flanking the diagonals emerge universally. This demonstrates inherent instability within China’s marine economic coordination system: while upward transitions remain attainable, discernible risks of regression exist alongside stringent constraints against cross-tier leapfrogging.
4.1.3. Selection of Spatial Econometric Model
In this study, we employed the LM test, LR test, and Wald test to select an appropriate spatial econometric model. The test results are shown in Table 6. The results indicate that the LM test passed the significance test at the 1% level, suggesting that both the spatial error effect and the spatial lag effect are significant. The LR and Wald tests were also significant at the 1% level, indicating that the Spatial Durbin Model (SDM) cannot be reduced to either the Spatial Lag Model (SLM) or the Spatial Error Model (SEM). The Hausman test rejected the null hypothesis, leading to the selection of a time-fixed effects model. Therefore, we adopted the Spatial Durbin Model under time-fixed effects to examine the spatial impact of the flow of marine new qualitative productivity force factors on the coordinated development of China’s marine economy.
Table 6.
Test results for spatial econometric model selection.
4.1.4. Test of the Spatial Durbin Model
According to the SDM regression results shown in Table 7, the spatial correlation coefficient ρ was significantly negative at the 1% level, indicating a clear spatial negative correlation in the coordinated development level of the marine economy among the coastal provinces of China. This suggests that there is a negative spillover phenomenon in the coordinated development of the marine economy among China’s coastal provinces, meaning that the coordination level of the marine economy in neighboring regions has a negative feedback effect. The impact coefficient of the flow of marine new qualitative productivity force factors for regional coordinated development was 0.081 and was significant at the 1% level, indicating that the flow of marine new qualitative productivity force factors significantly improves local marine economic coordinated development levels. Hypothesis 1 is thus validated. Regarding spatial effects, in the SDM model that includes global effects, the spatial lag coefficient of the flow of marine new qualitative productivity force factors was significantly positive at the 1% level. This indicates that the flow of marine new qualitative productivity force factors can significantly enhance the coordinated development level of the marine economy in neighboring regions.
Table 7.
Test results of the Spatial Durbin Model.
Furthermore, the results of the spatial spillover effect decomposition shown in Table 8 indicate that the direct effect of the flow of marine new qualitative productivity force factors on the coordinated development of the marine economy was significantly positive at the 1% level. The indirect effect and the total effect were significantly positive at the 5% and 1% levels, respectively. This suggests that the flow of marine new qualitative productivity force factors simultaneously improves the coordinated development levels of the marine economy in both local and neighboring regions. Thus, Hypotheses 1 and 2 are validated.
Table 8.
Effect decomposition of the Spatial Durbin Model.
Regarding the control variables, in the effect decomposition of the SDM, the direct, indirect, and total effects of the level of marine economic development and the degree of marketization were all significantly positive. This indicates that regions with higher overall levels of marine economy experience faster expansion of the marine economic scale, which can improve marine social welfare conditions in both the local and surrounding areas [49]. In regions with a high degree of marketization, economic factors are more frequently exchanged and circulated, enabling the local and surrounding markets to enhance overall coordination through regional openness and cooperation [50]. The direct effect of financial development level was significantly positive, while the indirect and total effects were negative. Provinces with strong financial development may engage in capital competition with neighboring provinces, thereby inhibiting the coordinated development of the marine economy in the surrounding areas. Unexpectedly, the direct, indirect, and total effects of R&D intensity were significantly negative. This suggests that R&D investment should not solely pursue quantity. Government-led R&D investment may deviate from market demand, weakening market-oriented innovation capabilities and leading to the misallocation of innovative resources.
4.2. Robustness Checks
To verify the validity of the obtained convergence test results, we employed two approaches, as outlined in Table 9, to conduct a robustness test on the conclusions drawn above. First, the spatial weight matrix setting was replaced by considering the influence of both geographical and economic factors, and a new estimation was conducted using an economic–geographical matrix. The results show that the signs and significance levels of the core explanatory variables were consistent with the basic regression. Second, a 1% winsorization was applied to the dependent variable.
Table 9.
Robustness checks.
By comparing the regression coefficients and significance levels of the main variables as shown in Table 8, it can be seen that the regression results are essentially consistent, indicating that the original model is robust.
4.3. Further Analysis
From the analysis results above, it is evident that there is a significant spatial correlation between the flow of marine new qualitative productivity force factors among China’s coastal provinces and the coordinated development of China’s marine economy. However, according to the definition provided earlier, new qualitative productivity force factors consist of marine new-type laborers (LABORERS), marine new-type means of labor (MEANS), and marine new-type objects of labor (OBJECTS). The different types of marine new qualitative productivity force factors have varying flow speeds and allocation efficiencies, which can exert heterogeneous impacts on the coordinated development of the marine economy. This section will explore the impact of the spatial flow of marine new qualitative productivity force factors on the coordinated development of China’s marine economy from the three dimensions of the core explanatory variables.
The regression results are shown in Table 10 and Table 11, with the following observations made: ① The impact coefficient of the spatial flow of marine new-type laborers for the coordinated development of the marine economy in coastal regions was −0.047 and was significant at the 10% level. This suggests that the flow of marine new qualitative productivity force factors negatively affects the improvement of local coordinated development levels of the marine economy. Regarding spatial effects, the spatial lag coefficient of the flow of marine new-type laborers was significantly negative at the 5% level, indicating that the inter-provincial flow of marine new-type laborers has also failed to effectively enhance the coordinated development levels of neighboring regions’ marine economies. ② The impact coefficient of the spatial flow of marine new-type means of labor for the coordinated development of the marine economy was 0.061 and was significant at the 1% level. Its spatial lag term also passed the significance test. This indicates that the spatial flow of marine new-type means of labor significantly and positively impacts the improvement of the coordinated development levels of both the local and surrounding regions’ marine economies. The decomposition results shown in Table 11, which are significantly positive, further support this conclusion. ③ The impact coefficient of the spatial flow of marine new-type objects of labor for the coordinated development of the marine economy in coastal regions was 0.029 and was significant at the 10% level. However, its spatial effect on surrounding regions was not significant. The spatial spillover effect decomposition displayed in Table 11 further shows that the direct effect of the spatial flow of marine new-type objects of labor on the coordinated development of the marine economy was significantly positive at the 10% level, while the indirect and total effects were not significant. This suggests that the spatial flow of marine new-type objects of labor promotes the coordinated development of the local marine economy but currently has no clear impact on surrounding regions. This conclusion validates Hypothesis 3.
Table 10.
Spatial Durbin Model results for MNQPFs across dimensions.
Table 11.
Multidimensional decomposition of spatial effects on MNQPF factors.
5. Discussion
To confront the increasingly severe challenges of climate change and environmental degradation, China’s marine economy urgently requires greater emphasis on the trilateral coordination of “economy–ecology–society” and the adoption of environmentally friendly practices in its developmental trajectory. Within this context, new qualitative productivity forces play a pivotal role. This aligns with the conclusion that developing novel, high-quality productive forces in marine sectors is not only critical for addressing global sustainability challenges but also essential for enhancing economic resilience [14]. Building upon the theoretical framework established in [4], we empirically investigated the impacts of spatial flows of marine new qualitative productivity force factors on both local and neighboring regions. Furthermore, we conducted a granular analysis of how new, heterogeneous marine qualitative productivity force factors’ spatial mobility influences the coordinated development of the marine economy. We thereby systematically elucidated the underlying spatial transmission mechanisms. However, based on Marx’s traditional factors of production as fundamental inputs, this paper has yet to address the factors such as resource environment, government regulation, business environment, and debt capital, which are emphasized in Porter’s Diamond Model [51], particularly China’s renewable energy investments [52] and governmental environmental regulations. As exemplified by the Porter Hypothesis, well-designed environmental regulations can long-term offset compliance costs to achieve ecological civilization dividends, fostering green economic growth [53]. Porter emphasizes the critical role that natural resources play in international competition, particularly their significant influence on the formation and development of certain industries. Specifically, marine resources, such as fisheries and mineral resources, provide essential raw materials and energy support for marine industries, thereby enhancing their competitiveness [54]. Furthermore, the sustainable development of the marine economy is fundamentally dependent on a robust business environment and ethical practices that align with sustainability principles [51]. Typically, marine economic projects demand significant capital investment, especially in sectors like marine energy development and infrastructure. Consequently, the degree of development of debt capital and financial markets plays a crucial role in determining the feasibility of these projects [55]. We will conduct further research on these factors in future studies. This constitutes the primary focus for subsequent research.
6. Conclusions and Recommendations
6.1. Conclusions
The main conclusions of this study are as follows.
Firstly, from 2013 to 2022, the overall level of spatial flow of marine new qualitative productivity force factors in China’s coastal provinces has shown an upward trend. The index exhibits a spatial pattern evolving from a “clustered” distribution to a “scattered” distribution. The level of coordinated development of the marine economy has steadily improved, with significant spatial polarization phenomena. China’s marine economy exhibits “club convergence”, with spatial spillover effects substantially reinforcing lower-tier lock-in probabilities. Coastal provinces demonstrating fragile coordination foundations necessitate special vigilance against development regression to safeguard hard-won developmental gains. Secondly, the spatial flow of marine new qualitative productivity force factors significantly and positively impacts the coordinated development of China’s marine economy in the local region. The spatial flow of marine new qualitative productivity force factors has a significant spatial spillover effect on the coordinated development of the marine economy in neighboring regions. Thirdly, the spatial flow of marine new qualitative productivity force factors across different dimensions has heterogeneous effects on the coordinated development of the marine economy. The marine new-type objects of labor and marine new-type means of labor have a more significant impact on the coordinated development of the marine economy. However, for marine new-type laborers, the spatial impact is not significant.
6.2. Recommendations
Building upon the new qualitative productivity forces framework, this study conceptualizes new, maritime-specific qualitative productivity forces and empirically examines the spatially mediated impacts of their factor mobility across local-contiguous zones, with micro-scale analysis elucidating heterogeneous factor flows’ influence on marine economic coordination mechanisms. For China’s context, firstly, the state should implement a comprehensive strategy to develop marine new qualitative productivity forces according to local conditions [56], guiding orderly labor flows while upgrading higher-education systems [57] and integrating big data/deep-sea technologies with traditional marine methods through advanced planning for marine new energy industries [58]. Next, coastal provincial governments should promote rational factor flows, establish advanced marine research platforms, and implement targeted provincial policies to narrow development gaps while strengthening inter-regional cooperation [59,60]. Finally, local governments must incorporate spatial spillover effects when formulating innovation policies, accurately mapping marine economic element flows while eliminating institutional barriers. Concurrently, they should expand inter-regional innovation platforms and establish industrial technology alliances to harness “spillover bonuses” for coordinated marine economic development [61].
From a global lens, due to differences in the geographical location, climate, culture, and other factors, the development models of the marine economy in different regions vary significantly. The Ionian Sea, as a constituent part of the Mediterranean, faces significant pressure from declining marine biodiversity along its coasts. Implementing tailored management actions and integrating elements of novel marine productivity could effectively mitigate environmental stressors in this region [62]. Taking EU member states as an example, beyond environmental regulation, factors such as labor and capital structure, research and development (R&D) expenditure, GDP per capita, and trade value significantly influence sustainable development outcomes both domestically and in neighboring countries. Thus, effectively guiding the concentration and well-regulated flow of high-value blue economy factors would further accelerate the coordinated development of the regional marine economy [63].
There are still some limitations of this study that are worth further discussion. First, although in this study we attempted to explore the impact mechanism of the spatial flow of marine new qualitative productivity forces for the coordinated development of China’s marine economy, we did not deeply investigate the spatial differences in the impact of different types of marine new-type elements on marine economic development due to the limitation of sample size in the GWR model. More appropriate methods and models could be used for in-depth exploration in the future. Second, the global COVID-19 pandemic in 2020 impacted the development of the marine economy. This can be seen from the typical dynamic characteristics of element flow and the coordinated agglomeration level of the marine economy explored in this paper. However, the impact of the pandemic was not analyzed in this study. Lastly, for this study, we only considered the flow of marine new qualitative productivity force factors in the 11 coastal provinces, not non-coastal provinces, resulting in a lack of data volume. And the inclusion of 53 coastal cities as spatial units merits dedicated investigation, which would provide more granular reflection of context-specific dynamics across China’s coastal regions.
Author Contributions
Conceptualization, J.W. and Y.Z.; methodology, Y.Z.; funding acquisition, S.L.; supervision, S.L.; software, J.W.; formal analysis, S.C.; investigation, Y.Z.; resources, C.W.; data curation, Y.L.; validation, Y.L.; writing—original draft preparation, Y.Z. and S.L.; writing—review and editing, S.C. and Y.Z.; visualization, C.W. All authors have read and agreed to the published version of the manuscript.
Funding
This research was funded by the Major Project of the National Social Science Fund of China, “Building a Maritime Power in the New Era”, grant number 24VHQ004.
Institutional Review Board Statement
Not applicable.
Informed Consent Statement
Not applicable.
Data Availability Statement
The original contributions presented in this study are included in the article. Further inquiries can be directed to the corresponding author(s).
Conflicts of Interest
The authors declare no conflicts of interest.
References
- Xi, J.P. Developing new-quality productive forces is an essential requirement and a crucial focus for advancing high-quality development. Qiushi 2024, 4–8. (In Chinese) [Google Scholar]
- Du, D. Continuously improve the systematic, holistic, and synergistic aspects of advancing high-quality development. Chin. Qual. 2023, 17–19. (In Chinese) [Google Scholar] [CrossRef]
- Guangming Daily. Available online: https://news.gmw.cn/2024-02/22/content_37158384.htm (accessed on 4 May 2025).
- Zhang, K.Y. Promote Coordinated Regional Economic Development by Optimizing New-Quality Productive Forces Allocation. New Urban. 2024, 12. (In Chinese) [Google Scholar]
- Fang, C.L.; Sun, B. The connotation of new-quality productive forces and research priorities for driving urban-rural integrated development from the geographical perspective. Acta Geogr. Sin. 2024, 79, 1357–1370. (In Chinese) [Google Scholar]
- Liu, S.G. Strategic Research on Building the National Marine Innovation System; China Finance & Economy Media Group Press: Beijing, China, 2017. [Google Scholar]
- People’s Daily. Available online: https://www.gov.cn/gongbao/content/2019/content_5407653.htm (accessed on 1 May 2025).
- Smith, A. The Wealth of Nations: An Inquiry into the Nature and Causes of the Wealth of Nations; W. Strahan & T. Cadel Press: London, UK, 1776. [Google Scholar]
- Marx, K.H. Critique of political Economy; Franz Duncker Press: Berlin, Germany, 1859; Volume 1. [Google Scholar]
- Perroux, F. The Economy of the 20th Century; PUF: Parris, France, 1961. [Google Scholar]
- Krugman, P.R. Increasing returns and economic geography. J. Polit. Econ. 1991, 99, 483–499. [Google Scholar] [CrossRef]
- Schumpeter, J. The Theory of Economic Development; Harvard University Press: Cambridge, MA, USA, 1912. [Google Scholar]
- Xi, J.P. Navigating the New Frontier of High-Quality Development in China. Qiushi 2024, 4–15. (In Chinese) [Google Scholar]
- Feng, Y.; Zhang, S.Y. Exploring new-quality productive forces in ocean governance: Insights from China’s practices and strategic direction. Mar. Policy 2025, 176, 106656. [Google Scholar] [CrossRef]
- Fan, J. Regional Coordinated Development and Its Economic Geography Principles during the 14th Five-Year Plan and the 15th Five-Year Plan Periods. Econ. Geogr. 2025, 45, 1–7. (In Chinese) [Google Scholar] [CrossRef]
- Wang, X.L.; Fan, G. Analysis on the Regional Disparity in China and the Influential Factors. Econ. Res. J. 2004, 1, 33–44. (In Chinese) [Google Scholar]
- Guo, J.; Yuan, X.T.; Song, W.L. Driving forces on the development of China’s marine economy: Efficiency and spatial perspective. Ocean Coast. Manag. 2022, 224, 106192. [Google Scholar] [CrossRef]
- Xu, J.R.; Tian, J.; Liu, Y.J. The study of coevolution relationship among coastal marine economy, innovation, and ecology based on Chinese complex systems. Financ. Res. Lett. 2024, 65, 105549. [Google Scholar] [CrossRef]
- Tartaruga, I.; Sperotto, F.; Carvalho, L. Addressing inclusion, innovation, and sustainability challenges through the lens of economic geography: Introducing the hierarchical regional innovation system. Geogr. Sustain. 2024, 5, 1–12. [Google Scholar] [CrossRef]
- Gao, S.; Sun, H.H.; Wang, J.Y.; Liu, W. Evaluation and Countermeasures of High-Quality Development of China’s Marine Economy Based on PSO-SVM. Sustainability 2022, 14, 10749. [Google Scholar] [CrossRef]
- Feng, R.; Chen, S.; Dai, D.D.; Xin, Y.R. Examining the spatiotemporal evolution, dynamic convergence and drivers of green total factor productivity in China’s urban agglomerations. Econ. Anal. Policy 2023, 78, 744–764. [Google Scholar] [CrossRef]
- Xu, S.; Liu, Y.H. Research on the impact of carbon finance on the green transformation of China’s marine industry. J. Clean. Prod. 2023, 418, 138143. [Google Scholar] [CrossRef]
- Duranton, G.; Puga, D. Chapter 48—Micro-Foundations of Urban Agglomeration Economies. In Handbook of Regional and Urban Economics; Elsevier: Amsterdam, The Netherlands, 2004; Volume 4, pp. 2063–2117. [Google Scholar] [CrossRef]
- Hao, D.J.; Zhang, R. Factor Endowments, Agglomeration Effects, and the Transition of Economic Growth Dynamics. Economist 2018, 1, 41–49. (In Chinese) [Google Scholar] [CrossRef]
- Ethier, W.J. National and International Returns to Scale in the Modern Theory of International Trade. Am. Econ. Rev. 1982, 72, 389–405. [Google Scholar]
- Wang, B.D.; Su, J. Can the Free Flow of Factors Lead to Regional Coordinated Development? A Theoretical Hypothesis and Empirical Test Based on “Coordinated Agglomeration”. Financ. Trade Econ. 2020, 41, 129–143. (In Chinese) [Google Scholar] [CrossRef]
- Sun, C.Z.; Lisng, Z.H.; Zhai, X.Q.; Wang, L.J. Obstacles to the development of China’s marine economy: Total factor productivity loss from resource mismatch. Ocean Coast. Manag. 2024, 249, 107009. [Google Scholar] [CrossRef]
- Tombe, T.; Zhu, X.D. Trade, Migration, and Productivity: A Quantitative Analysis of China. Am. Econ. Rev. 2019, 109, 1843–1872. [Google Scholar] [CrossRef]
- Sun, T.; Bian, X.Z.; Liu, J.X.; Wang, R.; Sriboonchitta, S. The economic and social effects of skill mismatch in China: A DSGE model with skill and firm heterogeneity. Econ. Model. 2023, 125, 106345. [Google Scholar] [CrossRef]
- Fan, H.C.; Ding, G.Z.; Zhang, L.N. External Economic and Trade Shocks, Domestic Factor Mobility and China’s Economic Growth. Econ. Res. J. 2024, 59, 151–169. (In Chinese) [Google Scholar]
- Ma, S.J.; Wang, R.S. The social-economic-Natural Complex Ecosystem. Econ. Res. J. 1984, 4, 1–9. (In Chinese) [Google Scholar]
- Wang, Y.; Hu, J.F.; Pan, H.; Li, S.Y.; Failler, P. An integrated model for marine fishery management in the Pearl River Estuary: Linking socio-economic systems and ecosystems. Mar. Policy 2016, 64, 135–147. [Google Scholar] [CrossRef]
- Lloret, J.; Riera, V. Evolution of a Mediterranean Coastal Zone: Human Impacts on the Marine Environment of Cape Creus. Environ. Manag. 2008, 42, 977–998. [Google Scholar] [CrossRef] [PubMed]
- Simeoni, C.; Furlan, E.; Pham, H.V.; Critto, A.; Juan, S.D.; Trégarot, E.; Cornet, C.C.; Meesters, E.; Fonseca, C.; Botelho, B.Z.; et al. Evaluating the combined effect of climate and anthropogenic stressors on marine coastal ecosystems: Insights from a systematic review of cumulative impact assessment approaches. Sci. Total Environ. 2023, 861, 160687. [Google Scholar] [CrossRef]
- Liu, S.G.; Xu, Y.J.; Wang, J.Y. Relationship between river basin economic system opening-up and sustainable development: International experiences and implications for the Yellow River Basin high-quality development. Resour. Sci. 2020, 42, 433–445. (In Chinese) [Google Scholar] [CrossRef]
- Fernandes, M.; Larruga, F.; Alves, F.L. Spatial characterization of marine socio-ecological systems: A Portuguese case study. J. Clean. Prod. 2022, 363, 132381. [Google Scholar] [CrossRef]
- Fang, X.H.; Zhang, Y.; Yang, J.J.; Zhan, G.H. An evaluation of marine economy sustainable development and the ramifications of digital technologies in China coastal regions. Econ. Anal. Policy 2024, 82, 554–570. [Google Scholar] [CrossRef]
- Zeng, P.; Qin, Y.H.; Zhou, L.C. Measurement and spatiotemporal pattern of new-quality productive forces level in Chinese cities. Prog. Geogr. 2024, 43, 1102–1117. [Google Scholar]
- Dai, S.Y.; Che, B.A. Study on the Level of New-Quality Productive Forces and Influencing Factors in China’s Coastal Areas Based on TOPSIS-Integrated Learning Model. Ocean Dev. Manag. 2024, 41, 47–59. (In Chinese) [Google Scholar] [CrossRef]
- Zhao, X.L.; Yin, H.T. Industrial relocation and energy consumption: Evidence from China. Energ. Policy 2011, 39, 2944–2956. [Google Scholar] [CrossRef]
- Sun, X.H.; Guo, X.; Wang, J. Industrial Relocation, Elements Agglomeration and Regional Economic Development. J. Manag. World 2018, 34, 47–62. (In Chinese) [Google Scholar] [CrossRef]
- Ji, J.Y.; Liu, H.M.; Yin, X.M. Evaluation and regional differences analysis of the marine industry development level: The Case of China. Mar. Policy 2023, 148, 105445. [Google Scholar] [CrossRef]
- Harris, J.L.; Sunley, P. Multi-system dynamics in regional path upgrading: The intra- and inter-path dynamics of green industrial transitions in the Solent marine and maritime pathway. Prog. Econ. Geog. 2023, 1, 100005. [Google Scholar] [CrossRef]
- Nwani, C.; Omoke, P.C. Investing in the blue economy: Socioeconomic dynamics in the impact of government expenditure on marine ecosystem sustainability in Nigeria. Mar. Policy 2025, 178, 106701. [Google Scholar] [CrossRef]
- Wang, S.H.; Lu, B.B.; Yin, K.D. Financial development, productivity, and high-quality development of the marine economy. Mar. Policy 2021, 130, 104553. [Google Scholar] [CrossRef]
- Cadogan, J.W.; Souchon, A.L.; Procter, D.B. The quality of market-oriented behaviors: Formative index construction. J. Bus. Res. 2008, 61, 1263–1277. [Google Scholar] [CrossRef]
- Shan, H.J. Reestimating the Capital Stock of China: 1952–2006. J. Quant. Technol. Econ. 2008, 25, 17–31. (In Chinese) [Google Scholar]
- Fu, Y.; Ni, J.C.; Fang, M.W. The impact of artificial intelligence on digital enterprise innovation. J. Clean Prod. 2025, 36, 200538. [Google Scholar] [CrossRef]
- Wu, R.H.; Wang, W.; Yang, L.H.; Wu, Y. Regional Gaps, Spatial Distribution Patterns, and Evolutionary Trends of Marine New-Quality Productivity in China. Water 2025, 17, 1266–1275. [Google Scholar] [CrossRef]
- Yin, K.D.; Zhang, K.; Huang, C. Institutional supply, market cultivation, and the development of marine strategic emerging industries. Mar. Policy 2022, 139, 105045. [Google Scholar] [CrossRef]
- Porter, M.E. The Competitive Advantage of Nations; Free Press: New York, NY, USA, 1990. [Google Scholar]
- Fang, K.; Zhou, Y.H.; Wang, S.; Ye, R.; Guo, S.J. Assessing national renewable energy competitiveness of the G20: A revised Porter’s Diamond Model. Renew. Sustain. Energy Rev. 2018, 93, 719–731. [Google Scholar] [CrossRef]
- Jafeetal, A.B.; Palmer, J.K. Environmental regulation and innovation: A panel data study. Rev. Econ. Stat. 1997, 7, 610–619. [Google Scholar]
- Markou, M. Corporate Social Responsibility and Environmental Sustainability: Drivers for CSR and Sustainability Trends in the Shipping Industry. Master’s Dissertation, University of Piraeus, Pireas, Greece, 2024. [Google Scholar] [CrossRef]
- Wiegele, J.; Jones, C. Marine Energy Commercialization Review: Evaluation of the Transition from Public to Private Capital; NREL/TP-5700-912132024; National Renewable Energy Laboratory: Golden, CO, USA, 2024. Available online: https://www.nrel.gov/docs/fy25osti/91213.pdf (accessed on 24 March 2025).
- Sun, Y.; Zhou, Z.L.; Fang, Y.; Bie, M.; Sun, X.G. Analysis of Regional Disparities, Spatiotemporal Evolution and Key Influencing Factors of Marine New Productive Forces in China. Sustainability 2025, 17, 1432. [Google Scholar] [CrossRef]
- Zeng, S.L.; Fu, Q.Y.; Ji, M. Research on the theoretical connotation, realistic basis, challenges and countermeasures of new qualitative productivity forces from the perspective of innovation. J. Shanghai Univ. Int. Bus. Econ. 2024, 31, 49–63. (In Chinese) [Google Scholar] [CrossRef]
- Zheng, H.; Liu, X.D.; Xu, Y.J.; Mu, H.R. Economic Spillover Effects of Industrial Structure Upgrading in China’s Coastal Economic Rims. Sustainability 2021, 13, 3855. [Google Scholar] [CrossRef]
- An, D.; Shen, C.L.; Yang, L. Evaluation and Temporal-Spatial Deconstruction for High-Quality Development of Regional Marine Economy: A Case Study of China. Front. Mar. Sci. 2022, 9, 916662. [Google Scholar] [CrossRef]
- Zeng, S.L.; Shen, Y. New quality productivity and high-quality development of finance: Driving Logic and Implementation Path. J. Fujian Agric. For. Univ. 2024, 176, 17–26. (In Chinese) [Google Scholar] [CrossRef]
- Fan, J.; Chen, D.; Li, J.M.; Guo, R.; Chen, Z. Regional characteristics and layout laws of new-quality productive forces: A study on developing new-quality productive forces according to local conditions from a geographical perspective. Sci. Geogr. Sin. 2025, 45, 47–60. (In Chinese) [Google Scholar]
- Chiara, P.; Bearzi, G.; Christensen, V. Effects of local fisheries and ocean productivity on the northeastern Ionian Sea ecosystem. Ecol. Model. 2010, 221, 1526–1544. [Google Scholar] [CrossRef]
- Xu, Y.J.; Liao, X.C.; He, R.F.; Liu, S.G. Impact of environmental regulation intensity on the efficiency of sustainable economic growth in the European Union. J. Clean. Prod. 2024, 434, 140047. [Google Scholar] [CrossRef]
Disclaimer/Publisher’s Note: The statements, opinions and data contained in all publications are solely those of the individual author(s) and contributor(s) and not of MDPI and/or the editor(s). MDPI and/or the editor(s) disclaim responsibility for any injury to people or property resulting from any ideas, methods, instructions or products referred to in the content. |
© 2025 by the authors. Licensee MDPI, Basel, Switzerland. This article is an open access article distributed under the terms and conditions of the Creative Commons Attribution (CC BY) license (https://creativecommons.org/licenses/by/4.0/).