Article

Environmental and Cultural Tourism in Heritage-Led Regions—Performance Assessment of Cultural-Ecological Complexes Using Multivariate Data Envelopment Analysis

1
Faculty of Management, Open University of the Netherlands (OU), 6419 AT Heerlen, The Netherlands
2
Erasmus School of Economics, Erasmus University, 3000 DR Rotterdam, The Netherlands
3
Faculty of Economics and Business, Rijeka University, 51000 Rijeka, Croatia
4
School of Public Policy and Management, Tsinghua University, Beijing 100084, China
5
Faculty of Engineering, Hokkai-Gakuen University, Sapporo 064-0926, Japan
*
Author to whom correspondence should be addressed.
Sustainability 2025, 17(13), 5871; https://doi.org/10.3390/su17135871
Submission received: 16 January 2025 / Revised: 9 May 2025 / Accepted: 5 June 2025 / Published: 26 June 2025
(This article belongs to the Special Issue Urban Green Areas: Benefits, Design and Management Strategies)

Abstract

Cultural and ecological heritage is often an essential ingredient for sustainable urban and regional regeneration and needs to be properly managed for an environment-benign development. Many heritage-led areas in Europe, named here ‘cultural-ecological complexes’ (CECs), seek a sustainable, regenerative, and actionable strategy. Our study aims to identify successful CECs from the viewpoint of their transformative cultural potential, assessed through surveys among visitors and residents. The research focuses on the assessment of seven Cultural-Ecological Complexes (CECs) in Europe: Karlsborg (Sweden), Mark (Sweden), Larnaca (Cyprus), Basilicata (Italy), Huesca (Spain), Vojvodina (Serbia), and Sibiu (Romania/Moldova). The European areas under study are selected on the basis of their transformative cultural tourism profile and potential, with the aim of tracing a balanced, sustainable development and a positive regenerative or circular transition. Each CEC was analyzed based on its transformative cultural potential and sustainability impact using multivariate Data Envelopment Analysis (DEA). Each region under consideration comprises a set of ‘information agents’, in particular visitors and residents, who may be regarded as informal stakeholders providing crucial or decisive information and guidelines on the sustainability situation in the region and on ways to proceed to transformative cultural tourism. This novel approach is essentially a form of citizen-based or agent-based co-creation. In our study, empirical information on the perceptions, preferences, and involvement of such agents was collected through systematically structured and consistently administered surveys among hundreds of participants (visitors, residents, etc.) in seven CECs in Europe. The research methodology is based on a blend of multivariate statistics (in particular, Principal Component Analysis—PCA) and spatial efficiency analysis (using Data Envelopment Analysis—DEA). The agents in each region are conceived of as spatial decision-making units (DMUs) in a DEA framework. Our DEA assessment model contains a multiscalar structure organized in a cascadic and interactive form with two constituents, namely cultural-ecological areas (CECs) and place-based information agents. The findings from this novel Multivariate DEA provide generic directives for an enhancement of the cultural-ecological performance for CECs and offer quantitative information for place-based efficiency-improving strategies of CECs in various contexts.

1. Introduction

Heritage-led urban and regional development has in recent years gained much popularity all over the world. It finds its origins in the presence of—and access to—unique cultural-historical and ecological amenities which act as an area-specific identifier and centrifugal attractor for both residents and visitors [1,2]. In many cases, the visitors’ attractiveness of an area is not only dependent on a single or stand-alone cultural or historical asset (like the Leaning Tower of Pisa or the Taj Mahal in Agra); the fascination of visitors for heritage sites is often stimulated by a diversified portfolio of different—often complementary—cultural-historical and ecological attractions in the geographic vicinity, which create local synergy and reinforce each other. Such an externality-driven spatial heritage cluster in a local or regional area is sometimes called a cultural district or heritage area, while in a broader regional setting, this may be regarded as a cultural-historical or ecological heritage complex (e.g., the Vienna agglomeration, including the nearby Viennese Woods, the Florence region, including the surrounding Tuscany area, the Las Vegas metropolitan area with its adjacent natural parks, including the Grand Canyon, etc.). Such a geographical complex may generate significant economic cluster benefits and explain the booming success of various major tourist destinations in the world.
The cultural cluster concept, termed hereafter a Cultural-Ecological Complex (CEC), is comparable to earlier regional planning concepts on industrial complexes (see, e.g., [3,4]), which have formed the basis for a place-based industrial growth policy for economically depressed or lagging regions. This strategic view on spatially concentrated economic growth (‘smart local specialization’)—as a result of geographic scale and agglomeration advantages—has, in the past decades, become popular under the name of industrial clusters or innovation clusters (see, e.g., [5,6]). In more recent years, this perspective has, in the field of culture and tourism, prompted the notion of creative or cultural complexes (see, e.g., [7,8]). These are, in general, geographically and functionally connected groups of cultural and ecological amenities that, due to their mutual culture-led or heritage-led externalities, are able to attract significant flows of visitors to a given attraction area and prompt also accelerated new development due to the centrifugal and centripetal power of such areas to a variety of creative people (e.g., artists) (see [9]). The most important feature, however, of such cultural-historical complexes is their transformative capability, the potential to act as new nodes for a balanced historical and ecological preservation and creative sustainable development (e.g., a circular economy). This new role will be addressed in this study from both a user (visitor) and a regional perspective.
This study builds upon prior research in cultural tourism, integrating theoretical insights from co-creation, cultural sustainability, and destination competitiveness models (e.g., [10,11,12,13,14,15,16]). Recent research has emphasized the importance of understanding the complex relationships between cultural heritage, sustainable development, and community engagement, particularly within the framework of circular economy principles (e.g., [8,17,18,19]). Such studies have highlighted how heritage-led initiatives can drive not only economic growth but also social and environmental benefits, positioning cultural-ecological complexes as sustainable tourism models. Moreover, the application of co-creation in tourism, where local residents, businesses, and tourists collaborate, has been shown to enhance both visitor satisfaction and the sustainability of the destinations [20]. These insights are pivotal to understanding how CECs function as transformative hubs for sustainable tourism and regional development.
In the present paper, a new heritage-led economic perspective is presented in which various tourist areas scattered all over Europe are regarded as socio-economic heritage-led attraction poles for visitors. The long-range benefits of such heritage areas are, of course, contingent on their perceived attractiveness by both visitors and locals. Consequently, these heritage regions may be seen as ‘cultural-ecological complexes’ (CECs) which may generate sustainable urban and regional revenues (based on a circular cultural tourism industry and climate-neutral metabolism), without jeopardizing their future significance for maintaining cultural heritage or the fragile place-based ecosystems involved. It goes without saying that the performance of such heritage-led tourist complexes may differ depending on many historical, ecological, or physical-geographical background conditions.
In our study, seven cultural heritage sites in various non-urban areas in Europe were selected and studied in terms of their heritage-led contribution to socio-economic and ecological goals. This comparative research aims to identify and assess the relative cultural-ecological performance of these heritage-led regions by confronting—through a generalized production function approach—input-oriented data with output-based performance indicators (KPIs). We will employ here an adjusted (multi-layer) variant of Data Envelopment Analysis (DEA) with a view to the interest of users (visitors, residents, or stakeholders) of CECs, so as to facilitate the identification of actual culture-led regions that are relatively successful or might improve their current performance. Given the large multidimensional databases involved (from individual visitors’ surveys to generic indicators), a multivariate statistical analysis is merged with a multiscalar (‘cascadic’) DEA variant, called here Multivariate DEA.
The paper is organized as follows. After the above introductory remarks, Section 2 sketches the significance of local transformative cultural tourism, while more systematic detail on this issue is given in Section 3. The research design and methodology are described in Section 4, and a presentation of the (extensive) database is given in Section 5. A detailed interpretation of various outcomes of the Multivariate DEA modeling experiments is given in Section 6. Finally, Section 7 offers conclusions and a synthesis.

2. Real-World Background of Transformative Cultural Tourism

The cultural dimension in heritage-led tourism planning forms, in general, the centerpiece of the three pillars of sustainable development (economic, social, and environmental), which seeks to enhance societal wellbeing (or a high socio-economic performance). Rural CECs were selected due to their potential for transformative cultural tourism, allowing us to assess how these regions can leverage cultural-ecological assets for sustainable tourism development. In fact, the social value of public amenities (including cultural heritage) depends prominently on the perception of place-specific opportunities and needs, which are in turn critically dependent on the local culture/mindset/lifestyle [21]. The intensity of the above-mentioned human-environment relationships depends on the priority rankings of common/cooperative values, compared to competitive values. The community value of heritage-led development is, in turn, contingent on local agents’ priorities. Clearly, the relationship between man and nature/environment depends on the importance attached to the role of the environment/ecosystems/nature for local quality of life, wellbeing, and health [22,23]. The collective appreciation for local cultural-historical assets and their surroundings is also connected with the local lifestyle and environment [24]. Culture maps out, in essence, the historical relationship between humans and their spatial contexts.
Tourism finds its geographical attraction force often in culture as a human-made collective expression of creativity, nature perspectives, world views, history, and social capital [7,25]. A significant part of modern tourism nowadays finds its origin in urban cultural heritage shaped by past generations, as is inter alia witnessed by Amsterdam, Bangkok, Paris, Rome, Tokyo, or Vienna. An intriguing question is whether a match can be found between heritage-led and cultural amenities in a city or region and the expressed demands or interests of both residents and visitors to such places. In addition, it is important to know whether there are significant value differences in cultural performance indicators of either cities or regions. This calls for empirical research on local potentials of cultural heritage, the cultural appreciation of places, and the interests of tourist visitors and residents, seen from an economic, social, and environmental perspective on heritage-led local development. This multi-disciplinary perspective forms the cornerstone for our place-based heritage-led assessment study.
A range of experiences—documented in the extant literature—illustrates that not only urban, but also rural and remote areas have distinctive heritage, cultural, and ecological resources that can drive sustainable local development. Circular and human-centered cultural tourism—encompassing innovative orientations like co-responsibility, cultural awareness, creative tourism, transformative and regenerative tourism, or community-oriented tourism—plays an important role in revitalizing lagging-behind regions. It may significantly contribute to job creation, skills progress, and the protection of natural and cultural treasures for next generations, ultimately promoting long-term regenerative territorial development. Several studies have demonstrated that it is essential to explore and implement specific conditions to achieve these goals [20,26].
Recently, novel tourism models are emerging that are founded on adjusted socio-economic development paradigms, featuring a more prominent role for social and cultural entrepreneurs [26], increased cooperation and value-sharing among producers of local communities [20], and active participation of tourists in co-creating circular tourism experiences [21]. The future of sustainable and inclusive tourism practices encompasses, therefore, a collaborative social network economy, a circular economy with a low ecological footprint, and a creative and regenerative economy [17,27,28,29,30]. It goes without saying that sustainability, education, and research are central themes in tourism and hospitality sciences, closely linked to human capital development for tourism providers, employees, tourists, and residents. Against this background, CECs may act as spearheads of actionable strategies for designing and implementing environmentally benign, circular-economy-inspired, and climate-neutral areas that derive their development potential from their cultural and ecological base. This new orientation for culturally inclusive tourism destinations is named here as transformative cultural tourism. Clearly, such a development will only come into being if all actors involved (residents, visitors, NGOs, etc.) cooperate in the form of co-creation for sustainable cultural tourism. In the present study, we will focus on local and regional actors (including residents and tourists) to identify and map out empirically their views on the long-range sustainable development potential of the area under consideration.
To assess the performance of CECs, researchers have employed various methodologies, including Data Envelopment Analysis (DEA). For example, Kourtit and Nijkamp [31] utilized (an adjusted variant of) DEA to evaluate the cultural-ecological performance of heritage-led regions. This approach involves confronting input-oriented data with output-based performance indicators (KPIs) to identify successful complexes and areas for improvement.
Clearly, a comprehensive database of key performance indicators for sustainable cultural tourism impacts is essential for such empirical assessments. The database in our study includes information on Individual Characteristics, Motivation and Driving Forces, social networks, Travel Experience, sustainability of destinations, global satisfaction, and Quality of Services. The data are collected from various stakeholders, including residents, visitors, and proximity travelers, in distinct rural CECs across Europe (viz., Karlsborg in Sweden, Mark in Sweden, Larnaca in Cyprus, Basilicata in Italy, Huesca in Spain, Vojvodina in Serbia, and Sibiu in Romania/Moldova).
Given the transformative potential of cultural-ecological complexes and the methodologies employed to assess their performance, the following empirical research question is addressed in our study: How do CECs—and their agents and stakeholders—influence sustainable development and economic growth in heritage-led regions? This question is based on the premise that well-managed cultural-ecological complexes significantly contribute to sustainable development and local economic growth. Consequently, this paper explores the impact of CECs on sustainable cultural tourism, examining their role in enhancing local identity, economic growth, and environmental stewardship. Through a comprehensive and comparative analysis, this study provides evidence-based insights into the effectiveness of CECs in promoting sustainable tourism practices.

3. Transformative Culture Tourism: Scope

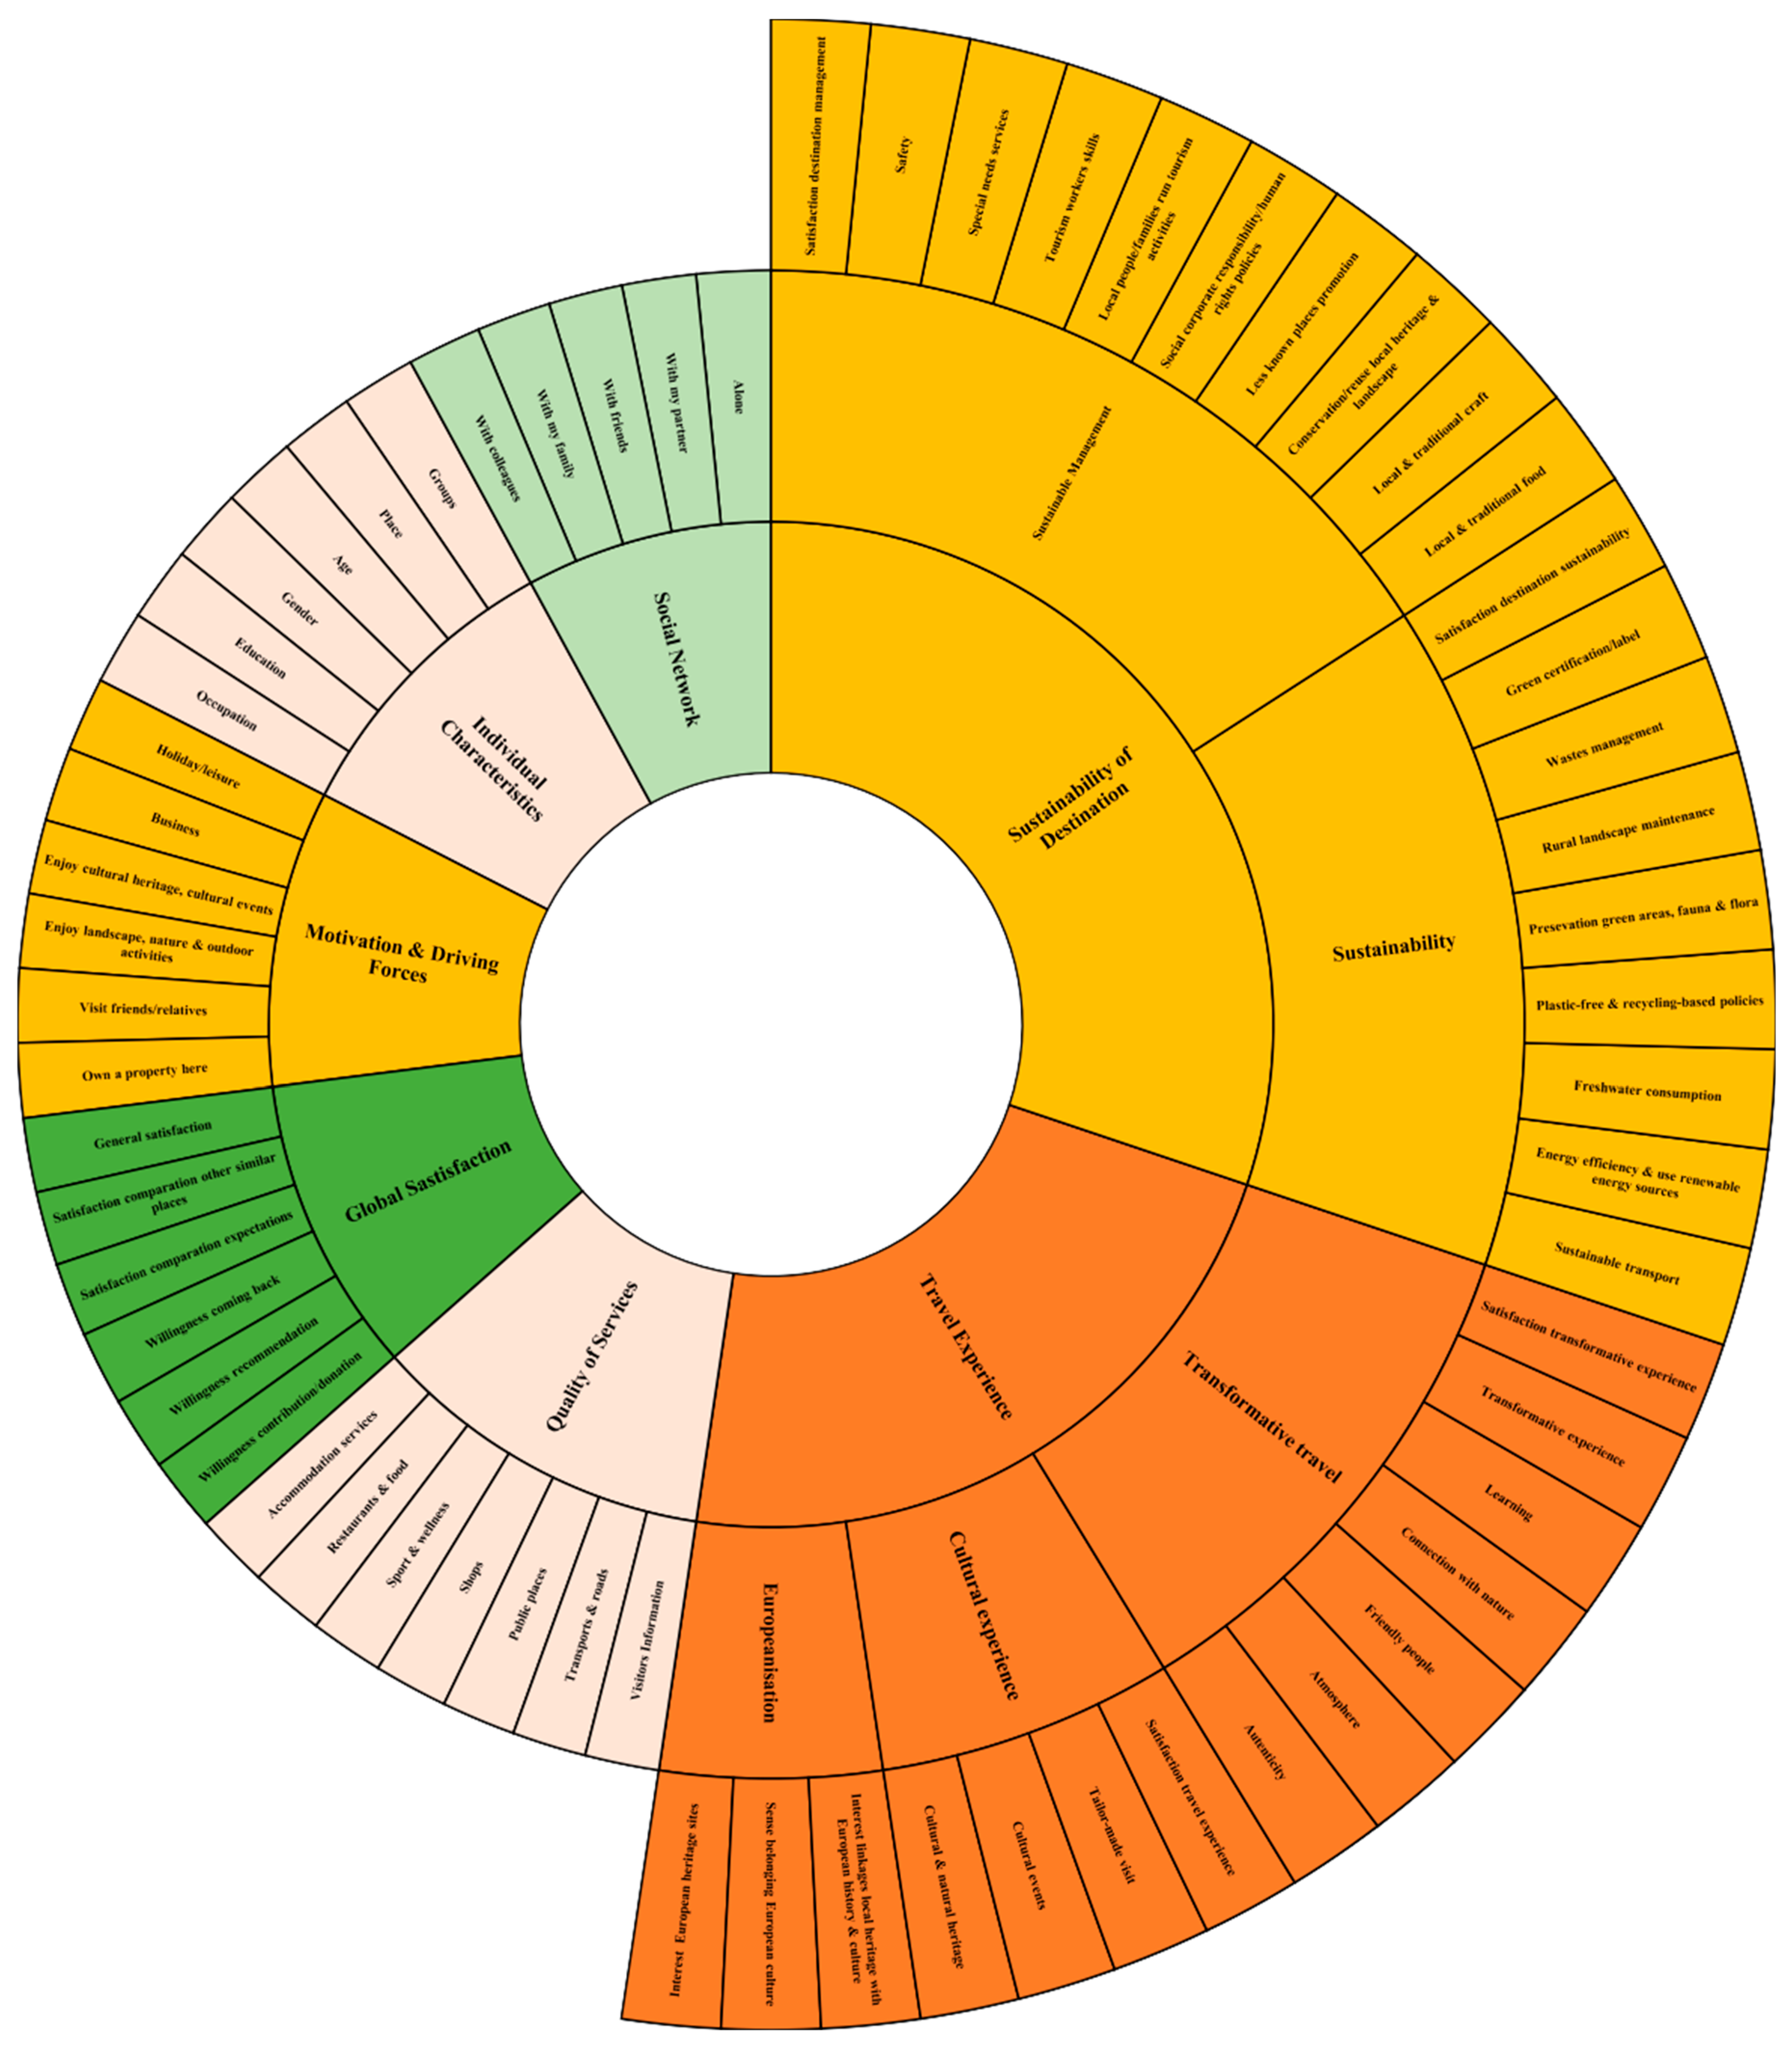
3.1. The Analysis Framework

Managing the uninterrupted growth of global tourism necessitates a fundamental shift in local planning. Achieving a delicate and shared equilibrium in the utilization of cultural resources at the local level is paramount, in which the principles of co-creation and sustainable circular economic strategies may take center stage. The above considerations can be integrated in the following ‘butterfly’ figure comprising four components, inspired by a study by Gravagnuolo et al. [22] (see Figure 1).
Given this framing, it is important to assess the actual and potential demand for sustainable local cultural tourism innovative services and products through common actor-based approaches. Transformative cultural tourism is an approach where tourism acts as a catalyst for socio-cultural and ecological renewal, emphasizing community engagement and sustainability. Co-creation implies the active engagement of residents, visitors, and stakeholders in ideating, co-developing, testing, and validating innovative solutions related to a specific challenge. This concept will be extended in Section 3.2 toward sustainable cultural tourism and stakeholder involvement through distinct target groups of actors.

3.2. Sustainable Co-Creation

The concept of co-creation for sustainable and circular tourism is central to balanced tourism development. This concept refers to the central role of local actors for value creation in service management [32,33]. In contemporary tourism research, co-creation is increasingly investigated in relation to the involvement of visitors in creating and consuming services, products, and experiences. Recent studies have also started to explore co-creation in the specific context of cultural heritage tourism. Minkiewicz [34] identifies three meaningful dimensions of co-creation of heritage experience: co-production (customers’ active participation in activities related to the experience); engagement (customers’ sense of cognitive and emotional involvement or identification with an offering); and personalization (adjusting the experience to their needs through customization, interaction with dedicated service staff and appropriate technology).
Continuing from this multidimensional conceptualization of co-creation, Suntikul and Jachna [35] demonstrate the relevant relationship between tourist engagement and place attachment, referring to the personal connection that one feels with a particular place. In particular, place attachment relates here to ‘the process whereby an individual’s experiences with both the physical and social aspects of an environment result in the development of strong emotional bonds with that place’ [36]. Using the attitude–behavior relationship underpinned by the theory of reasoned action, Buonincontri et al. [37] identified next the linkages between visitors’ heritage experiences, their attachment to heritage sites, and their general and site-specific sustainable heritage behavior.
As mentioned, for our empirical analysis, we use extensive surveys in various localized CECs. Our study on the market potential and performance efficiency of sustainable cultural tourism will target the above-mentioned seven pilot regions/sites in Europe and various target groups: visitors, residents, and other stakeholders. These groups will be briefly described in Section 4.2.

4. Research Design and DEA Methodology

4.1. X-Factors

This study aims to examine the transformative potential of CECs in sustainable cultural tourism by identifying the key factors (‘X-factors’) that optimize their efficiency and contribute to regional sustainability. It also seeks to highlight the factors that drive innovative strategies in cultural tourism, enhancing the quality of tourism facilities and cultural heritage attractions while maintaining sustainability. Additionally, this approach seeks to employ and develop practical tools and actionable guidelines that support sustainable tourism across various regions. The methodology involves a co-creation process that encourages knowledge sharing and collaborative networking. The co-creation process in this study is reflected in both data collection and analysis. The surveys involved active participation from local residents, visitors, and stakeholders, ensuring that their insights directly influenced the assessment criteria. Additionally, the research process involved feedback loops with stakeholders, integrating their perspectives into the refinement of performance indicators for CEC evaluation. The main goal is to foster sustainable tourism investment strategies and elevate the overall performance of CECs. Although much of the literature on cultural-ecological complexes focuses on urban settings, this study deliberately selects rural CECs to assess their underexplored potential in transformative cultural tourism. Rural CECs often face unique sustainability challenges but also present opportunities for cultural regeneration and local economic growth. Their selection allows for a comparative analysis that broadens the applicability of CEC studies beyond urban contexts.

4.2. Stakeholder Participation and Data Collection

The study categorizes key stakeholders into three groups: visitors, residents, and tourism service providers. Their perceptions were gathered using structured surveys. In this empirical study, the following target groups are distinguished:
  • Visitors represent the main demand side of circular cultural tourism innovative solutions. The survey concerned aims to explore under which conditions visitors/tourists prefer specific “circular” destinations and services, the appreciation of cultural resources in the pilot area/site, the interest in learning more and more deeply about local culture and heritage, preferable strategic development choices in the region/site and tourists’ sustainable behavior. Also, the survey focuses on Europeanisation to explore how visitors perceive the “feeling of being Europeans” through a visit to the pilot areas/sites concerned. Finally, the survey also addresses the market potential for circular cultural tourism, based on the relevant dimensions of co-creation in a cultural heritage context and its linkages with visitors’ behaviors promoting circular cultural tourism.
  • Residents represent both the demand and supply side of circular cultural tourism. Residents are the beneficiaries, as well as the co-creators of “circular” cultural tourism destinations. This specific survey aims to explore how residents perceive cultural tourism development in their region (e.g., a threat or an opportunity, and under which conditions), and which trajectories of local development are preferred. The survey focuses on the potential role of residents as co-creators, assessing their interest, openness, trustworthiness, or entrepreneurial attitude.
  • Other stakeholders represent in particular the supply side of circular cultural tourism, i.e., the ‘producers’ of tourism services and products. Stakeholders are NGOs, individuals, and entities in the cultural tourism value chain, including cultural and creative enterprises. They have a vested interest in accommodation services, restaurants, and gathering places, local food and craft production, transport services, tourist guidance, museums, and heritage sites. Clearly, stakeholders may also include local governments and public institutions providing environmental and socially supporting services (e.g., waste and water management agencies, funding bodies, public transport agencies, publicly managed heritage sites, etc.).
The data collection on the X-factor from the seven cultural tourist destinations across Europe followed a systematically structured scheme addressing the main questions outlined in the previous sections. The gathered data encompasses various performance (output) indicators (KPIs) and input-oriented information, such as Individual Characteristics, motivations, social networks, travel experiences, destination sustainability, overall satisfaction, willingness to return, willingness to recommend, and a sense of European identity.
To measure the efficiency of different tourism CECs, a Data Envelopment Analysis (DEA) approach is used. Specifically, a Super-Efficiency Output-Oriented DEA model (see Section 4.4) is used, which differentiates efficient Decision-Making Units (DMUs) by providing super-efficiency scores that can exceed the maximum standard efficiency value of 1.0. This model is important for identifying efficient CECs that are performing relatively better and those that need improvement.

4.3. Principles of DEA

DEA has, over the past decades, become a widely used quantitative tool for comparative and benchmark studies, particularly in analyzing industrial organizations, known as Decision-Making Units (DMUs). The primary objective of DEA is to find out which DMUs are more efficient by examining their use of limited resources (inputs) in relation to their outputs or outcomes [38,39,40]. DEA can be seen as a generalized efficiency analysis that compares multiple inputs and outputs simultaneously, yielding performance scores ranging from 0 (least efficient) to 1.0 (most efficient). This method has many applications across various sectors, including healthcare, education, and environmental agencies (see, e.g., [41]).
Originally, DEA aims to assess the relative efficiency (inputs versus outputs) of a DMU by projecting its performance onto a piecewise linear production frontier. Efficient DMUs lie on this frontier (with a score of 1.0), while inefficient ones do not. Under different conditions, inefficient DMUs can improve efficiency by reducing input or increasing output to get closer to the highest possible score of 1.0. Traditional DEA approaches involved uniform input reductions or output increases to enhance efficiency. However, multiple possible improvement paths exist, leading to several ways a DMU can improve its overall efficiency.
The evolution of DEA was enriched by integrating Multiple Objective Linear Programming (MOLP) with DEA models. Early work by Golany [42] and others developed interactive MOLP procedures to identify efficient solutions for DMUs. This approach allows decision-makers to select preferred output sets and assess alternative input and output levels to enhance efficiency (see also [41]).
Subsequent studies, like those by Joro et al. [43] and Halme et al. [44], established connections between DEA models and Reference Point Models, incorporating DMU preferences to identify the most-preferred solutions on the production frontier. Further contributions by researchers like Korhonen et al. [45], Korhonen et al. [46], Lins et al. [47], and Suzuki and Nijkamp [48] refined these models to include preferences for incremental changes in input and output values.

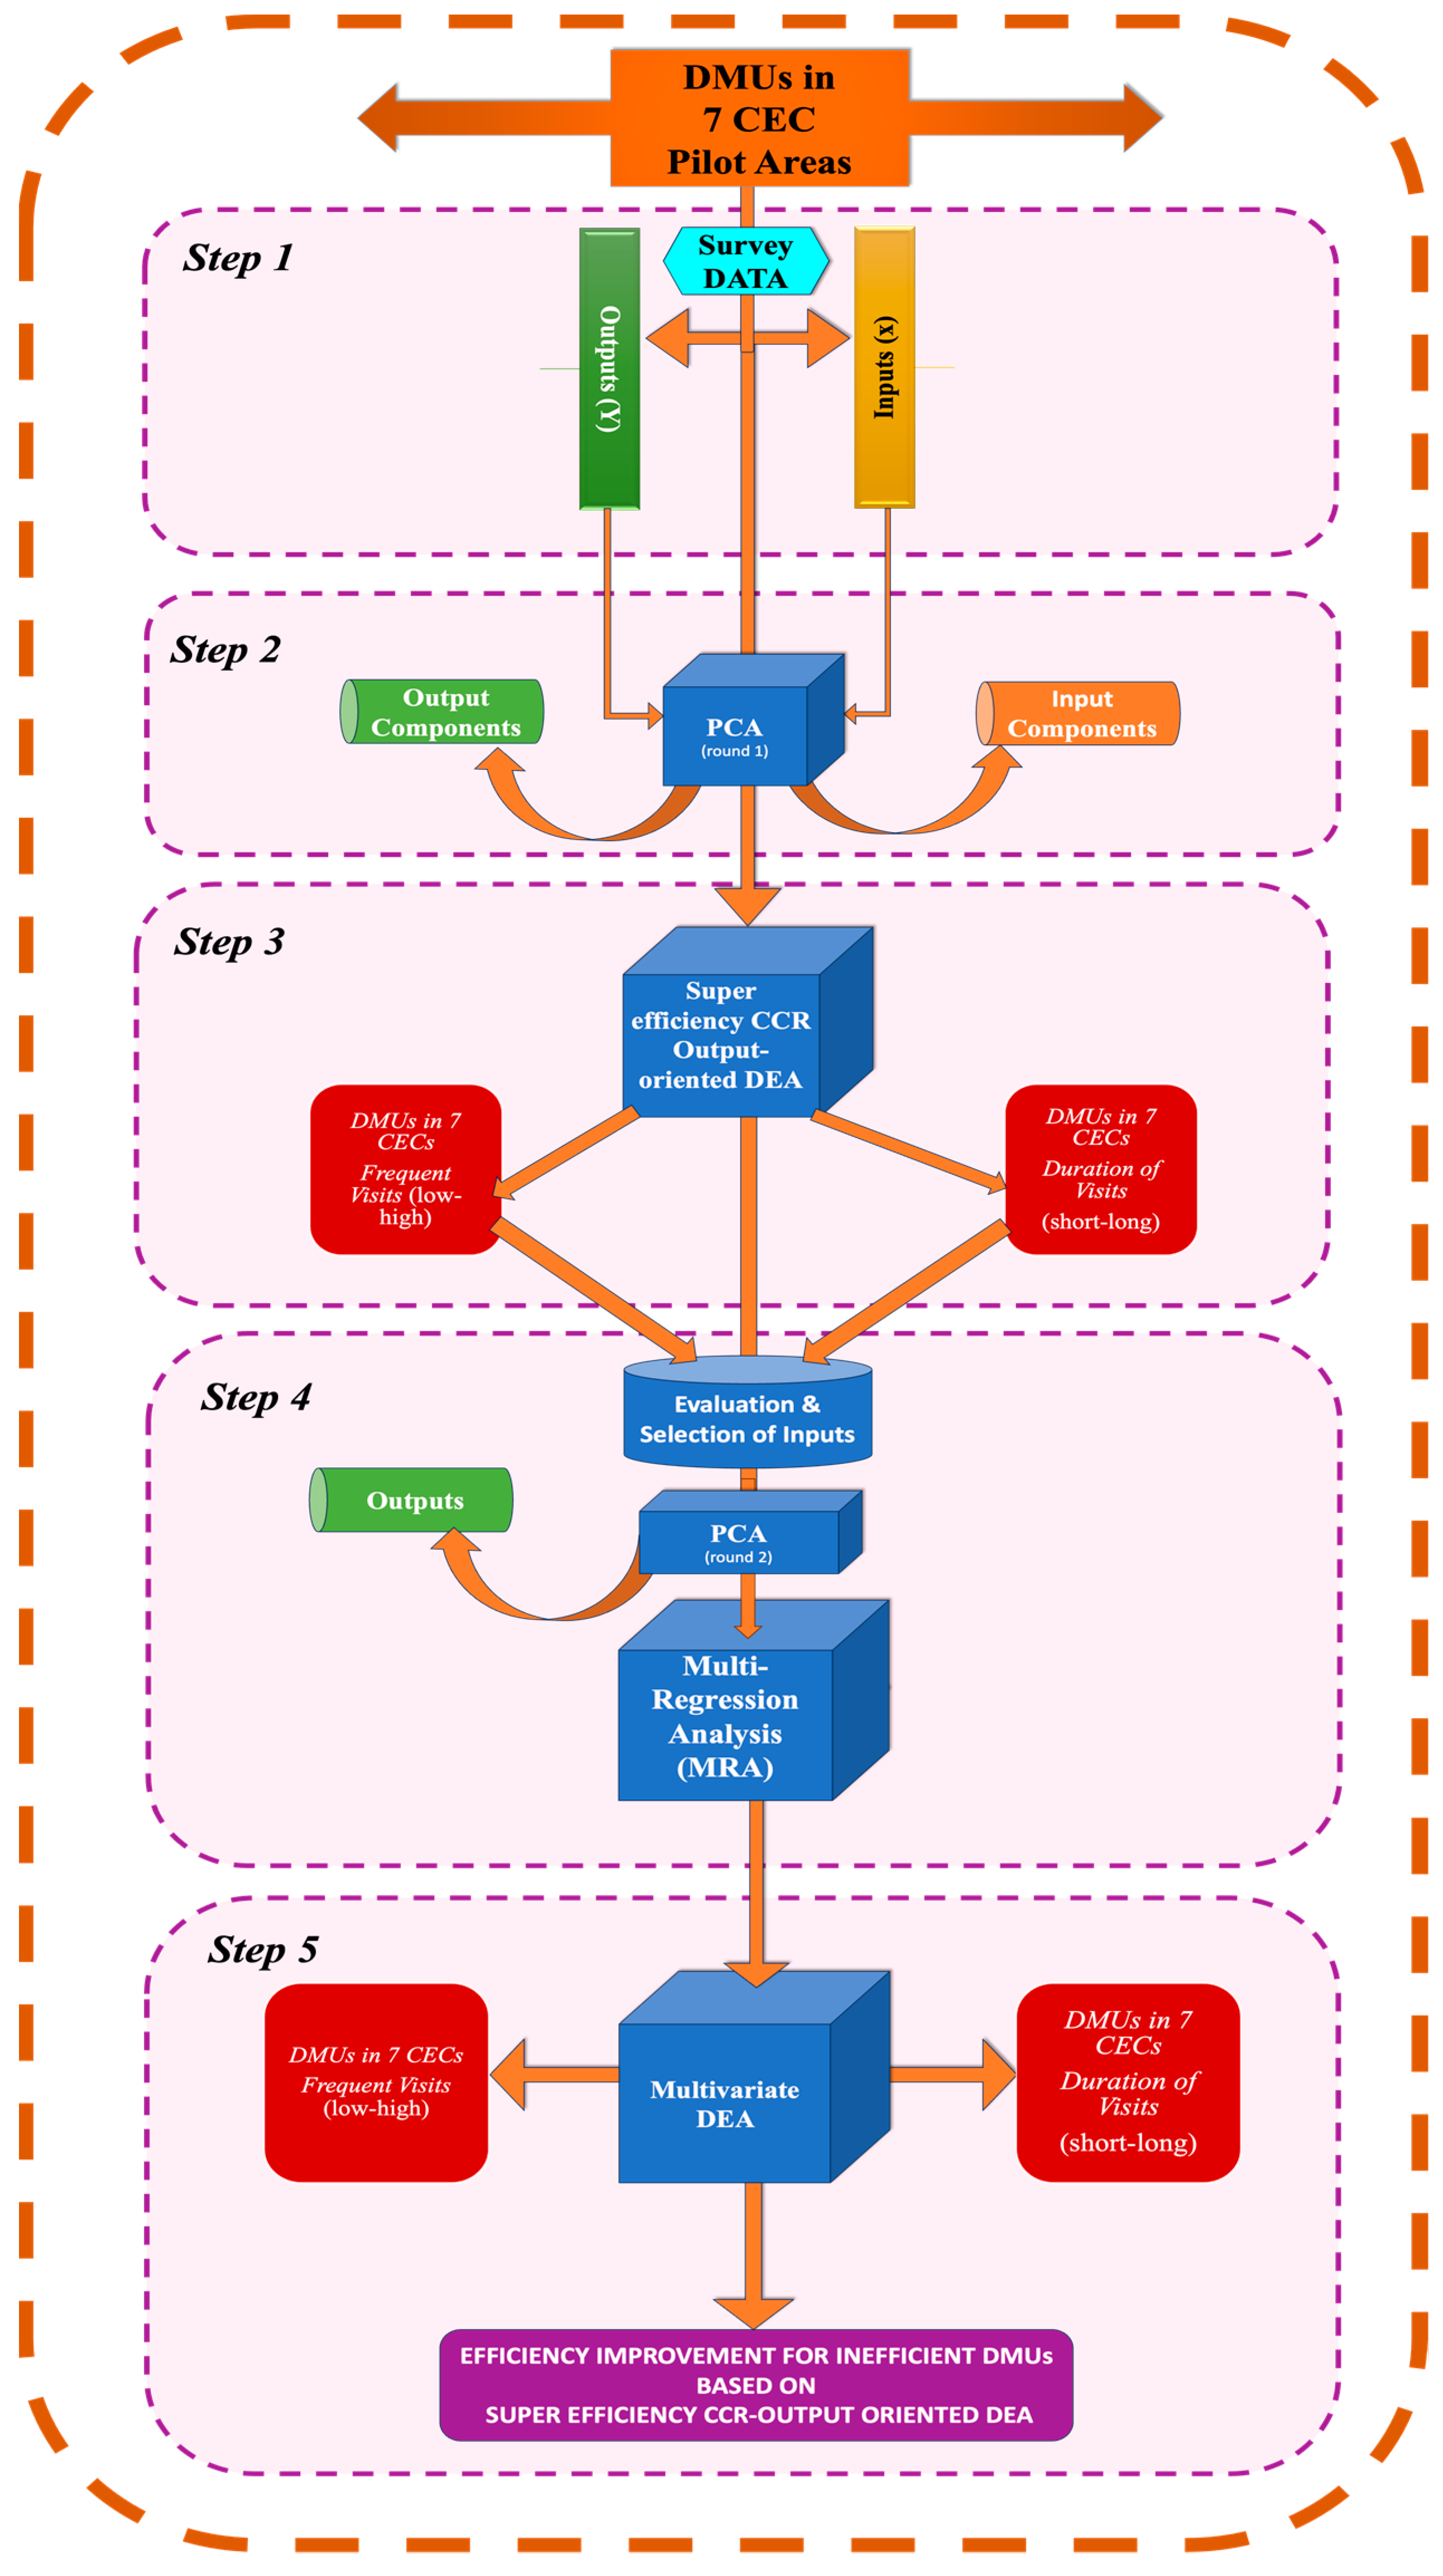
4.4. Research Methodology of Super-Efficient Multivariate DEA

The integrated DEA framework offers a comprehensive strategy for performance improvement, addressing in recent years also both theoretical and practical considerations in enhancing the efficiency of cities [49,50]. Figure 2 outlines the methodological framework for assessing CECs’ performance, featuring several key characteristics of empirical research. The following steps are used.
  • Data Collection and Selection of Inputs and Outputs (Step 1)
After collecting data, the input and output selection was performed. At the micro level of the CECs, data were collected through surveys addressed to visitors/travelers, residents, and other stakeholders (NGOs, entrepreneurs) in the areas.
  • Inputs are defined based on their relevance to tourism efficiency regarding CEC performance, such as frequency and Duration of Visits. This includes determining variables like Travel Experience, Quality of Services, Sustainability of the Destination, and motivational factors. Individual Characteristics are included because they influence tourists’ psychological and behavioral dispositions, particularly their motivation and perception of sustainability—both essential for understanding the transformative impact of cultural tourism. Co-creation literature indicates the relevance of socio-demographic factors in shaping tourism experiences. In this study, Individual Characteristics (IC1) are represented by an index comprising five indicators: groups, age, gender, education, and occupation. Careful consideration ensures that the selected inputs accurately reflect the multifaceted nature of tourism efficiency.
    Output measures include, inter alia, overall satisfaction, willingness to return, willingness to recommend, and a sense of European identity. Europeanisation captures the extent to which cultural tourism fosters cross-cultural appreciation and integration, which is relevant for sustainability strategies. Although ‘Europeanisation’ may appear to be a subjective concept, its operationalization in this study is based on standardized survey questions assessing visitors’ identification with European values and cultural integration. Its inclusion aligns with EU cultural policy goals and reflects broader regional identity formation, which is important for sustainability and cohesion in heritage-led tourism. These outputs are crucial for gauging the success of tourism strategies and their impact on visitors.
  • Principal Component Analysis (PCA) (Step 2)
Our database is rich in nature and comprises several multi-collinear data variables. At first, a PCA is utilized to reduce data complexity and identify the most significant inputs and outputs for the DEA model. This statistical method helps in simplifying the dataset by transforming it into a set of uncorrelated critical variables (among the inputs and outputs), or principal components, which retain most of the variance present in the original data. This step helps to structure the dataset by focusing on the most significant input and output variables, so that the subsequent DEA model leads to efficient and effective outcomes. This is further elaborated through the application of a Multiple Regression Analysis.
  • DEA Super-Efficiency Analysis (Step 3)
The Super-Efficiency Output-Oriented DEA model evaluates the efficiency of each CEC in our study, based on the selected inputs and outputs identified through a PCA (see Step 2). The CECs, categorized into Frequent Visits (low-high) and Duration of Visits (short-long), are considered super-efficient; if their efficiency scores exceed 1.0, thus setting benchmarks for best practices in tourism destination management. This analysis identifies top-performing regions and provides a clear framework for other regions to aspire to.
  • Comparative CEC Analysis (CCECA) (Step 4)
The comparative analysis of the seven CECs seeks to evaluate their cultural-ecological performance. However, there is a caveat to be mentioned here in our comparative approach due to the necessary degrees of freedom in a DEA. In this context, Dyson [51] suggests, as a ‘rule of thumb’, that to achieve a reasonable level of discrimination among DMUs, the number of DMUs should be at least 2 × (number of input items) × (number of output items). For instance, if we use 6 inputs and 4 outputs, a minimum number of DMUs of 48(!) is needed. Thus, to comply with this general guideline, the number of inputs or outputs may have to be reduced. In our case, this is completed by further reducing the number of outputs through a second-stage multivariate analysis, followed by a reduction in the number of inputs through a multi-regression analysis (MRA) in order to identify a limited number of significant determining input variables. In the comparative approach, a sensitivity analysis for the number and selection of several input variables is next undertaken.
  • Efficiency Improvement Strategies (Step 5)
For regions identified as inefficient in the DEA Super-Efficiency Analysis, evidence-based improvement strategies may be developed based on their super-efficiency scores. This step involves a detailed analysis of the findings from the PCA and DEA models to pinpoint specific areas needing enhancement, using the above-described Multivariate DEA. Variables can then be eliminated and reanalyzed to ensure accuracy. Strategic recommendations may then be derived to help these CECs address their inefficiencies. These strategies are aimed at helping the areas understand and implement targeted actions for improvement, using insights gained from the comparative analysis of strengths and weaknesses across different CECs.
Through the use of Multivariate DEA, this research employs a robust framework for assessing and improving the performance of CECs. This integrated approach suggests that cultural tourism strategies and activities are not only efficient but also sustainable and responsive to the demands of various stakeholders involved. The logical steps and methods outlined in the methodology emphasize the comprehensive nature of the analysis framework, systematically addressing data collection, analysis, and application of findings to foster continuous improvement. The various steps are systematically sketched out in Figure 2.

5. Database

A comprehensive understanding of sustainable cultural tourism is essential for using robust data management systems. These systems provide the foundation for analyzing the multifaceted impacts and market potential of cultural tourism across the seven pilot areas. The ‘umbrella’ model shown in Figure 2 incorporates the cascade and the decomposition principle in terms of a systemic structure of hierarchically organized quantitative and qualitative data management systems (see also [52]). This is further illustrated in Figure 3, which maps out human-centered actions and continuous value creation aimed at achieving the highest possible performance outcome, enhancing visitor experience, and optimizing the quality (XXQ) conditions in the tourism destinations.
A higher performance is achieved through understanding the multidimensional impact and market opportunities of various types of cultural and historical tourism, developing an operational systemic hierarchical micro-meso-macro analytical framework for sustainable and circular cultural tourism. Furthermore, this contributes to cultural Europeanization and balanced economic and social development in Europe through co-created cultural experiences.
Our empirical database of KPIs for sustainable cultural tourism impacts contains extensive information for each CEC, organized in an actor-specific database. The actor-specific database maps out the value systems (particularly preferences and perceptions) of each group of actors who have visited the pilot heritage sites. These internal X-indicators comprise various critical components, in particular, Individual Characteristics, Motivation and Driving Forces, social networks, Travel Experience, sustainability of destination, global satisfaction, and Quality of Services (see also Appendix A). For clarification, Individual Characteristics comprises six variables: groups, place, age, gender, education, and occupation. However, after Principal Component Analysis (PCA), only five variables were included in the final composite index (IC1). The reduction of these variables into a single composite, IC1, maintains simplicity in the DEA model, as required by the rule of thumb for DMUs. This clarification addresses the discrepancy between the detailed breakdown in Figure 3 and the collective representation of IC1 in Section 6. The challenge of this data-driven, evidence-based program and integrated actionable policy is not to acquire a maximum quantity of data, but to filter large amounts of data in order to obtain a relevant, systematic, and appropriate database. The archetype model aims to design a strategic analysis framework inspired by the above-mentioned cascade and decomposition principle, proposing operational guidelines across multiple layers of prioritized urban quality-of-life conditions and prominent X-factors within a comprehensive and integrated hierarchical data framework. This approach will be used to develop a more comprehensive conceptualization and measurement of the sustainable intelligence of cultural visitors and residents. This intelligence is useful for understanding the profile, market potential, and impact of segments to better target destinations’ cultural products, marketing, and strategies. This approach also includes the delivery of historical-cultural tourism services and related infrastructures, for instance, energy, water, waste management, materials extraction, and digital infrastructure (see Figure 3 for details).
The database contains measurable and relevant information for policymakers, city marketers, researchers, and other stakeholders regarding the value systems and judgments of these actors in the seven CECs concerned. This database system also provides access to a wide variety of relevant data on different actors and their value systems, such as visitors to specific historical-cultural assets in the CECs. This is crucial for understanding the X-factors creating an urban cultural ‘buzz’, which results from density, proximity, and connectivity externalities in an urban context (see, e.g., [53]). Sustainable tourism also includes fostering local entrepreneurial dynamism, innovation, access, and intensity, and developing technological, organizational, social, and economic smart solutions for socio-economic agents (see, e.g., [54]).

6. Results from Multivariate DEA

Our study employs a DEA approach to evaluate the efficiency of different tourism destinations. As mentioned, a Super-Efficiency CCR Output-Oriented DEA model (see [55]) is used, which allows for the differentiation of efficient DMUs by providing super-efficiency scores that may exceed the threshold value of 1.0. This section presents a detailed step-by-step analysis and interpretation of the results obtained from this Multivariate DEA model.

6.1. DEA Based on Frequency of Visits and Duration of Visits

The results show the varying efficiency levels of CECs based on visitor frequency and Duration of Visits. These findings align with stakeholder perceptions from the survey phase, where frequent visitors emphasized service quality as a key factor, while local residents focused on sustainability efforts. To further strengthen the performance assessment of CECs, a more detailed statistical breakdown of super-efficiency scores across the seven regions is provided in Appendix B, Table A1 and Table A2. These tables present both low and high-frequency visitor results as well as short and long-duration visits, offering a quantitative benchmark comparison. Notably, Mark achieved the highest super-efficiency score of 1.393 for low-frequency visits, indicating outstanding performance relative to other CECs.
The stakeholder insights offer a qualitative perspective that complements the quantitative DEA, reinforcing our study’s co-creative approach. The survey’s responses also indicated that both visitor engagement and resident involvement significantly impact the efficiency of CECs. In particular, these perspectives were integrated with the DEA model to enhance the robustness of the analysis, ensuring that subjective and objective measures were balanced.
In the initial steps (Steps 1, 2, and 3) of our analysis, we apply the DEA model to evaluate the outcome efficiency of CECs in tourism areas based on data on Frequent Visits (low-high) and Duration of Visits (short-long) from the survey, including input and output selection and identification of the critical inputs and outputs using PCA for the DEA model. The integration of PCA in identifying critical inputs and outputs ensures that multicollinearity does not affect the efficiency evaluation, providing more reliable results.
For Frequency of Visits, the model utilizes six input variables and four output variables. The inputs are as follows:
  • Individual Characteristics (IC1);
  • Motivation and Driving Forces (MDF2);
  • Social Network (SN3);
  • Travel Experience (TE4);
  • Sustainability of Destination (SD5);
  • Quality of Services (QS6).
These inputs represent key factors influencing the efficiency of a region in attracting and managing tourists. Next, the outputs measured are as follows:
  • General Satisfaction (GS);
  • Willingness to Come Back (WCB);
  • Willingness to recommend (WR);
  • Europeanisation (EUS).
These outputs are indicative of the overall success of a region in satisfying tourists and encouraging repeat visits and recommendations. These outputs are measured in a way that captures not only immediate satisfaction but also long-term behavioral intentions, which are important for the sustainability of the CECs.
For Duration of Visits, the same set of inputs and outputs is used, allowing for a consistent comparison of efficiency based on the length of tourist stays. The Duration of Visits is incorporated as an additional variable that reflects long-term engagement trends, influencing the broader tourism dynamics at each destination. To account for visitor engagement time, each DMU was formed by grouping survey responses into short (1–3 days) and long (4+ days) categories. Instead of normalizing by estimated durations—which could distort categorical data—we used a stratified DEA, benchmarking these groups separately for consistent comparisons across CECs.
The Super-Efficiency CCR Output-oriented DEA model, in Step 3, assesses the efficiency of each CEC by comparing the inputs used to produce the outputs. A higher efficiency score indicates that a region is effectively utilizing its resources to achieve its objectives. The results are mapped out in Figure 4 and Figure 5 (see also Appendix B). The results of Step 3 could be interpreted in the context of benchmarking, where the efficiency scores not only reflect the individual performance of CECs, but also indicate areas for potential improvements based on the best-performing regions.
The output-oriented DEA results on Frequency of Visits, shown in Figure 4, clearly distinguish the efficiency of various regions. Mark in Sweden stands out, achieving the highest super-efficiency score, indicating exceptional performance in utilizing inputs to maximize outputs. With a score of 1.393, Mark leads in the efficiency of other regions, setting a benchmark for best practices in tourism management. However, Mark’s performance for high-frequency visits is relatively lower, with a score of 1.016. This suggests that while the region is generally efficient, challenges in managing frequent visitors—potentially related to infrastructure, service quality, or operational factors—need to be addressed. The lower score for high-frequency visits (1.016) in Mark may reflect underlying limitations such as overcrowding, strain on infrastructure, or inefficiencies in handling high volumes of visitors. This discrepancy highlights the importance of creating tailored strategies for managing periods of high tourist traffic, ensuring that the region can maintain its high performance even under increased visitor numbers.
Figure 4 also highlights the efficiency of other regions in our sample. Huesca shows a positive trend, with high-frequency visits (1.117) outperforming low-frequency visits (1.030), indicating effective management of repeat visitors. This improvement for high-frequency visits suggests that Huesca has developed strategies that enhance visitor retention, perhaps through loyalty programs or improved service delivery during peak times. Basilicata, Larnaca, and Vojvodina show lower super-efficiency scores, particularly for low-frequency visits. Although these regions perform above the threshold value of 1.0, their tourism systems require significant transformation to match the efficiency of higher-performing destinations. This points out a critical area for improvement, where these regions should focus on optimizing their offerings for tourists with shorter stays, as this can be crucial for their competitiveness in the tourism market. In summary, Mark’s exceptional performance with low-frequency visits, combined with its challenges in managing high-frequency tourism, underscores the need for targeted improvements in visitor management strategies. Regions like Basilicata, Larnaca, and Vojvodina should prioritize comprehensive reforms to enhance their efficiency and approach the performance levels seen in leading destinations.
The results on the Duration of Visits, illustrated in Figure 5, further confirm Mark’s super-efficiency, achieving the highest scores for both short-duration visits (1.334) and long-duration visits (1.211). This consistency across different analysis contexts highlights Mark’s overall strength in tourism management. However, Mark’s relatively lower performance in managing long-duration visits (1.211) compared to short-duration visits (1.334) reinforces the need for targeted strategies to improve the experience and management of visitors staying for extended periods. This gap between short and long-duration visits suggests that the Mark region might benefit from tailored services and infrastructure improvements that cater specifically to the needs of long-term visitors, such as extended accommodation options or more in-depth engagement programs. This might involve enhanced loyalty programs, better infrastructure to support repeat visits, and more personalized services for long-term visitors. Additionally, focusing on optimizing the visitor experience, enhancing services tailored to long-duration stays, and incorporating sustainable practices could further improve the management of longer visits.
Next, Figure 5 also presents the scores for other regions. Huesca scores 1.048 for short-duration visits and 1.070 for long-duration visits, demonstrating consistent efficiency. The slight increase in long-duration visits shows that Huesca is capable of maintaining high levels of service and satisfaction, even for visitors who stay longer, reflecting a well-rounded tourism offering. The Basilicata scores were 0.991 for short-duration visits and 1.069 for long-duration visits, with a lower score for short-duration visits. This suggests that Basilicata may need to focus more on improving its offerings for tourists with shorter stays, such as enhancing ease of access, attractions, and service quality. Sibiu achieves scores of 1.071 for short-duration visits and 1.087 for long-duration visits, indicating strong performance in both categories. The increase from short to long-duration visits suggests that Sibiu offers more compelling experiences or services for longer stays, potentially related to the region’s cultural heritage or extended visitor engagement. Larnaca scores were 1.004 for short-duration visits and 1.022 for long-duration visits, showing a slight increase for long-duration visits. This indicates that Larnaca is improving its capacity to support longer stays, though there is still room for improvement in efficiency for shorter visits. Karlsborg scores were 1.078 for short-duration visits and 1.031 for long-duration visits, with a higher score for short-duration visits. This suggests that Karlsborg performs better for shorter visits, likely due to better handling of transient visitors, but could enhance its offerings for longer stays. Vojvodina scores were 1.004 for short-duration visits and 1.024 for long-duration visits, showing minimal improvement in long-duration visits. The limited increase from short to long-duration visits in Vojvodina indicates the need for further strategies to improve the region’s attractiveness and services for longer stays.
Regions like Basilicata, Larnaca, and Vojvodina show lower efficiency scores, particularly for short-duration visits. These regions should focus on improving their tourism systems, especially for shorter stays, to better match the efficiency of higher-performing regions. In conclusion, while Mark in Sweden leads in efficiency across different visit durations, targeted strategies are essential for improving the management of long-duration visitors. Regions like Basilicata, Larnaca, and Vojvodina should prioritize improvements to enhance overall efficiency and performance.
In conclusion, the initial DEA using both the Frequency of Visits and Duration of Visits shows that Mark is the most efficient region overall. Nevertheless, the lower performance in high-frequency visits suggests specific challenges associated with managing frequent or long-term visitors that need to be addressed. These insights can guide future policy planning to enhance visitor management strategies in such contexts. By understanding and addressing these challenges, regions can develop more effective approaches to improving the overall tourist experience and maintaining high levels of satisfaction and loyalty among frequent visitors.

6.2. Comparative Study by Means of Multivariate Analysis

The analyses in Section 6.1 provided valuable insights into the efficiency of tourism regions. However, an adjustment has been made here in the view of the ‘rule of thumb’ formulated by Dyson et al. [51] (see also Section 6.3). To further refine the analysis, in Step 4, a second-round PCA was performed using only the selected key indicators identified from the initial multivariate analysis. This step allows us to focus on the most significant variables, potentially providing a clearer view of their relationships and impacts. The comprehensive evaluation score is derived from the weights assigned to each output variable based on their contribution to the total variance. The PCA results show that the first component accounts for 61.24% of the variance (see Appendix C), capturing much of the information in the output variables. This high percentage suggests that the first component is a reliable indicator of overall performance. Subsequent components contribute less significantly, with Component 2 contributing 18.09%, Component 3 11.93%, and Component 4 8.74%. This drop in contribution further justifies focusing on the first component for the comprehensive evaluation score.
Next, the comprehensive evaluation score (output) was used as the dependent variable in an explanatory Multiple Regression Analysis (MRA), where it was regressed on the six input variables: IC1 (Individual Characteristics), MDF2 (Motivation and Driving Forces), SN3 (Social Network), TE4 (Travel Experience), SD5 (Sustainability of Destination), and QS6 (Quality of Services). Descriptive statistics of these variables, including means, standard deviations, minimum, and maximum values, are provided in Appendix D, Table A5. These statistics demonstrate sufficient variation in the data and the absence of extreme outliers, supporting the reliability of the regression models. These insights also show that the variable scales are suitable, which helps reduce concerns about uneven data spread. Diagnostic checks confirmed that the data met all key assumptions of linear regression. Alternative model forms did not improve Adjusted R2, residuals, or overall fit, further supporting the use of the OLS model.
The MRA results (Table 1) show that MDF2, TE4, SD5, and QS6 are statistically significant predictors of tourism efficiency, while IC1 and SN3 are not, which led to their removal in the refined MRA model. This decision is statistically supported by their high p-values (above 0.05), indicating a lack of significant explanatory power in the context of this model. The Adjusted R2 of 0.610 in Table 1 shows that about 61% of the variance in the comprehensive evaluation score is explained by the selected variables, indicating strong explanatory power. The Durbin–Watson ratio of 1.879 confirms no significant autocorrelation in the residuals, validating the model’s assumptions. This also supports the reliability of the regression by showing that the outcomes are not influenced by each other. All VIF values are below problematic thresholds, with the highest being 2.69 for SD5, ensuring no multicollinearity issues. Lastly, the ANOVA results, with a p-value of 0.000 and an F-ratio of 231.9852, confirm the model’s significant explanatory power and good fit (see also Appendix D). The significance of the ANOVA test supports that the set of predictors, taken together, reliably predicts the outcome variable. This strong explanatory value suggests the model effectively captures key determinants of tourism efficiency. The inclusion of only significant predictors enhances the accuracy and relevance of the results. The removal of non-significant variables also improves model parsimony and interpretability without sacrificing explanatory power. Further, all important variables have positive effects, meaning that better travel experiences or higher service quality lead to higher tourism efficiency. This matches what theory suggests and supports the model’s validity. Also, all significant variables have positive effects, showing that better travel experiences or service quality lead to higher tourism efficiency.
Table 1 presents the results of the Multiple Regression Analysis (MRA) for the determinants of tourism efficiency, including both the OLS estimates and their corresponding p-values (See also the detailed Table A6 in Appendix D). As indicated by the p-values, MDF2 (Motivation and Driving Forces) (1.074; 0.026), TE4 (Travel Experience) (1.333; <0.001), SD5 (Sustainability of Destination) (0.134; 0.010), and QS6 (Quality of Services) (0.185; <0.001) are statistically significant predictors of tourism efficiency at the 1% significance level, except for MDF2 which is significant at the 5% level. These variables exhibit low p-values, providing strong evidence of their influence in explaining tourism efficiency. Among these, TE4 (Travel Experience) stands out as the most significant predictor, with a high coefficient of 1.333 and a p-value < 0.001, indicating its substantial impact on tourism efficiency. This shows that Travel Experience is very important for keeping tourists satisfied and interested, which often leads to repeat visits and good reviews. Things like unique attractions, easy access, and memorable experiences all help improve tourism efficiency. QS6 (Quality of Services) and SD5 (Sustainability of Destination) also emerge as important contributors, with p-values signifying statistical significance. MDF2 (Motivation and Driving Forces) is significant at the 5% level, though it has a smaller coefficient. Motivation and personal reasons, like tourist interests and values, also help a destination attract and keep visitors, but not as much as Travel Experience or service quality. On the other hand, IC1 (Individual Characteristics) (0.025; 0.716) and SN3 (Social Network) (−0.235; 0.382) are not statistically significant, as their p-values exceed the 0.05 threshold. This indicates that IC1 and SN3 do not meaningfully contribute to explaining the variation in the comprehensive evaluation score, and thus, they are excluded from the final refined model. The subsequent analysis, therefore, only includes the significant variables: MDF2 (Motivation and Driving Forces), TE4 (Travel Experience), SD5 (Sustainability of Destination), and QS6 (Quality of Services). This analysis confirms the significance of these variables, emphasizing their role in explaining tourism efficiency. This shows that destination-related factors matter more than tourist demographics or social influence, meaning that improving the destination leads to better efficiency.
Table 2 presents the refined MRA results after removing insignificant variables (See also the detailed Table A7 in Appendix D). The R2 value of 0.609 indicates that the model explains 60.9% of the variance in the output score, demonstrating strong explanatory power. The Adjusted R2 of 0.607 confirms the continued significance of the variables even after adjusting for the number of predictors, highlighting the absence of overfitting. The Durbin–Watson ratio of 1.871 suggests no significant autocorrelation, reinforcing the model’s validity. Additionally, all VIF values are below problematic thresholds, confirming the absence of multicollinearity and ensuring stable coefficients. The model’s performance remains strong, with an overall F-ratio of 348.2382 and a p-value < 0.001, further confirming its good fit. These results underscore the importance of TE4, QS6, SD5, and MDF2 as key drivers of tourism efficiency, emphasizing their relevance for improving regional performance.
The analysis confirms the significance of TE4 (Travel Experience) (1.343; <0.001), QS6 (Quality of Services) (0.181; <0.001), SD5 (Sustainability of Destination) (0.130; 0.012), and MDF2 (Motivation and Driving Forces) (1.053; 0.027). These variables significantly impact the comprehensive evaluation score, emphasizing their key role in determining tourism region efficiency (). Their low p-values further confirm their contribution to the model. TE4 and QS6 are statistically significant at the 1% level, with TE4 being the strongest predictor. These results underscore the importance of enhancing the Travel Experience and service quality to improve tourism efficiency.
Improving Travel Experience and service quality is the most effective way to boost tourism efficiency, as these factors have the greatest impact. The positive coefficient for TE4 (1.343) indicates that better travel experiences lead to a significant increase in tourism efficiency, underscoring its importance. A better Travel Experience can lead to longer visits, more spending, and loyal customers, which helps the destination use resources well and improve results. Similarly, QS6 highlights that higher-quality services are crucial for improving tourism performance, making them essential for tourism regions aiming to enhance efficiency. MDF2 and SD5 are significant at the 5% level, though their influence is weaker than that of TE4 and QS6. This suggests that while Motivation and Driving Forces and Sustainability of Destination are important, their effect on efficiency is less pronounced compared to the more direct factors of Travel Experience and service quality. These factors support overall efficiency but are not as central. The positive coefficient for MDF2 (1.053) suggests that improving Motivation and Driving Forces enhances tourism efficiency, emphasizing the importance of marketing and promotional strategies. Likewise, the positive coefficient for SD5 (0.130) implies that sustainability practices contribute to efficiency, though the effect is smaller. Sustainability influences efficiency by making the destination more attractive and stronger over time, but its short-term effect is less clear than Travel Experience or service quality.
In contrast, IC1 (Individual Characteristics) (0.025; 0.716) and SN3 (Social Network) (−0.235; 0.382) were found to be statistically insignificant, as their p-values exceed 0.05. This suggests that personal traits and social networks do not significantly influence tourism efficiency, leading to their exclusion from the final model. This reinforces the idea that, in the context of tourism efficiency, these factors are less impactful compared to others, such as service quality or Travel Experience.
In conclusion, the PCA-MRA approach in Step 4 identifies Travel Experience (TE4) and Quality of Services (QS6) as the most critical determinants of tourism region efficiency. This indicates that tourism regions should prioritize improving these factors to enhance performance. The significance of Sustainability of Destination (SD5) and Motivation and Driving Forces (MDF2) underscores the importance of sustainable practices and effective marketing strategies to enhance competitiveness and overall tourism efficiency. These findings suggest that while service quality and Travel Experience should be the primary focus, sustainability and motivation also play a supporting role, which should not be overlooked when developing strategies for improving tourism efficiency. Prioritizing investments in these key areas can optimize resource allocation and yield substantial returns, while integrating sustainability ensures these gains last over the long term.

6.3. Impacts on Frequency of Visits and Duration of Visits: A Sensitivity Analysis

To further validate the findings from Step 5, a sensitivity analysis was conducted using alternative input-output configurations for 14 DMUs (two types of actors for each of the seven CECs in the tourism destinations) based on the Super-efficiency CCR Output-Oriented DEA. We selected four significant input items (TE4, QS6, SD5, and MDF2) based on their significance in the MRA from Step 4. This analysis examines how changes in the input-output structure affect the efficiency scores, ensuring the robustness of the results. The sensitivity analysis focuses on the most significant variables identified in the PCA-MRA from Step 4, providing a streamlined examination of key determinants of efficiency. These sensitivity checks serve as robustness tests for the regression model, showing that the exclusion or modification of input variables (e.g., removal of non-significant variables such as IC1 and SN3) does not change the main results. The regression results remain stable across these configurations.
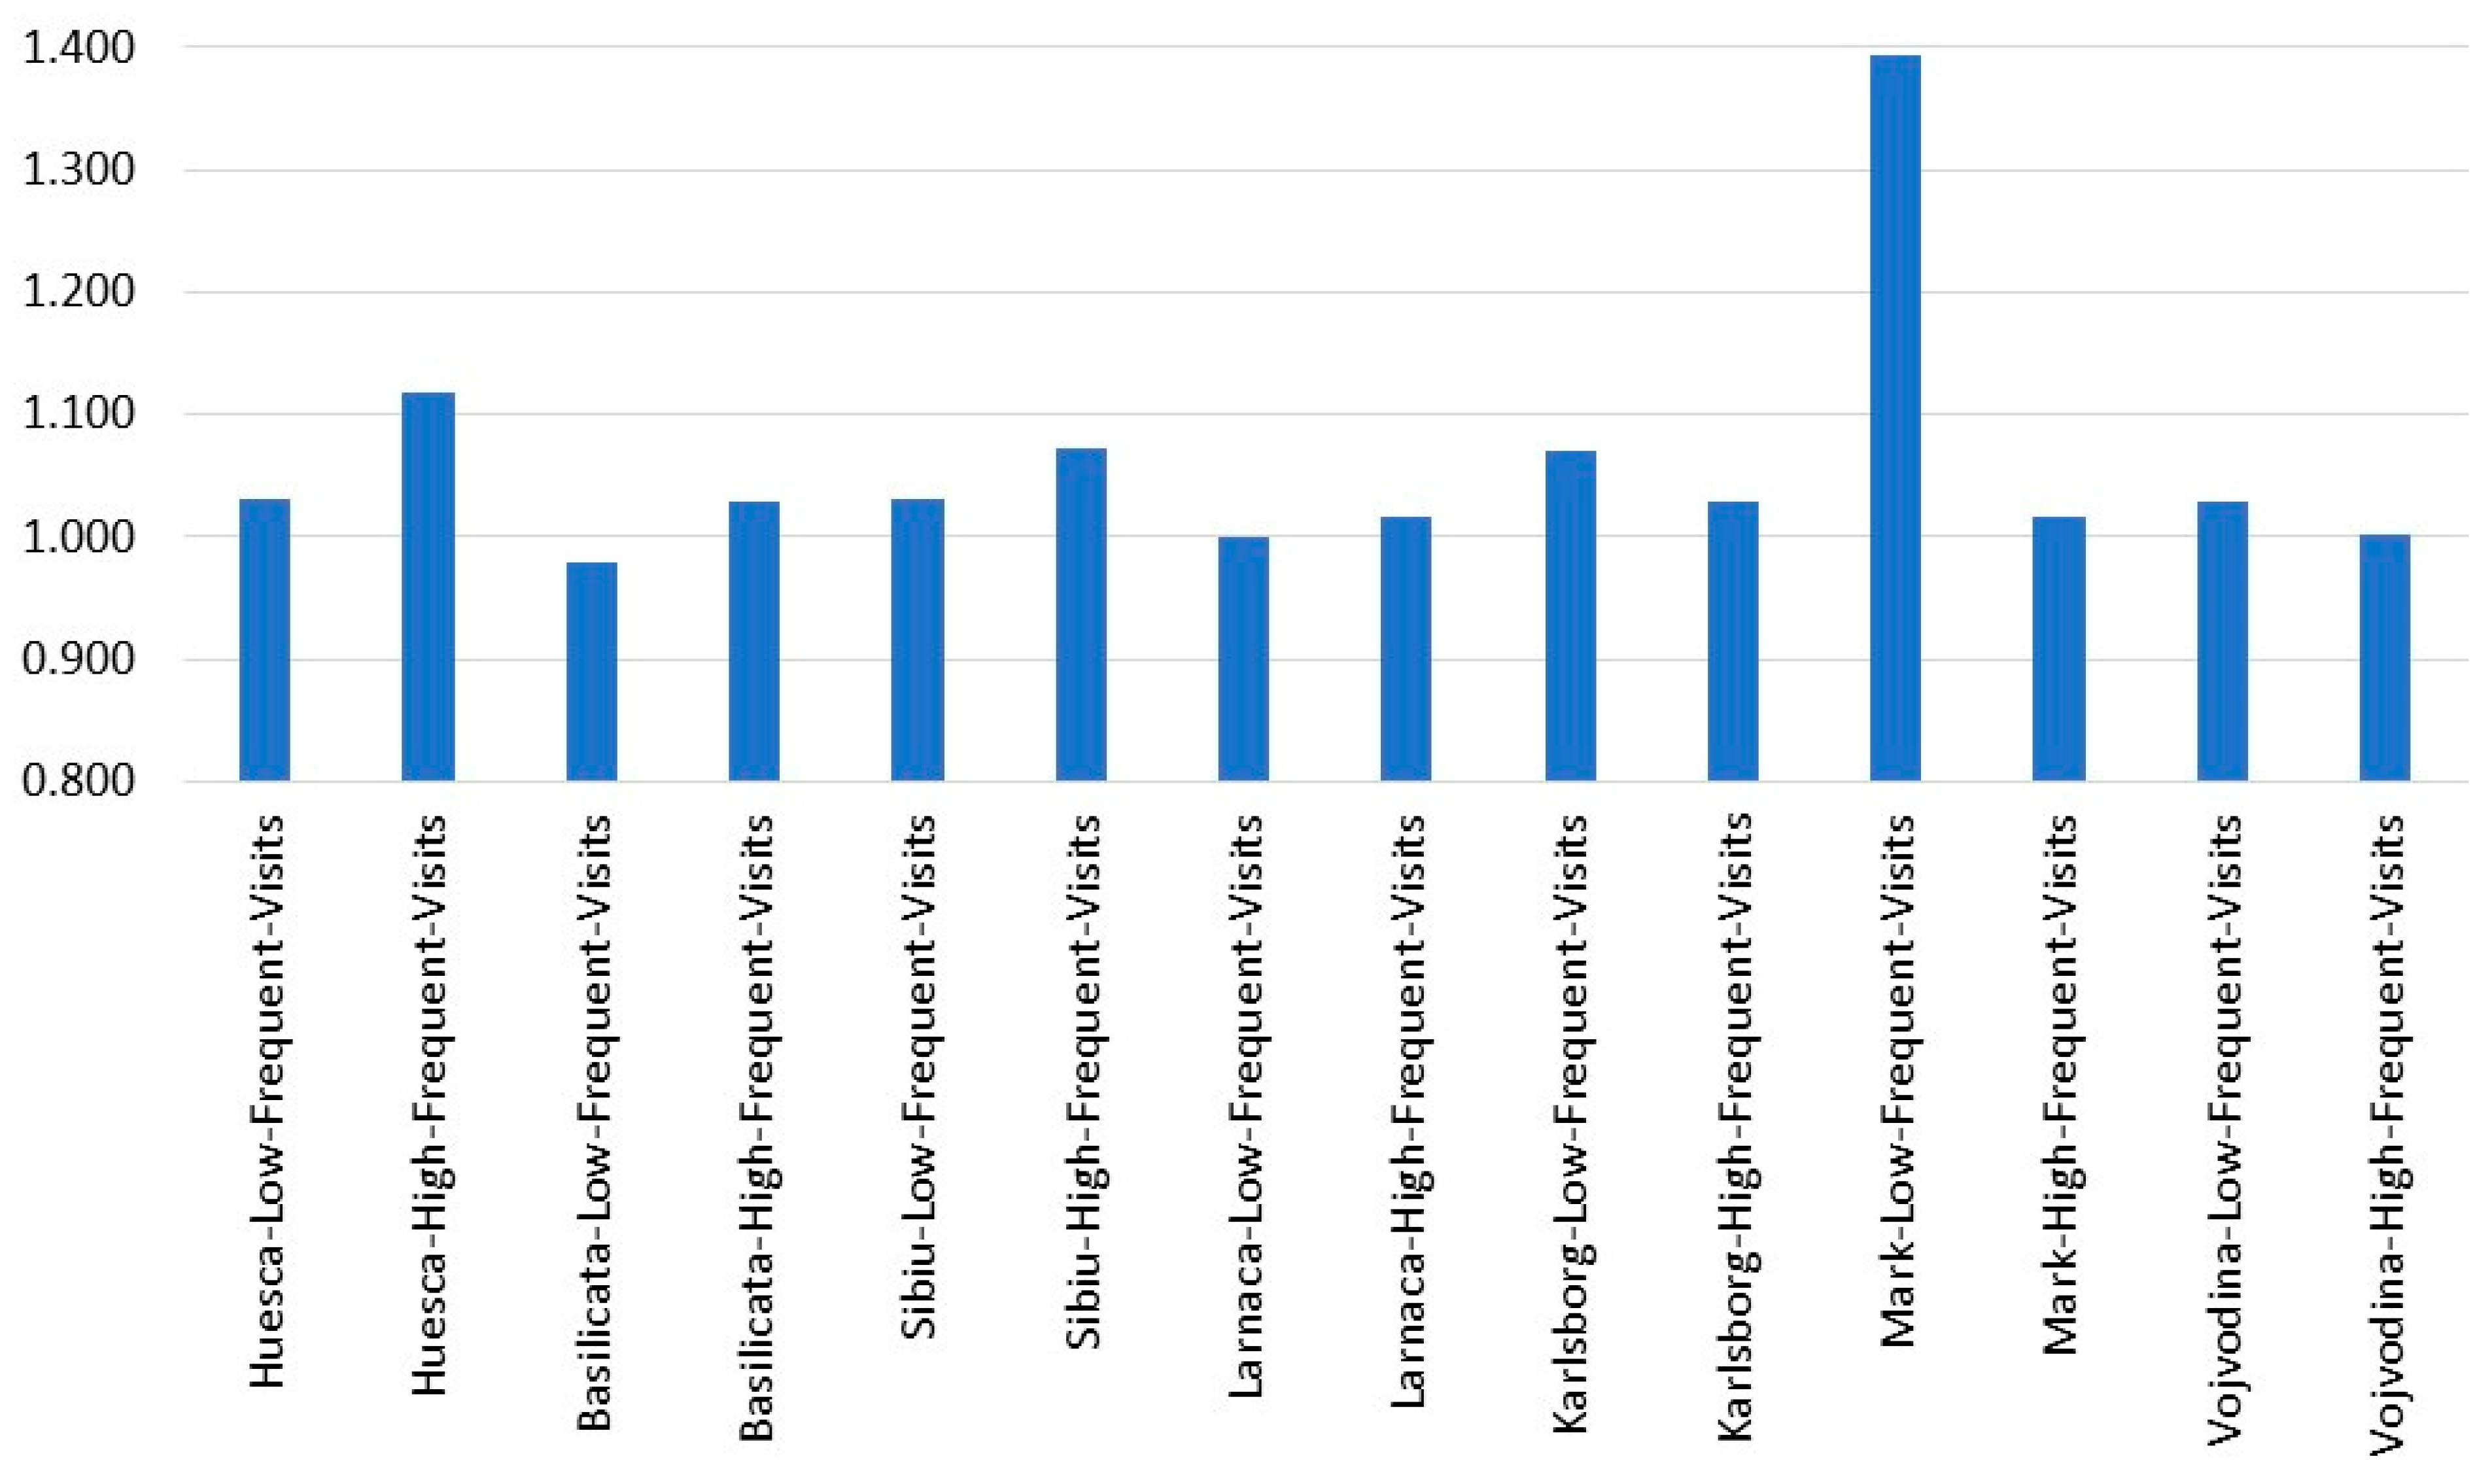
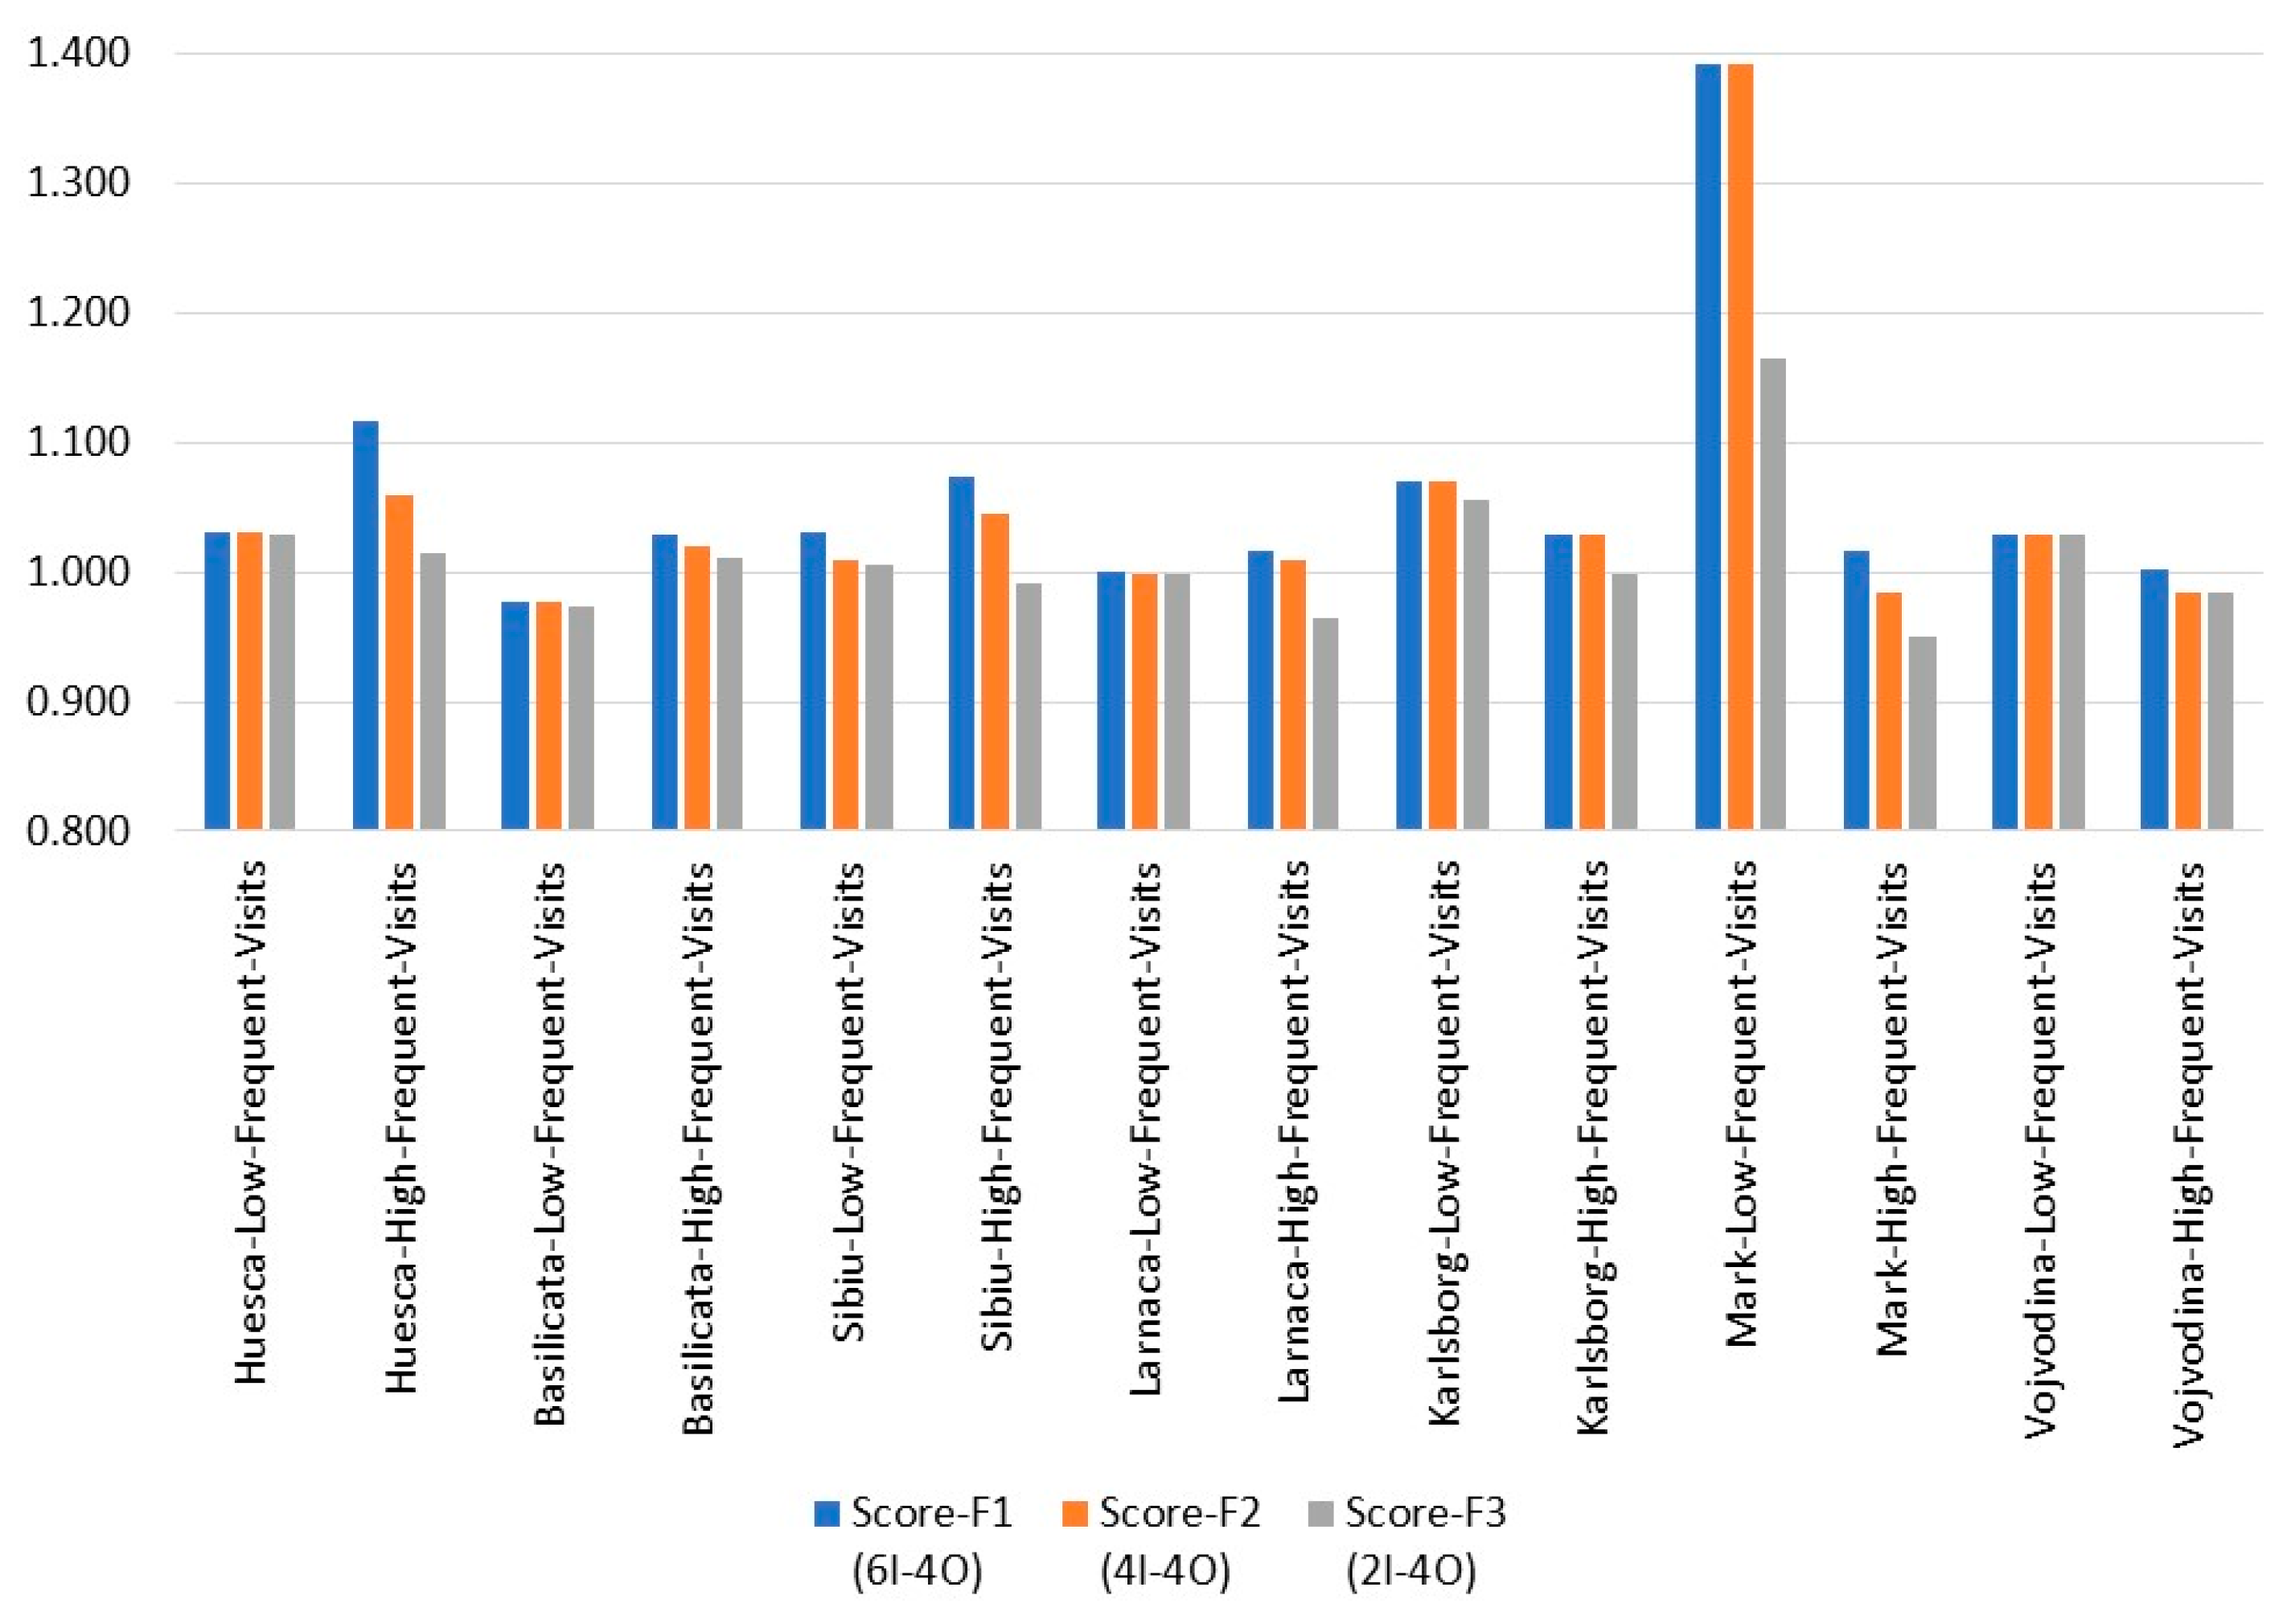
  • Frequency of Visits: This option utilizes four significant input items (TE4, QS6, SD5, and MDF2) and four outputs: GS (General Satisfaction), WCB (Willingness to Come Back), WR (willingness to recommend), and EUS (Europeanization). This configuration allows for a focused analysis of how these factors influence efficiency in relation to the Frequency of Visits (see Figure 6).
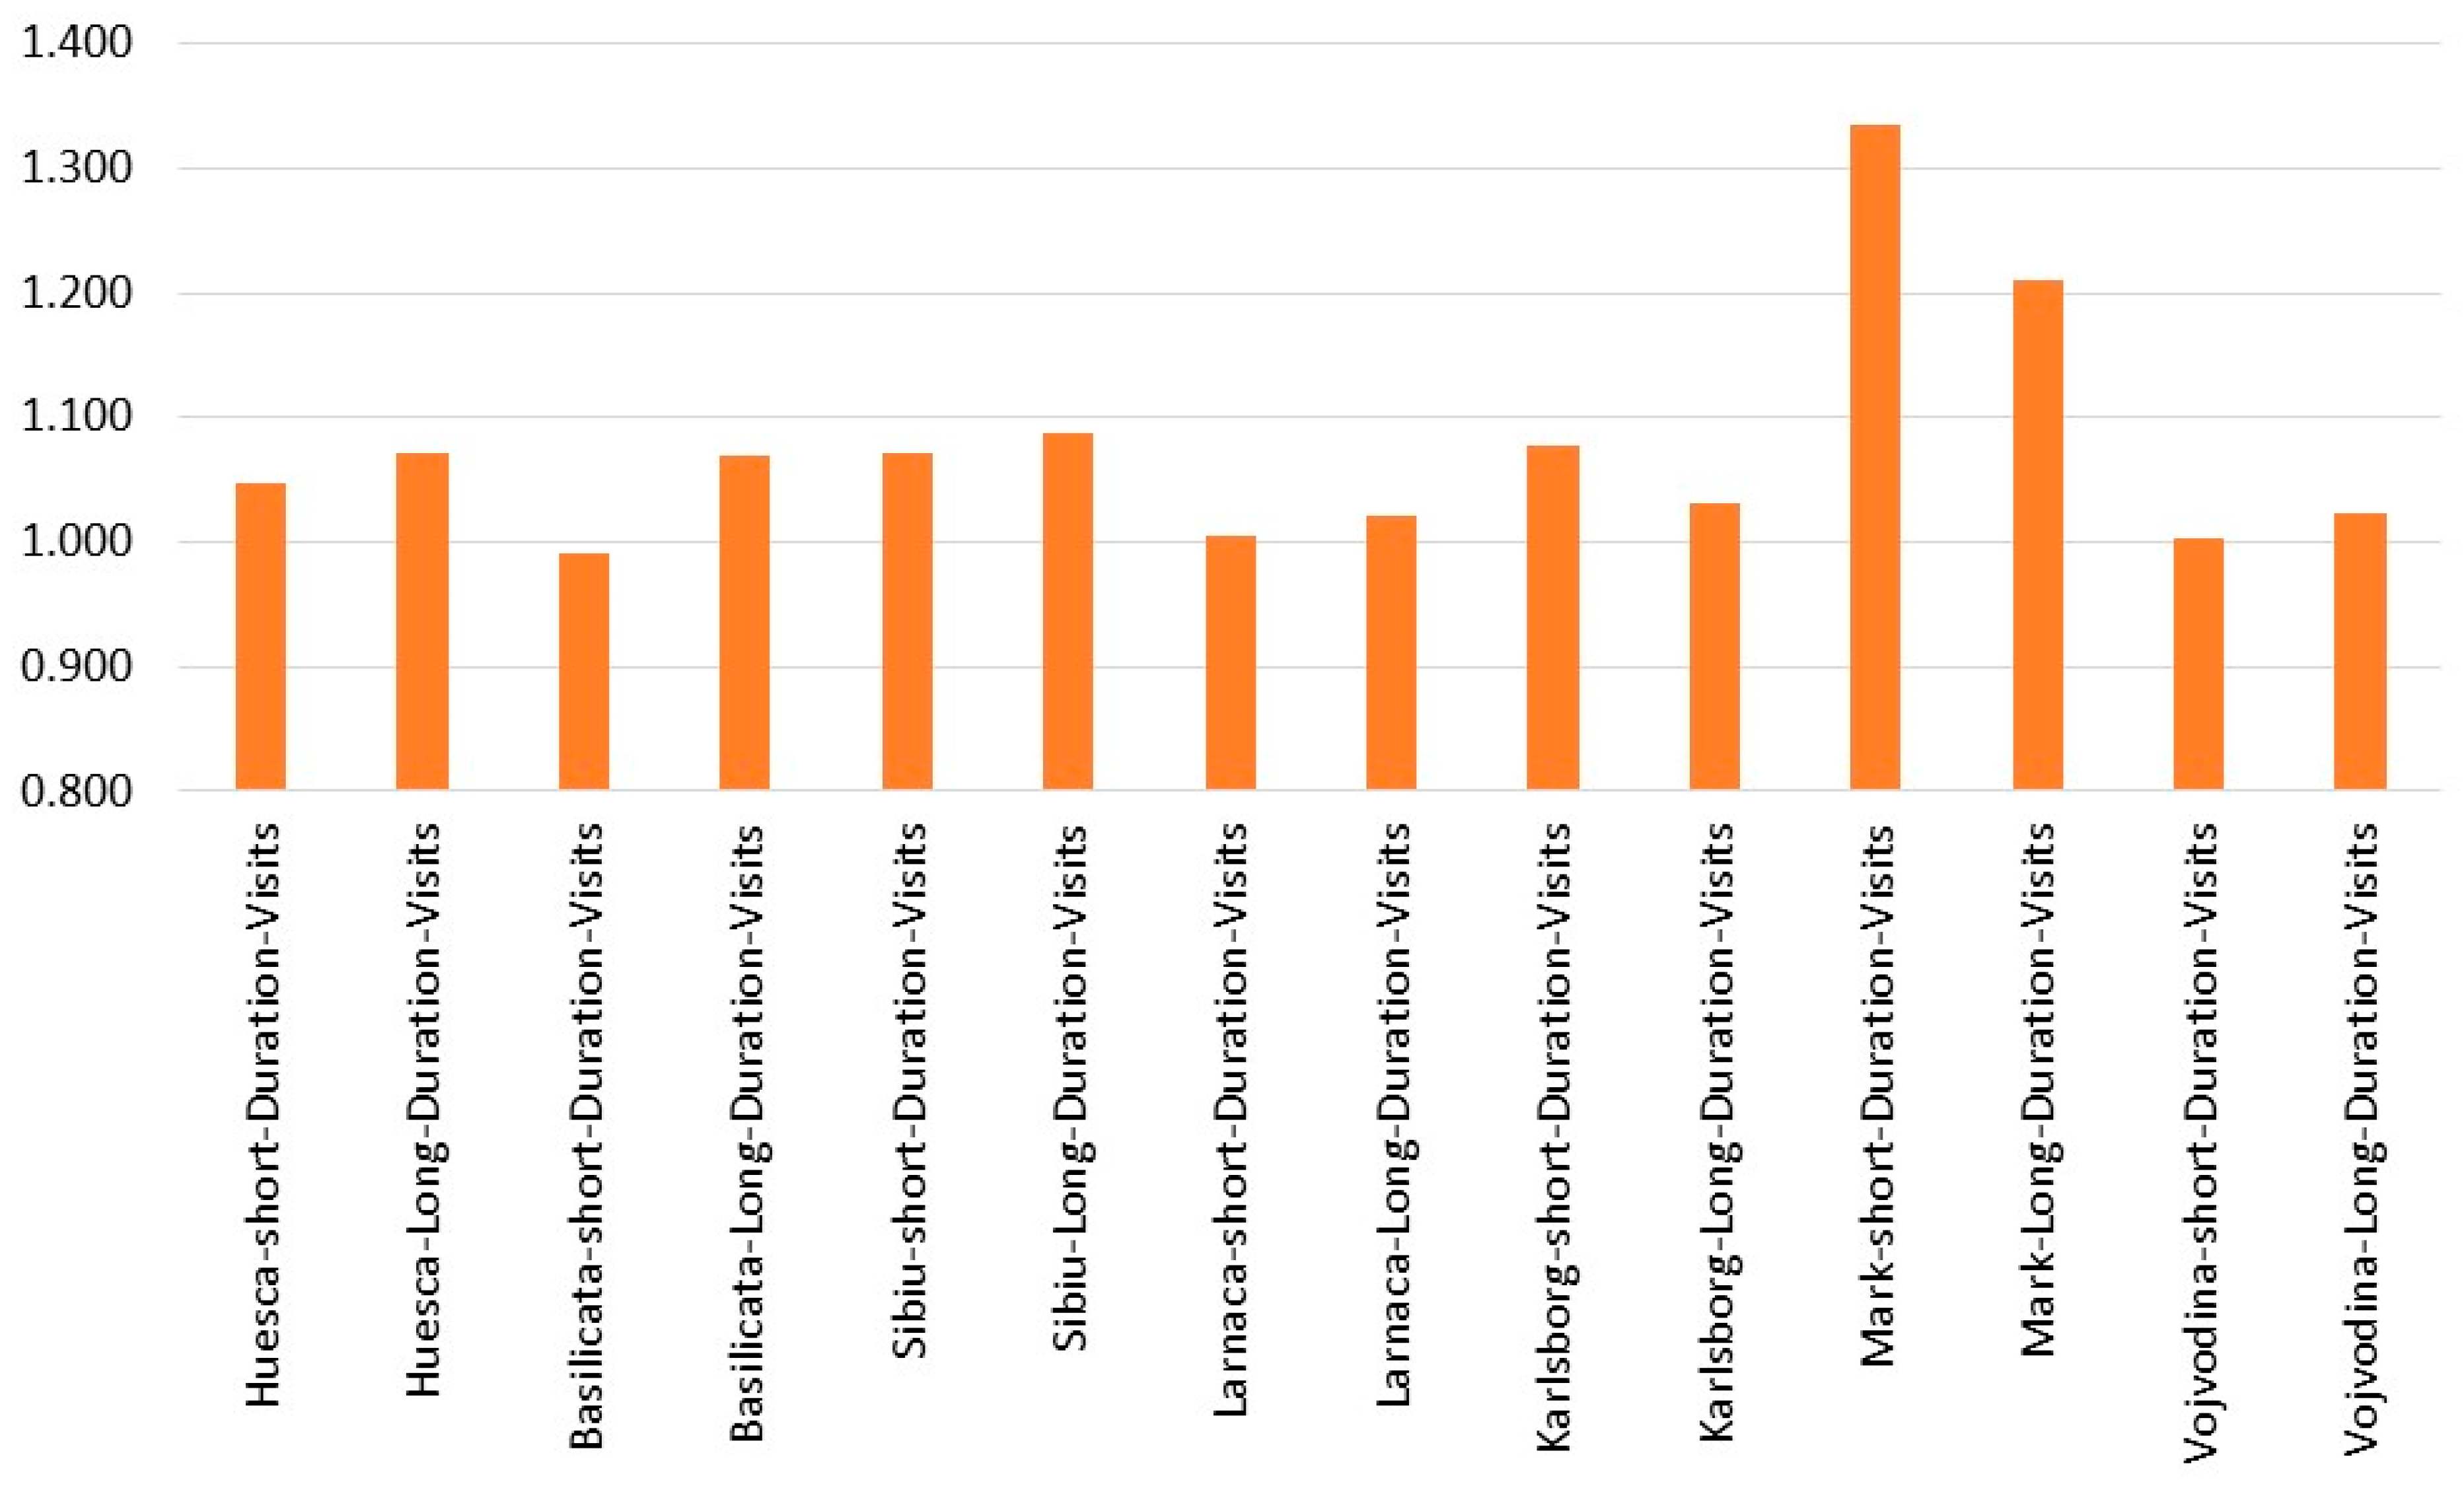
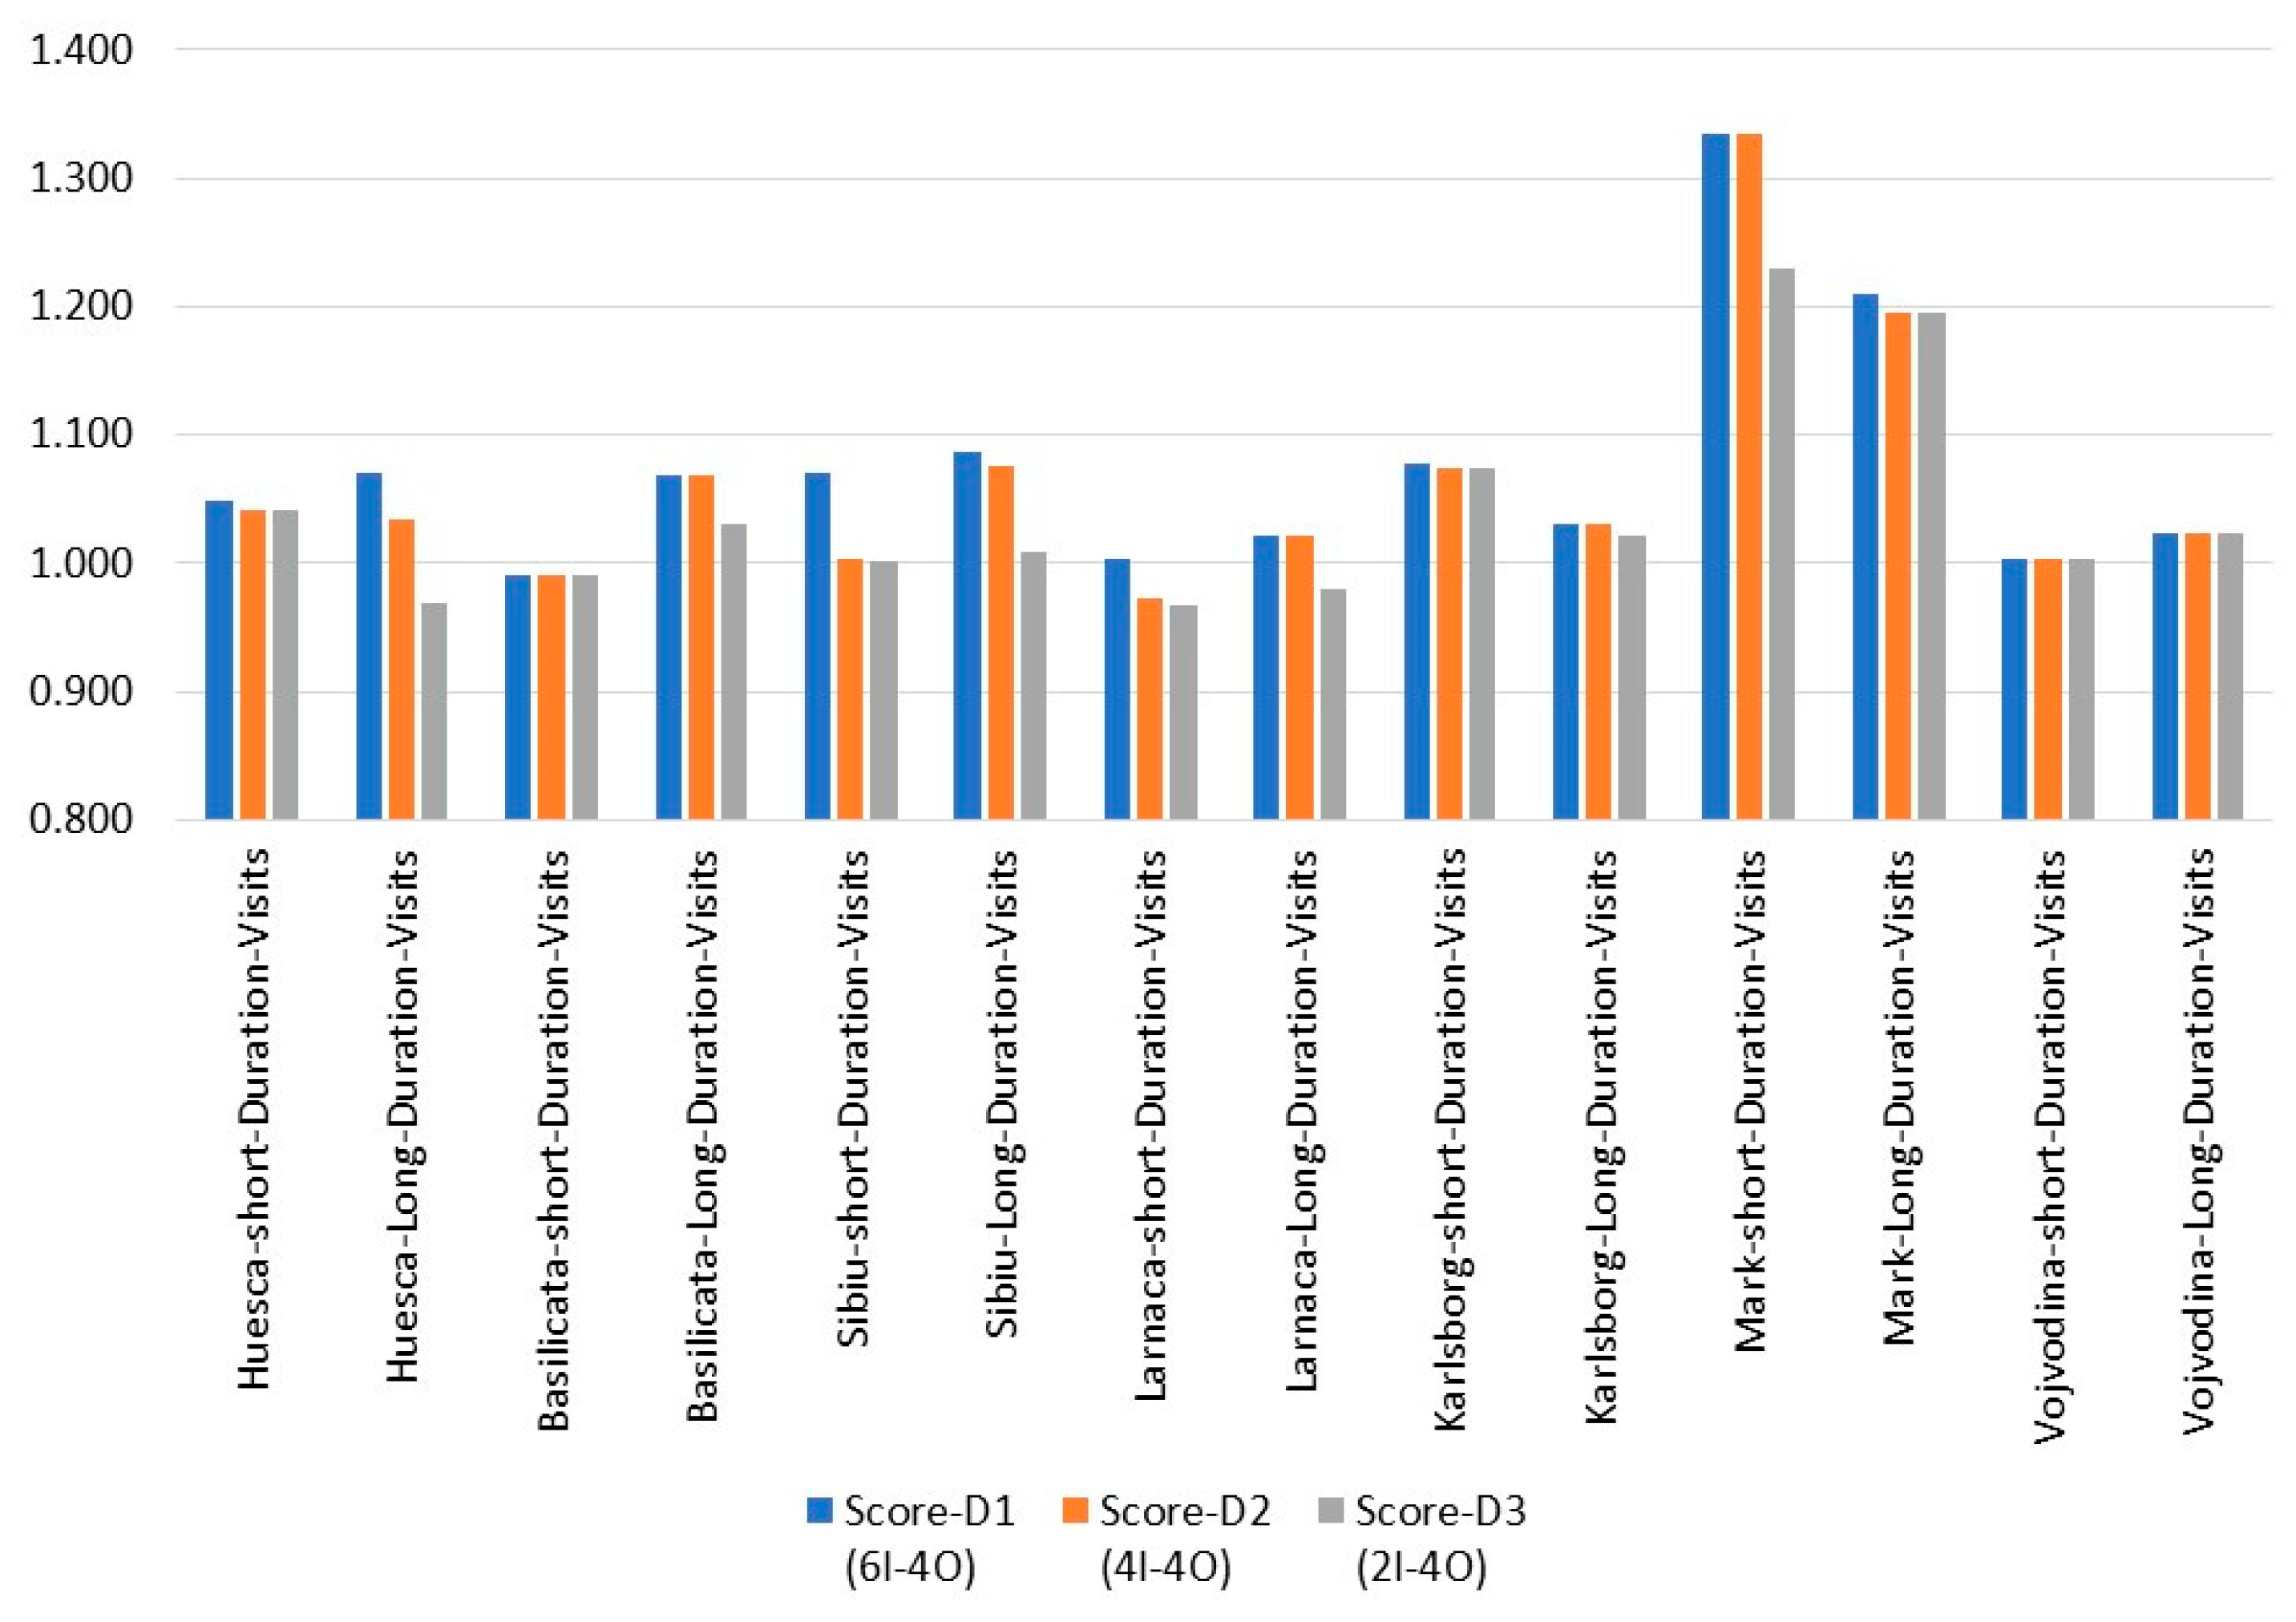
  • Duration of Visits: This option similarly uses the four significant input items (TE4, QS6, SD5, and MDF2) and outputs (GS, WCB, WR, and EUS), providing a consistent basis for examining the impact of these factors on efficiency with respect to the Duration of Visits (see Figure 7).
Figure 6 and Figure 7 illustrate the sensitivity analysis of the DEA results for both the Frequency of Visits and Duration of Visits options. These figures show the efficiency scores of the DMUs under different input(I)-output(O) configurations (F1, F2, and F3 and D1, D2, and D3), highlighting the stability of the findings (see for more details also Appendix E).
The results depicted in Figure 6 and Figure 7 show that the Mark CEC in the seven European tourism destinations consistently ranks highest across different tourism scenarios (F1, F2, and F3 and D1, D2, and D3). Mark’s performance remains exceptional, often securing the highest score or rank (first or second place) in various configurations, including 6I-4O, 4I-4O, and 2I-4O. This consistency underscores the robustness of the initial findings. However, the analysis also shows that Mark’s performance in the high-frequency visit context is relatively poor (ranked 11th, 13th, and 14th), suggesting specific areas for improvement. This persistent issue highlights the need for targeted strategies to manage high-frequency visits more effectively. Even highly efficient regions must address particular challenges to maintain their competitive edge.
The sensitivity analysis results presented in Figure 6 provide a better understanding of how the Frequency of Visits influences the performance of each CEC across different configurations. The analysis highlights the following trends:
  • Mark’s CEC consistently ranks first or second across all configurations (F1, F2, F3), with high scores of 1.393 in F1, 1.393 in F2, and 1.164 in F3. This demonstrates that Mark’s performance remains strong regardless of the Frequency of Visits, showcasing the region’s efficient use of the four key input factors (TE4, QS6, SD5, MDF2). Mark’s consistent top ranking emphasizes its excellence in managing tourism-related resources.
  • However, Mark’s performance in high-frequency visits drops significantly, where it ranks 11th in F1, 13th in F2, and 14th in F3. This suggests that Mark faces difficulties in managing high-frequency visitors, likely due to service limitations or other logistical constraints. Specific strategies are needed to improve this aspect of high-frequency tourism. This drop in rank is critical for understanding how the region may need to adapt to varying visitor patterns, especially under conditions of high visitation rates.
  • Other regions, such as Huesca, show more stable performance across different visit frequencies, with Huesca ranking fifth and second for low and high-frequency visits, respectively, while Karlsborg ranks fourth and eighth. In contrast, Basilicata and Larnaca consistently rank low across all configurations, indicating that these regions may face significant challenges in optimizing their offerings for both low and high-frequency visitors. These fluctuations highlight the importance of adaptive strategies tailored to both low and high-frequency scenarios, with an emphasis on enhancing infrastructure and service capacity.
In Figure 7, which shows the efficiency scores for the Duration of Visits, similar trends emerge:
  • Mark’s CEC remains the top performer, securing first place in both short-duration and long-duration visits, with scores of 1.334 in D1 and 1.211 in D2. However, there is a slight decrease in the score for long-duration visits, suggesting that Mark could improve services for extended stays, possibly by enhancing engagement or offering more varied tourism experiences. This decrease points to areas where Mark can further develop its appeal to long-term visitors, such as providing additional amenities or activities that cater to extended stays.
  • Sibiu shows a significant improvement between short and long-duration visits, improving its rank from 5th in short-duration visits to 3rd in long-duration visits (with a score of 1.087 in D1). This suggests that Sibiu may be better equipped to cater to longer stays, possibly due to its rich cultural and heritage experiences. Sibiu’s performance highlights the importance of fostering a deeper connection with visitors during their extended stays, potentially leveraging its cultural assets to enhance the visitor experience.
  • Larnaca continues to underperform, with ranks of 12th and 14th in short and long-duration visits, indicating that the region may need major improvements in its infrastructure and offerings to compete effectively in these scenarios. Its consistently low performance across both categories highlights the need for a comprehensive overhaul of its tourist services to stay competitive.
  • Basilicata ranks low as well, confirming that efficiency remains an issue for this region, regardless of visit duration. Basilicata’s performance across both visit types reaffirms the necessity of focused interventions aimed at improving operational efficiency and the visitor experience.
Overall, the sensitivity analysis confirms that efficiency scores remain stable across different configurations, validating the robustness of the model. This consistency indicates that the identified key determinants (TE4, QS6, SD5, and MDF2) are indeed crucial for the efficiency of tourism regions. By concentrating on these factors, regions can develop more targeted and effective strategies to enhance their performance.
In conclusion, the Multivariate DEA provides a comprehensive evaluation of the efficiency of tourism regions (or CECs), identifying key performance determinants and offering valuable insights for heritage-led policy development. The sensitivity analysis further validates the robustness of the findings, confirming the importance of Travel Experience (TE), Quality of Services (QS), Sustainability of Destination (SD), and Motivation and Driving Forces (MDF) in determining tourism region efficiency. By prioritizing these factors, regions can formulate more effective strategies to improve performance and competitiveness. Enhancing these areas will significantly boost overall efficiency, improve the tourist experience, and sustain high levels of visitor satisfaction and loyalty. The findings highlight the role of transformative cultural tourism in promoting long-term regional sustainability and enhancing cultural identity.

7. Conclusions

7.1. General Findings

Our Multivariate DEA approach to heritage-led tourist areas has identified four critical determinants of tourism region efficiency: Travel Experience (TE4), Quality of Services (QS6), Sustainability of Destination (SD5), and Motivation and Driving Forces (MDF2). These four factors are essential in influencing CEC efficiency and play a key role in fostering sustainable tourism through innovative cultural strategies, thereby shaping the competitive edge and overall performance of tourism regions.
  • Travel Experience: Regions with a diverse range of high-quality, personalized experiences consistently outperform others. Investments in infrastructure, local cultural offerings, and well-rounded tourism packages are vital to enhancing this determinant, as supported by the exceptional DEA scores of the Mark region in Sweden.
  • Quality of Services: Regions that prioritize high standards in hospitality and customer service demonstrate significantly higher efficiency. Initiatives like staff training programs, quality assurance mechanisms, and responsive feedback systems help maintain and improve service standards, as seen in Mark’s consistently high scores across different DEA configurations.
  • Sustainability of Destination: Incorporating sustainable practices is essential for attracting eco-conscious travelers and preserving natural and cultural resources. Environmental conservation efforts, the safeguarding of cultural heritage, and the promotion of responsible tourism practices contribute to long-term competitiveness.
  • Motivation and Driving Forces: Understanding tourists’ motivations and behaviors is crucial for attracting and retaining visitors. Effective strategies include targeted marketing campaigns, ongoing market research, and strategic collaborations with tourism stakeholders to align offerings with visitors’ expectations.
The findings of this study show that these determinants are interconnected and that a holistic approach is necessary to enhance regional tourism efficiency. These findings align with the results of the sensitivity analysis, where the importance of these key factors was consistently confirmed across various scenarios. Additionally, the contributions of each determinant offer a practical, actionable roadmap for improving the efficiency of CECs.
This study makes several significant contributions: (i) methodologically, by combining PCA, DEA, and regression for performance analysis of cultural-ecological regions; (ii) empirically, by offering a comparative efficiency evaluation of seven European CECs; and (iii) conceptually, by integrating visitor co-creation and regional sustainability in a novel framework. The practical implications include tailored policy recommendations for regional planners, emphasizing investment in service quality, sustainability, and visitor experience design. By combining empirical evidence with a solid conceptual framework, this study provides a robust foundation for the development of more effective regional tourism strategies.
This study offers concrete policy recommendations by identifying efficiency drivers in cultural tourism. Findings support the integration of co-creation in regional tourism planning, emphasizing collaboration between stakeholders to enhance sustainability and competitiveness. By focusing on these four key factors, tourism regions can not only improve their performance but also establish a strong position in sustainable tourism development over the long term.

7.2. Policy Lessons

Top-performing regions like Mark in Sweden show the importance of a holistic approach, where high service quality, diverse offerings, robust sustainability efforts, and effective marketing converge to create a well-rounded tourism experience. However, the sensitivity analysis highlights that even efficient regions can face challenges—such as Mark’s lower performance in handling high-frequency visitors—indicating the need for targeted improvements. Based on the above evidence-based findings, we can formulate the following strategic recommendations:
  • Enhancing Travel Experience: Regions should focus on investing in infrastructure, developing local cultural activities, and offering comprehensive, experience-rich tourism packages to improve visitor engagement.
  • Improving Quality of Services: Implement ongoing staff training programs, enforce quality assurance mechanisms, and use real-time customer feedback to maintain high service standards.
  • Promoting Sustainability: Focus on environmental conservation, protecting cultural heritage, and integrating sustainable tourism practices into policy and development plans to attract eco-conscious visitors and preserve local assets.
  • Understanding Tourist Motivations: Conduct detailed market research, design tailored marketing campaigns that resonate with target audiences, and establish collaborations with stakeholders to align offerings with tourist expectations.
The robustness of these findings, confirmed through both the Multivariate DEA model and the subsequent sensitivity analysis, ensures the reliability of these insights for policymaking. By addressing these four key determinants, tourism regions can significantly enhance their efficiency, improve visitor satisfaction, and ensure long-term sustainability. Integrating these findings into regional tourism strategies will help regions identify their strengths and weaknesses, guiding the development of more focused, data-driven improvements. Moreover, this integration fosters a culture of adaptability, ensuring that regions remain responsive to the evolving demands of global tourism markets.
While this study offers strategic and practical insights into the relative efficiency of CECs in cultural tourism, it has certain limitations. First, the dataset is limited to seven rural CECs, which may affect the generalizability of the findings to urban settings. Second, the reliance on self-reported survey data introduces potential biases in stakeholder responses. Additionally, the regional focus on non-urban areas may restrict the applicability of the findings to other contexts. Future research should broaden the scope to include a comparative analysis of urban and rural CECs and explore urban CECs while expanding the dataset to include a broader range of stakeholders.

Author Contributions

Conceptualization, K.K., P.N. and S.S.; Methodology, K.K., P.N. and S.S.; Validation, S.S.; Formal analysis, K.K. and S.S.; Investigation, K.K., P.N. and S.S.; Writing—original draft, K.K., P.N. and S.S.; Writing—review & editing, K.K., P.N. and S.S.; Visualization, K.K. and S.S. All authors have read and agreed to the published version of the manuscript.

Funding

Karima Kourtit and Peter Nijkamp acknowledge a grant from the European Union’s Horizon 2020 research and innovation programme for the Be.CULTOUR project, under grant agreement No 101004627. Karima Kourtit acknowledges support from the HORIZON-CL2-2022-TRANSFORMATIONS-01 Programme for the WISER project, under grant agreement No. 101094546.

Institutional Review Board Statement

Ethical review and approval were waived for this study by Institution Committee due to Legal Regulations (https://becultour.eu/results, accessed on 30 March 2025; https://becultour.eu/privacy-policy, accessed on 30 March 2025).

Informed Consent Statement

This study has obtained the informed consent of all participants.

Data Availability Statement

The data presented in this study are available on request from the corresponding author.

Conflicts of Interest

The authors declare no conflict of interest.

Appendix A. Data Typology of Visitor Surveys

The Surveys Followed the EU General Data Protection Regulation (GDPR, Regulation (EU) 2016/679), https://becultour.eu/privacy-policy (accessed on 30 March 2025).
The survey conducted among visitors focused on assessing their experiences, motivations, and perceptions of cultural heritage sites. The key items addressed in the survey include both demographic information and in-depth questions regarding visitors’ satisfaction, sustainability concerns, and transformative experiences. Below is a typology of the data collected:
  • Demographic Information
    Groups: Respondent type (categorized into three groups: resident, proximity traveler, and tourists.
    Age: Multiple age groups (18–24, 25–34, 35–44, etc.).
    Gender: Female, Male, or Prefer to self-describe.
    Education Level: No School, Primary/Middle School, Secondary/High School, College/University, Postgraduate.
    Occupation: Categories such as Student, Employee, Self-employed, Retired, etc.
  • Visit Details
    Frequency of Visits: First-time visitor, occasional visitor, or frequent visitor of historic sites.
    Company: Who accompanied you during the visit? (e.g., Alone, Partner, Family).
    Source of Information: How did you learn about the Cultural Route? (e.g., Internet, Social Media, Friends).
    Motivation for Visit: Main reason for visiting (e.g., Holiday, Cultural heritage, Business).
    Duration of Visit: Ranging from a one-day visit to a week or more.
  • Cultural and Natural Heritage Experience
    Satisfaction: Evaluation of cultural and natural heritage, festivals, music, craft, and art.
    Customization: Ability to tailor the visit based on personal desires/needs.
    Authenticity: Assessment of the site’s authenticity and its atmosphere.
  • Transformative Travel Experience
    Learning Experience: Visitors’ perception of personal growth, connection to nature, and cultural learning.
    Impact on the Visitor: Statements assessing whether the visit changed the visitors’ perceptions or habits.
    Satisfaction: General Satisfaction with the transformative experience.
  • Perception of European Culture and Identity
    Cultural Heritage from a European Perspective: Understanding the site’s role in representing European identity, history, and values.
    Sense of Belonging: Evaluation of how the visit strengthened the visitor’s connection to European culture.
  • Sustainability of the Destination
    Environmental Sustainability: Availability of sustainable transport, green accommodations, and conservation efforts.
    Destination Management: Promotion of local food, crafts, and conservation efforts.
    Tourism and Community: Focus on social responsibility, tourism workers’ skills, and inclusivity for people with special needs.
  • Global Satisfaction
    Overall Experience: Satisfaction with the Travel Experience, the Quality of Services (e.g., accommodations, restaurants, public places).
    Recommendations: Likelihood of recommending the visit to others and the willingness to contribute to heritage conservation efforts.
  • Future Expectations
    Desired Enhancements: What would enhance the future experience (e.g., nature activities, spiritual experiences, smart working opportunities).
This data typology provides a comprehensive understanding of the survey structure and the insights gathered from visitors of tourist destinations to analyze visitor satisfaction and inform future management and marketing strategies for sustainable tourism.

Appendix B. Original DEA Scores

Table A1. Original DEA scores: DMU Option-B1 (6I-4O).
Score
DMUOption-B1
(6I-4O)
Huesca-Low-Frequent-Visits1.030
Huesca-High-Frequent-Visits1.117
Basilicata-Low-Frequent-Visits0.978
Basilicata-High-Frequent-Visits1.029
Sibiu-Low-Frequent-Visits1.030
Sibiu-High-Frequent-Visits1.073
Larnaca-Low-Frequent-Visits1.000
Larnaca-High-Frequent-Visits1.017
Karlsborg-Low-Frequent-Visits1.071
Karlsborg-High-Frequent-Visits1.029
Mark-Low-Frequent-Visits1.393
Mark-High-Frequent-Visits1.016
Vojvodina-Low-Frequent-Visits1.028
Vojvodina-High-Frequent-Visits1.002
Table A2. Original DEA scores: DMU Option-C1 (6I-4O).
Score
DMUOption-C1
(6I-4O)
Huesca-short-Duration-Visits1.048
Huesca-Long-Duration-Visits1.070
Basilicata-short-Duration-Visits0.991
Basilicata-Long-Duration-Visits1.069
Sibiu-short-Duration-Visits1.071
Sibiu-Long-Duration-Visits1.087
Larnaca-short-Duration-Visits1.004
Larnaca-Long-Duration-Visits1.022
Karlsborg-short-Duration-Visits1.078
Karlsborg-Long-Duration-Visits1.031
Mark-short-Duration-Visits1.334
Mark-Long-Duration-Visits1.211
Vojvodina-short-Duration-Visits1.004
Vojvodina-Long-Duration-Visits1.024

Appendix C. PCA Outputs

Table A3. Eigenvalue and Contribution ratio.
Component No.EigenvalueContribution RatioCumulative Contribution Ratio
12.4561.24%61.24%
20.7218.09%79.33%
30.4811.93%91.26%
40.358.74%100.00%
Table A4. Eigenvector.
EigenvectorComponent 1Component 2Component 3Component 4
GS0.517−0.2060.752−0.352
WCB0.523−0.236−0.654−0.492
WR0.546−0.251−0.0720.796
EUS0.4000.916−0.0190.012

Appendix D. Multiple Regression Analysis Results

Descriptive Statistics of Regression Variables (Duration-Based DMUs)

The following tables summarize the descriptive statistics of the input variables used in the regression models presented in Table A6 (model with all the inputs) and Table A7 (refined model).
Table A5. Descriptive Statistics for Variables in Full Regression Model.
DMUsDescriptionMSDMinMax
IC1Individual Characteristics3.280.362.623.84
MDF2Motivation and Driving Forces1.750.041.661.79
SN3Social Network1.700.071.581.80
TE4Travel Experience5.610.504.476.31
SD5Sustainability of Destination4.221.052.326.12
QS6Quality of Services4.571.122.756.38
Note. M = Mean; SD = Standard Deviation; Min = Minimum; Max = Maximum.
The statistics include the mean, standard deviation, minimum, and maximum values across all DMUs. This overview supports the transparency of the regression analysis and shows that the input variables used have sufficient variation and no extreme outliers.
Table A6. Multiple Regression Analysis Results for Determinants of Tourism Efficiency.
Regression Statistics
  • Coefficient of Determination (R2): 0.609
  • Adjusted Coefficient of Determination: 0.607
  • Durbin-Watson Ratio: 1.879
  • Standard Deviation of Residuals: 1.427
Analysis of Variance (ANOVA) Table
Source of VariationSum of SquaresDegrees of FreedomUnbiased VarianceF-Ratiop-ValueDecision
Total Variation4650.352898
Variation Due to Regression2834.1196472.3532231.98520.000[***]
Residual Variation1816.2338922.036135
Multiple Regression Model
VariableUnstandardized CoefficientStandardized CoefficientF-Valuep-ValueDecisionStandard ErrorVIF
IC10.0250.0080.1320.716 0.0681.09
MDF21.0740.0475.0060.026[**]0.4801.03
SN3−0.235−0.0190.7660.382 0.2691.07
TE41.3330.647620.1290.000[***]0.0541.54
SD50.1340.0896.7130.010[**]0.0522.69
QS60.1850.12915.1670.000[***]0.0472.52
Constant1.039 1.1790.278 0.957
Notes: *** ≤0.001, ** ≤0.01. VIF values were calculated for each variable and found to be below problematic thresholds, indicating no significant multicollinearity issues.
Table A6 shows the results of the regression model, including all six input variables. The model explains 61% of the variation in tourism efficiency (Adjusted R2 = 0.607). Among the predictors, TE4 (Travel Experience), QS6 (Quality of Services), SD5 (Sustainability of Destination), and MDF2 (Motivation and Driving Forces) are statistically significant. IC1 and SN3 were found to be insignificant and are therefore removed in the refined model. No multicollinearity issues were detected (all VIFs < 3).
Table A7. Multiple Regression Analysis results for key efficiency determinants.
Regression Statistics
  • Coefficient of Determination (R2): 0.609
  • Adjusted Coefficient of Determination: 0.607
  • Durbin-Watson Ratio: 1.871
  • Standard Deviation of Residuals: 1.426
Analysis of Variance (ANOVA) Table
Source of VariationSum of SquaresDegrees of FreedomUnbiased VarianceF-Ratiop-ValueDecision
Total Variation4650.352898
Variation Due to Regression2832.4684708.117348.23820.000[***]
Residual Variation1817.8848942.033427
Multiple Regression Model
VariableUnstandardized CoefficientStandardized CoefficientF-Valuep-ValueDecisionStandard ErrorVIF
TE41.3430.652663.6210.000[***]0.0521.46
QS60.1810.12614.7870.000[***]0.0472.47
SD50.1300.0866.3980.012[**]0.0512.67
MDF21.0530.0474.9110.027[**]0.4751.01
Constant0.735 0.7090.400 0.872
Notes: *** p ≤ 0.001, ** p ≤ 0.01. VIF values were calculated for each variable and found to be below problematic thresholds, indicating no significant multicollinearity issues.
Table A7 presents the refined regression model, which includes only the significant predictors from Table A6. The model’s explanatory power remains strong (Adjusted R2 = 0.607), confirming that TE4 and QS6 are the most influential factors. SD5 and MDF2 also contribute significantly but to a lesser extent. The results reinforce the importance of Travel Experience and service quality in explaining tourism efficiency.

Appendix E. PCA-DEA Score

Table A8. PCA-DEA score: DMU F-options.
Score Rank
DMUScore-F1
(6I-4O)
Score-F2
(4I-4O)
Score-F3
(2I-4O)
Rank-F1
(6I-4O)
Rank-F2
(4I-4O)
Rank-F3
(2I-4O)
Huesca-Low-Frequent-Visits1.0301.0301.029553
Huesca-High-Frequent-Visits1.1171.0601.015235
Basilicata-Low-Frequent-Visits0.9780.9780.974141412
Basilicata-High-Frequent-Visits1.0291.0191.011786
Sibiu-Low-Frequent-Visits1.0301.0101.0066107
Sibiu-High-Frequent-Visits1.0731.0440.9913410
Larnaca-Low-Frequent-Visits1.0000.9980.99813119
Larnaca-High-Frequent-Visits1.0171.0100.96510913
Karlsborg-Low-Frequent-Visits1.0711.0711.055422
Karlsborg-High-Frequent-Visits1.0291.0290.999868
Mark-Low-Frequent-Visits1.3931.3931.164111
Mark-High-Frequent-Visits1.0160.9850.950111314
Vojvodina-Low-Frequent-Visits1.0281.0281.028974
Vojvodina-High-Frequent-Visits1.0020.9850.985121211
Table A9. PCA-DEA score: DMU D-options.
Score Rank
DMUScore-D1
(6I-4O)
Score-D2
(4I-4O)
Score-D3
(2I-4O)
Rank-D1
(6I-4O)
RankD2
(4I-4O)
Rank-D3
(2I-4O)
Huesca-short-Duration-Visits1.0481.0421.042864
Huesca-Long-Duration-Visits1.0701.0340.9686713
Basilicata-short-Duration-Visits0.9910.9910.991141311
Basilicata-Long-Duration-Visits1.0691.0691.030755
Sibiu-short-Duration-Visits1.0711.0041.00151210
Sibiu-Long-Duration-Visits1.0871.0751.008338
Larnaca-short-Duration-Visits1.0040.9720.967121414
Larnaca-Long-Duration-Visits1.0221.0220.980111012
Karlsborg-short-Duration-Visits1.0781.0751.073443
Karlsborg-Long-Duration-Visits1.0311.0311.021987
Mark-short-Duration-Visits1.3341.3341.230111
Mark-Long-Duration-Visits1.2111.1961.196222
Vojvodina-short-Duration-Visits1.0041.0041.00313119
Vojvodina-Long-Duration-Visits1.0241.0241.0241096

References

  1. Liu, J.; Nijkamp, P.; Lin, D. Urban-rural Imbalance and Tourism-Led Growth in China. Ann. Tour. Res. 2017, 64, 24–36. [Google Scholar] [CrossRef]
  2. Zou, W.; Wei, W.; Ding, S.; Xue, J. The relationship between place attachment and tourist loyalty: A meta-analysis. Tour. Manag. Perspect. 2022, 43, 100983. [Google Scholar] [CrossRef]
  3. Isard, W.; Schooler, E.W. Industrial Complex Analysis, Agglomeration Economies and Regional Development. J. Reg. Sci. 1959, 1, 19–33. [Google Scholar] [CrossRef]
  4. Nijkamp, P. Planning of Industrial Complexes by Means of Geometric Programming; Rotterdam University Press: Rotterdam, The Netherlands, 1972. [Google Scholar]
  5. Porter, M.E. The Competitive Advantage of Nations; Free Press: New York, NY, USA, 1990. [Google Scholar]
  6. Karlsson, C.; Johansson, B.; Stough, R.R. Studies in Regional Economic Development; Edward Elgar Publishing: Cheltenham, UK, 2014. [Google Scholar]
  7. Fusco Girard, L.; Forte, F. Città Sostenibile e Sviluppo Umano; Franco Angeli: Milano, Italy, 2000. [Google Scholar]
  8. Fusco Girard, L.; Gravagnuolo, A. Circular Economy and Cultural Heritage Landscape Regeneration, Circular Business, Financing and Governance Models for a Competitive Europe. BDC Boll. Cent. Calza Bini 2017, 1, 35–52. [Google Scholar]
  9. Batabyal, A.A.; Nijkamp, P. (Eds.) The Creative Class Revisited; World Scientific: Singapore, 2023. [Google Scholar]
  10. Smith, M.; Richards, G. The Routledge Handbook of Cultural Tourism; Taylor & Francis: London, UK, 2013. [Google Scholar] [CrossRef]
  11. Fischer, L.B.; Newig, J. Importance of Actors and Agency in Sustainability Transitions: A Systematic Exploration of the Literature. Sustainability 2016, 8, 476. [Google Scholar] [CrossRef]
  12. Guzman, P.C. World Heritage Cities and Sustainable Urban Development: Bridging Global and Local Levels in Monitoring the Sustainable Urban Development of World Heritage Cities. Ph.D. Thesis, Eindhoven University of Technology, Eindhoven, The Netherlands, 2017. [Google Scholar]
  13. Nocca, F. The Role of Cultural Heritage in Sustainable Development: Multidimensional Indicators as Decision-Making Tool. Sustainability 2017, 9, 1882. [Google Scholar] [CrossRef]
  14. Corona, B.; Shen, L.; Reike, D.; Rosales Carreón, J.; Worrel, E. Towards Sustainable Development through the Circular Economy—A Review and Critical Assessment on Current Circularity Metrics. Resour. Conserv. Recycl. 2019, 151, 104498. [Google Scholar] [CrossRef]
  15. Dredge, D.; Phi, G.T.L.; Mahadevan, R.; Meehan, E.; Popescu, E. Digitalisation in Tourism. In-Depth Analysis of Challenges and Opportunities; Executive Agency for Small and Medium-Sized Enterprises (EASME), European Commission: Brussels, Belgium, 2019; Available online: https://ec.europa.eu/docsroom/documents/33163/attachments/1/translations/en/renditions/native (accessed on 30 March 2025).
  16. Bosone, M.; Nocca, F.; Fusco Girard, L. The Circular City Implementation: Cultural Heritage and Digital Technology. In Culture and Computing. Interactive Cultural Heritage and Arts; Rauterberg, M., Ed.; Springer: Berlin, Germany, 2021. [Google Scholar]
  17. Geissdoerfer, M.; Savaget, P.; Bocken, N.M.P.; Hubink, E.J. The Circular Economy—A New Sustainability Paradigm? J. Clean. Prod. 2017, 143, 757–768. [Google Scholar] [CrossRef]
  18. Foster, G. Circular Economy Strategies for Adaptive Reuse of Cultural Heritage Buildings to Reduce Environmental Impacts. Resour. Conserv. Recycl. 2020, 152, 104507. [Google Scholar] [CrossRef]
  19. Valencia, M.; Bocken, N.; Loaiza, C.; De Jaeger, S. The Social Contribution of the Circular Economy. J. Clean. Prod. 2023, 408, 137082. [Google Scholar] [CrossRef]
  20. Howard, P.; Thompson, I.; Waterton, E. (Eds.) The Routledge Companion to Landscape Studies; Routledge: London, UK, 2022. [Google Scholar]
  21. van den Bergh, J.C.J.M. Human Evolution Beyond Biology and Culture; Cambridge University Press: Cambridge, UK, 2018. [Google Scholar]
  22. Gravagnuolo, A.; Fusco Girard, L.; Ost, C.; Saleh, R. Evaluation Criteria for a Circular Adaptive Reuse of Cultural Heritage. BDC Boll. Cent. Calza Bini 2017, 17, 185–216. [Google Scholar]
  23. Ramkissoon, H. Perceived Social Impacts of Tourism and Quality-of-Life: A new Conceptual Model. J. Sustain. Tour. 2020, 31, 442–459. [Google Scholar] [CrossRef]
  24. Fusco Girard, L.; Kourtit, K.; Nijkamp, P. (Eds.) The Future of Liveable Cities; Springer: Berlin, Germany, 2024. [Google Scholar]
  25. Cole, S. The Regional Science of Tourism: An Overview. J. Reg. Anal. Policy 2007, 37, 183–192. [Google Scholar] [CrossRef]
  26. Sheldon, P.J.; Daniele, R. Social Entrepreneurship and Tourism: Philosophy and Practice. In Social Entrepreneurship and Tourism; Sheldon, P.J., Daniele, R., Eds.; Springer: Berlin/Heidelberg, Germany, 2016. [Google Scholar] [CrossRef]
  27. Murray, A.; Skene, K.; Haynes, K. The Circular Economy: An Interdisciplinary Exploration of the Concept and Application in Global Context. J. Bus. Ethics 2017, 140, 369–380. [Google Scholar] [CrossRef]
  28. Marin, J.; De Meulder, B. Interpreting Circularity. Circular City Representations Concealing Transition Drivers. Sustainability 2018, 10, 1310. [Google Scholar] [CrossRef]
  29. Sheldon, P.J. Tourism Resilience and Recovery: A Global Movement; CABI, Wallingford: Oxfordshire, UK, 2022. [Google Scholar]
  30. Cultural Heritage Counts for Europe. 2015. Available online: http://blogs.encatc.org/culturalheritagecountsforeurope/wp-content/uploads/2015/06/CHCfE_FULL-REPORT_v2.pdf (accessed on 30 March 2025).
  31. Kourtit, K.; Nijkamp, P. Cultural-Ecological Complexes in the Netherlands: An Evidence-Based and Model-Oriented Study. J. Cult. Herit. 2022, 54, 248–262. [Google Scholar] [CrossRef]
  32. Prahalad, C.K.; Ramaswamy, V. Co-Creating Unique Value with Customers. Strategy Leadersh. 2004, 32, 4–9. [Google Scholar] [CrossRef]
  33. Vargo, S.L.; Lusch, R.F. Evolving to a New Dominant Logic. J. Mark. 2004, 68, 1–17. [Google Scholar] [CrossRef]
  34. Minkiewicz, J.; Evans, J.; Bridson, K. How do Consumers Co-create their Experiences? An Exploration in the Heritage Sector. J. Mark. Manag. 2014, 30, 30–59. [Google Scholar] [CrossRef]
  35. Suntikul, W.; Jachna, T. The Co-Creation/Place Attachment Nexus. Tour. Manag. 2016, 52, 276–286. [Google Scholar] [CrossRef]
  36. Chen, C.F.; Leask, A.; Phou, S. Symbolic, Experiential and Functional Consumptions of Heritage Tourism Destinations: The Case of Angkor World Heritage Site, Cambodia. Int. J. Tour. Res. 2016, 18, 602–611. [Google Scholar] [CrossRef]
  37. Buonincontri, P.; Marasco, A.; Ramkissoon, H. Visitors’ Experience, Place Attachment and Sustainable Behaviour at Cultural Heritage Sites: A Conceptual Framework. Sustainability 2017, 9, 1112. [Google Scholar] [CrossRef]
  38. Charnes, A.; Cooper, W.W.; Golany, B.; Seiford, L.M.; Stutz, J. Foundation of Data Envelopment Analysis for Pareto-Kopmans Efficient Empirical Production Functions. J. Econom. 1985, 30, 91–107. [Google Scholar] [CrossRef]
  39. Cooper, W.W.; Tone, K.; Seiford, L.M. Introduction to Data Envelopment Analysis and Its Uses; Springer Science, Business Media: New York, NY, USA, 2006. [Google Scholar]
  40. Seiford, L. A Cyber-Bibliography for Data Envelopment Analysis; Springer Science Business Media: New York, NY, USA, 2005. [Google Scholar]
  41. Thanassoulis, E.; Dyson, R.G. Estimating Preferred Target Input-Output Levels Using Data Envelopment Analysis. Eur. J. Oper. Res. 1992, 56, 80–97. [Google Scholar] [CrossRef]
  42. Golany, B. An Interactive MOLP Procedure for the Extension of DEA to Effectiveness Analysis. J. Oper. Res. Soc. 1988, 39, 725–734. [Google Scholar] [CrossRef]
  43. Joro, T.; Korhonen, P.; Wallenius, J. Structural Comparison of Data Envelopment Analysis and Multiple Objective Linear Programming. Manag. Sci. 1998, 44, 962–970. [Google Scholar] [CrossRef]
  44. Halme, M.; Joro, T.; Korhonen, P.; Salo, S.; Wallenius, J. A Value Efficiency Approach to Incorporating Preference Information in Data Envelopment Analysis. Manag. Sci. 1999, 45, 103–115. [Google Scholar] [CrossRef]
  45. Korhonen, J.; Soismaa, M.; Siljamäki, A. On the Use of Value Efficiency Analysis and Some Further Developments. J. Product. Anal. 2002, 17, 49–64. [Google Scholar] [CrossRef]
  46. Korhonen, P.; Stenfors, S.; Syrjänen, M. Multiple objective approach as an alternative to radial projection in DEA. J. Product. Anal. 2003, 20, 305–321. [Google Scholar] [CrossRef]
  47. Lins, M.P.E.; Angulo-Meza, L.; Moreira da Silva, A.C. A Multi-objective Approach to Determine Alternative Targets in Data Envelopment Analysis. J. Oper. Res. 2004, 55, 1090–1101. [Google Scholar] [CrossRef]
  48. Suzuki, S.; Nijkamp, P. Preference Elicitation in Generalized Data Envelopment Analysis: In Search of a New Energy Balance in Japan. In Socioeconomic Environmental Policies and Evaluations in Regional Science; New Frontiers in Regional Science: Asian Perspectives; Shibusawa, H., Sakurai, K., Mizunoya, T., Uchida, S., Eds.; Springer: Singapore, 2016; Volume 24, pp. 601–618. [Google Scholar]
  49. Kourtit, K.; Nijkamp, P.; Suzuki, S. The Rat Race between World Cities. Comput. Environ. Urban Syst. 2013, 38, 67–77. [Google Scholar] [CrossRef]
  50. Valeria Avilés-Sacoto, S.; Cook, W.D.; Güemes-Castorena, D.; Zhu, J. Modelling Efficiency in Regional Innovation Systems: A Two-Stage Data Envelopment Analysis Problem with Shared Outputs within Groups of Decision-Making Units. Eur. J. Oper. Res. 2020, 287, 572–582. [Google Scholar] [CrossRef]
  51. Dyson, R.G.; Allen, R.; Camanho, A.S.; Podinovski, V.V.; Sarrico, C.S.; Shale, E.A. Pitfalls and Protocols in DEA. Eur. J. Oper. Res. 2001, 132, 245–259. [Google Scholar] [CrossRef]
  52. Kourtit, K. City Intelligence for Enhancing Urban Performance Value: A Conceptual Study on Data Decomposition in Smart Cities. Asia-Pac. J. Reg. Sci. 2021, 5, 191–222. [Google Scholar] [CrossRef]
  53. Arribas-Bel, D.; Kourtit, K.; Nijkamp, P. The Socio-Cultural Sources of Urban Buzz. Environ. Plan. C 2016, 34, 188–204. [Google Scholar] [CrossRef]
  54. Nandasena, R.; Morrison, A.; Cai, W.; Coca-Stefaniak, J.A. Transformational Tourism: A Visionary Approach to Sustainable Tourism? In Handbook on Trends and Issues in Global Tourism; Morrison, A., Buhalis, D., Eds.; Routledge: London, UK, 2023. [Google Scholar]
  55. Andersen, P.; Petersen, N.C. A Procedure for Ranking Efficient Units in Data Envelopment Analysis. Manag. Sci. 1993, 39, 1179–1297. [Google Scholar] [CrossRef]
Figure 1. Sustainable development and the four butterfly components. Source: [32].
Sustainability 17 05871 g001
Figure 2. Methodological framework for CEC performance assessment.
Sustainability 17 05871 g002
Figure 3. Multidimensional X-factor assessment model of sustainable and circular cultural tourism in seven pilot regions. Source: Author’s own elaboration.
Sustainability 17 05871 g003
Figure 4. First-round super-efficiency results: Frequency of Visits (Step 3).
Sustainability 17 05871 g004
Figure 5. First-round super-efficiency results: Duration of Visits (Step 3).
Sustainability 17 05871 g005
Figure 6. Second-round DEA sensitivity results on Frequency of Visits.
Sustainability 17 05871 g006
Figure 7. Second-round DEA sensitivity results on Duration of Visits.
Sustainability 17 05871 g007
Table 1. Multiple Regression Analysis results for determinants of tourism efficiency.
VariableStandard OLS
Estimate (s.e.)
p-Value
Constant1.039 (0.957)0.278
IC10.025 (0.068)0.716
MDF21.074 * (0.480)0.026
SN3−0.235 (0.269)0.382
TE41.333 *** (0.054)<0.001
SD50.134 ** (0.052)0.010
QS60.185 *** (0.047)<0.001
Adjusted R2 = 0.610
Notes: *** ≤0.001, ** ≤0.01, * ≤0.05. VIF values were calculated for each variable and found to be below problematic thresholds, indicating no significant multicollinearity issues.
Table 2. Multiple Regression Analysis results for key efficiency determinants.
VariableStandard OLS
Estimate (s.e.)
p-Value
Constant0.735 (0.872)0.400
TE41.343 *** (0.052)<0.001
QS60.181 *** (0.047)<0.001
SD50.130 ** (0.051)0.012
MDF21.053 * (0.475)0.027
Adjusted R2 = 0.609
Notes: *** p ≤ 0.001, ** p ≤ 0.01, * p ≤ 0.05. VIF values were calculated for each variable and found to be below problematic thresholds, indicating no significant multicollinearity issues.
Disclaimer/Publisher’s Note: The statements, opinions and data contained in all publications are solely those of the individual author(s) and contributor(s) and not of MDPI and/or the editor(s). MDPI and/or the editor(s) disclaim responsibility for any injury to people or property resulting from any ideas, methods, instructions or products referred to in the content.

