Article

Comparative Assessment of Gasifier Cookstove Performance on Smallholder Farms in Three Regions in Kenya

1
Center for International Forestry Research and World Agroforestry (CIFOR-ICRAF), Nairobi P.O. Box 30677-00100, Kenya
2
Department of Energy and Technology, The Swedish University of Agricultural Sciences, 750 07 Uppsala, Sweden
3
Office of International Programs, College of Agricultural Sciences, The Pennsylvania State University, 106 Agricultural Administration Building, University Park, PA 16802, USA
4
Wangari Maathai Institute for Peace and Environmental Studies, University of Nairobi, Nairobi P.O. Box 2905-0065, Kenya
*
Author to whom correspondence should be addressed.
Sustainability 2025, 17(13), 5872; https://doi.org/10.3390/su17135872
Submission received: 9 April 2025 / Revised: 3 June 2025 / Accepted: 23 June 2025 / Published: 26 June 2025
(This article belongs to the Section Energy Sustainability)

Abstract

A majority of households in sub-Saharan Africa use inefficient biomass stoves in poorly ventilated kitchens, leading to indoor air pollution. Biomass for cooking can be sustainably sourced from agricultural residues such as prunings from agroforestry. This study assessed biochar-producing gasifier cookstove performance among 150 households in Embu, Kwale, and Siaya Counties through household surveys and participatory cooking tests with 75 households. With the gasifier, carbon monoxide (CO) concentrations were lower in Embu (5.1 ppm), while carbon dioxide (CO2) and fine particulate matter (PM2.5) were lower in Kwale, at 588 ppm and 136 μg/m3, respectively. Compared to the three-stone open fire, reductions in CO and PM2.5 concentrations were highest in Embu, at 82% and 97%, respectively. The biomass-to-char conversion efficiency with the gasifier was 17–18%. If households consider the produced char as a soil amendment, they could save 24–43% of fuel compared to the three-stone open fire; if the char is seen as fuel, the potential savings are 42–65%. Significant differences between the three sites were observed with the gasifier for gross and net fuel use, and for concentrations of PM2.5 and CO2. Gasifier uptake can reduce the need for fuel collection and indoor air pollution, with a positive impact on both the environment and human wellbeing.

1. Introduction

For the sustenance of people’s lives, energy plays a key role by providing cooked food, boiled water, and warmth at the most basic level [1]. It is estimated that about 2.4 billion people worldwide rely on solid fuels to meet their cooking needs [2]. Wood fuel is preferred for its affordability, availability, and convenience [3]. Cooking with inefficient cookstoves in kitchens with poor ventilation results in high concentrations of indoor air pollutants [4]. According to WHO, a range of health conditions are associated with household air pollution, which causes an estimated 3.2 million premature deaths globally every year [2]. When inefficiently burned, wood is converted into particulate matter, carbon monoxide, free radicals, and other pollutants, which result in indoor air pollution. These pollutants end up in the environment and contribute to outdoor air pollution [5]. It is estimated that the production and use of firewood and charcoal contributes 2–7% of the global anthropogenic emissions of greenhouse gases (GHG) [3]. In Kenya, about 75% of households use wood fuel; it is the primary energy source for 93% of rural households [6]. With 40% of global agricultural lands having over 10% tree cover [7], there is a huge potential for households to meet their firewood demand from these trees. For instance, in Murang’a County, over 90% of households source their firewood from multipurpose trees on their farms [8].
Household air pollution from inefficient cooking is a major contributor to the burden of disease in western Kenya [9]. To improve fuel efficiency and reduce indoor air pollution in Kenya, various technologies are being introduced. The uptake of improved technologies in sub-Saharan Africa has remained low despite the region relying mostly on biomass fuel [10]. This could be attributed to the diverse social, economic, and cultural factors that influence the adoption of technologies [10,11].
Reaching the Sustainable Development Goal 7 target for universal access to clean cooking by 2030 is a tremendous challenge and is not on track [2]. Therefore, this calls for an exploration of innovative and sustainable ways of producing and utilizing household cooking energy. The integration of users’ needs and preferences during product design could lead to the increased adoption of developed cooking energy technologies [12,13,14,15]. Improved and efficient stoves reduce the amount of biomass burned, consequently lowering carbon dioxide emissions; when sufficiently advanced, stoves also cut emissions of black carbon [16]. Gasifier cookstoves generate heat from the burning of gases produced through the gasification of dry biomass. The heat is used for cooking by rural households in developing countries, while the biomass is converted to char, a by-product [17]. The char should be harvested before it burns to ash.
Interest in biochar is growing rapidly due to its potential as a climate change solution [18] and its ability to improve the fertility of tropical soils [19] and crop yields [20]. Gasifier cookstoves are a resource-efficient way of producing biochar, as the heat released is used productively. The use of gasifiers has been reported to reduce fuel use and concentrations of indoor air pollutants compared to the three-stone open fire [21]. However, these previous studies lacked regional representation, and thus failed to capture variations that could arise from differences in the fuels used, the foods cooked, and the behavior of individual users.
This paper aims to assess variations in pollutant concentrations in cooking areas, energy use efficiency, and char production rates when gasifier cookstoves are used to prepare dinner under real conditions in three regions in rural Kenya. The objectives are as follows: (i) to describe the adoption of gasifier cookstoves three months after they were issued; (ii) to present the performance of the gasifier cookstoves in terms of fuel use efficiency and concentrations of indoor air pollutants; and (iii) to compare the gasifier performance in three agro-ecological regions in Kenya. The results were gathered from household surveys and participatory cooking tests with the households issued with the gasifiers.

2. Materials and Methods

2.1. Research Design

This paper compares the performance of the biochar-producing Top-Lit Updraft (TLUD) gasifier cookstove, branded as “GASTOV”, produced by the Kenya Industrial Research and Development Institute (KIRDI, Nairobi, Kenya) in three counties in Kenya: Embu, Kwale, and Siaya. Household surveys were carried out with 50 household units at each of the sites. Participatory cooking tests were conducted to measure concentrations of gases and particulates, fuel use efficiency, and char production with 25 randomly selected households at each of the sites. Of these, 5 were randomly selected for comparison of the gasifier with the three-stone open fire. The 25 households were selected to participate in the test to assess variations among these households that could be caused by differences in: the species of firewood used; users’ behavior (including firewood drying and loading); and ventilation of the cooking space, which influences the build-up of indoor air pollutants. The findings from Kwale have already been reported in a study by Gitau et al. [22].

2.2. Study Area

The counties in which the study was carried out include: Embu County in the highlands of the central part of Kenya, located about 120 km north east of Nairobi and on the southeastern side of Mt Kenya, with an elevation of 1350 m above sea level; Kwale County, located at 4.18° South, 39.45° East, 323 m above sea level and 33 km south of Mombasa [23]; and Siaya County in the mid-lowlands, located in western Kenya, about 74 km northwest of Kisumu at an elevation of 1224 m. The three sites, Embu, Siaya and Kwale, were selected to represent three agro-ecological zones in the country, namely, highlands, lowlands, and coastal regions, respectively.
Commercial crops grown in Embu include tea (Camellia sinensis), coffee (Coffea), and macadamia nuts (Macadamia integrifolia). Most households also intercrop Grevillea robusta with coffee and tea to provide shade, in addition to supplying households with firewood and timber. The main crops grown in Kwale include cassava (Manihot esculenta), cowpeas (Vigna unguiculata), and maize (Zea mays), as well as fruit trees such as mango (Mangifera indica), citrus (Citrus spp.), cashew nut (Anacardium occidentale), coconut (Cocos nucifera), avocado (Persea americana), and guava (Psidium guajava), either for subsistence or commercial purposes [24]. Non-fruit trees are also grown on farms for construction materials, with the prunings and off-cuts used as cooking fuel. In Siaya, maize and groundnuts (Arachis hypogaea) are the major crops grown. Markhamia (Markhamia lutea) and Eucalyptus (Eucalyptus spp.) trees are grown for wood and the prunings are used as firewood. Fruit trees grown in the area include avocado, mangoes, and guava.

2.3. Selection of Households and Development of Cooking Schedule

Thirty households were randomly selected at each site from the 50 households with the gasifier, giving priority to the first 25 to participate in the cooking test; the remaining five were reserved as replacements. In Siaya and Embu, the selected 25 agreed to participate; in Kwale, five were replacements. Seven households with unmodified three-stone open fires willing to participate in both tests were selected from the 25, giving priority to the first five, with two kept as reserves. All the selected five households at each site agreed to participate. Selected households were allowed to pick the most suitable dates within the 30-day test period for each site. For the households cooking with gasifiers and three-stone open fires, the tests were performed in the same week to reduce variations in the conditions under which the tests were conducted.

2.4. Cookstoves

A TLUD gasifier cookstove (KIRDI, Nairobi, Kenya) was used in this study (Figure 1). The three-stone open fire was used for comparison.

2.5. Cooking Test

The participatory tests involved households cooking meals of their choice for dinner under normal conditions to allow for the measurement of concentrations of pollutants in the cooking area and the amounts of fuel used. At each site, five households repeated the test with the three-stone open fire, cooking the same type and amount of food with the same type of fuel in both stoves in the same kitchen, but on different days. Being a portable stove, the gasifier was lit outside by placing the loaded canister on top of pieces of stones to prevent the blocking of holes at the base and ensure that airflow is not interfered with. Kindling, matches, and paper were used to light the gasifier from the top. When firewood in the canister caught on fire, the canister was returned to the outer casing of the gasifier inside the kitchen and the upper parts were fixed back. When the firewood turned into char, it was harvested and cooled (see more description in Figure 1 above). The three-stone open fire was lit indoors; after cooking, the unburned firewood was withdrawn, quenched, weighed, and recorded.
The ingredients used to cook the meals and the cooked food were weighed on a top-loading kitchen scale. The cooking test period was between December 2017 to July 2018, between December 2017–January 2018 in Embu, April–May 2018 in Kwale; and June–July 2018 in Siaya. Cooking times varied among the households, ranging from 4:07 p.m. to 8:20 p.m.

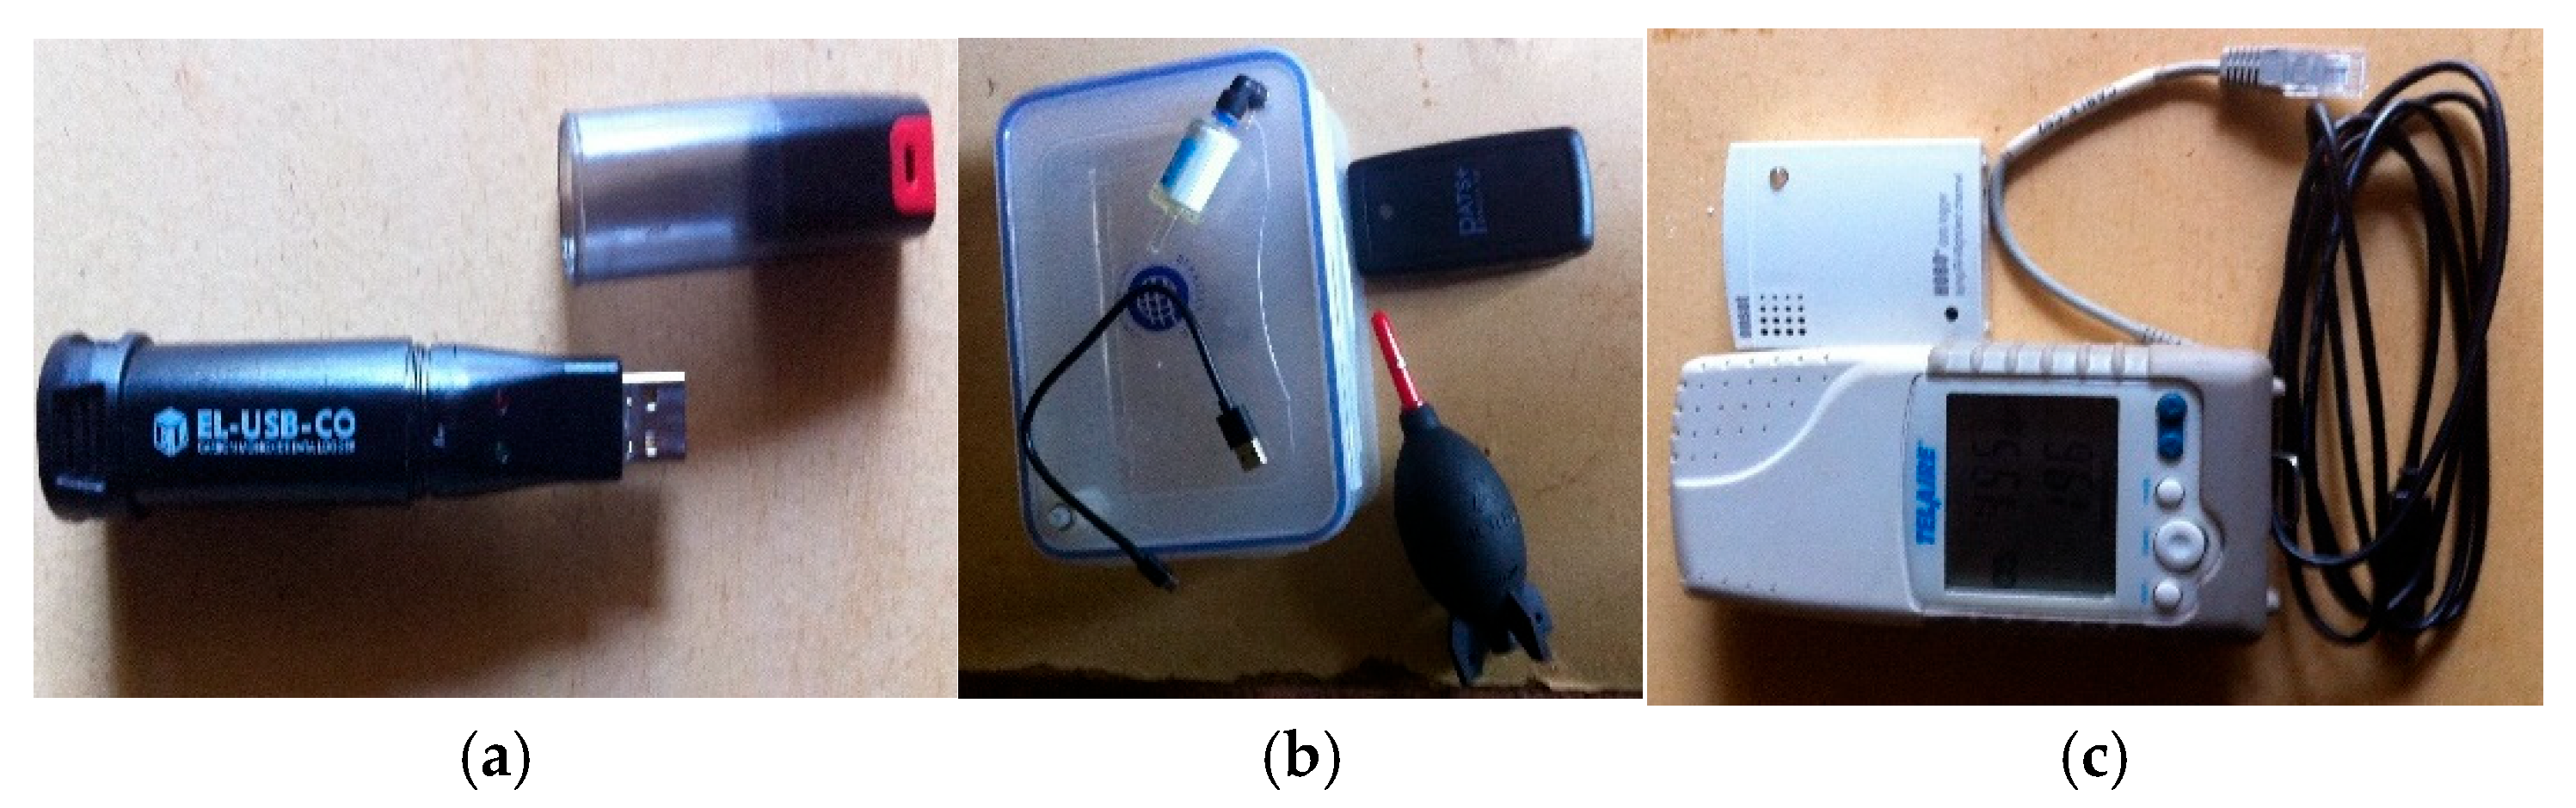
2.6. Measurement of Gases and Particulate Concentrations

Before the start of the test, no stove was lit in the kitchen for over 3 h. The recording of CO concentrations was set at every 10 s using the EL-USB-CO Data Logger (DATAQ Instruments, 603-746-5524) by Lascar Electronics, (Whiteparish, Wiltshire, UK) (Figure 2a); PM2.5 was recorded with a PATS+ PM meter by Berkeley Air Monitoring Group, (Berkeley, CA, USA) at intervals of 1 min (Figure 2b) and the Telaire T7001 Carbon Dioxide and Temperature Monitor by Tempcon Instrumentation, (West Sussex, UK), recorded CO2 concentration once per min (Figure 2c).
The pieces of equipment (Figure 2a–c) were hung at 1.5 m above and 1 m to the side of the cookstove in the cooking area, to simulate the cook’s position when cooking (Figure 3a,b). To capture the concentrations in the cooking area when no stove was lit, equipment was hung at least 50 min before the start of each test. The recording continued for an additional 50 min after the cooking to record the period required for the cooking area to clear.
The PM2.5, CO and CO2 data were downloaded using PICA, EasyLog ESB, Ver. 7.2.0.0 and HOBO software Version 3.7.13, respectively. The time period during which the concentrations were considered was from when the stove was well-lit and moved into the kitchen until the end of charring for the gasifier, and from when the fuel was well-lit until when the fire was put out after food was ready, for the three-stone open fire.
The recorded concentrations were compared with set guidelines. PM2.5 was compared with World Health Organization (WHO) air-quality guidelines for 24 h, which should not exceed 25 μg/m3 (not to be exceeded for more than 3 days per year) [25]. Exposure to CO should be below 30 ppm (equivalent to 35 mg/m3 using a conversion factor of 1 mg/m3 = 0.873 ppm at 25 °C) [26]. CO2 was compared to the set permissible exposure limit (PEL) by the Occupational Safety and Health Administration, which is an average of 5000 ppm over an 8 h workday [27].

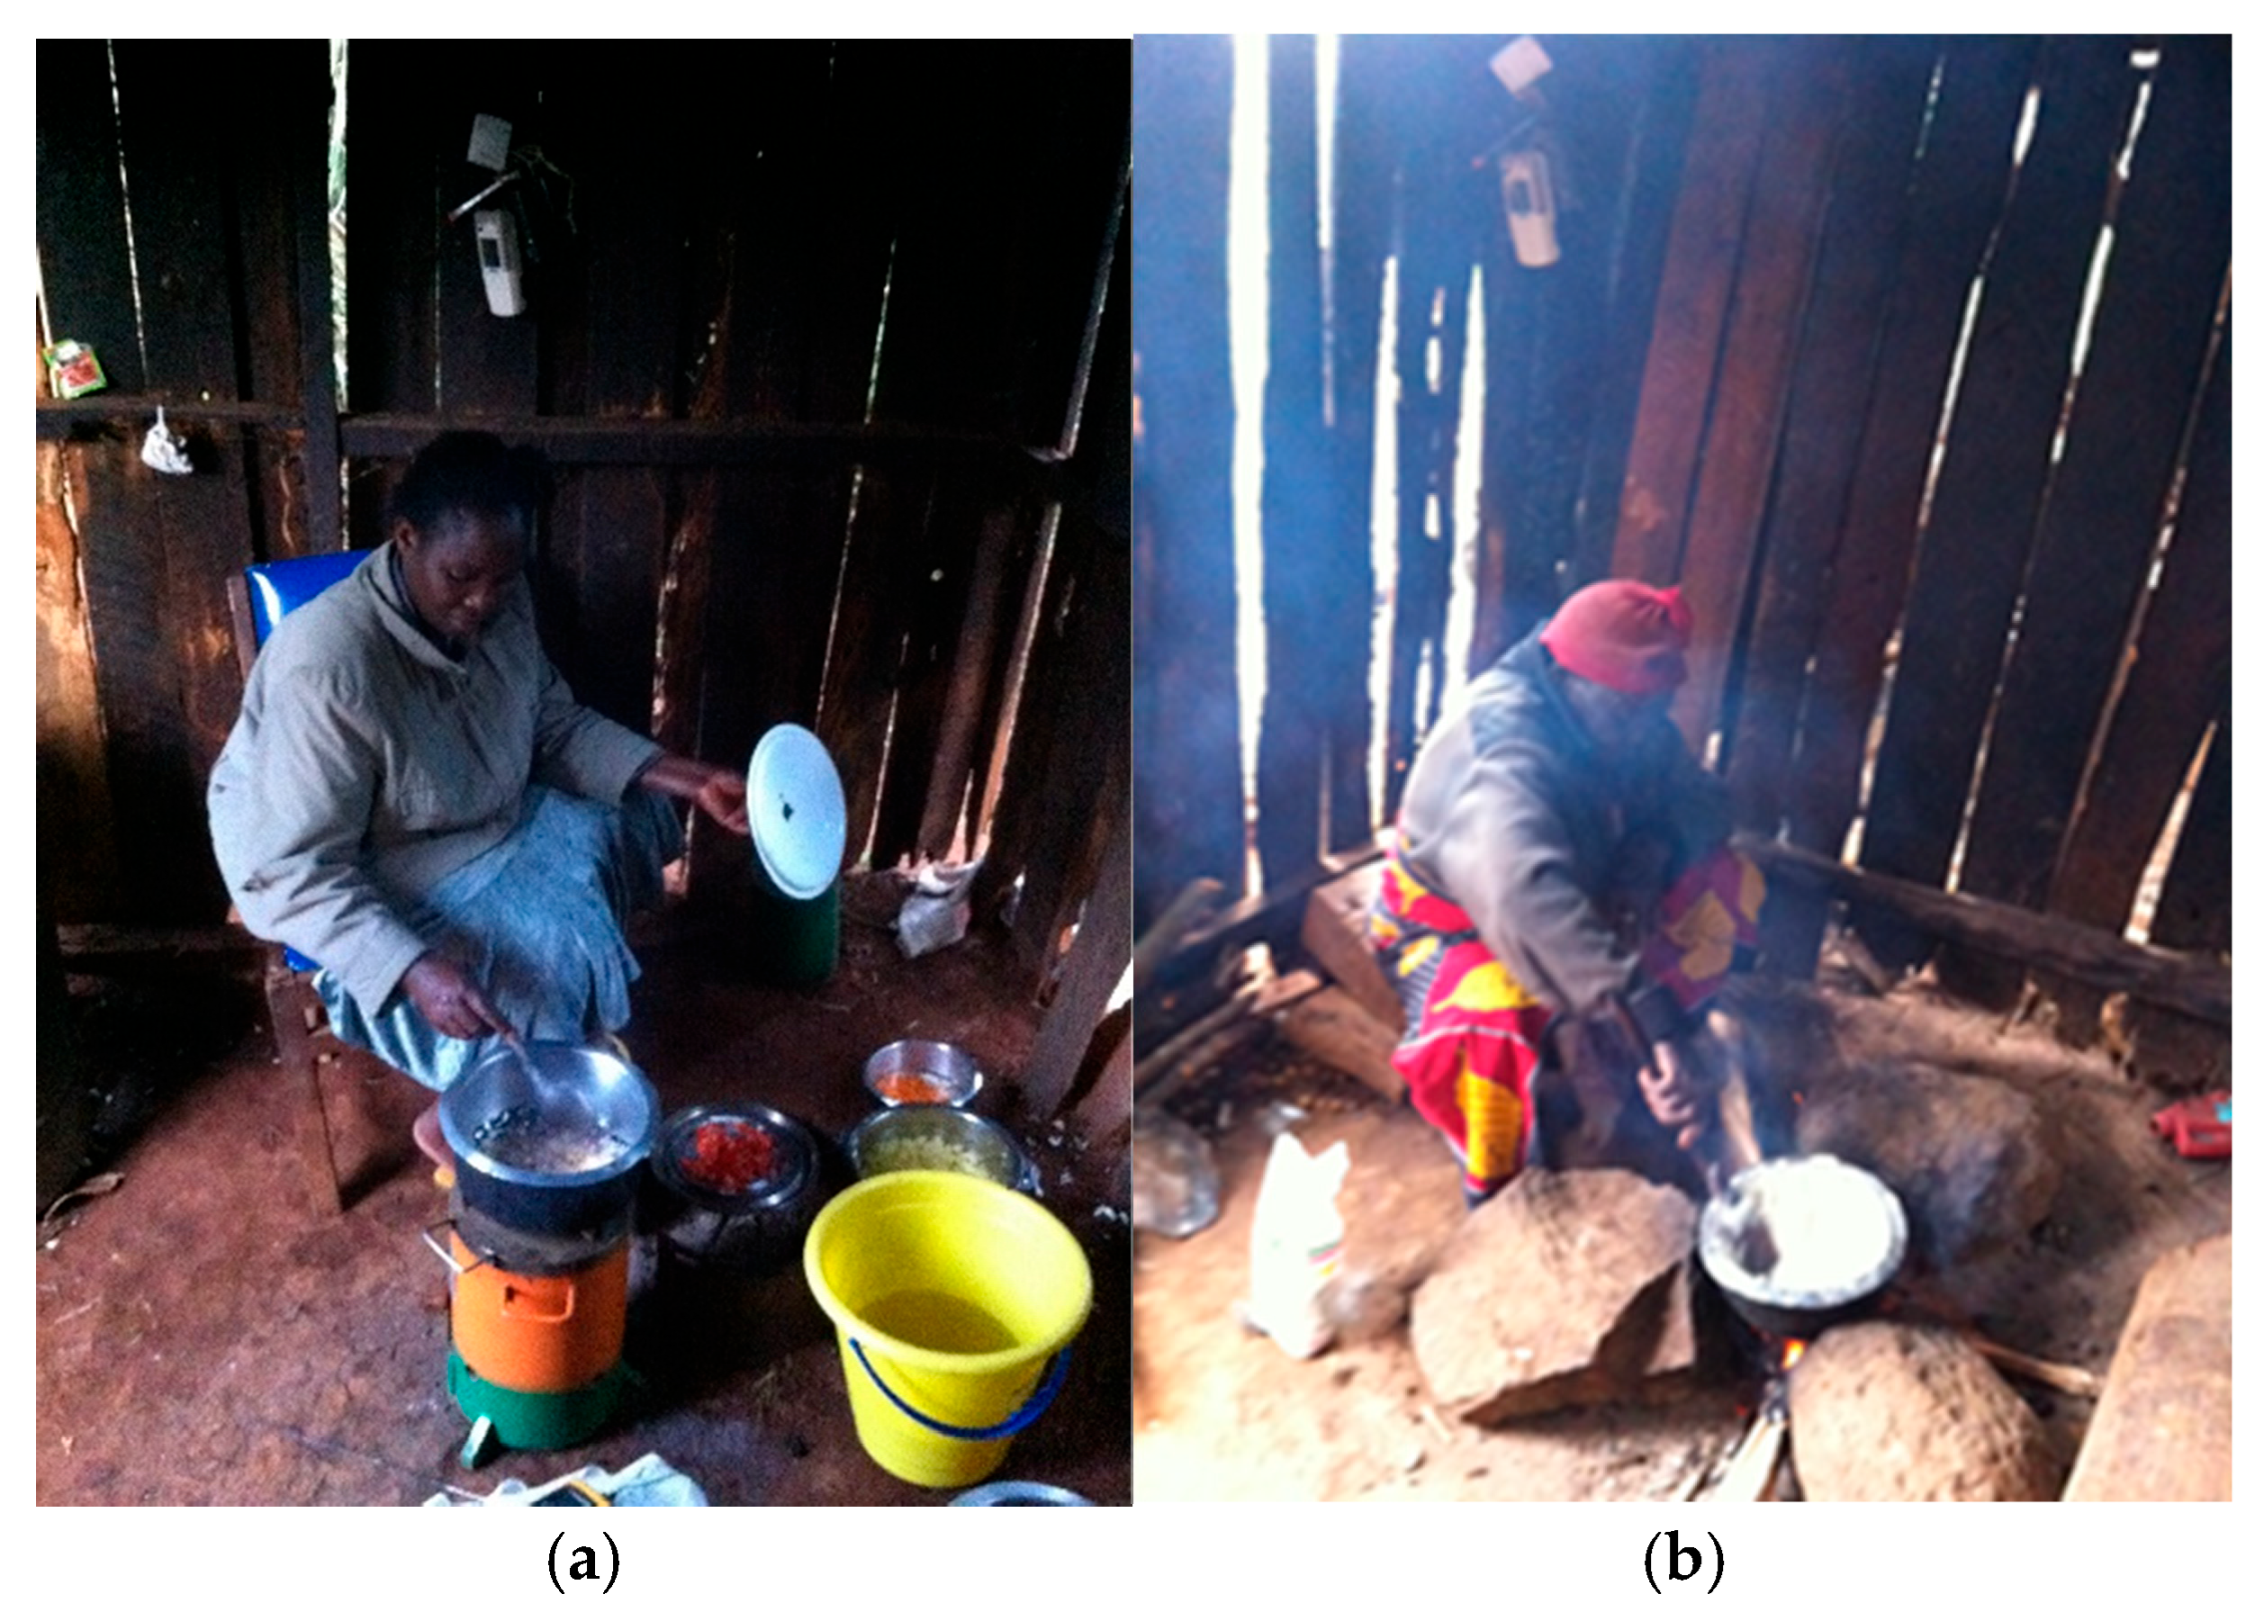
2.7. Description of the Kitchen/Cooking Area

Cooking area ventilation features were measured and recorded. The position of the cooking area relative to the main building was also noted. The state of doors and windows in the cooking areas was also recorded without any interference. For the cooking areas with doors and windows, their states, i.e., whether opened or closed while cooking, as decided by the cook, were recorded.

2.8. Combustion Properties

The suitability of the fuels used to cook and produce char was assessed through analyses of collected samples for ash content, moisture content, calorific value (lower heating value, LHV), fixed carbon, and volatile matter at Belab in Sweden. A bomb calorimeter was used to analyze the calorific value reported as dry matter in MJ/kg, using the SS-EN14918:2010 norm [28]. Volatile matter was determined through the incineration of oven-dried samples in a muffle furnace at 900 °C for 7 min using the SS-EN ISO 18122:2015 norm [29]. Samples were cooled and weighed; volatile matter was considered as the sample percentage weight loss. Moisture content, which is the original sample percent weight loss, was determined by oven-drying a 5 g sample for 12 h at 103 °C using the SS-EN ISO 18134-3:2015 norm [30]. Ash content was determined by returning the cooled, incinerated sample to the muffle furnace for 15 h at 900 °C and was reported as the percentage of the original sample’s weight using the SS-EN ISO 18122:2015 norm [29]. Fixed carbon (percent as received) was calculated by subtracting the sum of the wet sample moisture content, ash content, and volatile matter from 100%. Fixed carbon (% total solids) was determined by subtracting the sum of the dry sample, ash content and volatile matter from 100%. In this paper, only the combustion properties from the two most commonly used fuels at each site, and the char they produced, are reported.

2.9. Fuel Consumption

The amount of fuel used to cook with the gasifier is reported as the gross or net weight of the fuel used. The net fuel consumption of the gasifier (Fnet,TLUD, kg) was calculated as follows:
F n e t , T L U D = m f w m c h L H V c h L H V f w
where mfw is the mass of fuel wood loaded into the canister in kg, mch to the mass of char produced in kg and LHVch and LHVfw correspond to the lower heating value of charcoal and firewood, respectively, in MJ/kg. For the fuel and char types that were not analyzed in the laboratory, a default average LHV was estimated from the average LHV of the two main fuels used in Kwale and the five fuel sample types analyzed in Embu and Siaya.
Gross fuel is the amount of fuel used, including the harvested char. The amount of fuel loaded into the canister and the resultant char were weighed and recorded. After firewood was prepared, a pile was weighed and put in one place; all the fuel used to cook with the three-stone open fire was selected there. Firewood withdrawn from the three-stone open fire after the food was cooked and the remains in the pre-weighed initial pile, were weighed and recorded. The percentage of fuel savings was calculated by subtracting the net fuel used with the gasifier from the fuel used with three-stone open fire and multiplying this by 100. Samples of the fuels used in, and char produced from, the gasifier were collected and stored in khaki papers for laboratory analysis.

2.10. Time Spent in Cooking

The cooking process time, which included the time taken to light the stove (i.e., time it took for fuel to be well-lit plus the time to move the canister back into the outer casing in the cooking area for the gasifier), the time when cooking started and ended, the time when fuel charred, and the time spent in the reloading of fuel where it was required, was recorded. The results were used to calculate the total cooking process time and total time spent to cook food.

2.11. Limitations of the Study

The limitations of this study were that at each site, only 5 households participated in the comparison test of the gasifier and three-stone open fire out of the 25 participants. Another limitation is that the cooking tests were only conducted when the households were cooking their dinner, therefore, the daily average could have been missed in cases where there were variations in emissions when cooking lunch. Lastly, only one test was conducted per household; therefore, any inter-day variability was not captured in this study.

2.12. Data Management and Analysis

Data were analyzed using Microsoft excel 2013 software for descriptive statistics such as the means of various variables. Standard error was included to show the variances among the samples. The t-test, paired two sample for means (one-tailed), was used to test for significant differences between the mean values for fuel used, time spent, flame temperature, and concentrations of gases and particulates within the sites with the use of both stoves. The Kruskal–Wallis H test was used to test for significant differences in pollutant concentrations and fuel use between the sites. The significance level was set at p < 0.05.

3. Results

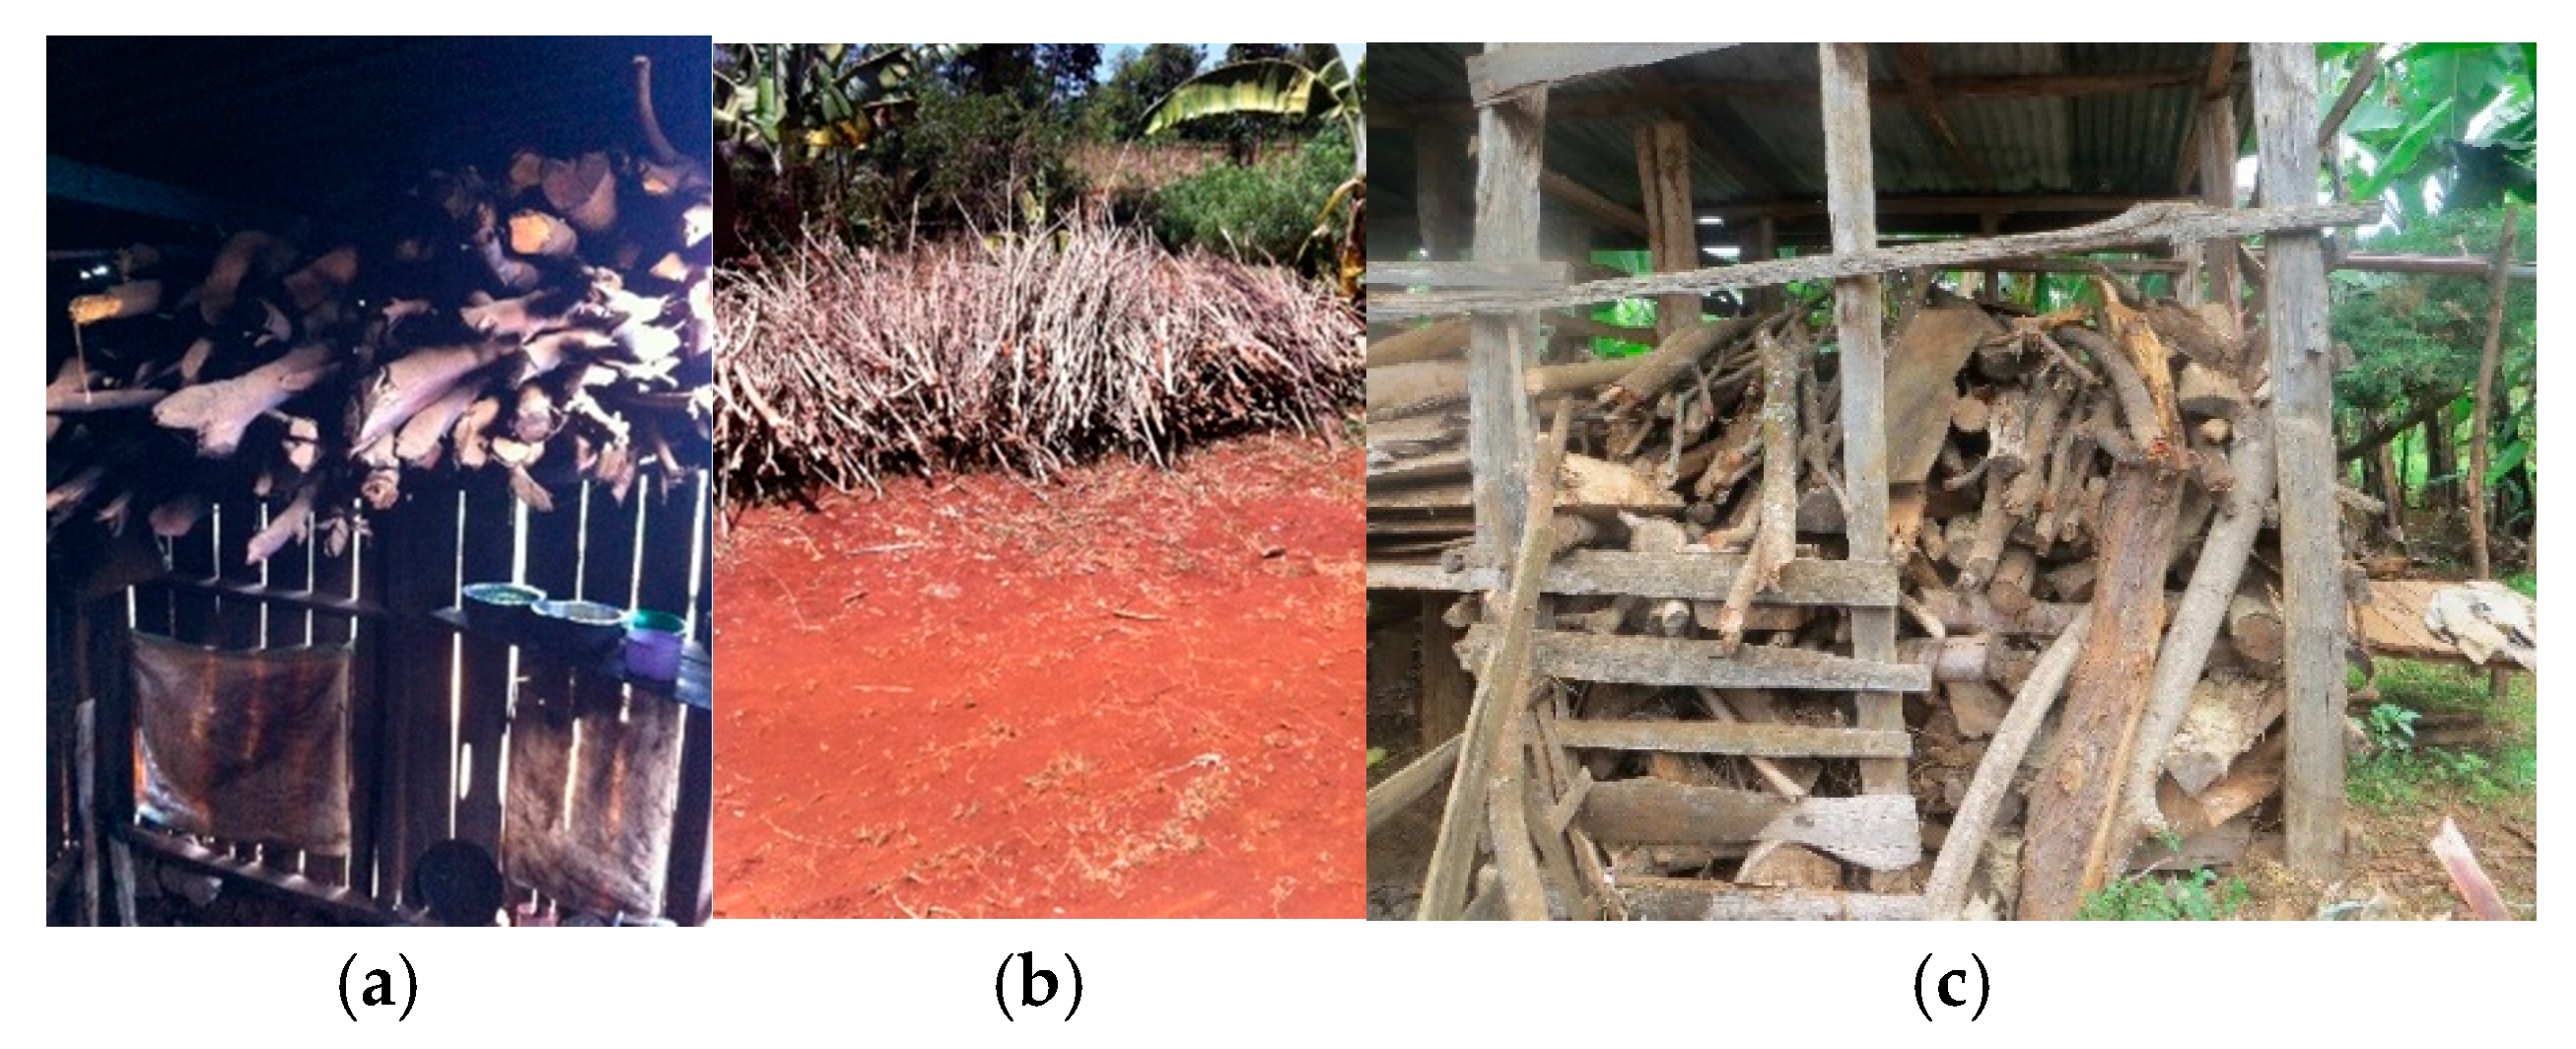
3.1. Fuel Types Used

Since the participants were left to decide on the fuel type for cooking, all households used firewood, whereas the species used differed among households. In Embu, the most common tree species used singly during the cooking test were grevillea (Grevillea robusta), macadamia (Macadamia integrifolia), and coffee (Coffea) (by 3 households each); 13 households used a mix of tree species. The following three species were used by one household each: mucuca (Eriobotrya japonica); muthanduku (Acacia mearnsii); and mururi (Milicia excelsa). In Siaya, the most commonly used species were Markhamia (Markhamia lutea) and Eucalyptus (Eucalyptus globulus), by 11 and 5 households, respectively, while 7 households used a mix of species; albizia (Albizia julibrissin) and lantana (Lantana camara) were used by one household each. In Kwale, Casuarina (Casuarina equisetifolia) and Neem (Azadirachta indica) were the most commonly used species by eight households each, while eight households used a mix of firewood and one household used tamarind (Tamarindus indica) [22]. Long burning times, with a good flame, as well as the production of good char were some of the characteristics indicated by households as influencing the choice of feedstock.

3.2. Adoption of the Gasifier Cookstove

A survey conducted approximately three months after the training and issuing of the gasifiers indicated that most households were using the cookstoves, which could be linked to the training of the users and follow-up visits after stove distribution. Gasifier use was highest in Siaya and lowest in Embu (Figure 4). Previous studies had also reported the need for after-sales support for the enhanced adoption of new cooking technologies [31,32]. However, there was a large variation in the frequency of gasifier use. In Embu, households used the stove for 1–5 days per week. In Siaya and Kwale, the frequency of use was higher, with more than 80% using it at least three days per week. The gasifier was mainly used to cook foods that required a short cooking time; many preferred to use it to cook dinner. The households were using the gasifier alongside the three-stone open fire and other stoves available to the household, a practice referred to as stacking [33]. This observation has also been reported in previous studies [34,35,36,37]. A lack of understanding and consideration of users’ needs and preferences is one of the factors that could lead to the low adoption of improved stoves. To enhance adoption of the gasifier, the stove should be developed in a participatory manner to capture and integrate the users’ views on cookstove design and ensure that the developed stove meets all their cooking needs. In addition, stacking is a reality noted in fuel and stove transition, as cooks make choices based on felt needs [33,38]; therefore, it is important to adopt a system approach that includes improving traditional cooking practices.

3.3. Combustion Properties of Firewood Used and Produced Char

The average moisture content of the most commonly used firewood by the households was the lowest in Siaya and highest in Embu (Table 1). The differences could be attributed to the hotter climate in Siaya and Kwale. In addition, in Siaya, the time between sample collection and analysis was longer; hence, the samples would have had plenty of time to dry. The differences observed in the regions can also be attributed to the firewood types used, varying firewood drying practices, and availability, which could affect how well it was dried (Figure 5). However, the moisture content of firewood at the three sites was below the recommended 20% [39]. The moisture content of firewood determines its energy content, with drier firewood generating more energy for cooking or heating [40].
Of the six firewood types from the three sites, grevillea had the lowest ash content (Table 1). In general, firewood used in Embu had the lowest ash content. On average, the differences in fixed carbon between the sites was insignificant. A longer burning period, which can vary depending on biomass types, is one of the desirable properties of cooking fuel; biomass with higher amounts of fixed carbon burns for a longer period [41]. The firewood used in Siaya had slightly lower levels of volatile matter, on average. The calorific value of the firewood types used at the three sites was almost the same. The calorific value of fuel is defined by its energy content per unit mass and fuel type. High-calorific value fuels release more heat; hence, they are better for cooking [42].
After charring, the char produced was harvested and cooled. Char from Siaya had the lowest moisture content while that from Embu had the highest. Char from Embu had the highest calorific value and fixed carbon, and the lowest ash content, implying that it is of good quality (Table 2). After gasification, the percentage reduction in volatile matter was higher in char samples from Embu (88.3%). The calorific value percentage increase in char was also highest in char from the same county (43.6%). The produced char’s average moisture content and volatile matter at the three sites were below the 30% and 10% recommended maximum, respectively, while the ash content was above the recommended 3% for good lump charcoal [43].

3.4. Description of the Respondents’ Kitchens

While all kitchens in Embu were separate structures built apart from the main building, 20% of the kitchens in Siaya were within the main building (Table 3). This can have an impact on the exposure period to pollutants, which take time to clear after the cooking exercise. For those with kitchens in the main house, the implication is that with air circulation, pollutants could spread to the bedrooms and occupants might breathe these in, even when asleep. Ventilation of the cooking area affects the build-up of pollutants. Four households in Kwale without a door or door space had the front side of the kitchen open. Two households in Embu had two windows each; one window was closed while the other was opened during the cooking sessions.

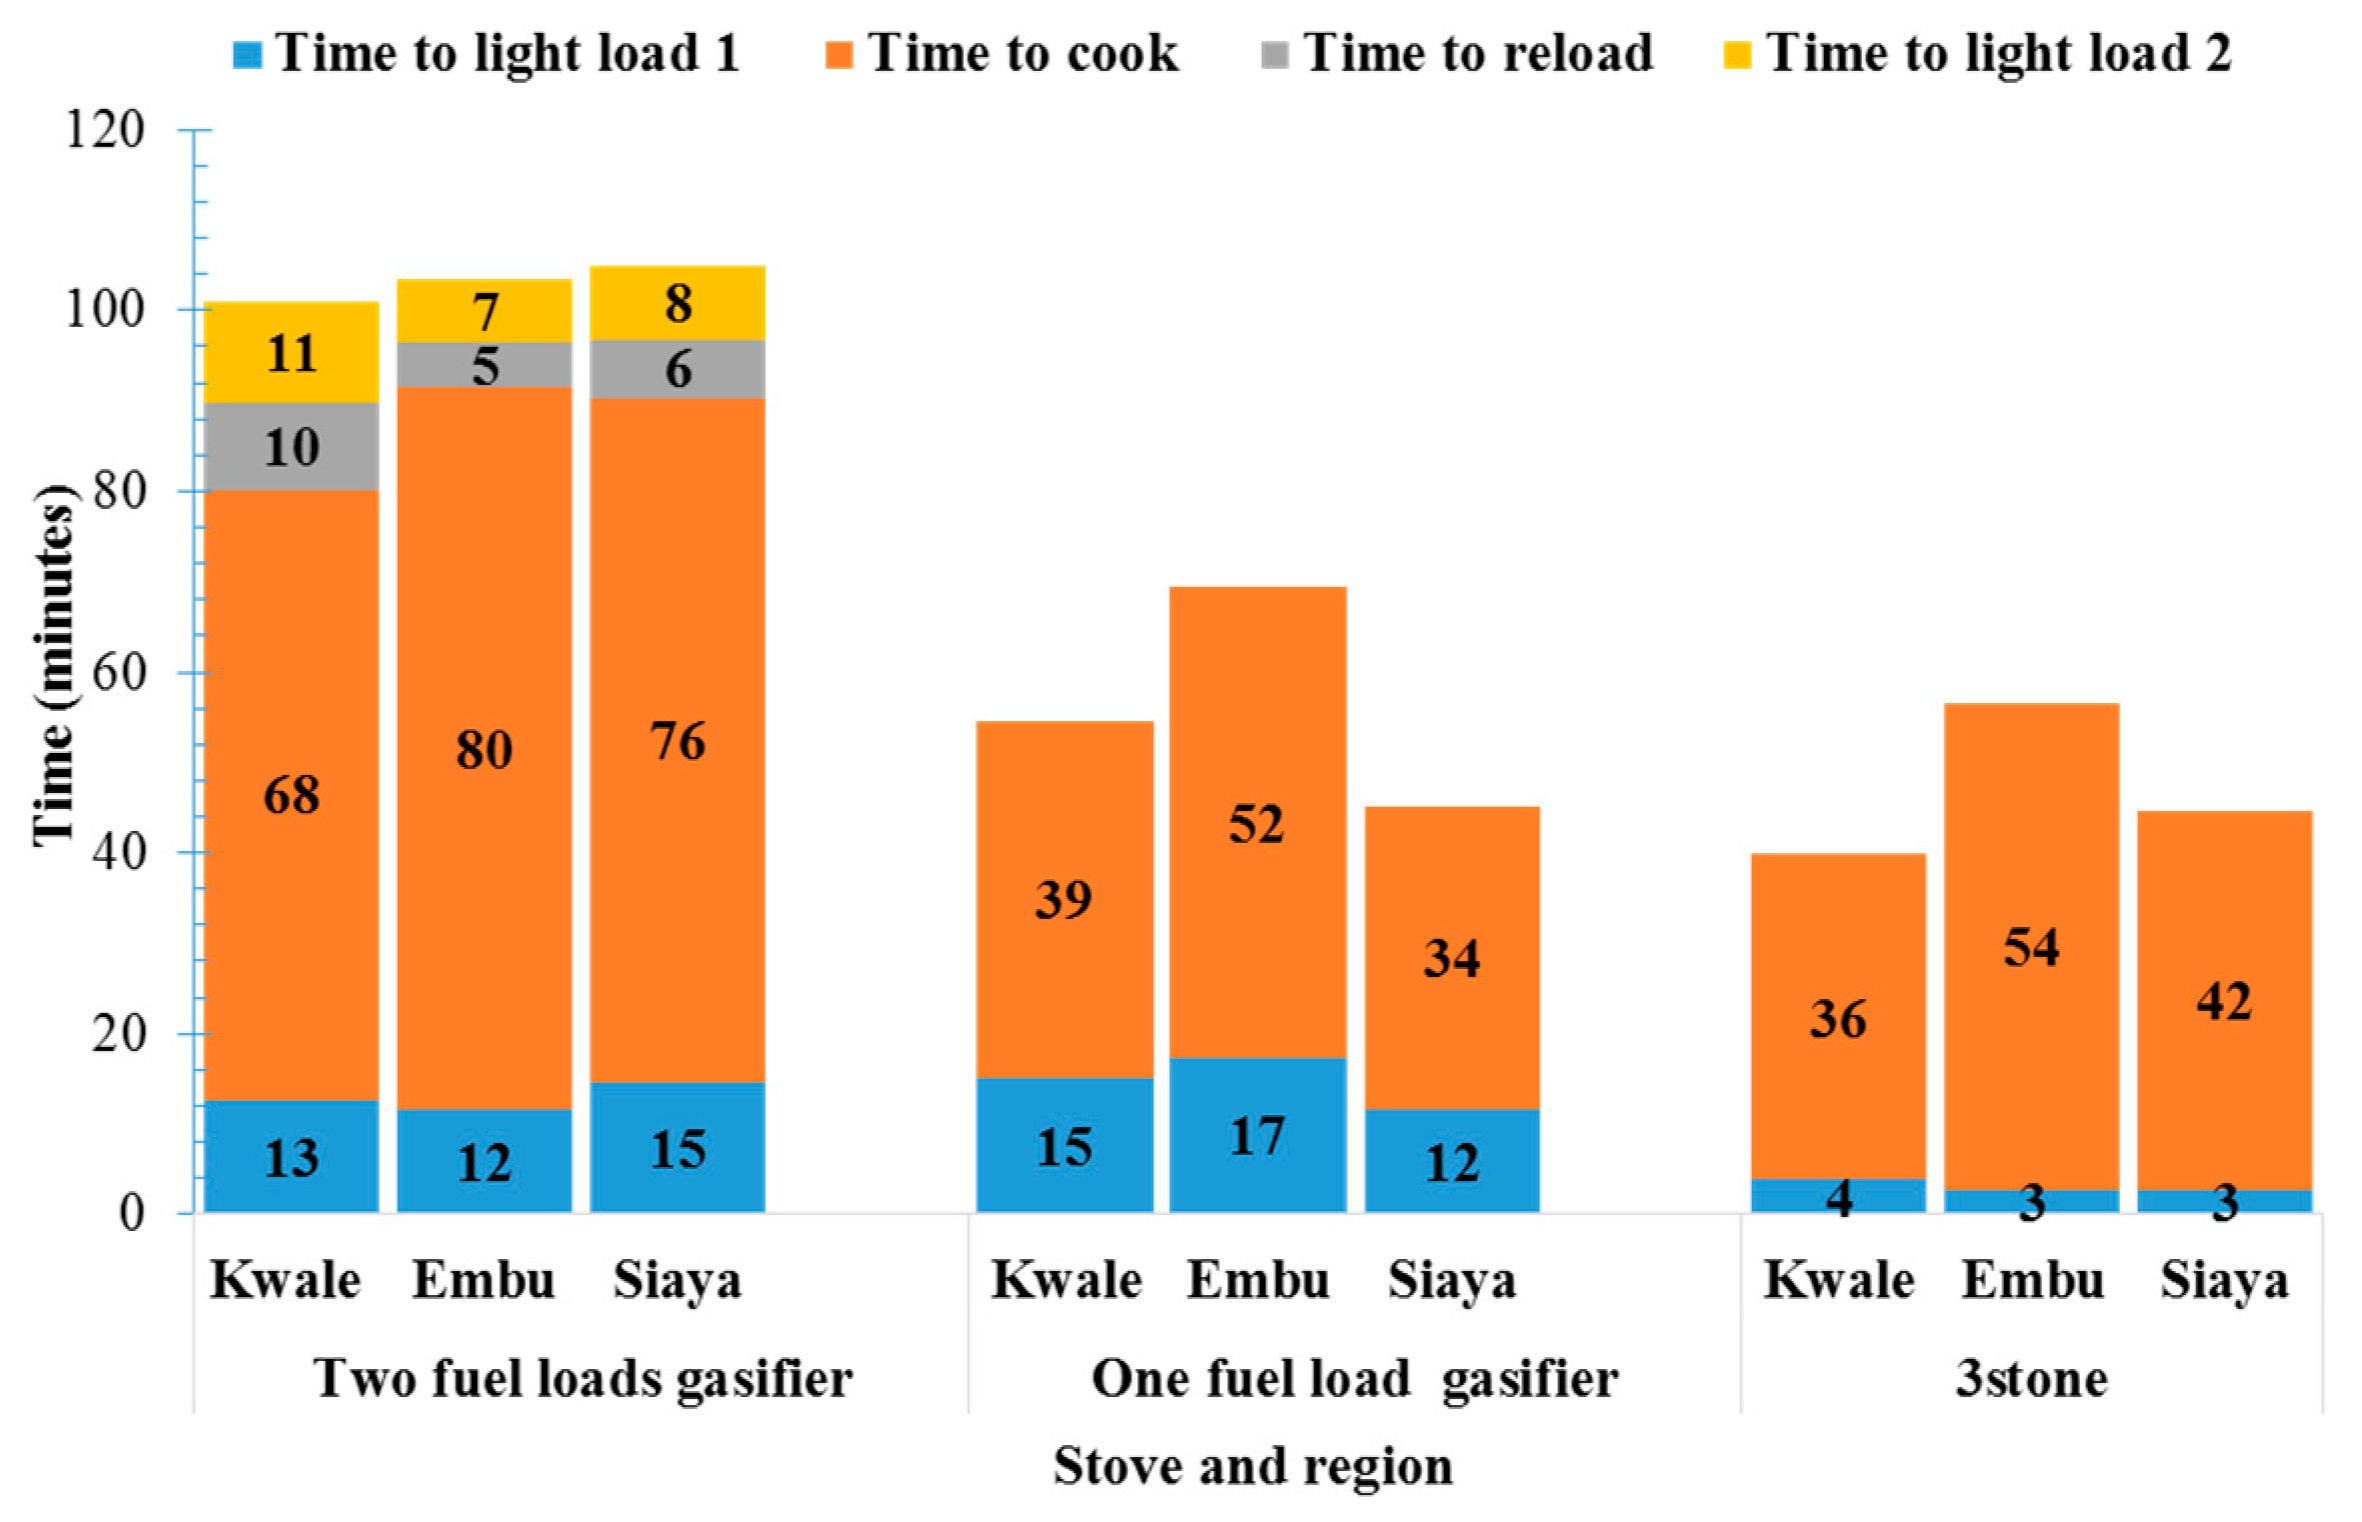
3.5. Time Used While Cooking with Gasifier and Three-Stone Open Fire

Irrespective of change-over, on average, cooking time was longest in Embu and shortest in Kwale (Figure 6). Variations in the time spent cooking with the gasifier by different households is attributed to the different food types cooked, cooking practices, and the type of firewood used. In instances when fuel charred before the food was ready, fuel was reloaded and lit, which is usually referred to as changing over; this consequently lengthened the cooking process.
On average, time spent when utilizing the gasifier, with and without change-over, was highest in Embu (73.4 ± 2.9 min) and lowest in Siaya (53.9 ± 3.8 min). With and without a change-over, using a gasifier lengthened the cooking process by 74%, 103%, and 118%; and by 30%, 14%, and 11% compared to the three-stone open fire in Embu, Kwale, and Siaya, respectively. Irrespective of change-over, the cooking process using the gasifier was longer by 36%, 35%, and 28% compared to the three-stone open fire in Embu, Kwale, and Siaya, respectively. Similar findings were reported by [21]. A need to spend more time cooking is a factor that may discourage stove use. This could potentially be countered by saving time on fuel collection due to lower fuel needs; however, the fuel preparation also adds to the workload of users [44], although this was not tested during the study. In addition, the gasifier users in Kwale reported spending less time on cleaning pots used with the gasifier, a factor previously reported as potentially motivating stove adoption [45]. Households were issued with a second canister; loading it with fuel in advance when cooking meals that take a long time to cook, and starting to light once the fuel in the first canister is almost charred, can help to save time spent in reloading and changing over.

3.6. Firewood Preparation and Cooking Responsibilities

Cooking is mainly the responsibility of wives at the three study sites; they are also the ones who mainly prepared the firewood used with the gasifier (Table 4). However, as reported by [46], the adoption of improved biomass stoves could make men take on more household chores, which could reduce the workloads of women, although this was not evaluated in this study.

3.7. Firewood Usage and Char Production in Gasifier

About 80% of households in Embu and Siaya used one canister firewood load to cook a meal of their choice with the gasifier, while 20% needed to reload the gasifier (Table 5). Irrespective of whether or not there was a change-over, the total average firewood used with the gasifier and char produced was the lowest in Siaya.
The amount of char produced varied among households and across the study sites, mainly due to variations in the timing of the char harvest; the characteristics of firewood types used; and the amounts loaded into the fuel canister. The production of charcoal was also reported as one of the benefits of gasifier cookstoves by Uwingabire et al. [21]. Households were trained on biochar application as a soil amendment; this improved maize and kale yields [47].
Cooking with the gasifier consumed less firewood compared to cooking with the three-stone open fire at the three sites. The percentages of gross and net firewood savings were highest in Siaya, both when char was considered as fuel and when not considered as fuel (Table 6); the differences between the sites were statistically significant, (Kruskal–Wallis H test: gross fuel use; χ2(2) = 14.009, p = 0.001, mean rank fuel use score 44.72 for Embu, 44.60 for Kwale and 24.68 for Siaya; net fuel use; χ2(2) = 14.5, p = 0.001, mean rank fuel use score 44.2 for Embu, 45.4 for Kwale and 24.5 for Siaya). This variation in fuel consumed at the different sites is attributed to stove handling, the type of food being cooked, and fuel availability. A study in the Kagera region of Tanzania also reported that the gasifiers used less fuel than traditional stoves [48]. Less firewood use in the gasifier translates into a reduced need to collect firewood, which has been shown to be time-consuming and a major source of physical and mental stress [46].

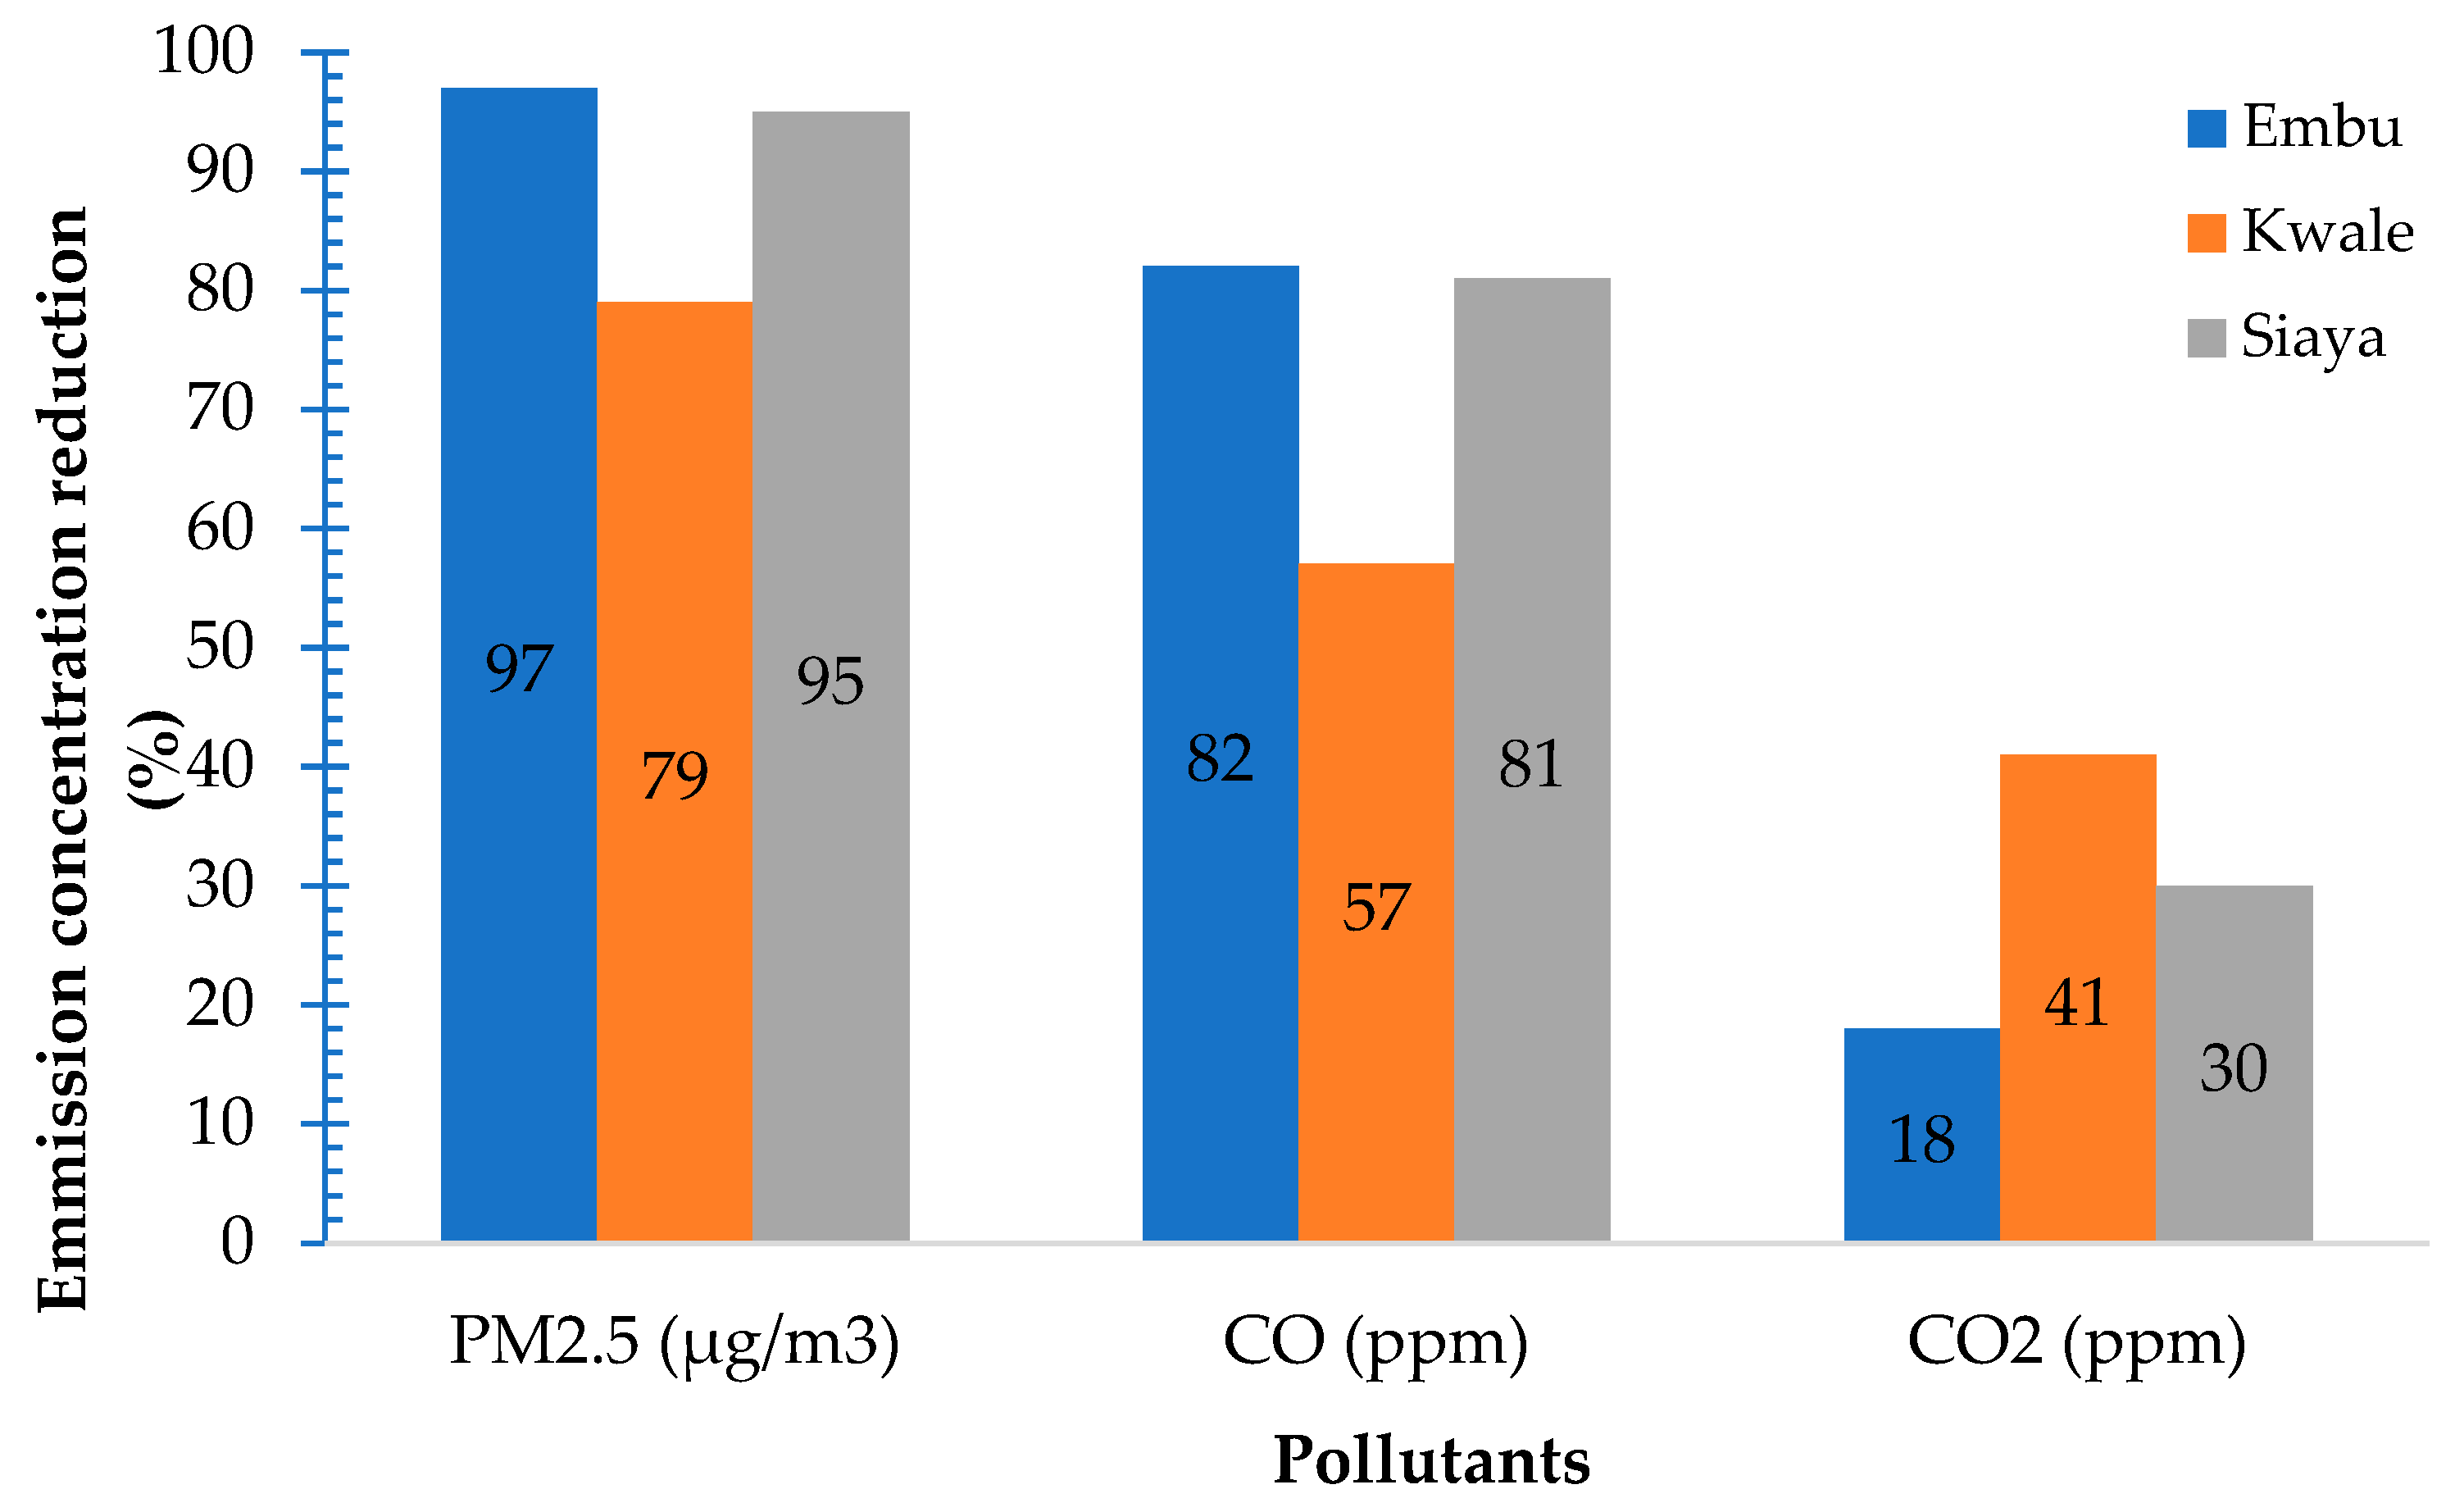
3.8. Concentrations of CO, CO2 and PM2.5

Concentration levels of the gases and particulates measured during the cooking test period varied among the households and sites (Table 7). PM2.5 data from one household in Kwale and Siaya were dropped due to equipment failure, and hence not included in the discussion.
The average CO concentrations from the gasifier were below the 30 ppm critical limits allowed for human exposure for an hour at the three sites (Table 7) [26]. Carbon dioxide concentrations were also below 5000 ppm averaged over an 8 h workday, the permissible exposure limit, at the three sites [27]. Average PM2.5 concentrations were above the 25 μg/m3 24 h level exposure limit at the three sites. The differences in CO2 and PM2.5 concentrations between the sites were statistically significant (Kruskal–Wallis H test: CO2 concentration; χ2(2) = 13.161, p = 0.001, mean rank CO2 concentration score 27.24 for Embu, 49.56 for Kwale and 37.20 for Siaya; PM2.5 concentration; χ2(2) = 10.241, p = 0.006, mean rank PM2.5 concentration score 46.40 for Embu, 27.0 for Kwale and 37.21 for Siaya). The highest percentage reduction for the pollutants was for PM2.5 in Embu (Figure 7). Exposure to PM2.5 from the use of inefficient fuels and cooking stoves affects health negatively, particularly the respiratory system [49,50,51].
Since the concentrations of PM2.5 were higher than the permissible limits, the gasifier needs some improvement to improve combustion efficiency and, consequently, emissions. Testing of the improved version under real-use conditions should be conducted before scaling up. The possibility of the gasifier having a chimney to exhaust the smoke to the outside should also be considered.

3.9. Summary Comparison Among the Three Sites

Households from the three sites utilized various types of firewood, with most of them using a mix. Even though the tree species used varied within and between sites, the differences in fuel and char quality were minimal. The volatile matter and moisture content of the produced char was below the maximum FAO-recommended levels of 30% and 10%, respectively. Adoption of the gasifier was highest in Siaya. This could be attributed to the limited availability of firewood in the area. Households from the same county also had the lowest fuel use in the gasifier and the largest fuel savings compared to the three-stone fire, indicating that fuel savings was a higher priority there compared to the other sites. The time spent cooking varied across the three sites, with the least time spent in Kwale. This could be a result of the different food types cooked and the varying cooking practices. At all the sites, wives to the household heads were the main cooks; they were also the ones who prepared firewood for use in the gasifier at all the sites. The CO concentrations were similar in all three areas and were within the critical limit of 30 ppm recommended by WHO. PM2.5 concentrations were above the WHO-recommended exposure limit at the three sites. These were lower in Siaya than in Kwale and Embu, which could be a result of the lower moisture content of the firewood used in Siaya.

4. Conclusions

About 86%, 96% and 100% of households were using the gasifier 2–3 months after it was issued in Embu, Kwale and Siaya, respectively, although with frequencies ranging from daily to weekly use. Since the households were allowed to make a decision on which fuel was used while cooking, a variety of the available firewood at the three study sites was used. Compared to the three-stone open fire, the amount of firewood used to cook with the gasifier was reduced at all the sites. Higher fuel savings when cooking food with the gasifier compared to the three-stone open fire was registered in Siaya, both when the char produced was considered as a fuel and when it was not. This could be due to the limited availability of firewood in this area, with households always aiming at saving the little wood that is available. With gasifier use, char was produced and the percentage mass remaining in the char was higher at Siaya. Concentrations of CO, PM2.5 and CO2 in the cooking area during cooking were reduced at the three sites when the gasifier was used compared to the three-stone open fire. The largest CO and PM2.5 concentrations reductions were recorded at Embu; the largest reductions in CO2 concentrations were recorded at Kwale. This could be attributed to the varying cooking practices and fuels used. The adoption and frequent use of gasifier cookstoves by households is a viable way to help them to tackle the issues of fuel use efficiency, exposure to indoor air pollutants, the burden of firewood collection placed on women, and the expenditure on cooking fuel. If the households decide to use the produced char as biochar for soil amendment, crop yields could be improved; this would consequently improve household food security. Even though the gasifier significantly reduced the concentrations of gases and particulates, PM2.5 concentrations were still above the permissible limits. This calls for further improvements to the stove to lower the concentrations to levels below or within the permissible limits.

5. Recommendations

The gasifier stove has several benefits, such as fuel savings, and consequently, the time spent in sourcing the fuel; reduced indoor air pollution; potential reductions in the health risks associated with smoke in the kitchen; and the production of char, which can be used as fuel or for soil amendment. Gasifier stoves should therefore be promoted among rural households for the associated environmental, health, and socio-economic benefits to be realized. The stove developers involved the users from the design stage of the stove to capture their needs and preferences for enhanced acceptability and adoption of the developed stove. The functionality and efficiency of the developed stove should be tested at the grassroots scale with users; possible recommended modifications should be made before scaling up. There is need for further studies on the performance of the gasifier stove, with the involvement of a larger number of households and repeated tests to model the variabilities introduced by the types of firewood, ventilation, and user behavior, to inform the scaling-up process.

Author Contributions

Conceptualization, J.K.G., C.S., R.M. and M.N.; data curation, J.K.G.; formal analysis, J.K.G.; funding acquisition, C.S. and M.N.; investigation, J.K.G., C.S., R.M. and M.N.; methodology, J.K.G., C.S., R.M. and M.N.; project administration, J.K.G., C.S. and M.N.; resources, C.S. and M.N.; supervision, C.S., R.M. and M.N.; validation, J.K.G., C.S., R.M. and M.N.; visualization, J.K.G., C.S., R.M. and M.N.; writing—original draft, J.K.G.; writing—review and editing, J.K.G., C.S., R.M. and M.N. All authors have read and agreed to the published version of the manuscript.

Funding

The research was supported by the Swedish Research Council [grant number 2015 03180]; and the Swedish Research Council for Environment, Agricultural Sciences and Spatial Planning [grant number 924-2015-1112].

Institutional Review Board Statement

This study is waived for ethical review by the IITA Internal Review Board (the study belongs to a multiorganization project).

Informed Consent Statement

Informed consent forms of all participants have been obtained for this study.

Data Availability Statement

The data presented in this study are available on request from the corresponding author.

Acknowledgments

The authors are grateful to ICRAF for providing a platform for the training of a PhD student in collaboration with the Wangari Maathai Institute for Peace and Environmental Studies, University of Nairobi. The co-learning established between KIRDI and the research team is gratefully acknowledged, as well as the participation of households in Embu, Kwale and Siaya, and all members of the project team. The authors appreciate the additional staff time support for Mary Njenga by ICRAF and the CGIAR Research Program on Water Land and Ecosystem Flagship on Sustaining Rural–Urban Linkages, and the travel to Kenya and staff time support offered to Ruth Mendum at the Office of International Programs, College of Agricultural Sciences, Pennsylvania State University and USDA National Institute of Food and Agriculture and Hatch Appropriations under Project #PEN04724 and Accession #1020895.

Conflicts of Interest

The authors declare no conflicts of interest. The funders had no role in the design of the study; in the collection, analyses, or interpretation of data; in the writing of the manuscript; or in the decision to publish the results.

Abbreviations

The following abbreviations are used in this manuscript:
COCarbon monoxide
CO2Carbon dioxide
CRACommission on Revenue Allocation
FAOFood and Agricultural Organization
GHGGreen House Gases
HHHousehold
IEAInternational Energy Agency
IRENAInternational Renewable Energy Agency
KIRDIKenya Institute of Research and Development Institute
LHVLow heating value
MoEMinistry of Energy
OSHAOccupational Safety and Health Administration
PELPermissible Exposure Limit
PM2.5Fine particulate matter
PPMParts per million
TLUDTop Lit-Updraft
TsTotal solids
UNSDUnited Nation Statistics Division
WHOWorld Health Organization

References

  1. Clancy, J.S.; Skutsch, M.M.; Batchelor, S. The Gender-Energy-Poverty Nexus: Finding the Energy to Address Gender Concerns in Development; Prepared under DFID Project, CNTR99852; Gamos Ltd.: Reading, UK, 2003. [Google Scholar]
  2. International Energy Agency; International Renewable Energy Agency; United Nations Statistics Division; World Bank; World Health Organization. Tracking SDG 7: The Energy Progress Report 2022. © World Bank. License: CC BY 3.0 IGO. 2022. Available online: http://hdl.handle.net/10986/38017 (accessed on 17 February 2024).
  3. Food and Agriculture Organization of the United Nations (FAO). The Charcoal Transition: Greening the Charcoal Value Chain to Mitigate Climate Change and Improve Local Livelihoods; van Dam, J., Ed.; FAO: Rome, Italy, 2017. [Google Scholar]
  4. Bonjour, S.; Adair-Rohani, H.; Wolf, J.; Bruce, N.G.; Mehta, S.; APrüss-Ustün MLahiff EARehfuess VMishra Smith, K.R. Solid fuel use for household cooking: Country and regional estimates for 1980–2010. Environ. Health Perspect. 2013, 121, 784–790. [Google Scholar] [CrossRef]
  5. Edwards, R.D.; Smith, K.R.; Zhang, J.; Ma, Y. Models to predict emissions of health-damaging pollutants and global warming contributions of residential fuel/stove combinations in China. Chemosphere 2003, 50, 201–215. [Google Scholar] [CrossRef]
  6. Ministry of Energy (MoE). Kenya Household Cooking Sector Study; Assessment of the Supply and Demand of Cooking Solutions at the Household Level. 2019. Available online: https://www.eedadvisory.com/wp-content/uploads/2019/11/moe-2019-cooking-sector-study-.pdf (accessed on 15 March 2025).
  7. Zomer, R.J.; Trabucco, A.; Coe, R.; Place, F.; van Noordwijk, M.; Xu, J.C. Trees on Farms: An Update and Reanalysis of Agroforestry’s Global Extent and Socio-Ecological Characteristics; Working Paper; World Agroforestry Centre (ICRAF) Southeast Asia Regional Program: Bogor, Indonesia, 2014; p. 179. [Google Scholar] [CrossRef]
  8. Githiomi, J.K.; Mugendi, D.N.; Kung’u, J.B. Analysis of household energy sources and wood fuel utilisation technologies in Kiambu, Thika and Maragwa districts of Central Kenya. J. Hortic. For. 2012, 4, 43–48. [Google Scholar] [CrossRef]
  9. Carvalho, R.L.; Yadav, P.; Garcia-Lopez, N.; Lindgren, R.; Nyberg, G.; Diaz-Chavez, R.; Upadhyayula, V.K.K.; Boman, C.; Athanassiadis, D. Environmental Sustainability of Bioenergy Strategies in Western Kenya to Address Household Air Pollution. Energies 2020, 13, 719. [Google Scholar] [CrossRef]
  10. Guta, D.; Baumgartner, J.; Jack, D.; Carter, E.; Shen, G.; Orgill-Meyer, J.; Rosenthal, J.; Dickinson, K.; Bailis, R.; Masuda, Y.; et al. A systematic review of household energy transition in low and middle income countries. Energy Res. Soc. Sci. 2022, 86, 102463. [Google Scholar] [CrossRef]
  11. Gill-Wiehl, A.; Price, T.; Kammen, D.M. What’s in a stove? A review of the user preferences in improved stove designs. Energy Res. Soc. Sci. 2021, 81, 102281. [Google Scholar] [CrossRef]
  12. Pakravan, M.H.; MacCarty, N. What Motivates Behavior Change? Analyzing User Intentions to Adopt Clean Technologies in Low-Resource Settings Using the Theory of Planned Behavior. Energies 2020, 13, 3021. [Google Scholar] [CrossRef]
  13. Gill-Wiehl, A.; Sievers, S.; Kammen, D.M. The value of community technology workers for LPG use: A pilot in Shirati, Tanzania. Energy Sustain. Soc. 2022, 12, 5. [Google Scholar] [CrossRef]
  14. Williams, N.B.; Quilliam, R.S.; Campbell, B.; Ghatani, R.; Dickie, J. Taboos, toilets and biogas: Socio-technical pathways to acceptance of a sustainable household technology. Energy Res. Soc. Sci. 2022, 86, 102448. [Google Scholar] [CrossRef]
  15. Wahlund, M.; Palm, J. The role of energy democracy and energy citizenship for participatory energy transitions: A comprehensive review. Energy Res. Soc. Sci. 2022, 87, 102482. [Google Scholar] [CrossRef]
  16. Martin II, W.J.; Glass, R.I.; Balbus, J.M.; Collins, F.S. A major environmental cause of death. Science 2011, 334, 180–181. [Google Scholar] [CrossRef]
  17. Torres-Rojas, D.; Lehmann, J.; Hobbs, P.; Joseph, S.; Neufeldt, H. Biomass availability, energy consumption and biochar production in rural households of Western Kenya. Biomass Bioenergy 2011, 35, 3537–3546. [Google Scholar] [CrossRef]
  18. Lehmann, J.; Cowie, A.; Masiello, C.A.; Kammann, C.; Woolf, D.; Amonette, J.E.; CAyuela, M.L.; Camps-Arbestain, M.; Whitman, T. Biochar in climate change mitigation. Nat. Geosci. 2021, 14, 883–892. [Google Scholar] [CrossRef]
  19. Kätterer, T.; Roobroeck, D.; Kimutai, G.; Karltun, E.; Nyberg, G.; Sundberg, C.; Roing de Nowina, K. Maize grain yield responses to realistic biochar application rates on smallholder farms in Kenya. Agron. Sustain. Dev. 2022, 42, 63. [Google Scholar] [CrossRef]
  20. Jeffery, S.; Abalos, D.; Prodana, M.; Bastos, A.C.; van Groenigen, J.W.; Hungate, B.A.; Verheijen, F. Biochar boosts tropical but not temperate crop yields. Environ. Res. Lett. 2017, 12, 053001. [Google Scholar] [CrossRef]
  21. Uwingabire, S.; Chamshama, S.A.O.; Nyberg, G.; Nduwamungu, J. Gasifier use for cooking and biochar production by smallholder farmers in Rwanda. Biofuels 2024, 16, 77–84. [Google Scholar] [CrossRef]
  22. Gitau, J.K.; Sundberg, C.; Mutune, J.; Mendum, R.; Njenga, M. Use of biochar-producing gasifier cookstove improves energy use efficiency and indoor air quality in rural households. Energies 2019, 12, 4285. [Google Scholar] [CrossRef]
  23. CRA Kenya. Commission on Revenue Allocation. 2014. Available online: www.crakenya.org (accessed on 14 March 2022).
  24. Mkuzi, H.; Mwaguni, S.; Danda, K. Re-settling displaced people in a coastal zone mining project: Evaluating the agricultural and land use potential of the proposed resettlement site–a case of titanium mining in Kenya. J. Environ. Earth Sci. 2013, 3, 152–165. [Google Scholar]
  25. World Health Organization. Health Effects of Particulate Matter—Policy Implications for Countries in Eastern Europe, Caucasus and Central Asia; World Health Organization Regional Office for Europe: Copenhagen, Denmark, 2013. Available online: http://www.euro.who.int/__data/assets/pdf_file/0006/189051/Health-effects-of-particulate-matter-final-Eng.pdf (accessed on 7 March 2022).
  26. World Health Organization. WHO Guidelines for Indoor Air Quality: Selected Pollutants; World Health Organization, Regional Office for Europe: Copenhagen, Denmark, 2010. Available online: http://www.who.int/iris/handle/10665/260127 (accessed on 7 March 2023).
  27. Occupational Safety and Health Administration (OSHA). Permissible Exposure Limits, OSHA Annotated Table Z-1 ACGIH® Threshold Limit Values (TLVs®) (ACGIH® 2019). Available online: https://www.osha.gov/dsg/annotated-pels/tablez-1.html (accessed on 12 July 2022).
  28. SS-EN14918:2010; Solid Biofuels—Determination of Calorific Value. SIS: Stockholm, Sweden, 2010.
  29. SS-EN ISO 18122:2015; Solid Biofuels—Determination of Ash Content. SIS: Stockholm, Sweden, 2015.
  30. SS-EN ISO 20134-3:2015; Solid Biofuels—Determination of Moisture Content—Oven Dry Method—Part 3: Moisture in General Analysis Sample. SIS: Stockholm, Sweden, 2015.
  31. Kar, A.; Zerriffi, H. From cookstove acquisition to cooking transition: Framing the behavioural aspects of cookstove interventions. Energy Res. Soc. Sci. 2018, 42, 23–33. [Google Scholar] [CrossRef]
  32. Malakar, Y.; Greig, C.; van de Fliert, E. Resistance in rejecting solid fuels: Beyond availability and adoption in the structural dominations of cooking practices in rural India. Energy Res. Soc. Sci. 2018, 46, 225–235. [Google Scholar] [CrossRef]
  33. Ado, A.; Darazo, I.R.; Babayo, M.A. Determinants of fuels stacking behavior among households in Bauchi metropolis. Bus. Manag. Rev. 2016, 7, 84. [Google Scholar]
  34. Jürisoo, M.; Lambe, F.; Osborne, M. Beyond buying: The application of service design methodology to understand adoption of clean cookstoves in Kenya and Zambia. Energy Res. Soc. Sci. 2018, 39, 164–176. [Google Scholar] [CrossRef]
  35. Furszyfer Del Rio, D.D.; Lambe, F.; Roe, J.; Matin, N.; Makuch, K.E.; Osborne, M. Do we need better behaved cooks? Reviewing behavioural change strategies for improving the sustainability and effectiveness of cookstove programs. Energy Res. Soc. Sci. 2020, 70, 101788. [Google Scholar] [CrossRef]
  36. Lambe, F.; Rana, Y.; Kwambokaa, E.; Holmlidb, S.; Lyckec, K.; Ringstromc, S.; Annebackc, J.; Ghosha, E.; O’Connerd, M.; Bailis, R. Opening the black pot: A service design-driven approach to understanding the use of cleaner cookstoves in peri urban Kenya. Energy Res. Soc. Sci. 2020, 70, 101754. [Google Scholar] [CrossRef]
  37. Lindgren, S.A. Clean cooking for all? A critical review of behavior, stakeholder engagement, and adoption for the global diffusion of improved cookstoves. Energy Res. Soc. Sci. 2020, 68, 101539. [Google Scholar] [CrossRef]
  38. Njenga, M.; Gitau, J.K.; Mendum, R. Women’s work is never done: Lifting the gendered burden of firewood collection and household energy use in Kenya. Energy Res. Soc. Sci. 2021, 7, 102071. [Google Scholar] [CrossRef]
  39. Taylor, A. W179 Wood Products Information Moisture Content of ‘Seasoned’ Firewood; The University of Tennessee Agricultural Extension Service: Tennessee, TN, USA, 2010; Available online: http://trace.tennessee.edu/utk_agexfores/101 (accessed on 19 July 2024).
  40. Sepp, S. Multiple-Household Fuel Use—A Balanced Choice Between Firewood, Charcoal and LPG; Deutsche Gesellschaft für Internationale Zusammenarbeit (GIZ) GmbH: Addis Ababa, Ethiopia, 2014. [Google Scholar]
  41. Fuwape, J.A.; Akindele, S.O. Biomass yield and energy value of some fast growing multipurpose trees in Nigeria. Biomass Bioenergy 1997, 12, 101–106. [Google Scholar] [CrossRef]
  42. Nirmal, J.I.; Patel, K.; Kumar, R.N.; Kumar, B.R. An evaluation of fuelwood properties of some Aravally mountain tree and shrub species of Western India. Biomass Bioenergy 2011, 35, 411–414. [Google Scholar] [CrossRef]
  43. Food and Agriculture Organization of the United Nations (FAO). Industrial Charcoal Making Mechanical Wood Products Branch, Forest Industries Division Forestry; FAO: Rome, Italy, 1985; p. 63. [Google Scholar]
  44. Chanchani, D.; Oskarsson, P. ‘If the gas runs out, we are not going to sleep hungry’: Exploring household energy choices in India’s critically polluted coal belt. Energy Res. Soc. Sci. 2021, 80, 102181. [Google Scholar] [CrossRef]
  45. Palit, D.; Bhattacharyya, S.C. Adoption of cleaner cookstoves: Barriers and way forward. Boil. Point 2014, 64, 6–9. [Google Scholar]
  46. Jagoe, K.; Rossanese, M.; Charron, D.; Rouse, J.; Waweru, F.; Waruguru, M.; Delapena, S.; Piedrahita, R.; Livingston, K.; Ipe, J. Sharing the burden: Shifts in family time use, agency and gender dynamics after introduction of new cookstoves in rural Kenya. Energy Res. Soc. Sci. 2020, 64, 101413. [Google Scholar] [CrossRef]
  47. Sundberg, C.; Karltun, E.; Gitau, J.K.; Kätterer, T.; Kimutai, G.; Mahmoud, Y.; Njenga, M.; Nyberg, G.; Roing de Nowina, K.; Roobroeck, D.; et al. Biochar from cookstoves reduces greenhouse gas emissions from smallholder farms in Africa. Mitig. Adapt. Strateg. Glob. Change 2020, 25, 953–967. [Google Scholar] [CrossRef]
  48. Eltigani, A.; Olsson, A.; Krause, A.; Ernest, B.; Fridahl, M.; Yanda, P.; Hansson, A. Exploring lessons from five years of biochar-producing cookstoves in the Kagera region, Tanzania. Energy Sustain. Dev. 2022, 71, 141–150. [Google Scholar] [CrossRef]
  49. World Health Organisation. World Health Statistics 2018: Monitoring Health for the Sustainable Development Goals (SDGs). 2018. Available online: https://www.who.int/en/news-room/fact-sheets/detail/household-air-pollution-and-health (accessed on 27 August 2024).
  50. Qiu, Y.; Yang, F.A.; Lai, W. The impact of indoor air pollution on health outcomes and cognitive abilities: Empirical evidence from China. Popul. Environ. 2019, 40, 388–410. [Google Scholar] [CrossRef]
  51. Li, S.; Meng, J.; Zheng, H.; Zhang, N.; Huo, J.; Li, Y.; Guan, D. The driving forces behind the change in energy consumption in developing countries. Environ. Res. Lett. 2021, 16, 054002. [Google Scholar] [CrossRef]
Figure 1. GASTOV gasifier cookstove. Fuel is placed in the canister, which is placed inside the outer casing, with the combustion chamber and skirting on top. The canister holder is used to lift the canister. At the end of cooking, the canister is removed and the extinguisher is placed on top to cut off the oxygen supply.
Sustainability 17 05872 g001
Figure 2. (a) EL-USB-CO Data Logger; (b) PATS+ PM Meter; and (c) Telaire T7001 Carbon Dioxide and Temperature Monitor.
Sustainability 17 05872 g002
Figure 3. (a) Cooking with a gasifier; and (b) cooking with a three-stone open fire.
Sustainability 17 05872 g003
Figure 4. Frequency of use of the gasifier by households in Embu, Kwale, and Siaya. HH = households.
Sustainability 17 05872 g004
Figure 5. Firewood drying: (a) in a rafter; (b) outside; and (c) in a shed.
Sustainability 17 05872 g005
Figure 6. Time spent in the cooking process with the gasifier and three-stone open fire.
Sustainability 17 05872 g006
Figure 7. Emissions reductions (%) of concentration of gases and particles with gasifier use replacing the three-stone fire.
Sustainability 17 05872 g007
Table 1. Proximate analysis and net calorific value of the firewood used to cook at the three sites.
Moisture, 105 °C (%)Ash, 550 °C
(% ts)
Volatile
Matter (% ts)
C-Fix (% ts)LHVfw
db (MJ/kg)
Kwale #
Average neem a9 ± 0.22.2 ± 0.379.4 ± 0.618.4 ± 0.418.4 ± 0.1
Average casuarina b8.7 ± 0.11.4 ± 0.181.4 ± 0.317.2 ± 0.318.4 ± 0.1
Embu
Grevillea c8.70.881.717.518.6
Macadamia c9.31.181.117.818.3
Siaya
Markhamia d6.13.680.016.418.3
Eucalyptus c6.01.080.019.018.7
ts = total solids, # Gitau et al. 2019 [22], a n = 10, b n = 9, c n = 1, d n = 2.
Table 2. Proximate analysis and net calorific value of the char produced from the main firewood used at the three sites.
Moisture, 105 °C (%)Ash, 550 °C (% ts)Volatile
Matter (% ts)
C-Fix (% ts)LHVch db (MJ/kg)
Kwale #
Average Neem a8 ± 0.24.8 ± 0.310.4 ± 0.584.8 ± 0.632 ± 0.1
Average Casuarina b7.5 ± 0.33.410.9 ± 0.785.332.4 ± 0.2
Embu
Grevillea c8.73.18.788.232.7
Macadamia c7.53.110.386.632.7
Siaya
Markhamia d4.110.815.673.730.1
Eucalyptus c3.83.410.186.531.7
# Gitau et al. 2019 [22], a n = 10, b n = 9, c n = 1, d n = 2.
Table 3. Ventilation spaces in the cooking areas in 25 households at each site.
SiteCooking AreaDoor/Door SpaceWindow/Window Space
Separate StructureInside Main HouseHas WindowsDoes Not Have WindowsHas Physical DoorHas Door SpaceOpenClosedOpenClosed
Embu250187241250313
Siaya20591622325081
Kwale151081771421080
Table 4. Household member responsible for firewood preparation and cooking during the cooking tests.
ActivityPerson Responsible in Relation to Household HeadEmbuKwaleSiaya
Firewood preparationMale head5118
Female head114
Wife9910
Son512
Daughter22
Hired labor2
Brother-in-law1
Grandson 11
CookingMale head 3
Female head426
Wife181718
Daughter33
Daughter-in-law 1
Table 5. Amount of firewood used (gross and net) and char produced.
SiteNo. HHsAverage Fuel (g)Average Char (g)
1 Firewood Load2 Firewood Load1 Load1 + 2 LoadTotal Fuel Use *1 Load1 + 2 LoadTotal
GrossNet
Embu2051054 ± 311745 ± 761192 ± 63841 ± 46181 ± 8286 ± 36202 ± 12
Siaya205831 ± 261534 ± 77972 ± 63677 ± 45153 ± 7266 ± 21176 ± 11
Kwale #1961009 ± 341748 ± 1461208 ± 74863 ± 53173 ± 6284 ± 33200 ± 13
HHs—households, * Total fuel use, irrespective of reloading # Gitau et al. 2019 [22].
Table 6. Firewood used by five households with gasifiers and three-stone open fires; char produced; and the percentage of firewood savings.
SiteFuel Used (g)Char Produced (g)% CharFuel Used 3-Stone (g)% Fuel Saving (Char as Fuel)% Fuel Saving (Char Not Fuel)
GrossNet
Embu1361 ± 206.5955 ± 149.5232.6 ± 33.917.11784 ± 203.846.524
Kwale #1205 ± 207.9859 ± 155.4198 ± 32.216.81475 ± 159.941.818
Siaya1028 ± 125.9624.3 ± 10.3188.2 ± 25.318.31792 ± 248.765.243
# Gitau et al. 2019 [22].
Table 7. Average concentration levels of CO, CO2 and PM2.5 in kitchens during the cooking period.
Site25 Cooking with Gasifier5 HHs Cooking with Both Stoves
CO (ppm)CO2 (ppm)PM2.5 (μg/m3)CO (ppm)PM2.5 (μg/m3)CO2 (ppm)
Gasifier3stoneGasifier3stoneGasifier3stone
Embu10 ± 2590 ± 13317 ± 825 ± 328 ± 12150 ± 784843 ± 3719570 ± 26695 ± 56
Kwale #8 ± 2701 ± 51291 ± 1936 ± 314 ± 5187 ± 75874 ± 411647 ± 251091 ± 353
Siaya8 ± 2619 ± 14164 ± 366 ± 231 ± 17136 ± 522761 ± 1690588 ± 17840 ± 169
HHs—households # Gitau et al. 2019 [22].
Disclaimer/Publisher’s Note: The statements, opinions and data contained in all publications are solely those of the individual author(s) and contributor(s) and not of MDPI and/or the editor(s). MDPI and/or the editor(s) disclaim responsibility for any injury to people or property resulting from any ideas, methods, instructions or products referred to in the content.

