Article

Sustainable Risk Management in Construction Through a Hybrid Fuzzy WINGS-ANP Method for Assessing Negative Impacts During Open Caisson Sinking

by
Katarzyna Gałek-Bracha
Civil Engineering and Architecture Department, Kielce University of Technology, al. 1000-lecia PP 7, 25-314 Kielce, Poland
Sustainability 2025, 17(13), 5848; https://doi.org/10.3390/su17135848
Submission received: 23 May 2025 / Revised: 20 June 2025 / Accepted: 24 June 2025 / Published: 25 June 2025

Abstract

Modern challenges in civil engineering require decision-making that supports the development of technologies in line with sustainable development principles, including minimizing environmental impact and improving occupational safety. Open caisson sinking, commonly used in underground construction, is particularly prone to generating complex negative impacts that affect construction quality, material efficiency, and working conditions. This study aims to identify the cause-and-effect relationships and assess the intensity of negative impacts associated with the open caisson sinking process. A comprehensive multi-criteria decision-making approach was developed, based on a novel hybrid method combining fuzzy WINGS and Analytic Network Process (ANP). This approach accounts for uncertainties and difficult-to-measure factors, providing a valuable tool for supporting complex engineering decisions. The proposed method facilitates improvements in process quality, reduces environmental risk, and helps eliminate typical execution errors. Research findings confirm that mitigating adverse impacts during caisson sinking enhances sustainable risk management in construction and supports rational decision-making under uncertainty. The method is universal and applicable in other domains requiring cause–effect analysis and the evaluation of impact intensity, especially in the context of implementing sustainable construction management practices.

1. Introduction

The open caisson technology is a method used for the construction of underground and embedded structures such as shafts, launching and receiving pits for horizontal directional drilling and microtunneling, foundations, retention tanks, port quay walls, and facilities at wastewater treatment plants. Despite its widespread use and broad applicability, open caisson construction is associated with various execution-related irregularities. During the sinking process in soil media, negative effects may occur, such as the tilting of the open caisson from the vertical or its uncontrolled sinking into the surrounding soil, which influence the process in various ways. Some of these effects result only in minor delays and are typically reversible. Others, however, can lead to irreversible damage and pre-failure or failure conditions. The causes of such negative impacts are often complex and not easily identifiable, as they arise from multiple interacting factors. Determining cause-and-effect relationships can contribute significantly to eliminating a range of common errors typically observed in open caisson construction.
Several case studies involving the construction of open caissons for bridge foundations in Bangladesh were presented in [1]. Some of the open caissons exceeded depths of 100 m. The authors addressed the issue of significant ground settlement near the caissons, which caused damage to adjacent infrastructure. Other publications [2] emphasize the necessity of regular verticality monitoring during open caisson sinking and structural observation to detect possible damage. Four open caisson sinking cases were described. In the first, the open caisson penetrated a clay layer at a planned rate; however, upon reaching a sand layer, the sinking process accelerated abruptly. This posed a serious threat, as it could have resulted in a loss of verticality, damage to the open caisson shaft, or harm to nearby infrastructure. In another case, excessive ground settlement occurred around the open caisson at an early stage of sinking, accompanied by noticeable tilting. Abdradabbo and Gaaver [3] presented a case study of a 20 m diameter open caisson that became jammed in the ground, leading to a twofold increase in construction costs and significant delays.
In [4], the development and implementation of an open caisson monitoring system were described for a construction site in Blackpool, UK. A key goal of the project was to provide continuous feedback to the engineering team to support construction management. The open caisson was equipped with sensors to monitor parameters such as vertical alignment. Significant tilting was observed during the initial sinking phase, which gradually decreased as the open caisson was lowered deeper. The difficulty in correcting the tilt emphasized the importance of early verticality control.
Another study [5] noted that results of prior geotechnical investigations often do not fully reflect actual ground conditions. The authors highlighted the challenge in predicting open caisson behavior and irregularities during sinking, largely due to uncertainty regarding skin friction between the open caisson shaft and surrounding soil. To adapt the design to real conditions, the observational method is recommended during sinking. To date, no method has been developed that guarantees successful and accurate open caisson installation. The limited understanding of open caisson stability during sinking stems from uncertainty in estimating frictional resistance. Furthermore, modeling uncertainty at the design stage increases the risk of negative impacts and significantly affects the predicted cost and construction schedule.
To date, a comprehensive classification of the negative impacts occurring during open caisson sinking has not been conducted. Some of these impacts have been mentioned in the literature, as presented in Table 1. However, it should be noted that the final publication listed in the table contains a complete set of identified negative impacts. This list was developed by the author of the present manuscript. The impacts included in the last column of the table were extracted and characterized in the author’s previous publication [6]. The identification of these negative impacts resulted from expert consultations, case studies conducted under various open caisson sinking conditions, the reconstruction of sinking stages, and an in-depth literature review. Explanations of the abbreviations for the names of negative impacts are provided in Table 2.
The constant demand for the construction of facilities using the open caisson method, combined with the complex nature of this technology, highlights the need for a systematic classification and analysis of cause-and-effect relationships between negative impacts, as well as an assessment of their intensity. Determining the intensity of negative impacts will enable their prioritization, which in turn will help minimize their consequences and support the development of strategies to mitigate their adverse effects. Importantly, the analyzed negative impacts are not only technical challenges but also pose significant risks to the health and safety of workers and the security of adjacent infrastructure. Therefore, developing tools to support the identification and evaluation of these hazards is essential for effective risk management in underground construction.
The analysis of negative impacts occurring during open caisson sinking is a complex and time-consuming task. It involves addressing a multifaceted decision-making problem. Identifying the causes requires the evaluation of factors that are difficult to quantify, often imprecise, uncertain, and qualitative in nature. The difficulty in measurement arises from objective limitations in assessing the state of a factor due to insufficient time or the limited availability of resources. Solving decision-making problems involving difficult-to-measure factors is one of the greatest challenges in the decision-making process. These factors include aspects that are not easily quantifiable in an objective manner, yet significantly influence decision outcomes and lie beyond the scope of conventional analytical methods. Relationships between such factors cannot be determined using traditional indicators or measurement techniques. Instead, these relationships are often identified through pairwise comparisons, a technique employed in several multi-criteria decision-making (MCDM) methods [27]. Pairwise comparison for complex decision-making involving qualitative or uncertain factors was introduced by Saaty in the Analytic Hierarchy Process (AHP) method [28], which belongs to the family of MCDM methods. AHP has been applied, for instance, to determine the importance of factors affecting the properties of eco-friendly mortars [29], as well as to develop a multi-factor evaluation model for assessing concrete fracture resistance [30]. The modeling of difficult-to-measure factors is frequently supported by fuzzy logic techniques. A fuzzy extension of the AHP method has been applied in the selection of materials for additive manufacturing processes [31].
The most widely used multi-criteria decision-making method for identifying cause-and-effect relationships is the DEMATEL method, developed by Gabus and Fontela [32]. DEMATEL is based on pairwise comparisons and the determination of interdependencies among factors. An extension of the DEMATEL method—WINGS (Weighted Influence Non-linear Gauge System)—was proposed by Michnik [33]. WINGS differs from DEMATEL by introducing the concept of intensity of influence among components within the analyzed system. The DEMATEL method has been applied, for example, to identify the factors driving the development of circular construction, particularly in the context of minimizing construction waste throughout the building life cycle [34]. DEMATEL, combined with the Ishikawa diagram, has also been used to improve product action combinations in response to material nonconformity issues [35]. The WINGS method, along with its fuzzy extension—fuzzy WINGS—has been employed for selecting functional uses in the adaptive reuse of historic buildings [36,37].
Hybrid methods are also widely used, aiming to combine the strengths of individual approaches while minimizing their respective limitations. These methods allow for the comprehensive resolution of complex, multi-dimensional decision problems within a single framework. For instance, a combination of AHP and MOORA was used to select the optimal hip implant composite [38]. A hybrid of fuzzy AHP and fuzzy TOPSIS was applied to optimize the WEDM process [39], while an extension of fuzzy AHP—EA FAHP—combined with fuzzy TOPSIS was used to determine the optimal mix design for high-strength concrete [40].
AHP/ANP and DEMATEL methods are frequently integrated, as they share a similar modeling framework. Balsara et al. [41] proposed a hybrid AHP–DEMATEL approach to evaluate climate change mitigation strategies in the Indian cement industry. Tseng [42] applied a combined ANP–DEMATEL method in the field of municipal waste management. Azizi et al. [43] developed an ANP–DEMATEL approach within a GIS environment to assess land suitability for locating a potential wind power plant in Iran.
Table 3 presents the previously mentioned multi-criteria decision-making (MCDM) methods along with their full names, brief descriptions, advantages, and limitations. This overview is intended to help the reader navigate the variety of approaches used in the analysis of complex decision-making problems, including the identification of cause-and-effect relationships and the assessment of factor intensity.
The aforementioned methods enable either the identification of cause-and-effect relationships or the establishment of a hierarchy (i.e., intensity assessment). However, they lack a comprehensive approach capable of addressing a complex decision-making problem by simultaneously determining both causal relationships and the intensity of negative impacts, while also accounting for the uncertain and fuzzy nature of the input data. By combining an approach that identifies cause-and-effect relationships with an assessment of their intensity, it becomes possible not only to determine which factors are interrelated but also to estimate the strength of those connections. This enables more accurate forecasting and data-driven decision-making. A method capable of both identifying causal relationships and determining their intensity could be applied in various domains, including failure analysis, medical diagnostics and treatment, market analysis, investment strategy development, and production process optimization. Such a method would be particularly valuable wherever it is crucial to respond to changes in influencing factors, implement strategies to mitigate negative impacts, or introduce corrective actions.
Additionally, this type of method should be suitable for solving complex, multi-dimensional decision problems involving difficult-to-measure factors. Impacts involving such factors cannot be reliably studied using traditional experimental methods due to the possibility of direct and indirect effects, one-way dependencies, and feedback loops between variables. While expert-based analysis could offer a solution, expert opinions are often characterized by uncertainty, resulting from the subjective judgment of the evaluator. This inherent uncertainty necessitates the incorporation of fuzzy logic elements into the analysis framework.
The proposed hybrid method, combining fuzzy WINGS and ANP, addresses the identified research gap. This hybrid approach provides a comprehensive tool for solving complex decision-making problems in which both the identification of cause-and-effect relationships and the assessment of their intensity are required. It facilitates the analysis of difficult-to-measure factors and incorporates uncertainty through the use of fuzzy logic elements. The method is based on group evaluation, allowing expert opinions to be used as input data. Incorporating group assessment helps to objectify the inherently subjective and uncertain nature of expert judgments.
The application of this hybrid method enables the visualization of complex causal relationships in a simple and understandable way (via fuzzy WINGS) and allows for the evaluation of the intensity of individual factors (via ANP). The method was developed specifically to assess the negative impacts occurring during the sinking of open caissons. However, it also offers the potential for application in many other fields. As such, it constitutes a universal decision-support tool with wide applicability across various disciplines.

2. Methodology

2.1. Concept of the Proposed Hybrid Method

The proposed method, developed for the purpose of analyzing negative impacts arising during the sinking of open caissons, combines a heuristic approach with fuzzy multi-criteria decision-making techniques. The main assumptions underlying this method are as follows:
  • Ability to solve complex, multi-dimensional decision-making problems;
  • Capacity to handle problems involving difficult-to-measure factors;
  • Integration of the evaluation model with expert-based approaches;
  • Implementation of a simplified evaluation model using linguistic expressions to define preferences;
  • Inclusion of group evaluation and aggregation of expert judgments;
  • Incorporation of uncertainty into the decision-making environment;
  • Capability for a comprehensive assessment of negative impacts occurring during open caisson sinking, including identification of cause-and-effect relationships and their intensity;
  • Applicability to other areas requiring the analysis of cause-and-effect relationships and the assessment of their intensity.
The developed approach consists of two stages (Figure 1):
Stage I—a model for assessing cause-and-effect relationships, based on the fuzzy WINGS method;
Stage II—a model for evaluating the intensity of the analyzed factors, based on the ANP method.

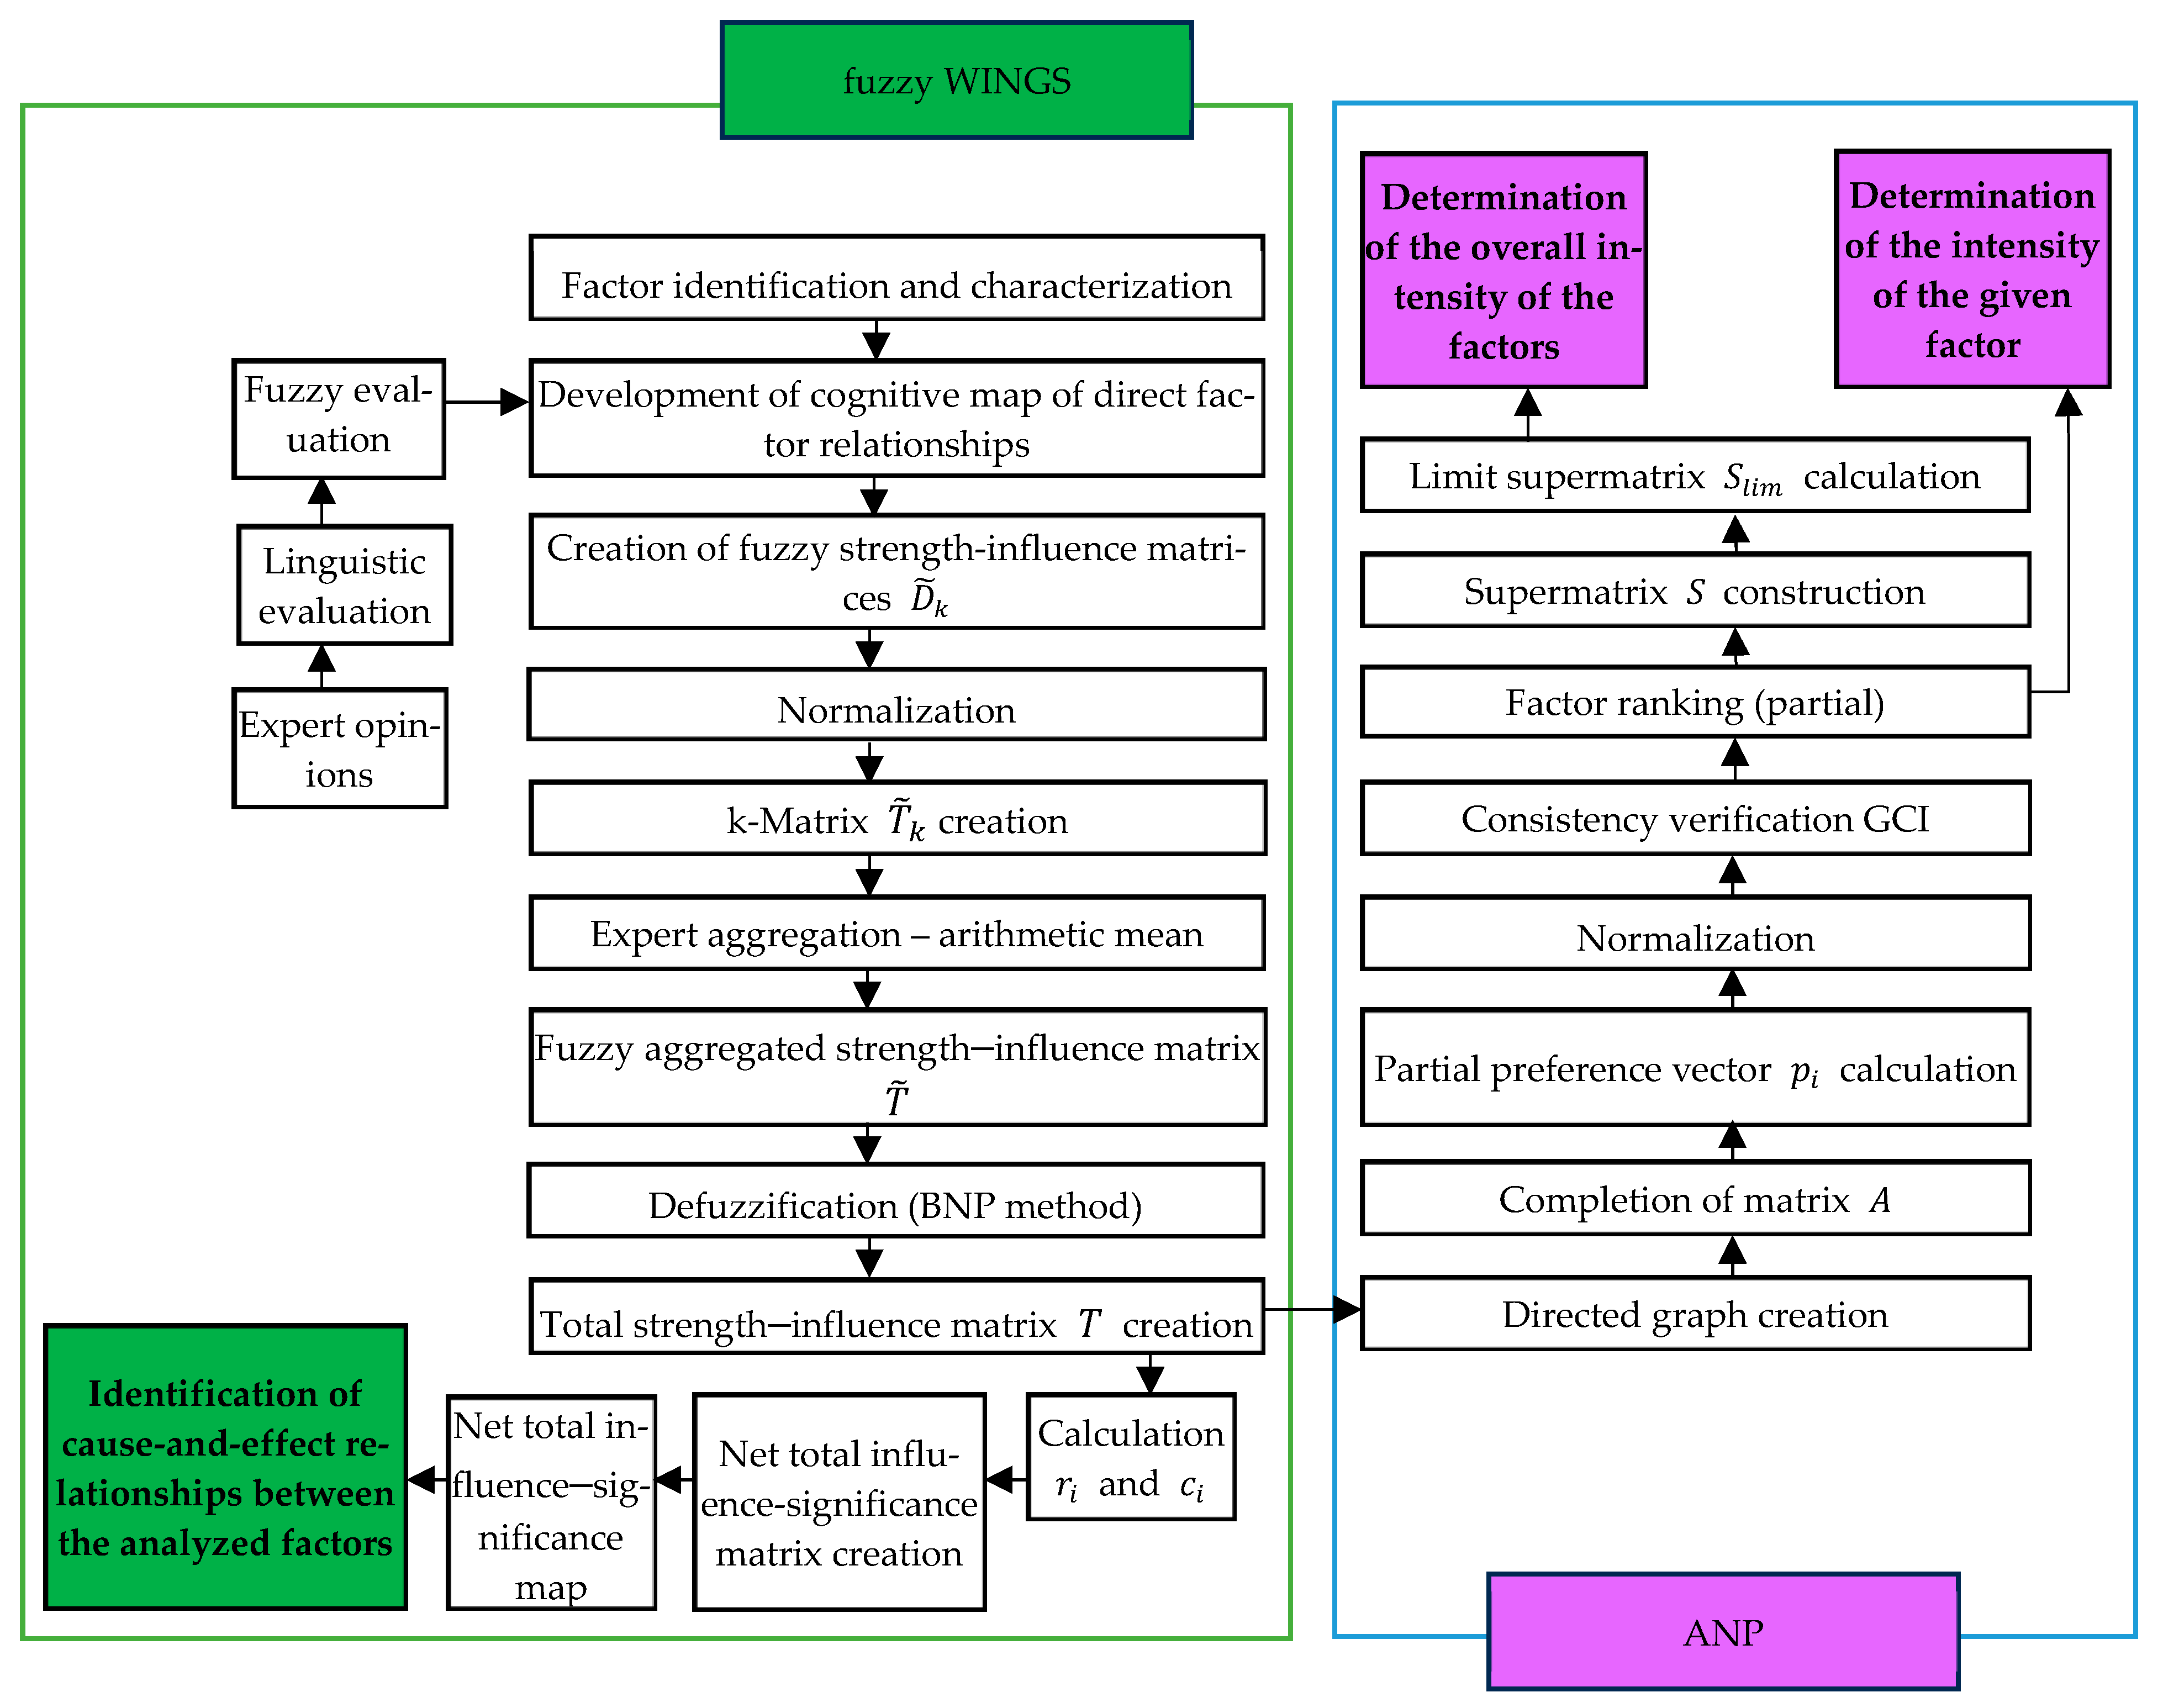
2.2. Stage One—Fuzzy WINGS Method

The first stage of the method involves identifying the relationships between the analyzed factors and determining their internal significance. This is carried out using an expert-based approach that draws upon the knowledge and experience of carefully selected experts. Based on expert opinions, a direct influence–significance matrix is constructed [44]. The analysis is based on expert judgments, which may be subjective and partially uncertain due to the experts’ hesitations regarding assigned evaluations. This necessitates the use of evaluation aggregation in the form of group assessment, as well as the incorporation of fuzzy logic. Fuzzy logic is also applied in the analysis of difficult-to-measure factors. In summary, both the cause-and-effect relationships and the significance of the factors are assessed using type-1 triangular fuzzy numbers. The group expert evaluations are represented as a set of fuzzy direct influence–significance matrices: D ~ k = { a ~ i j k } , for i , j = 1 , , n ,   k = 1 , , K , where a ~ i j k = ( l i j k , m i j k , u i j k ) ; these are triangular fuzzy numbers with a membership function μ a ~ i j k x [ 0 , 1 ] that define the fuzzy evaluation of the relationship between factor i and factor j, as assessed by the k-th expert. The main diagonal of the matrix consists of elements a ~ i j k , i , j = 1 , , n ,   d l a i = j which represent the internal significance of the individual factors. The remaining elements a ~ i j k , i , j = 1 , , n ,   d l a i j indicate the cause-and-effect relationships between the analyzed factors.
D ~ k = a ~ 11 k a ~ 1 n k a ~ n 1 k a ~ n n k
To facilitate and accelerate the evaluation process for experts, a linguistic assessment scale was introduced. These linguistic terms are later converted into a system based on type-1 triangular fuzzy numbers. A five-level linguistic scale was proposed, incorporating five categories of evaluation (Table 4).
The membership functions for the linguistic terms are presented in Figure 2 [45,46].
In the next step, the fuzzy direct influence–significance matrix D ~ k is normalized using the following formula:
C ~ k = 1 s D ~ k ,
where s denotes the normalization factor, calculated as s = max i = 1 , , n { j = 1 n u i j k } .
Next, the elements of the normalized fuzzy direct strength–influence matrix C ~ k are expressed in the form of a three-dimensional vector:
a ~ i j k = ( l i j k s ,   m i j k s ,   u i j k s )
The next step involves the calculation of the total strength–influence matrix T ~ k .
T ~ k = C ~ k + C ~ k 2 + C ~ k 3 + = C ~ k ( I C ~ k ) 1
I denotes the identity matrix.
T ~ k = { t ~ i j k } ,   t ~ i j k = ( i i j k ,   m i j k ,   u i j k )
Assuming the participation of a group of k-experts in the analysis, k—total strength–influence matrices must be determined.
T ~ k = ( T ~ k l ,   T ~ k m ,   T ~ k u )
The matrices should be entered separately for each component, i.e., left-limited (l), peak-limited (m), and right-limited (u) values.
T ~ k l = C ~ k l ( I C ~ k l ) 1
T ~ k m = C ~ k m ( I C ~ k m ) 1
T ~ k u = C ~ k u ( I C ~ k u ) 1
When expert evaluations do not exhibit a tendency toward overestimation or underestimation, mathematical aggregation using the arithmetic mean can be applied to obtain a clear solution [47].
The fuzzy arithmetic mean operator T ~ is calculated using the following formula [48]:
T ~ = T ~ 1 + T ~ 2 + ( + ) T ~ k K
The fuzzy aggregated total strength–influence matrix is denoted as:
T ~ = t ~ 11 t ~ 1 n t ~ n 1 t ~ n n
where t ~ i j = k = 1 K t ~ i j k K ; these are triangular fuzzy numbers with a membership function μ t ~ i j x 0 ,   1 .
In the next step, the defuzzification of the matrix T ~ should be performed. To sharpen the fuzzy values, the BNP (Best Non-fuzzy Performance) method is proposed. The BNP values are formulated as follows [49,50]:
B N P = l + u l + ( m l ) 3
As a result of the defuzzification process, the total strength–influence matrix T is obtained. In the next stage of the hybrid method, matrix T serves as the control structure for the ANP method.
Matrix T is used to determine the total influence r i of the i-th factor, as well as the total susceptibility c i of the i-th factor.
r i = j = 1 n t i j
c j = j = 1 n t j i
where t i j denotes the elements of matrix T .
For all factors, the sum r i + c i and the difference r i c i are calculated. The computed values are then presented graphically, forming the influence–relation map. The values of r i + c i are plotted on the vertical axis (y-axis), while r i c i are plotted on the horizontal axis (x-axis). The influence–relation map is used to define the structure of dependencies between causes and effects.
To facilitate the interpretation of the influence–relation map, the net total influence–relation matrix is proposed. It is defined as follows:
n i j = t i j t j i       g d y   t i j > t j i 0       g d y   t i j t j i
Based on the net total influence–relation matrix, the net influence–relation map is generated. The map is constructed in the same way as the original influence–relation map.

2.3. Stage Two—ANP Method

The second stage of the analysis involves determining the detailed intensity of individual factors (i.e., negative impacts). For this purpose, elements of the Analytic Network Process (ANP) method were applied [28,51]. ANP was used to define both the detailed influence distributions and the overall influence distribution.
The total influence–significance matrix T (from Stage One—the fuzzy WINGS method) is used as the control structure for the ANP method. Individual factors are compared in pairs in order to differentiate their relative impact. Contextual interpretation is essential for each factor, as the structure may include both feedback and self-loops.
The influence evaluation is conducted using Saaty’s nine-point scale [28,52].
The evaluation matrix A is defined as follows:
A = { a i j } ,   dla   i , j = 1 , ,   n .
The elements of the matrix represent the relative importance of the compared factors with respect to the objective of the analysis. The evaluation matrix is a square matrix, with dimensions corresponding to the number of factors being compared, denoted as n . The elements along the main diagonal are assigned a value of one. The reciprocal condition must be satisfied for all matrix elements:
a i j = 1 a j i
Data normalization involves determining the partial preference values of individual factors using the Simple Geometric Mean Method. For this purpose, the geometric mean of each row in the evaluation matrix A is calculated. The geometric normalization of the weight vector p is assumed:
i = 1 n p i = 1
The partial preference vector is expressed in the form of a geometric mean:
p i = j = 1 n a i j 1 / n
Next, the vector p i is normalized according to the following formula:
p ¯ i = p i i = 1 n p j
The adopted factor influence evaluations (matrix A) should be checked for consistency. To verify consistency, the Geometric Consistency Index (GCI) should be calculated [53]. The GCI value should not exceed the threshold value established for the given number of analyzed factors, referred to as attributes. Consistency is checked using the following formula:
G C I   ( A i ,   p i ) < G C I d o p ( n ) ,
where n is the number of analyzed factors (attributes).
The Geometric Consistency Index (GCI) is calculated using the following formula:
G C I = 2 ( n 1 ) ( n 2 ) i = 1 n 1 j = i + 1 n ln p i p j ln a i j 2
The acceptable GCI values G C I d o p n are presented in Table 5.
If the consistency condition is satisfied, the partial ranking of the given factor can be presented. To do so, the calculations must be repeated from the beginning of the ANP method.
After determining all partial rankings of the analyzed factors, the main matrix of the ANP method—matrix S —is constructed. The columns of this matrix are formed by the previously calculated normalized weight vectors p ¯ i for each factor. The matrix takes the following form:
S = p ¯ i p ¯ i + 1     p ¯ i + 2       p ¯ n
The limit supermatrix is determined by calculating successive powers of matrix S :
S l i m = lim k S k
The approximation process of the limit supermatrix S l i m is completed when the following condition is satisfied:
max ij = 1,2 , , n S i j ( k ) S i j ( k ) ε
Assuming an acceptable tolerance level:
ε 0.0001
After computing successive powers, the limit supermatrix corresponding to the assumed tolerance level ε is obtained.
S l i m = P     P     P     P ,
where P denotes the vector of overall factor preferences. Based on this vector, the final overall ranking of the factors is determined, reflecting the intensity of the analyzed factors.

3. Implementation of the Fuzzy WINGS–ANP Hybrid Method for Assessing Negative Impacts Occurring During Open Caisson Sinking

3.1. Set of Analyzed Factors

For the analysis, the previously defined negative impacts occurring during open caisson sinking were adopted as the set of factors:
  • Ground settlement outside the open caisson (GS);
  • Damage or destruction of adjacent structures (DD);
  • Tilting of the open caisson from the vertical (TS);
  • Lateral displacement of the open caisson (LD);
  • Uncontrolled sinking of the open caisson (US);
  • Structural damage to the open caisson (e.g., cracking or spalling) (SD);
  • Damage to the base of the open caisson (including cutting edge failure) (DB);
  • Detachment of the bottom ring of the open caisson (DR);
  • Flotation or uplift of the open caisson (FU);
  • Freezing of the open caisson to surrounding soil (FS);
  • Hanging of the open caisson due to high side friction (HC);
  • Complete failure or collapse of the open caisson (CF).

3.2. Expert Analysis

Due to the difficult-to-measure nature of the analyzed factors, the author was required to collect data and determine both the significance and mutual influence of the factors using an expert-based method. The expert analysis was conducted using an online questionnaire distributed via email to a group of pre-identified experts. Given the highly specialized nature of the study, purposive sampling was selected over random sampling. Random selection was deliberately excluded, as the author aimed to gather a group of experts characterized by in-depth knowledge and many years of experience in the design and execution of large-diameter open caisson shafts. Defining the appropriate size of a random sample would have been problematic in this case, and verifying the qualifications of randomly selected respondents would have been virtually impossible. Therefore, a nomination-based approach was adopted to form a purposive sample consisting of five independent experts. Their professional experience amounted to 10, 12, 17, 22, and 50 years, respectively. All of the selected experts had been involved in the execution of open caisson shafts with diameters exceeding 3 m and had collectively participated in more than 200 projects using this method. Before the assessment, the experts were introduced to the principles of the method and the evaluation scale. The online questionnaire consisted of two parts (with a total of 144 questions). The first part included 132 questions aimed at assessing mutual influence between factors. A predefined list of 12 previously identified negative impacts was provided, and the experts evaluated their mutual relationships and indicated the direction of influence between them. The second part consisted of 12 questions designed to determine the significance (weight) of each factor. The experts estimated the probability of occurrence for each negative impact. They compared the factors in pairs, assigning both influence ratings and directions using a five-level linguistic scale: no influence, low influence, medium influence, high influence, and very high influence. The probabilities were expressed using the following linguistic terms and approximate ranges: rare (0–20%), unlikely (21–40%), moderate (41–60%), likely (61–80%), and almost certain (81–100%). The use of a linguistic evaluation scale simplified the assessment process. Verbal evaluations were later transformed into corresponding numerical values, described using type-1 triangular fuzzy numbers, and subsequently used to construct the fuzzy direct influence–significance matrices, in accordance with the fuzzy WINGS method.

3.3. Results and Discussion of the Hybrid Fuzzy WINGS–ANP Method

As a result of the calculations performed in accordance with the previously presented formulas (1)–(13), the total influence–relation matrix T was obtained (Table 6). In the next stage, matrix T will be used as the control structure for the ANP method.
The net influence–relation map (Figure 3) was developed based on the total influence–relation matrix T . It represents a simplified version in which the significance and influence of low-relevance factors in the analysis were omitted.
Based on the simplified net total influence–relation matrix, Table 7 was developed, containing the values of the total involvement r i + c i and total role r i c i of the components.
By analyzing the net influence–relation map (Figure 3) and Table 6, it can be concluded that the negative impact with the highest score in the total involvement ranking ( r i + c i ) and the greatest influence on other factors was open caisson flotation (FU). Open caisson flotation was identified as a strong cause, leading to as many as eleven other negative impacts. On the other hand, open caisson tilting (TS) was clearly identified as an effect, resulting from ten other negative impacts.
The global graph—Figure 4—illustrates the structure of cause-and-effect relationships between the negative impacts. To clearly depict the variation in influence intensity, different types of lines were used. The non-zero net influence values were divided into five groups, with each group assigned a specific line style:
0 < n i j 0.001 —dotted line;
0.001 < n i j 0.002 —dense dotted line;
0.002 < n i j 0.004 —dashed line;
0.004 < n i j 0.006 —thin solid line;
0.006 < n i j 0.008 —thick solid line.
The presented graph is a visual interpretation of the cause-and-effect relationships between negative impacts occurring during open caisson sinking. As a result of the first stage of the method, the analyzed negative impacts were classified into causal and effect-type factors. The directions of influence were determined, and cause-and-effect chains were identified. Caisson flotation (FU) was found to be the factor contributing to the greatest number of negative impacts, while structural damage to the open caisson (SD) was identified as the most frequent result of other negative effects.
The outcome of the second stage of the analysis is presented in Figure 5. The figure is divided into 13 panels, each showing the intensity of negative impacts in the context of a specific impact. The negative effects are marked with colors and acronyms. The final chart represents the overall distribution of all negative impacts.
Summarizing the results obtained for ground settlement outside the open caisson (GS) (the first chart panel), it can be concluded that the impacts with the highest and equal intensity in this context were damage or destruction of adjacent structures (DD), tilting of the open caisson from the vertical (TS), and uncontrolled sinking of the open caisson (US). The intensity of other negative impacts was relatively low. It should be noted that feedback loops were present in the intensity plot, which are common phenomena and may be omitted in interpretation.
In the next context, namely, damage or destruction of adjacent structures (DD), the highest intensity was clearly associated with uncontrolled sinking of the open caisson (US). Significant influence was also found from tilting of the open caisson from the vertical (TS), lateral displacement of the open caisson (LD), structural damage to the open caisson (SD), damage to the base of the open caisson (DB), detachment of the bottom ring of the open caisson (DR), and complete failure or collapse of the open caisson (CF). The effects of hanging of the open caisson due to high side friction (HC) and ground settlement outside the open caisson (GS) should also be considered.
For tilting of the open caisson from the vertical (TS), the highest intensity impact was structural damage to the open caisson (SD). Slightly lower intensities were observed for lateral displacement (LD), uncontrolled sinking (US), damage to the base (DB), and detachment of the bottom ring (DR). Notable influence was also exerted by ground settlement (GS) and complete failure (CF).
In the case of lateral displacement of the open caisson (LD), the intensity levels were relatively even. The highest value was for tilting of the open caisson (TS), followed closely by structural damage (SD), damage to the base (DB), detachment of the bottom ring (DR), and flotation or uplift of the open caisson (FU). These were followed by complete failure (CF) and ground settlement (GS).
In the context of uncontrolled sinking of the open caisson (US), intensities remained fairly consistent. The most intense were tilting of the open caisson (TS), structural damage (SD), damage to the base (DB), hanging of the open caisson (HC), and complete failure (CF)—all with similar intensity. Slightly lower values were noted for ground settlement (GS), damage to adjacent structures (DD), and lateral displacement (LD). Detachment of the bottom ring (DR) was also noted.
In the assessment of structural damage to the open caisson (SD), two impacts stood out with significantly higher intensity: detachment of the bottom ring (DR) and complete failure (CF). Damage to the base (DB) also showed strong influence. Other impacts had considerably lower values.
For damage to the base of the open caisson (DB), the highest intensity was associated with complete failure or collapse of the open caisson (CF). Lower but notable influences came from tilting of the caisson (TS), structural damage (SD), and detachment of the bottom ring (DR).
In the case of detachment of the bottom ring of the open caisson (DR), the most intense factor was damage to the base (DB), followed by uncontrolled sinking (US) and tilting (TS). Also influential were complete failure (CF), structural damage (SD), ground settlement (GS), lateral displacement (LD), and flotation (FU).
For flotation or uplift of the open caisson (FU), the highest intensity was recorded for three impacts: tilting (TS), structural damage (SD), and complete failure (CF). Also relevant were lateral displacement (LD), ground settlement (GS), damage to adjacent structures (DD), and damage to the base (DB).
In the case of freezing of the open caisson to surrounding soil (FS), lateral displacement (LD) showed clear dominance. Other influences included hanging (HC), structural damage (SD), ground settlement (GS), and tilting (TS).
In the context of hanging of the open caisson due to high side friction (HC), the most intense impact was uncontrolled sinking (US), followed by tilting (TS). Also notable were lateral displacement (LD), structural damage (SD), detachment of the bottom ring (DR), damage to the base (DB), and ground settlement (GS).
Assessing complete failure or collapse of the open caisson (CF), the highest intensity was caused by structural damage (SD). Slightly lower were ground settlement (GS), damage to adjacent structures (DD), tilting (TS), uncontrolled sinking (US), damage to the base (DB), and detachment of the bottom ring (DR).
Analyzing the overall distribution (OD) of intensity values for all factors, the most dominant was tilting of the open caisson from the vertical (TS). It was followed by structural damage (SD), damage to the base (DB), detachment of the bottom ring (DR), and complete failure (CF). Slightly lower values were recorded for ground settlement (GS), lateral displacement (LD), and uncontrolled sinking (US). Hanging (HC) followed, while freezing (FS) and flotation (FU) showed the least contribution to the overall distribution.
A detailed reflection on Figure 5 reveals distinct patterns of influence intensity among the analyzed negative impacts. In particular, tilting of the open caisson from the vertical (TS) emerges as the most dominant factor in the overall distribution, followed by structural damage (SD), damage to the base (DB), detachment of the bottom ring (DR), and complete failure (CF). These outcomes suggest that special attention should be given to vertical alignment and structural integrity during the sinking process, as these aspects are most closely associated with cascading negative effects.
The charts further show that some factors, such as ground settlement (GS) or freezing (FS), tend to exert lower overall influence, although their presence may still indicate problematic conditions. The findings can be used in practice to prioritize monitoring efforts, especially for impacts with high intensities, such as TS, SD, and US. For instance, the early detection of tilting or base damage may serve as a warning signal for more severe outcomes, including collapse.
The insights from this visual and quantitative assessment enable better allocation of resources during both the design and construction phases, guiding targeted interventions to mitigate the most critical risks.
Summarizing the second stage of the method, it can be concluded that tilting of the open caisson (TS) was the dominant impact both in overall distribution and in individual analyses. It was followed by lateral displacement (LD) and complete failure (CF). Flotation (FU) and freezing (FS) ranked lowest (Table 8).
The summary of both stages of analysis is presented in Table 8. The highest-ranked factor overall was tilting of the open caisson from the vertical (TS). Next were lateral displacement (LD), complete failure (CF), structural damage (SD), damage to the base (DB), and uncontrolled sinking (US). Flotation (FU) and freezing (FS) received the lowest scores. Detailed results are provided in Table 9.

4. Conclusions

The subject of this manuscript concerned the negative impacts that occur during the sinking of open caissons. The primary objective was to determine the cause-and-effect relationships and the intensity of these impacts. For this purpose, a hybrid multi-criteria method was developed, combining fuzzy WINGS with the Analytic Network Process (ANP). The proposed method enabled the resolution of a complex decision-making problem involving hard-to-measure factors and uncertain conditions by incorporating fuzzy logic components. Group-based expert evaluation was also introduced to increase the objectivity of the assessments.
The development of the evaluation model required the prior identification and characterization of negative impacts, which was accomplished in the author’s earlier publication. These impacts were distinguished through a literature review, case studies, expert consultations, and direct field observations.
A critical review of the literature led to the following conclusions:
Hard-to-measure factors can be addressed through pairwise comparisons.
Utility-based methods are suitable for evaluating complex decision-making problems involving such factors.
Existing methods do not simultaneously support the identification of cause-and-effect relationships and the assessment of factor intensity.
Under uncertain conditions and diverging expert opinions, fuzzy logic proves effective.
The combination of fuzzy WINGS and ANP is suitable for analyzing both causal relationships and the intensity of impacts.
It should be emphasized that the analyzed negative impacts in this study have been treated as symptoms of technical and execution-related problems that may occur during the implementation of open caissons. A full root cause analysis would require detailed information about site conditions, construction methods, supervision practices, and design parameters. However, the proposed method can serve as a preliminary tool to support the identification of potential hazards and indicate areas where more in-depth causal analysis may be needed.
As a result of the conducted research and analysis
A comprehensive decision-making approach was developed to process imprecise and incomplete data specific to the evaluated task;
A universal analytical tool was created, which can also be applied to other complex decision problems involving the need to determine causal relationships and factor intensities.
Additional conclusions and practical implications:
The hybrid method supports engineering teams in making informed decisions about preventive and corrective measures during construction execution.
The method can be adapted to other geotechnical and construction technologies (e.g., microtunneling or deep foundations) where uncertainty and complex interdependencies are present.
The findings provide a strong foundation for developing risk management scenarios, contingency plans, and monitoring procedures.
The method contributes to sustainable construction practices by improving process quality, reducing execution errors, and enhancing safety and material efficiency.
Due to its structure, the method may be integrated into digital monitoring systems (e.g., BIM or IoT platforms) to enable real-time impact analysis and decision support.
In future studies, the author plans to explore fuzzy ANP structures that preserve uncertainty throughout the entire decision-making process, eliminating the need for defuzzification and, consequently, the simplification of data. This approach will allow for a more accurate representation of complex relationships between factors and enhance the reliability of results under conditions of uncertainty.
In future research, consistency indices tailored to fuzzy data will be considered, or a stability analysis of expert assessments will be conducted prior to defuzzification, in order to account for the uncertainty level that is not captured by traditional ANP consistency verification.
In future work, the proposed method may be expanded to include an additional step aimed at directly assigning risk levels to the identified negative impacts. This enhancement would support more comprehensive risk management in construction projects conducted under uncertainty.

Funding

This research received no external funding.

Institutional Review Board Statement

Not applicable.

Informed Consent Statement

Not applicable.

Data Availability Statement

Data are contained within the article.

Conflicts of Interest

The author declares no conflicts of interest.

References

  1. Safiullah, A.M.M. Geotechnical Problems of Bridge Construction in Bangladesh. In Proceedings of the Japan-Bangladesh Joint Seminar on Advances in Bridge Engineering, Dhaka, Bangladesh, 10 August 2005; pp. 135–146. [Google Scholar]
  2. Allenby, D.; Waley, G.; Kilburn, D. Examples of Open Caisson Sinking in Scotland. Proc. Inst. Civ. Eng. Geotech. Eng. 2009, 162, 59–70. [Google Scholar] [CrossRef]
  3. Abdrabbo, F.; Gaaver, K. Challenges and Uncertainties Relating to Open Caissons. DFI J.—J. Deep Found. Inst. 2012, 6, 21–32. [Google Scholar] [CrossRef]
  4. Royston, R.; Sheil, B.B.; Byrne, B.W. Monitoring the Construction of a Large-Diameter Caisson in Sand. Proc. Inst. Civ. Eng. Geotech. Eng. 2022, 175, 323–339. [Google Scholar] [CrossRef]
  5. Abdrabbo, F.M.; Gaaver, K.E. Applications of the Observational Method in Deep Foundations. Alex. Eng. J. 2012, 51, 269–279. [Google Scholar] [CrossRef]
  6. Dachowski, R.; Gałek-Bracha, K. Determination of the Occurrence of Negative Impacts during Lowering of Sinking Wells Using the Fuzzy TOPSIS Method. Sustainability 2024, 16, 899. [Google Scholar] [CrossRef]
  7. Chen, W.; Ma, J.; Wang, Q.; Jiang, B. Experimental Study on the Lateral Distribution of the Sidewall Friction of Large and Deep-Water Caissons. Mar. Georesour. Geotechnol. 2022, 40, 392–403. [Google Scholar] [CrossRef]
  8. Jiang, B.N.; Wang, M.T.; Chen, T.; Zhang, L.L.; Ma, J.L. Experimental Study on the Migration Regularity of Sand Outside a Large, Deep-Water, Open Caisson during Sinking. Ocean Eng. 2019, 193, 106601. [Google Scholar] [CrossRef]
  9. Kudella, P. Senkkästen. In Grundbau-Taschenbuch; Witt, K.J., Ed.; Wiley: Hoboken, NJ, USA, 2018. [Google Scholar] [CrossRef]
  10. Lai, F.; Zhang, N.; Liu, S.; Sun, Y.; Li, Y. Ground Movements Induced by Installation of Twin Large Diameter Deeply-Buried Caissons: 3D Numerical Modeling. Acta Geotech. 2021, 16, 2933–2961. [Google Scholar] [CrossRef]
  11. Saha, G.P. The Sinking of Well Foundations in Difficult Situations. J. Indian Road Congr. 2007, 68, 123–131. [Google Scholar]
  12. Li, P.; Song, E.; Zheng, T. Initial Sinking Method for Large Open Caisson in a Highway Bridge Project; Springer International Publishing: Berlin/Heidelberg, Germany, 2018; Volume 2, ISBN 9783319971148. [Google Scholar]
  13. Nonveiller, E. Open Caissons for Deep Foundations. J. Geotech. Eng. 1987, 113, 424–439. [Google Scholar] [CrossRef]
  14. Mordovets, E.E.; Permyakov, Y.V.; Shkol’nikov, D.B.; Geukharov, L.M. Sinking a Prefabricated Reinforced-Concrete Well in a Thixotropic Jacket. Soil Mech. Found. Eng. 1970, 7, 185–187. [Google Scholar] [CrossRef]
  15. Zhang, J. Numerical Simulation on the Whole Sinking Process of Open Caisson with an Improved SPH Method. Math. Probl. Eng. 2021, 2021, 6699880. [Google Scholar] [CrossRef]
  16. Lenzi, M.; Halsegger, W.; Semprich, S. Experimental and Numerical Investigations of the Guided Caisson Method Recherches Expérimentales et Numériques Sur La Méthode Du Caisson Guidé; IOS Press: Amsterdam, The Netherlands, 2006; pp. 1625–1628. [Google Scholar] [CrossRef]
  17. Chavda, J.T.; Mishra, S.; Dodagoudar, G.R. Experimental Evaluation of Ultimate Bearing Capacity of the Cutting Edge of an Open Caisson. Int. J. Phys. Model. Geotech. 2020, 20, 281–294. [Google Scholar] [CrossRef]
  18. Alampalli, S.; Venkatanarayana, P. Laboratory Investigation on Caissons-Deformations and Vertical Load Distributions. Soils Found. 1997, 37, 61–69. [Google Scholar] [CrossRef]
  19. Ter-Galustov, S.A.; Ponomarenko, A.I.; Opershtein, V.L.; Ivanov, V.D. Experience in Sinking an Open Caisson in a Thixotropic Lining. Soil Mech. Found. Eng. 1966, 3, 128–131. [Google Scholar] [CrossRef]
  20. Zhu, S.; Nan, H.; Zheng, Y. Research and Application of BIM Cloud Monitoring System for Open Caisson Construction of Super Large Bridge. IOP Conf. Ser. Earth Environ. Sci. 2020, 510, 2–6. [Google Scholar] [CrossRef]
  21. Jiang, B.; Ma, J.; Chu, J. The Influence of Soil Surrounding the Caisson Cutting Edge to Excavation and Sinking. In Proceedings of the International Conference on Geotechnical and Earthquake Engineering, Chongqing, China, 20–21 October 2018; pp. 435–448. [Google Scholar]
  22. Sun, Y.; Su, J.B.; Xia, X.; Xu, Z. Numerical Analysis of Soil Deformation behind the Reaction Wall of an Open Caisson Induced by Horizontal Parallel Pipe-Jacking Construction. Can. Geotech. J. 2015, 52, 2008–2016. [Google Scholar] [CrossRef]
  23. Lai, F.; Liu, S.; Deng, Y.; Sun, Y.; Wu, K.; Liu, H. Numerical Investigations of the Installation Process of Giant Deep-Buried Circular Open Caissons in Undrained Clay. Comput. Geotech. 2020, 118, 103322. [Google Scholar] [CrossRef]
  24. Royston, R.; Phillips, B.; Sheil, B.; Byrne, B. Bearing Capacity beneath Tapered Blades of Open Dug Caissons in Sand. Civ. Eng. Res. Irel. 2016, 2016, 473–478. [Google Scholar]
  25. Sheil, B.; Royston, R.; Byrne, B. Real-Time Monitoring of Large-Diameter Caissons; Springer International Publishing: Berlin/Heidelberg, Germany, 2018; Volume 1, ISBN 9783319971124. [Google Scholar]
  26. Dachowski, R.; Gałek, K. Risk of Emergency Situations of Underground Objects in the Perspective of Multi-Criteria Decision Making. Arch. Civ. Eng. 2019, 65, 149–162. [Google Scholar] [CrossRef]
  27. Ginda, G. Metody Porównywania Parami w Budownictwie i Dziedzinach Pokrewnych; Dolnośląskie Wydawnictwo Edukacyjne: Wrocław, Poland, 2015. [Google Scholar]
  28. Saaty, T.L. The Analytic Hierarchy Process: Planning, Priority Setting, Resource Allocation; McGraw-Hill International Book Company: New York, NY, USA, 1980. [Google Scholar]
  29. Sun, C.; Chen, L.; Xiao, J.; Liu, Q.; Zuo, J. Low-Carbon and Fundamental Properties of Eco-Efficient Mortar with Recycled Powders. Materials 2021, 14, 7503. [Google Scholar] [CrossRef] [PubMed]
  30. Wu, J.; Zhang, W.; Han, J.; Liu, Z.; Liu, J.; Huang, Y. Experimental Research on Crack Resistance of Steel–Polyvinyl Alcohol Hybrid Fiber-Reinforced Concrete. Materials 2024, 17, 3097. [Google Scholar] [CrossRef]
  31. Skrzek, K.; Mazgajczyk, E.; Dybała, B. Application of Fuzzy Logic-Based Expert Advisory Systems in Optimizing the Decision-Making Process for Material Selection in Additive Manufacturing. Materials 2025, 18, 324. [Google Scholar] [CrossRef]
  32. Gabus, A.; Fontela, E. World Problems, an Invitation to Further Thought Within the Framework of DEMATEL; Battelle Geneva Res. Center: Geneva, Switzerland, 1972. [Google Scholar]
  33. Michnik, J. Weighted Influence Non-Linear Gauge System (WINGS)-An Analysis Method for the Systems of Interrelated Components. Eur. J. Oper. Res. 2013, 228, 536–544. [Google Scholar] [CrossRef]
  34. Sagan, J.; Sobotka, A. Analysis of Factors Affecting the Circularity of Building Materials. Materials 2021, 14, 7296. [Google Scholar] [CrossRef] [PubMed]
  35. Pacana, A.; Siwiec, D. Method of Determining Sequence Actions of Products Improvement. Materials 2022, 15, 6321. [Google Scholar] [CrossRef]
  36. Radziszewska-Zielina, E.; Śladowski, G. Supporting the Selection of a Variant of the Adaptation of a Historical Building with the Use of Fuzzy Modelling and Structural Analysis. J. Cult. Herit. 2017, 26, 53–63. [Google Scholar] [CrossRef]
  37. Śladowski, G. Selected Cases of Modeling and Structural Analysis of Decision Problems in the Construction Sector. Przegląd Bud. 2023, 94, 98–102. [Google Scholar] [CrossRef]
  38. Singh, T.; Goswami, C.; Patnaik, A.; Lendvai, L. Optimal Design of Ceramic Based Hip Implant Composites Using Hybrid AHP-MOORA Approach. Materials 2022, 15, 3800. [Google Scholar] [CrossRef]
  39. Fuse, K.; Dalsaniya, A.; Modi, D.; Vora, J.; Pimenov, D.Y.; Giasin, K.; Prajapati, P.; Chaudhari, R.; Wojciechowski, S. Integration of Fuzzy AHP and Fuzzy TOPSIS Methods for Wire Electric Discharge Machining of Titanium (Ti6Al4V) Alloy Using RSM. Materials 2021, 14, 7408. [Google Scholar] [CrossRef]
  40. Janowska-Renkas, E.; Jakiel, P.; Fabianowski, D.; Matyjaszczyk, D. Optimal Selection of High-Performance Concrete for Post-Tensioned Girder Bridge Using Advanced Hybrid MCDA Method. Materials 2021, 14, 6553. [Google Scholar] [CrossRef] [PubMed]
  41. Balsara, S.; Jain, P.K.; Ramesh, A. An Integrated Approach Using AHP and DEMATEL for Evaluating Climate Change Mitigation Strategies of the Indian Cement Manufacturing Industry. Environ. Pollut. 2019, 252, 863–878. [Google Scholar] [CrossRef] [PubMed]
  42. Tseng, M.L. Application of ANP and DEMATEL to Evaluate the Decision-Making of Municipal Solid Waste Management in Metro Manila. Environ. Monit. Assess. 2009, 156, 181–197. [Google Scholar] [CrossRef] [PubMed]
  43. Azizi, A.; Malekmohammadi, B.; Jafari, H.R.; Nasiri, H.; Amini Parsa, V. Land Suitability Assessment for Wind Power Plant Site Selection Using ANP-DEMATEL in a GIS Environment: Case Study of Ardabil Province, Iran. Environ. Monit. Assess. 2014, 186, 6695–6709. [Google Scholar] [CrossRef]
  44. Michnik, J. Wielokryterialne Metody Wspomagania Decyzji w Procesie Innowacji; Wydawnictwo Uniwersytetu Ekonomicznego w Katowicach: Katowice, Poland, 2013. [Google Scholar]
  45. Śladowski, G. Wielokryterialny Model Decyzyjny Wyboru Funkcji Użytkowej w Adaptacji Budynków Zabytkowych. 2017. Available online: https://repozytorium.biblos.pk.edu.pl/resources/26164 (accessed on 23 June 2025).
  46. Li, R.J. Fuzzy Method in Group Decision Making. Comput. Math. Appl. 1999, 38, 91–101. [Google Scholar] [CrossRef]
  47. Prusak, A.; Stefanów, P. AHP-Analityczny Proces Hierarchiczny. Budowa i Analiza Modeli Decyzyjnych Krok Po Kroku; Ekonomia Zarządzanie C.H.Beck: Warszawa, Poland, 2014; ISBN 978-83-255-6072-0. [Google Scholar]
  48. Lin, C.J.; Wu, W.W. A Causal Analytical Method for Group Decision-Making under Fuzzy Environment. Expert Syst. Appl. 2008, 34, 205–213. [Google Scholar] [CrossRef]
  49. Muhammad, M.N.; Cavus, N. Fuzzy DEMATEL Method for Identifying LMS Evaluation Criteria. Procedia Comput. Sci. 2017, 120, 742–749. [Google Scholar] [CrossRef]
  50. Tzeng, G.; Huang, J. Multiaple Atribute Decision Making. Methods and Applications; Chapman and Hall/CRC: New York, NY, USA, 2011; ISBN 9781439861578. [Google Scholar]
  51. Saaty, T.L. The Analytic Hierarchy Process (AHP) for Decision Making and the Analytic Network Process (ANP) for Decision Making with Dependence and Feedback; Creative Decisions Foundation: Pittsburgh, PA, USA, 2003. [Google Scholar]
  52. Stoltmann, A. Zastosowanie Metody AHP Do Porównania Kryteriów Wyboru Lokalizacji Budowy Farmy Wiatrowej. Zesz. Nauk. Wydz. Elektroetchniki Autom. Politech. Gdańskiej 2015, 42, 187–190. [Google Scholar]
  53. Aguarón, J.; Moreno-Jiménez, J.M. The Geometric Consistency Index: Approximated Thresholds. Eur. J. Oper. Res. 2003, 147, 137–145. [Google Scholar] [CrossRef]
  54. Crawford, G.; Williams, C. A Note on the Analysis of Subjective Judgment Matrices. J. Math. Psychol. 1985, 29, 387–405. [Google Scholar] [CrossRef]
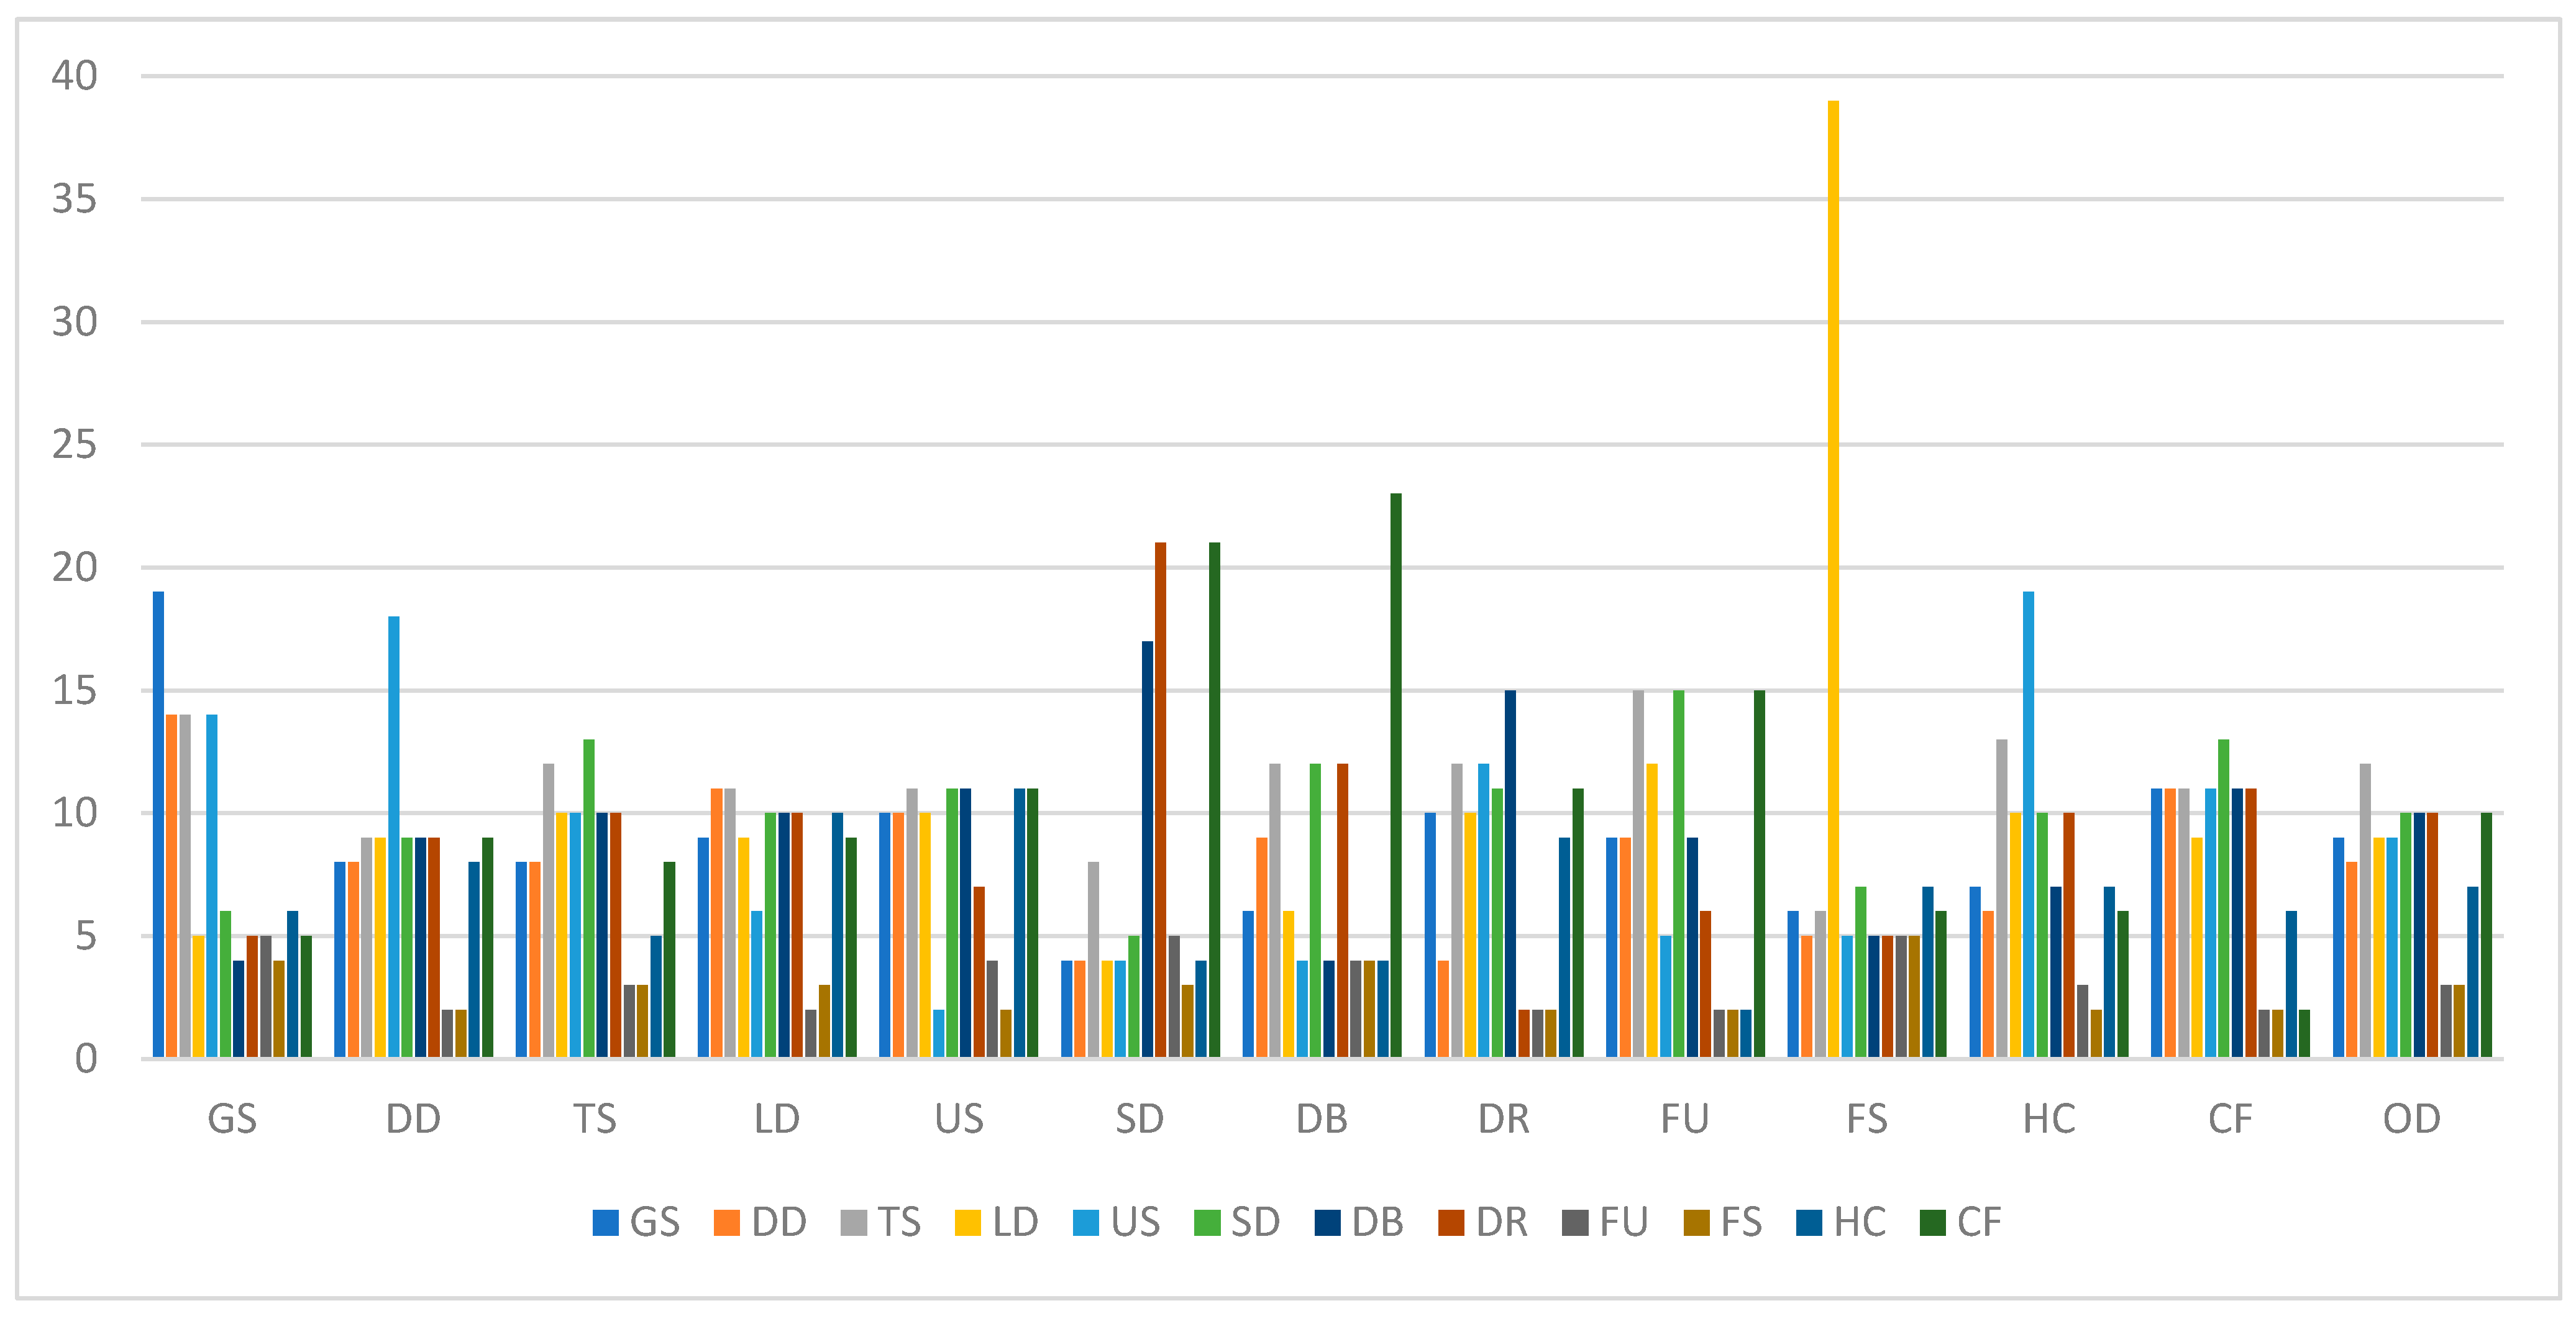
Figure 1. Diagram of the hybrid method.
Sustainability 17 05848 g001
Figure 2. Triangular fuzzy numbers with corresponding linguistic terms.
Sustainability 17 05848 g002
Figure 3. Net influence–relation map.
Sustainability 17 05848 g003
Figure 4. Structure of cause-and-effect relationships between negative impacts occurring during open caisson sinking.
Sustainability 17 05848 g004
Figure 5. Intensity of negative impacts occurring during open caisson sinking.
Sustainability 17 05848 g005
Table 1. Negative impacts occurring during open caisson sinking.
ArticleNegative Impacts
GSDDTSLDUSSDDBDRFUFSHCCF
Abdrabbo, Gaaver, 2014 [3] ++ +
Royston, Byrne, Sheil, 2022 [4]+ + + + +
Allenby, Waley, Kilburn, 2009 [2]+ + +++
Chen, Ma, Wang, Jiang, 2021 [7] + +
Jiang, Wang, Chen, Zhang, Ma, 2019 [8] + +
Kudella, 2018 [9]+++ + +
Lai, Zhang, Liu et al., 2021 [10]+
Saha, 2005 [11] ++++
Peng, Song, 2018 [12]+ +
Nonveiller, 1987 [13]+ + + +
Mordovets, Permyakov et al., 1970 [14] + +
Zhang, 2021 [15]+ +
Lenzi, Halsegger, Semprich, 2005 [16] +
Chavda, Mishra Dodagoudar, 2019 [17]+ +++ ++
Alampalli, Peddibotla, 1997 [18]+
Ter-Galustov, et al., 1966 [19] + +
Zhu, Nan, Zheng, 2020 [20]+ +
Jiang, Ma, Chu, 2018 [21]+ + +
Abdrabbo, Gaaver, 2012 [3] + +
Susn, Su, Xia, Xu, 2015 [22]+
Lai, Liu, Deng et al. [23]+
Royston, Phillips, Sheil, Byrne, 2016 [24]+
Sheil, Royston, Byrne, 2018 [25]+ + + +
Dachowski, Gałek, 2019 [26] + ++ +++
Dachowski, Gałek-Bracha, 2024 [6]++++++++++++
Table 2. Summary of negative impact abbreviations and their full descriptions.
SymbolNegative Impacts
GSGround settlement outside the open caisson
DDDamage or destruction of adjacent structures
TSTilting of the open caisson from the vertical
LDLateral displacement of the open caisson
USUncontrolled sinking of the open caisson
SDStructural damage to the open caisson (e.g., cracking or spalling)
DBDamage to the base of the open caisson (including cutting edge failure)
DRDetachment of the bottom ring of the open caisson
FUFlotation or uplift of the open caisson
FSFreezing of the open caisson to surrounding soil
HCHanging of the open caisson due to high side friction
CFComplete failure or collapse of the open caisson
Table 3. Characteristics of selected MCDM techniques.
MethodExpanded Method NameDescriptionAdvantagesLimitations
AHPAnalytic Hierarchy ProcessAnalytic Hierarchy Process for pairwise comparisons and hierarchy structuring.Simple, structured decision support; intuitive pairwise comparisons.Does not handle feedback loops; subjective input.
Fuzzy AHPFuzzy Analytic Hierarchy ProcessFuzzy extension of AHP for uncertain and qualitative judgments.Handles vagueness and imprecision in expert input.Defuzzification may reduce information richness.
DEMATELDecision Making Trial and Evaluation LaboratoryDetermines interdependencies among factors using pairwise comparisons.Reveals cause–effect relationships; visual representation.Limited to influence structure; may oversimplify relationships.
WINGSWeighted Influence Non-linear Gauge SystemEnhancement of DEMATEL with intensity measurement of influences.Captures strength of influence; useful in systems with feedback.Complex interpretation; requires intensity calibration.
Fuzzy WINGSFuzzy Weighted Influence Non-linear Gauge SystemFuzzy version of WINGS allowing uncertainty in influence intensity.Accounts for uncertainty and interrelations with fuzziness.Sensitive to fuzzy set definitions and thresholds.
MOORAMulti-Objective Optimization by Ratio AnalysisMulti-Objective Optimization method for ratio analysis.Efficient ranking in multi-criteria decisions.Ignores factor interdependencies.
TOPSISTechnique for Order of Preference by Similarity to Ideal SolutionRanks alternatives based on their proximity to an ideal best and distance from an ideal worst solution.Effective in ranking and selection problems.May oversimplify in presence of complex dependencies.
Fuzzy TOPSISFuzzy Technique for Order of Preference by Similarity to Ideal SolutionFuzzy extension of TOPSIS for decision-making under uncertainty.Improves decision accuracy under uncertainty.Depends on fuzzy set definitions; computationally intensive.
EA FAHPExtent Analysis Fuzzy Analytic Hierarchy ProcessEnhanced Fuzzy AHP integrating fuzzy logic in high-strength concrete mix design.Customizable for specific concrete design optimization.Requires detailed fuzzy modeling and validation.
ANPAnalytic Network ProcessAnalytic Network Process allowing for interdependent network structures.Considers feedback and complex interdependencies.Needs careful structure definition; complex for large systems.
Hybrid AHP-DEMATELHybrid Analytic Hierarchy Process–Decision Making Trial and Evaluation LaboratoryCombines AHP and DEMATEL to evaluate complex strategies.Allows integrated causal and hierarchical analysis.Integration complexity; needs clear interface definition.
Hybrid ANP-DEMATELHybrid Analytic Network Process–Decision Making Trial and Evaluation LaboratoryIntegrates ANP and DEMATEL within GIS or decision systems.Supports layered interdependent analysis in spatial contexts.High data and processing requirements.
Fuzzy WINGS + ANPFuzzy Weighted Influence Non-linear Gauge System + Analytic Network ProcessHybrid approach combining fuzzy WINGS and ANP for causal and intensity analysis.Combines causal mapping and intensity evaluation under uncertainty.Still under validation.
Table 4. Linguistic evaluation scale [45].
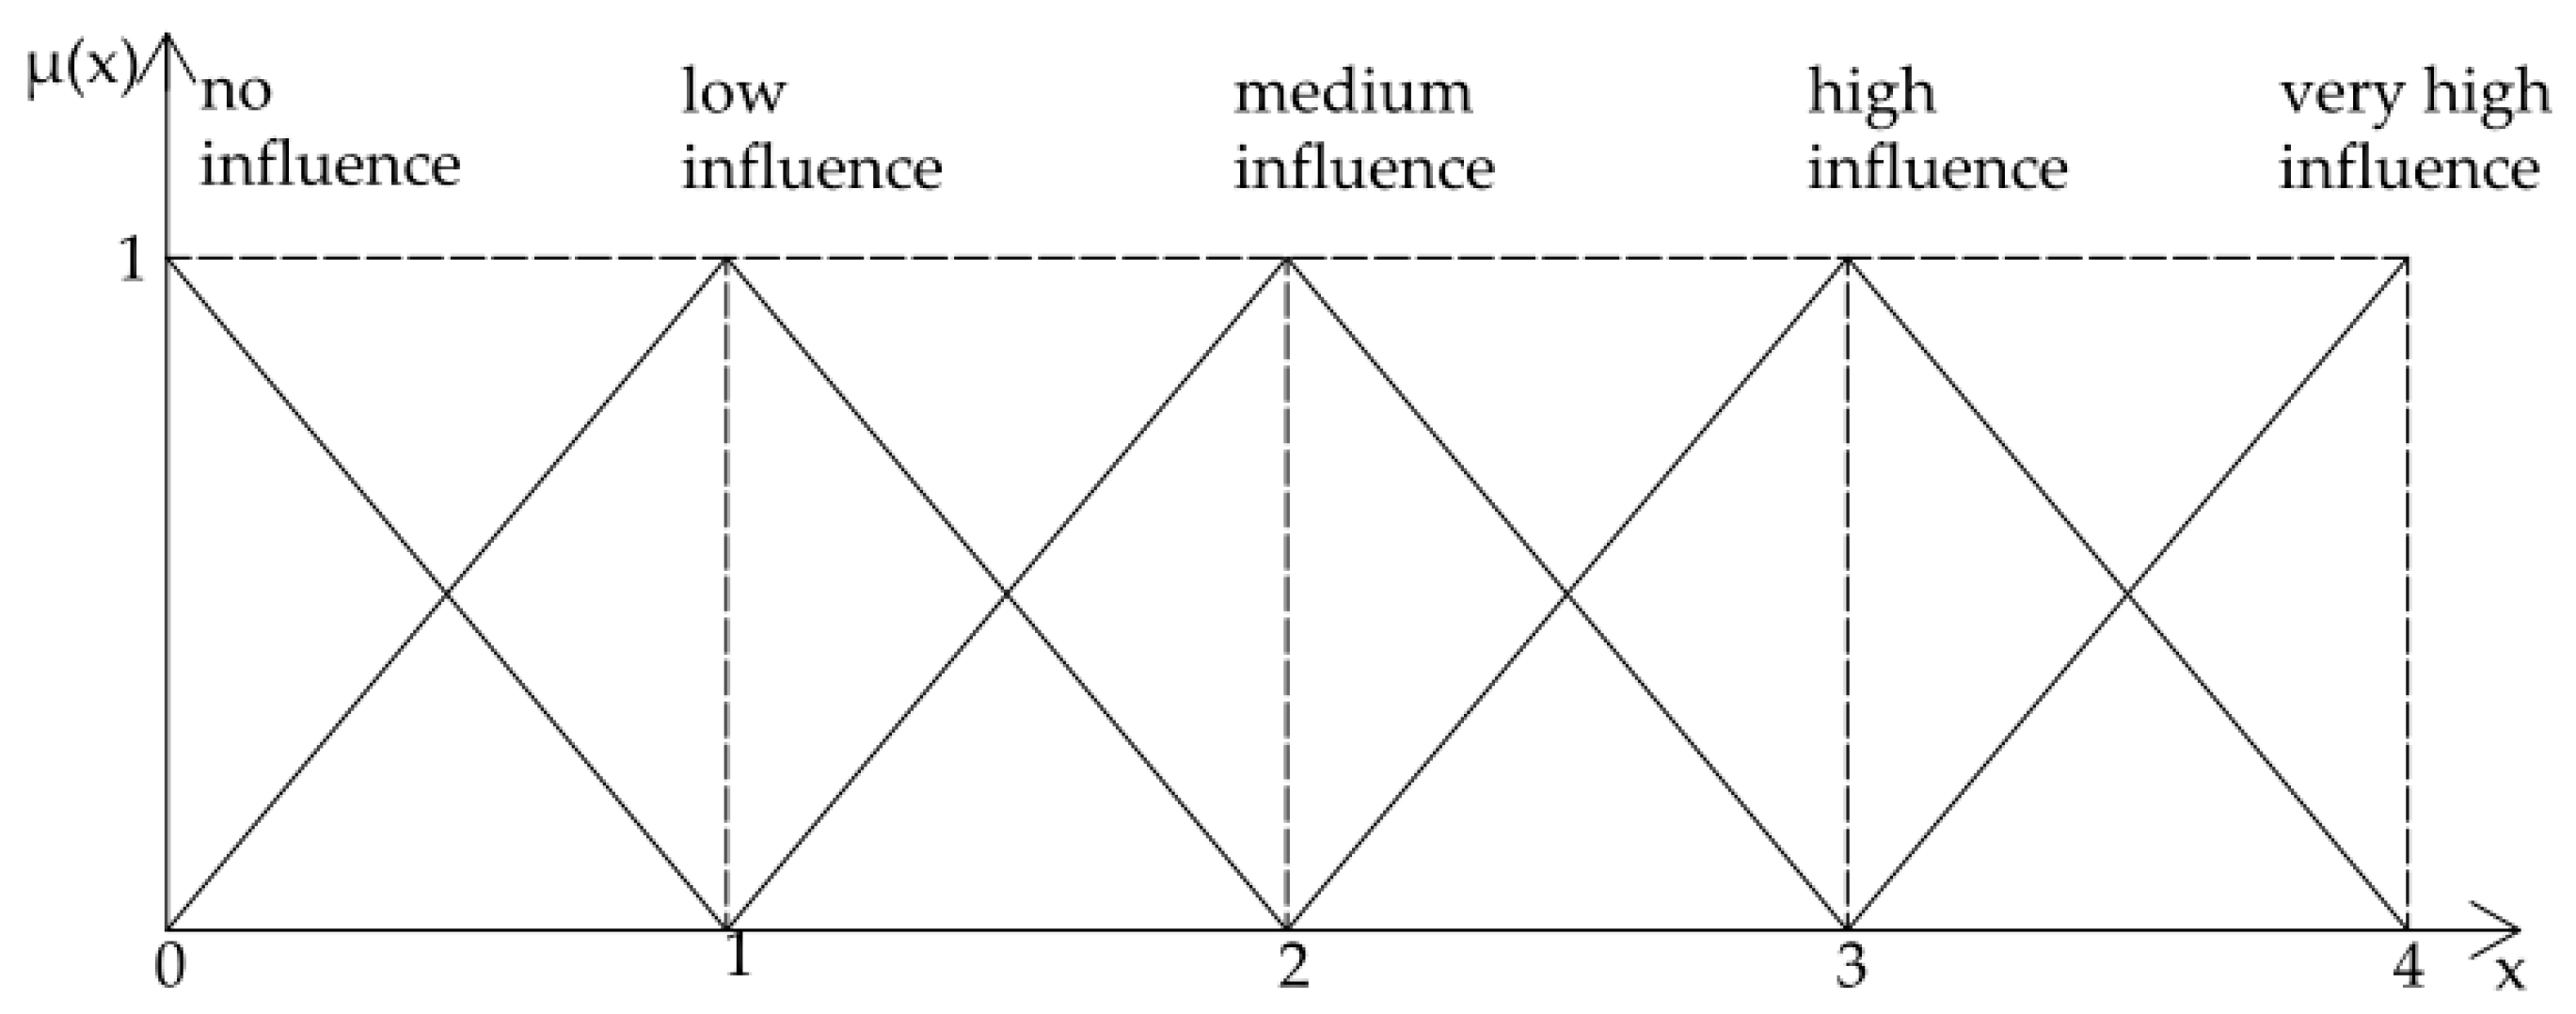
Influence Intensity Rating
Linguistic termTriangular fuzzy number
No influence(0, 0, 1)
Low influence(0, 1, 2)
Medium influence(1, 2, 3)
High influence(2, 3, 4)
Very high influence(3, 4, 4)
Table 5. Acceptable value of the Geometric Consistency Index (GCI) depending on the size of the evaluation matrix [54].
n34>4
G C I d o p 0.31470.35260.370
Table 6. Total influence–relation matrix T .
GSDDTSLDUSSDDBDRFUFSHCCF
GS0.00640.00600.00500.00250.00600.00350.00180.00290.00230.00130.00330.0023
DD0.00540.00420.00540.00500.00740.00590.00510.00500.00140.00140.00410.0055
TS0.00420.00460.00640.00520.00580.00650.00570.00520.00230.00240.00400.0047
LD0.00510.00610.00620.00520.00420.00670.00620.00620.00180.00240.00610.0056
US0.00750.00790.00860.00750.00370.00800.00890.00620.00460.00140.00860.0089
SD0.00270.00270.00490.00280.00280.00300.00680.00740.00380.00140.00210.0073
DB0.00450.00500.00610.00440.00360.00700.00380.00680.00330.00270.00330.0083
DR0.00750.00520.00830.00720.00890.00900.00950.00320.00360.00270.00800.0089
FU0.00720.00800.00960.00850.00570.00990.00700.00690.00240.00110.00370.0098
FS0.00210.00180.00290.00960.00240.00310.00180.00240.00140.00130.00390.0027
HC0.00530.00480.00770.00680.00810.00620.00570.00680.00300.00180.00590.0047
CF0.00900.00900.00970.00860.00950.01030.00990.00990.00490.00240.00710.0022
Table 7. Values of the total involvement r i + c i and total role r i c i of the components.
Negative ImpactsRanking (Factor Importance)Total Involvement r i + c i and Total Role r i c i Number of CausesNumber of EffectsFactor Type
r i + c i r i c i
GSGround settlement outside the open caisson40.02804−0.0238138Effect
DDDamage or destruction of adjacent structures110.01766−0.0095138Effect
TSTilting of the open caisson from the vertical60.02731−0.02407110Effect
LDLateral displacement of the open caisson30.02834−0.0152246Effect
USUncontrolled sinking of the open caisson70.024680.0138174Cause
SDStructural damage to the open caisson (e.g., cracking or spalling)50.0275−0.02750010Effect
DBDamage to the base of the open caisson (including cutting edge failure)90.02161−0.0133347Effect
DRDetachment of the bottom ring of the open caisson80.021810.0132692Cause
FUFlotation or uplift of the open caisson10.045750.04511110Cause
FSFreezing of the open caisson to surrounding soil120.015810.0132592Cause
HCHanging of the open caisson due to high side friction100.020430.0067165Cause
CFComplete failure or collapse of the open caisson20.031880.0213192Cause
Table 8. Summary of the second stage of the analysis.
GSDDTSLDUSSDDBDRFUFSHCCFODStage II Total
GS0.17600.08700.07700.09200.09920.04210.05570.09950.08580.05480.07520.11090.09001.0554
DD0.14400.08100.07700.10200.09920.04210.08830.04390.08580.04840.05630.11090.08390.9792
TS0.14400.08700.12700.10200.11110.07510.12040.11490.15360.05480.13470.11090.11221.3356
LD0.04800.08700.09800.09200.09920.04210.05570.09950.11720.39210.09660.09450.09061.3219
US0.14400.17800.09800.06200.02420.04210.04390.11490.04570.05480.19120.11090.09421.1098
SD0.06100.08700.12700.10200.11110.05020.12040.11490.15360.06990.09660.12620.10161.2198
DB0.03900.08700.09800.10200.11110.16960.04390.14620.08580.04840.07520.11090.09811.1172
DR0.04800.08700.09800.10200.06910.20510.12040.02310.06510.05480.09660.11090.09521.0802
FU0.04800.02300.03600.02200.03850.05020.04390.02310.01840.04840.02550.02320.03360.4002
FS0.03900.02300.03600.02700.01450.03420.03460.01940.01480.04840.02070.01470.02680.3266
HC0.06100.08100.05100.10200.11110.04210.04390.08540.02050.06990.07520.06120.06860.8043
CF0.04800.08700.07700.09200.11110.20510.22880.11490.15360.05480.05630.01470.10541.2435
Table 9. Summary of both stages of the analysis.
Stage I—Fuzzy WINGSStage II—ANPTotal of Both StagesFinal Ranking
r i + c i r i c i Stage I TotalStage I RankStage II TotalStage II Rank
GS0.02800.02380.051941.055481.19728
DD0.01770.00950.0272110.979291.09029
TS0.02730.02400.051451.335611.49921
LD0.02830.01520.043661.321921.45612
US0.02470.01380.038571.109861.24266
SD0.02750.02750.055021.219841.37644
DB0.02160.01330.034991.117251.25025
DR0.02180.01320.035181.080271.21057
FU0.04570.04510.090910.4002110.524711
FS0.01580.01320.0291100.3266120.382412
HC0.02040.00670.0271120.8043100.900010
CF0.03190.02130.053231.243531.40213
Disclaimer/Publisher’s Note: The statements, opinions and data contained in all publications are solely those of the individual author(s) and contributor(s) and not of MDPI and/or the editor(s). MDPI and/or the editor(s) disclaim responsibility for any injury to people or property resulting from any ideas, methods, instructions or products referred to in the content.

