
Exploring the Effects of Window Design on the Restorative Potential of Movable Smart Co-Working Offices in Small Village Environments Through Immersive Virtual Reality


Abstract
1. Introduction
2. Materials and Methods
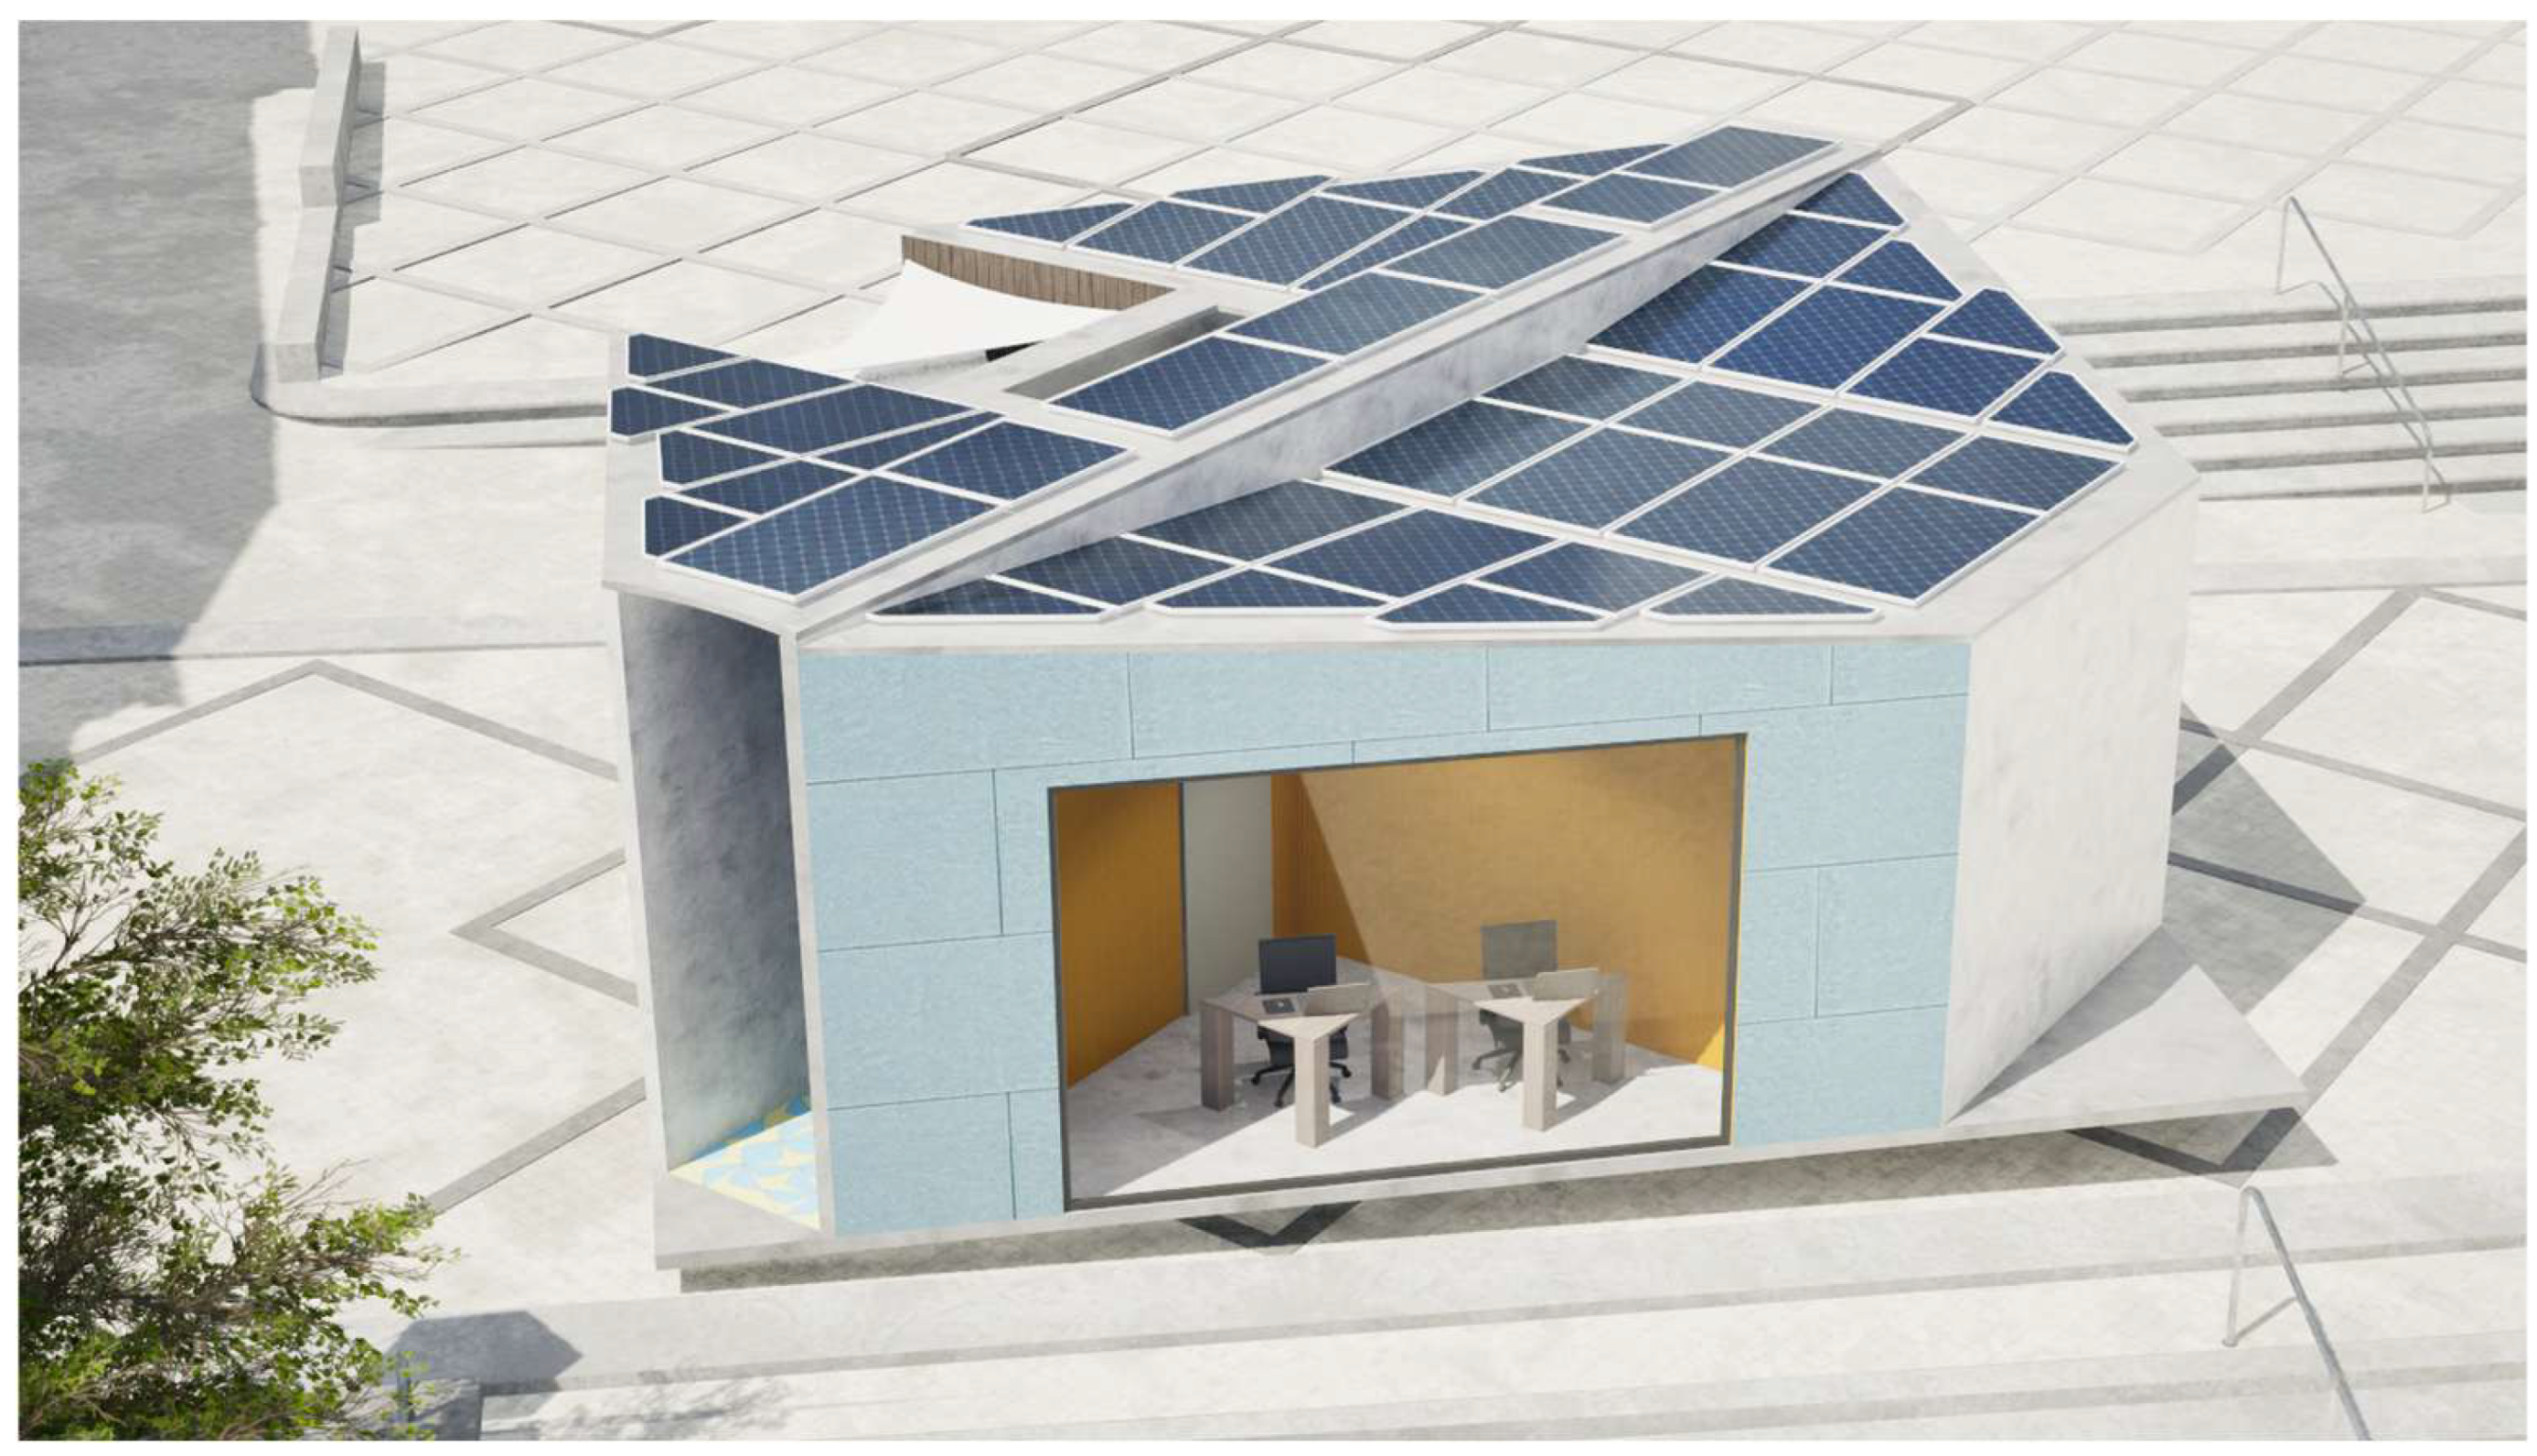
2.1. “RES_STANZA” Prefabricated Movable Building
2.2. Small Village: Cerreto Sannita
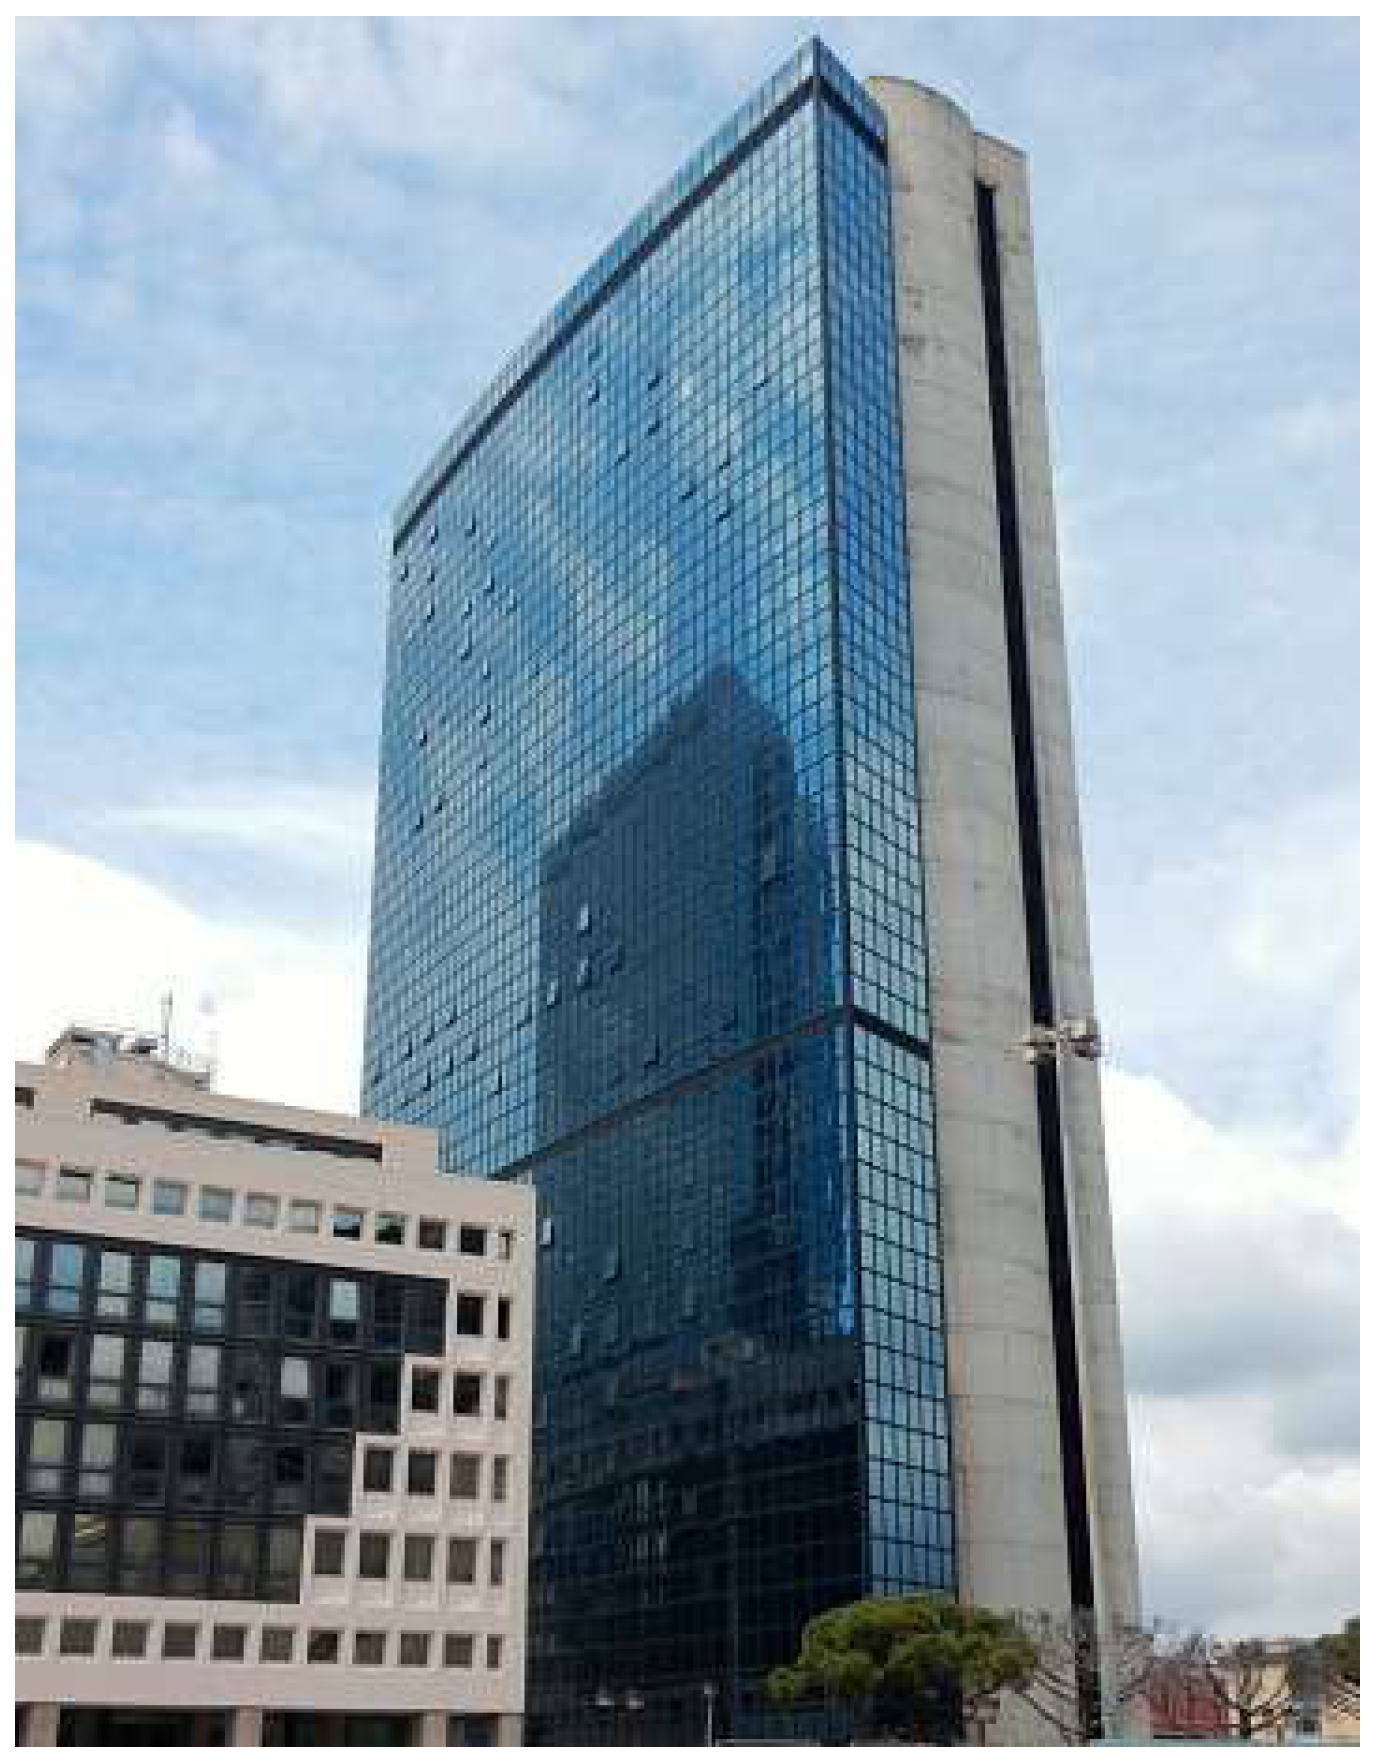
2.3. City’s Business District: Naples Directional Center
2.4. VR Environment Development

2.5. Questionnaire
2.5.1. Igroup Presence Questionnaire (IPQ)

| Factors | Item Name | Items | Anchors | Item Sources |
|---|---|---|---|---|
| General presence | G1 | In the computer generated world, I had a sense of “being there” | not at all/-/very much | [108] |
| Spatial presence | SP1 | Somehow I felt that the virtual world surrounded me. | fully disagree/-/fully agree | [45] |
| SP2 | I felt like I was just perceiving pictures. | fully disagree/-/fully agree | [45] | |
| SP3 | I did not feel present in the virtual space. | did not feel/felt present | [45] | |
| SP4 | I had a sense of acting in the virtual space, rather than operating something from outside. | fully disagree/-/fully agree | [45] | |
| SP5 | I felt present in the virtual space. | fully disagree/-/fully agree | [45] | |
| Involvement | INV1 | How aware were you of the real world surrounding while navigating in the virtual world? (i.e., sounds, room temperature, other people, etc.)? | extremely aware/moderately aware/not aware at all | [109] |
| INV2 | I was not aware of my real environment. | fully disagree/-/fully agree | [45] | |
| INV3 | I still paid attention to the real environment. | fully disagree/-/fully agree | [45] | |
| INV4 | I was completely captivated by the virtual world. | fully disagree/-/fully agree | [45] | |
| Experienced realism | REAL1 | How real did the virtual world seem to you? | completely real/-/not real at all | [110] |
| REAL2 | How much did your experience in the virtual environment seem consistent with your real world experience? | not consistent/moderately consistent/very consistent | [109] | |
| REAL3 | How real did the virtual world seem to you? | about as real as an imagined world/-/indistinguishable from the real world | [111] | |
| REAL4 | The virtual world seemed more realistic than the real world. | fully disagree/-/fully agree | [45] |
2.5.2. Perceived Restorativeness Scale
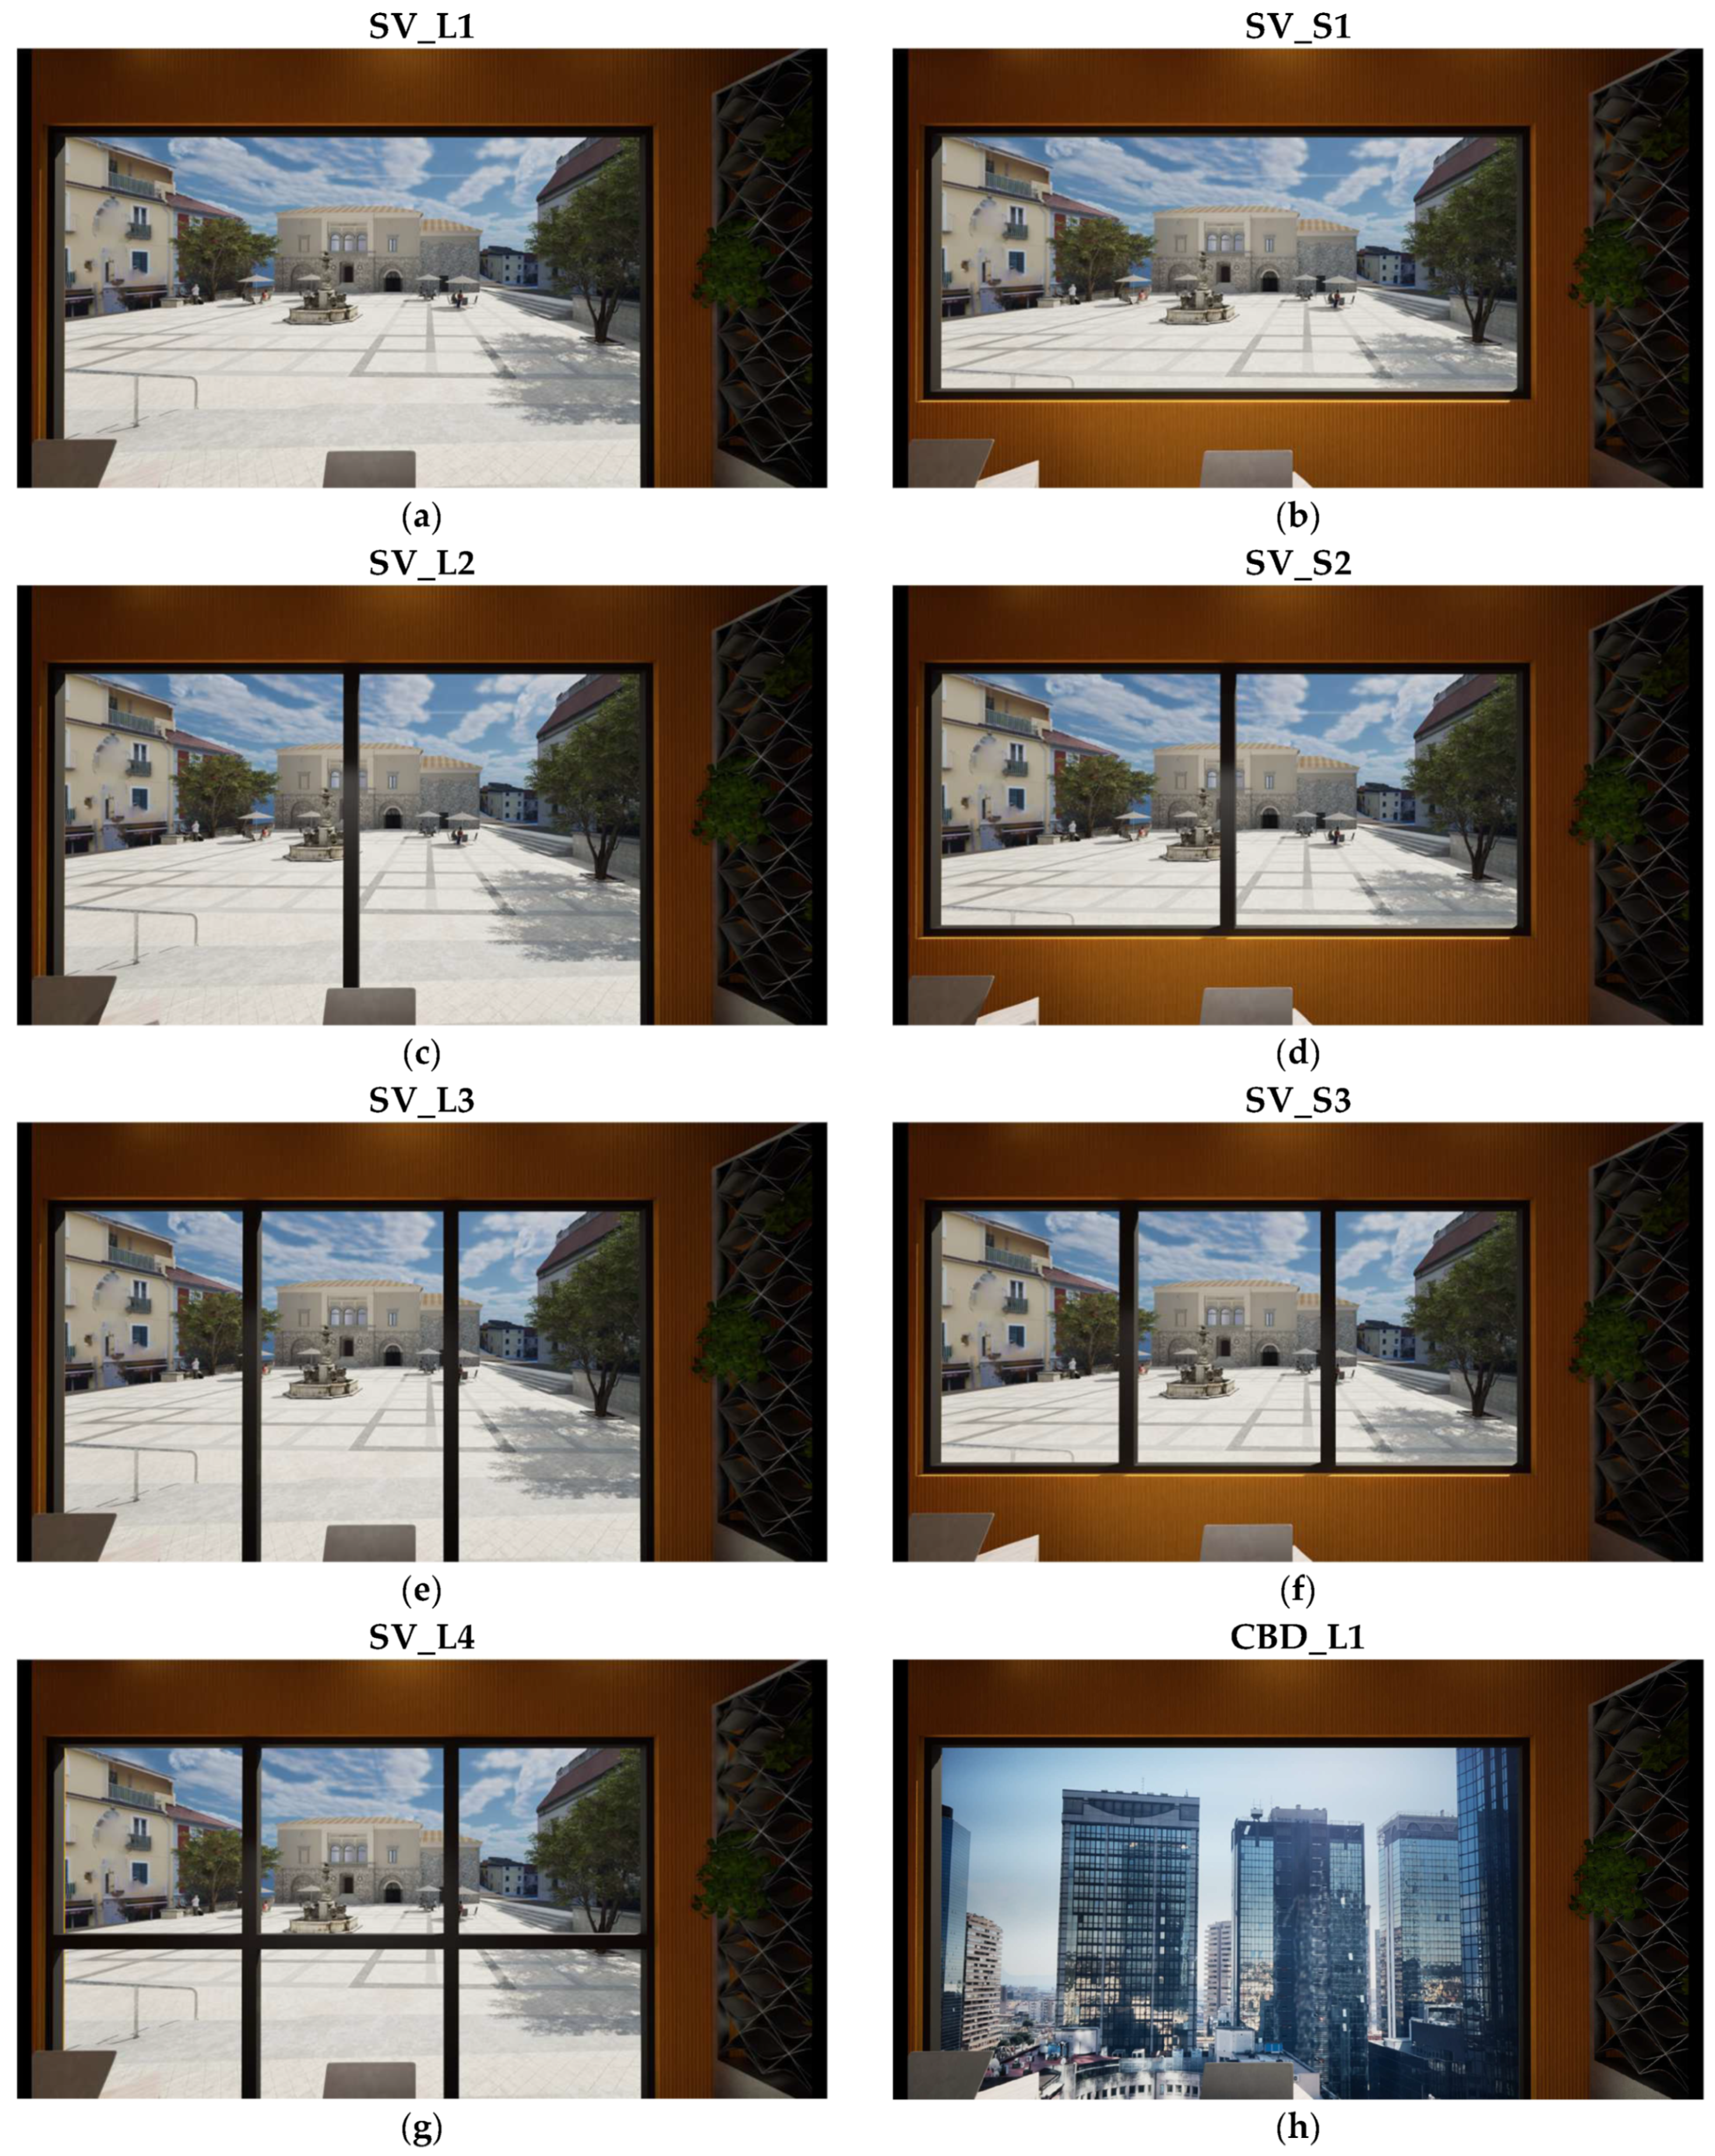
2.6. VR Scenarios
| Case n. | Picture | Characteristics | |||
|---|---|---|---|---|---|
| SV_L1 and CBD_L1 | 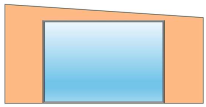 | Wall area (Awall) | 20.18 m2 | ||
| Window dimensions (W × H) | 4.00 × 2.70 m | ||||
| Window area (AW) | 10.80 m2 | ||||
| Windowsill height from the floor | 0.00 m | ||||
| Frame area (AF) | 0.72 m2 | ||||
| WWR = 53.5 % | FR = 6.7 % | GP = 1 | |||
| SV_L2 |  | Wall area (Awall) | 20.18 m2 | ||
| Window dimensions (W × H) | 4.00 × 2.70 m | ||||
| Window area (AW) | 10.80 m2 | ||||
| Windowsill height from the floor | 0.00 m | ||||
| Frame area (AF) | 1.00 m2 | ||||
| WWR = 53.5 % | FR = 9.3 % | GP = 2 | |||
| SV_L3 | 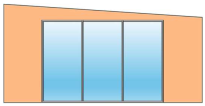 | Wall area (Awall) | 20.18 m2 | ||
| Window dimensions (W × H) | 4.00 × 2.70 m | ||||
| Window area (AW) | 10.80 m2 | ||||
| Windowsill height from the floor | 0.00 m | ||||
| Frame area (AF) | 1.27 m2 | ||||
| WWR = 53.5 % | FR = 11.8 % | GP = 3 | |||
| SV_L4 | 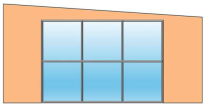 | Wall area (Awall) | 20.18 m2 | ||
| Window dimensions (W × H) | 4.00 × 2.70 m | ||||
| Window area (AW) | 10.80 m2 | ||||
| Windowsill height from the floor | 0.00 m | ||||
| Frame area (AF) | 1.66 m2 | ||||
| WWR = 53.5 % | FR = 15.4 % | GP = 6 | |||
| SV_S1 |  | Wall area (Awall) | 20.18 m2 | ||
| Window dimensions (W × H) | 4.00 × 1.80 m | ||||
| Window area (AW) | 7.20 m2 | ||||
| Windowsill height from the floor | 0.90 m | ||||
| Frame area (AF) | 0.63 m2 | ||||
| WWR = 35.7 % | FR = 8.7 % | GP = 1 | |||
| SV_S2 |  | Wall area (Awall) | 20.18 m2 | ||
| Window dimensions (W × H) | 4.00 × 1.80 m | ||||
| Window area (AW) | 7.20 m2 | ||||
| Windowsill height from the floor | 0.90 m | ||||
| Frame area (AF) | 0.81 m2 | ||||
| WWR = 35.7 % | FR = 11.2 % | GP = 2 | |||
| SV_S3 |  | Wall area (Awall) | 20.18 m2 | ||
| Window dimensions (W × H) | 4.00 × 1.80 m | ||||
| Window area (AW) | 7.20 m2 | ||||
| Windowsill height from the floor | 0.90 m | ||||
| Frame area (AF) | 0.98 m2 | ||||
| WWR = 35.7 % | FR = 13.7 % | GP = 3 | |||
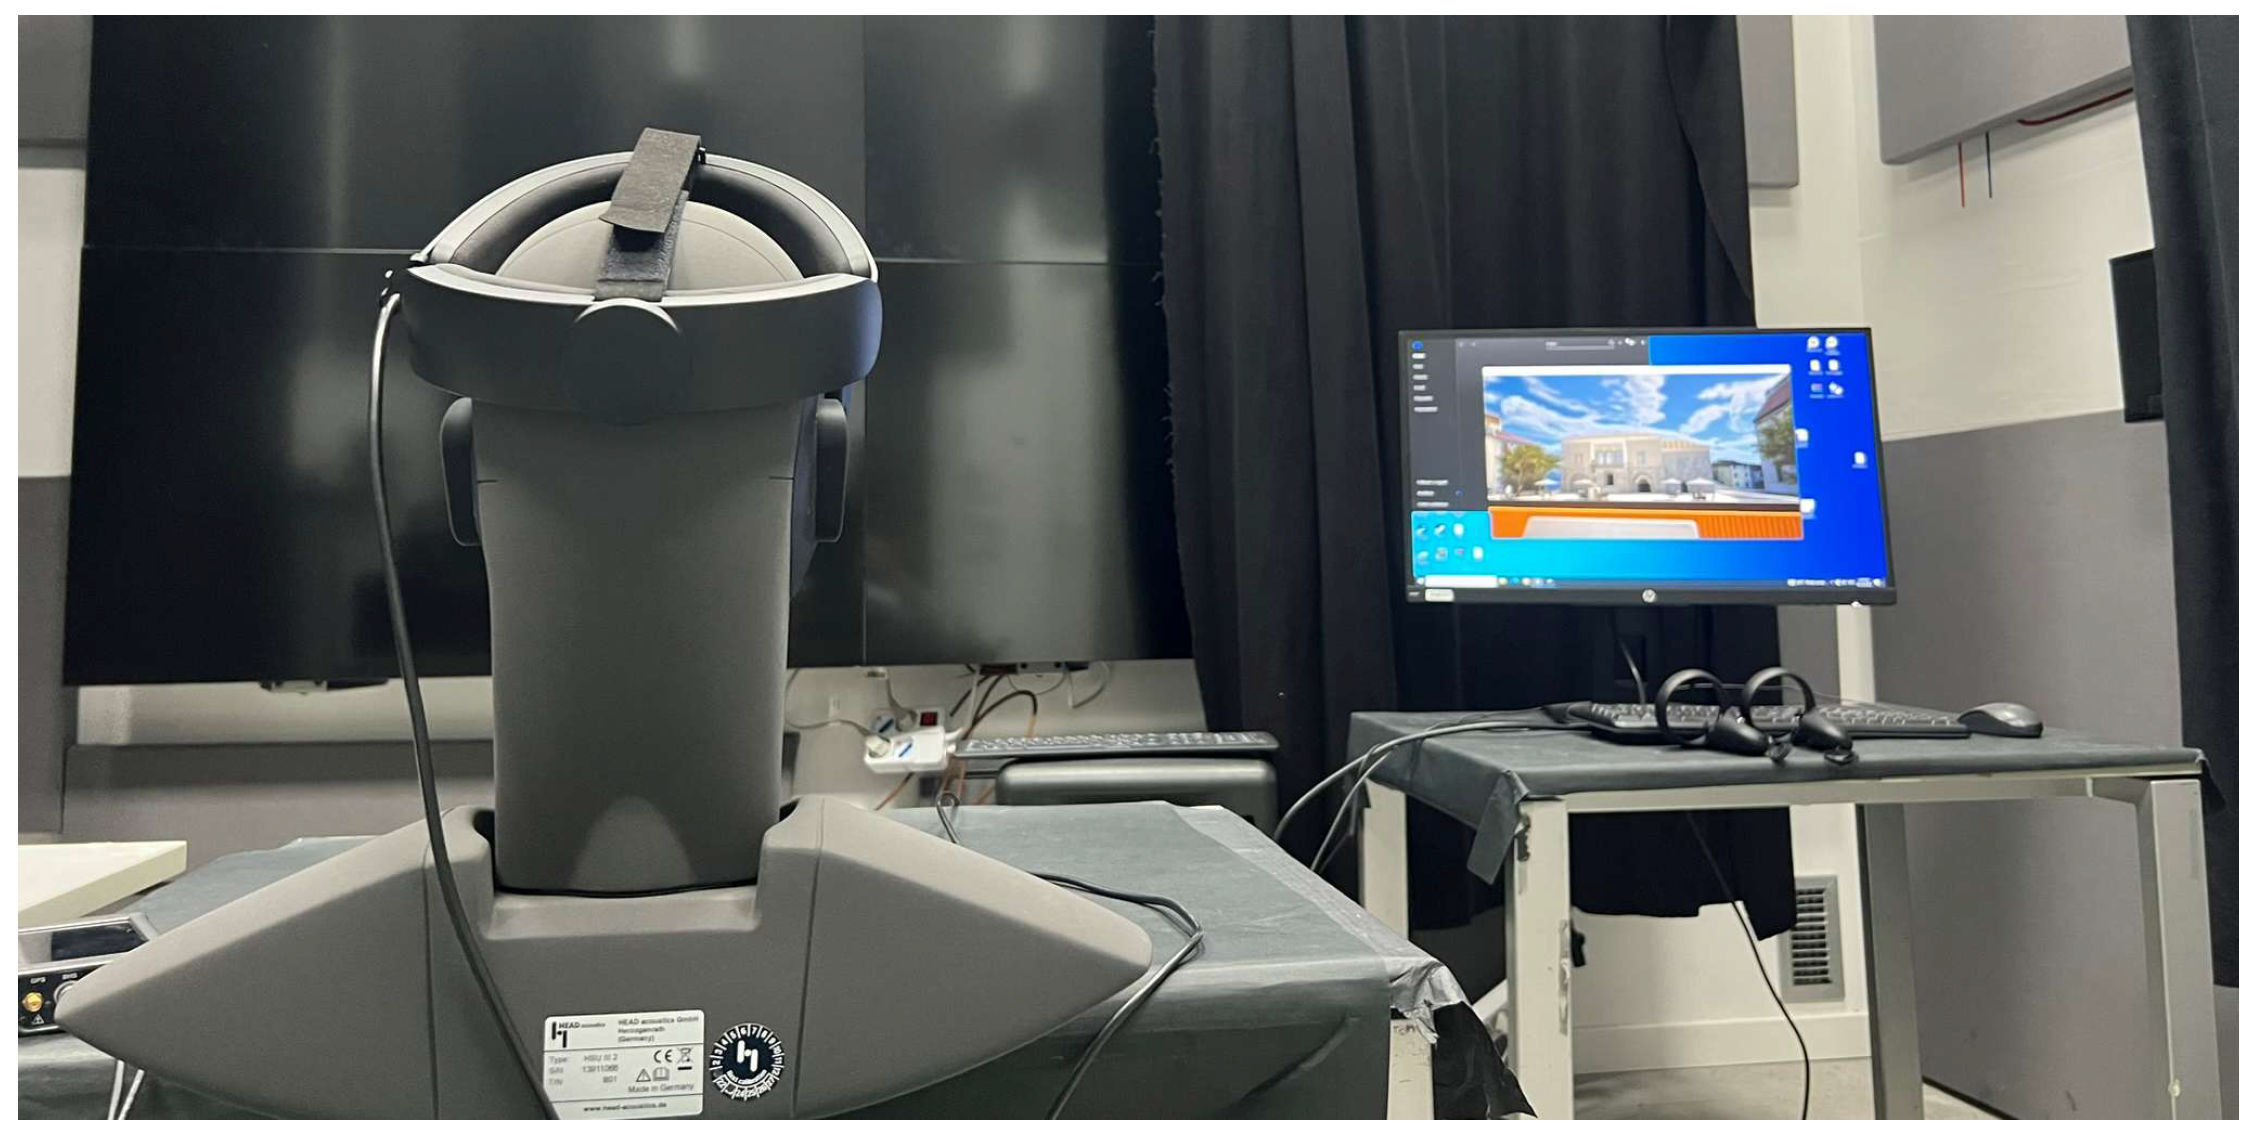
2.7. Experimental Setting
2.8. Participants
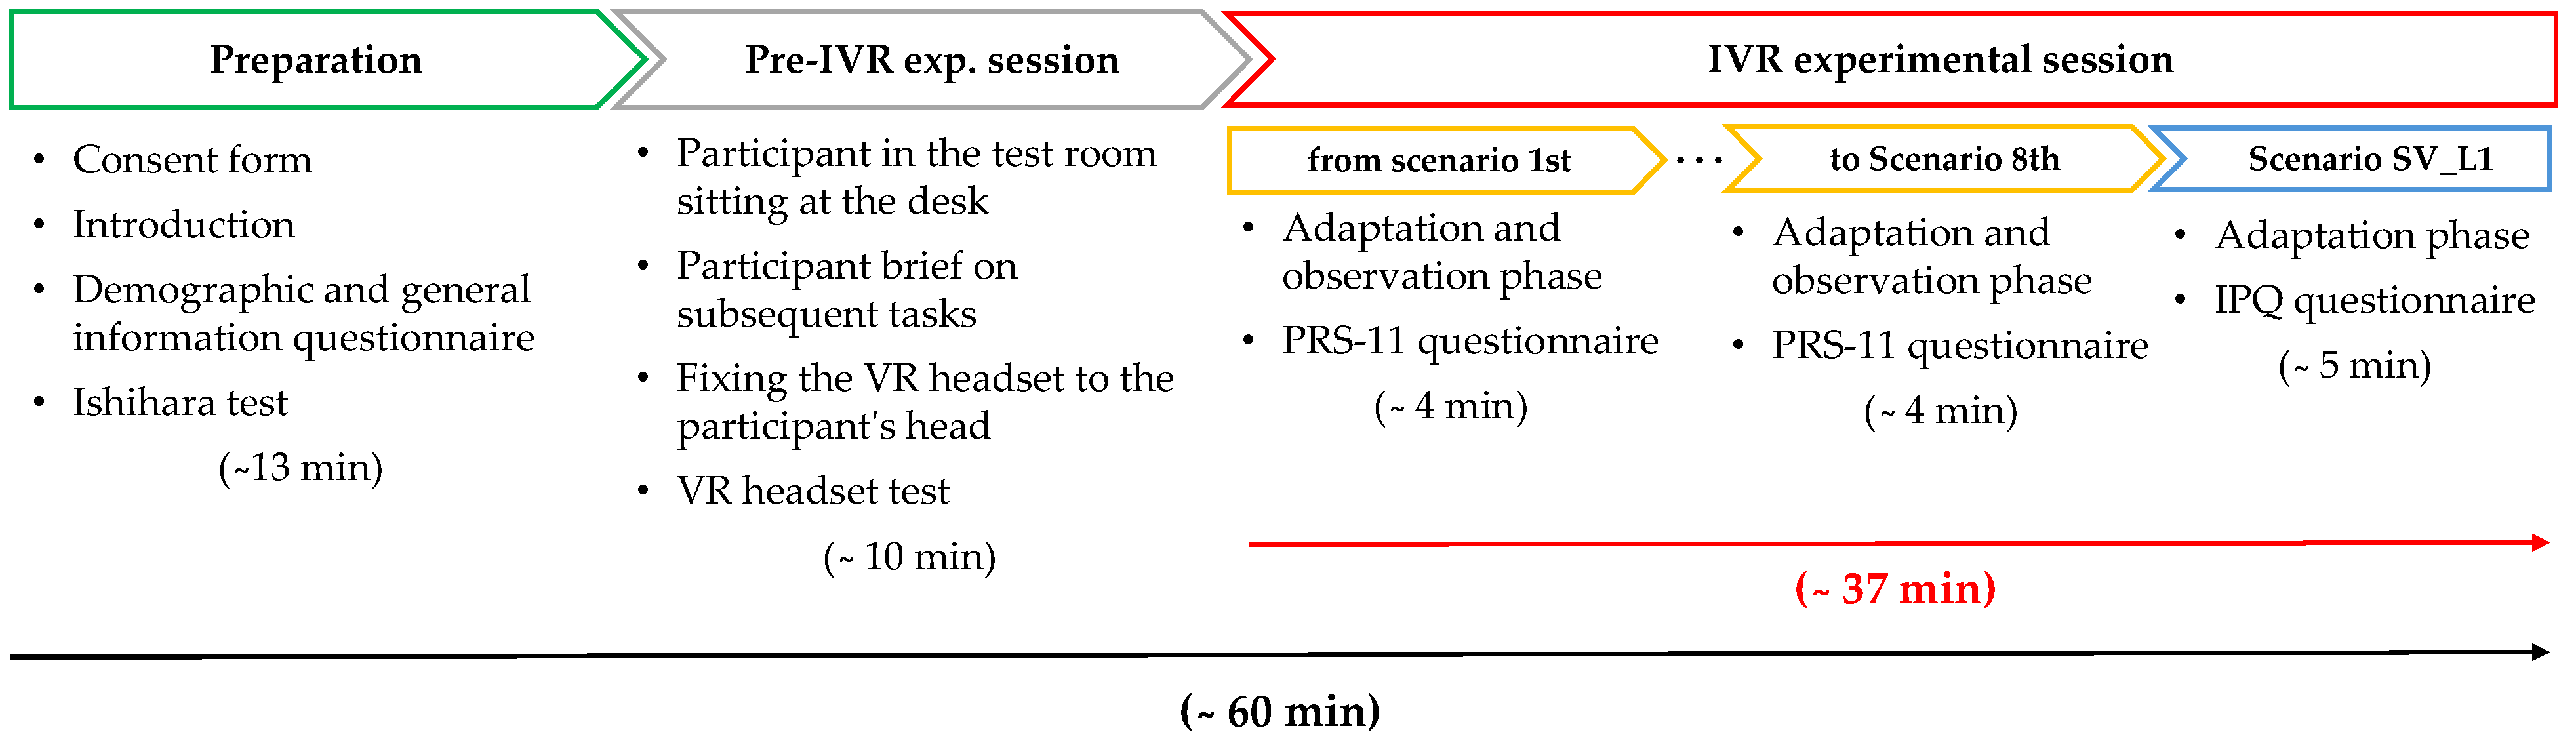
2.9. Experimental Procedure
3. Results
3.1. Sense of Presence
| Sub-Scale | Ranking Class IPQ Scale | ||||
|---|---|---|---|---|---|
| Low [–3.00, P50 th) | Moderate [P50 th, P75 th) | High [P75 th, P90 th) | Very High [P90 th, P95 th) | Exceptional [P95 th, +3.00] | |
| General Presence | [–3.00, 1.00) | [1.00, 1.50) | [1.50, 1.91) | [1.91, 2.10) | [2.10, 3.00] |
| Spatial Presence | [–3.00, 0.72) | [0.72, 1.30) | [1.30, 1.74) | [1.74, 1.99) | [1.99, 3.00] |
| Involvement | [–3.00, 0.26) | [0.26, 0.76) | [0.76, 1.06) | [1.06, 1.28) | [1.28, 3.00] |
| Experienced Realism | [–3.00, −0.37) | [–0.37, –0.03) | [–0.03, 0.43) | [0.43, 0.95) | [0.95, 3.00] |
| Overall IPQ scale (3D-HMD) | [–3.00, 0.40) | [0.40, 0.83) | [0.83, 1.17) | [1.17, 1.35) | [1.35, 3.00] |
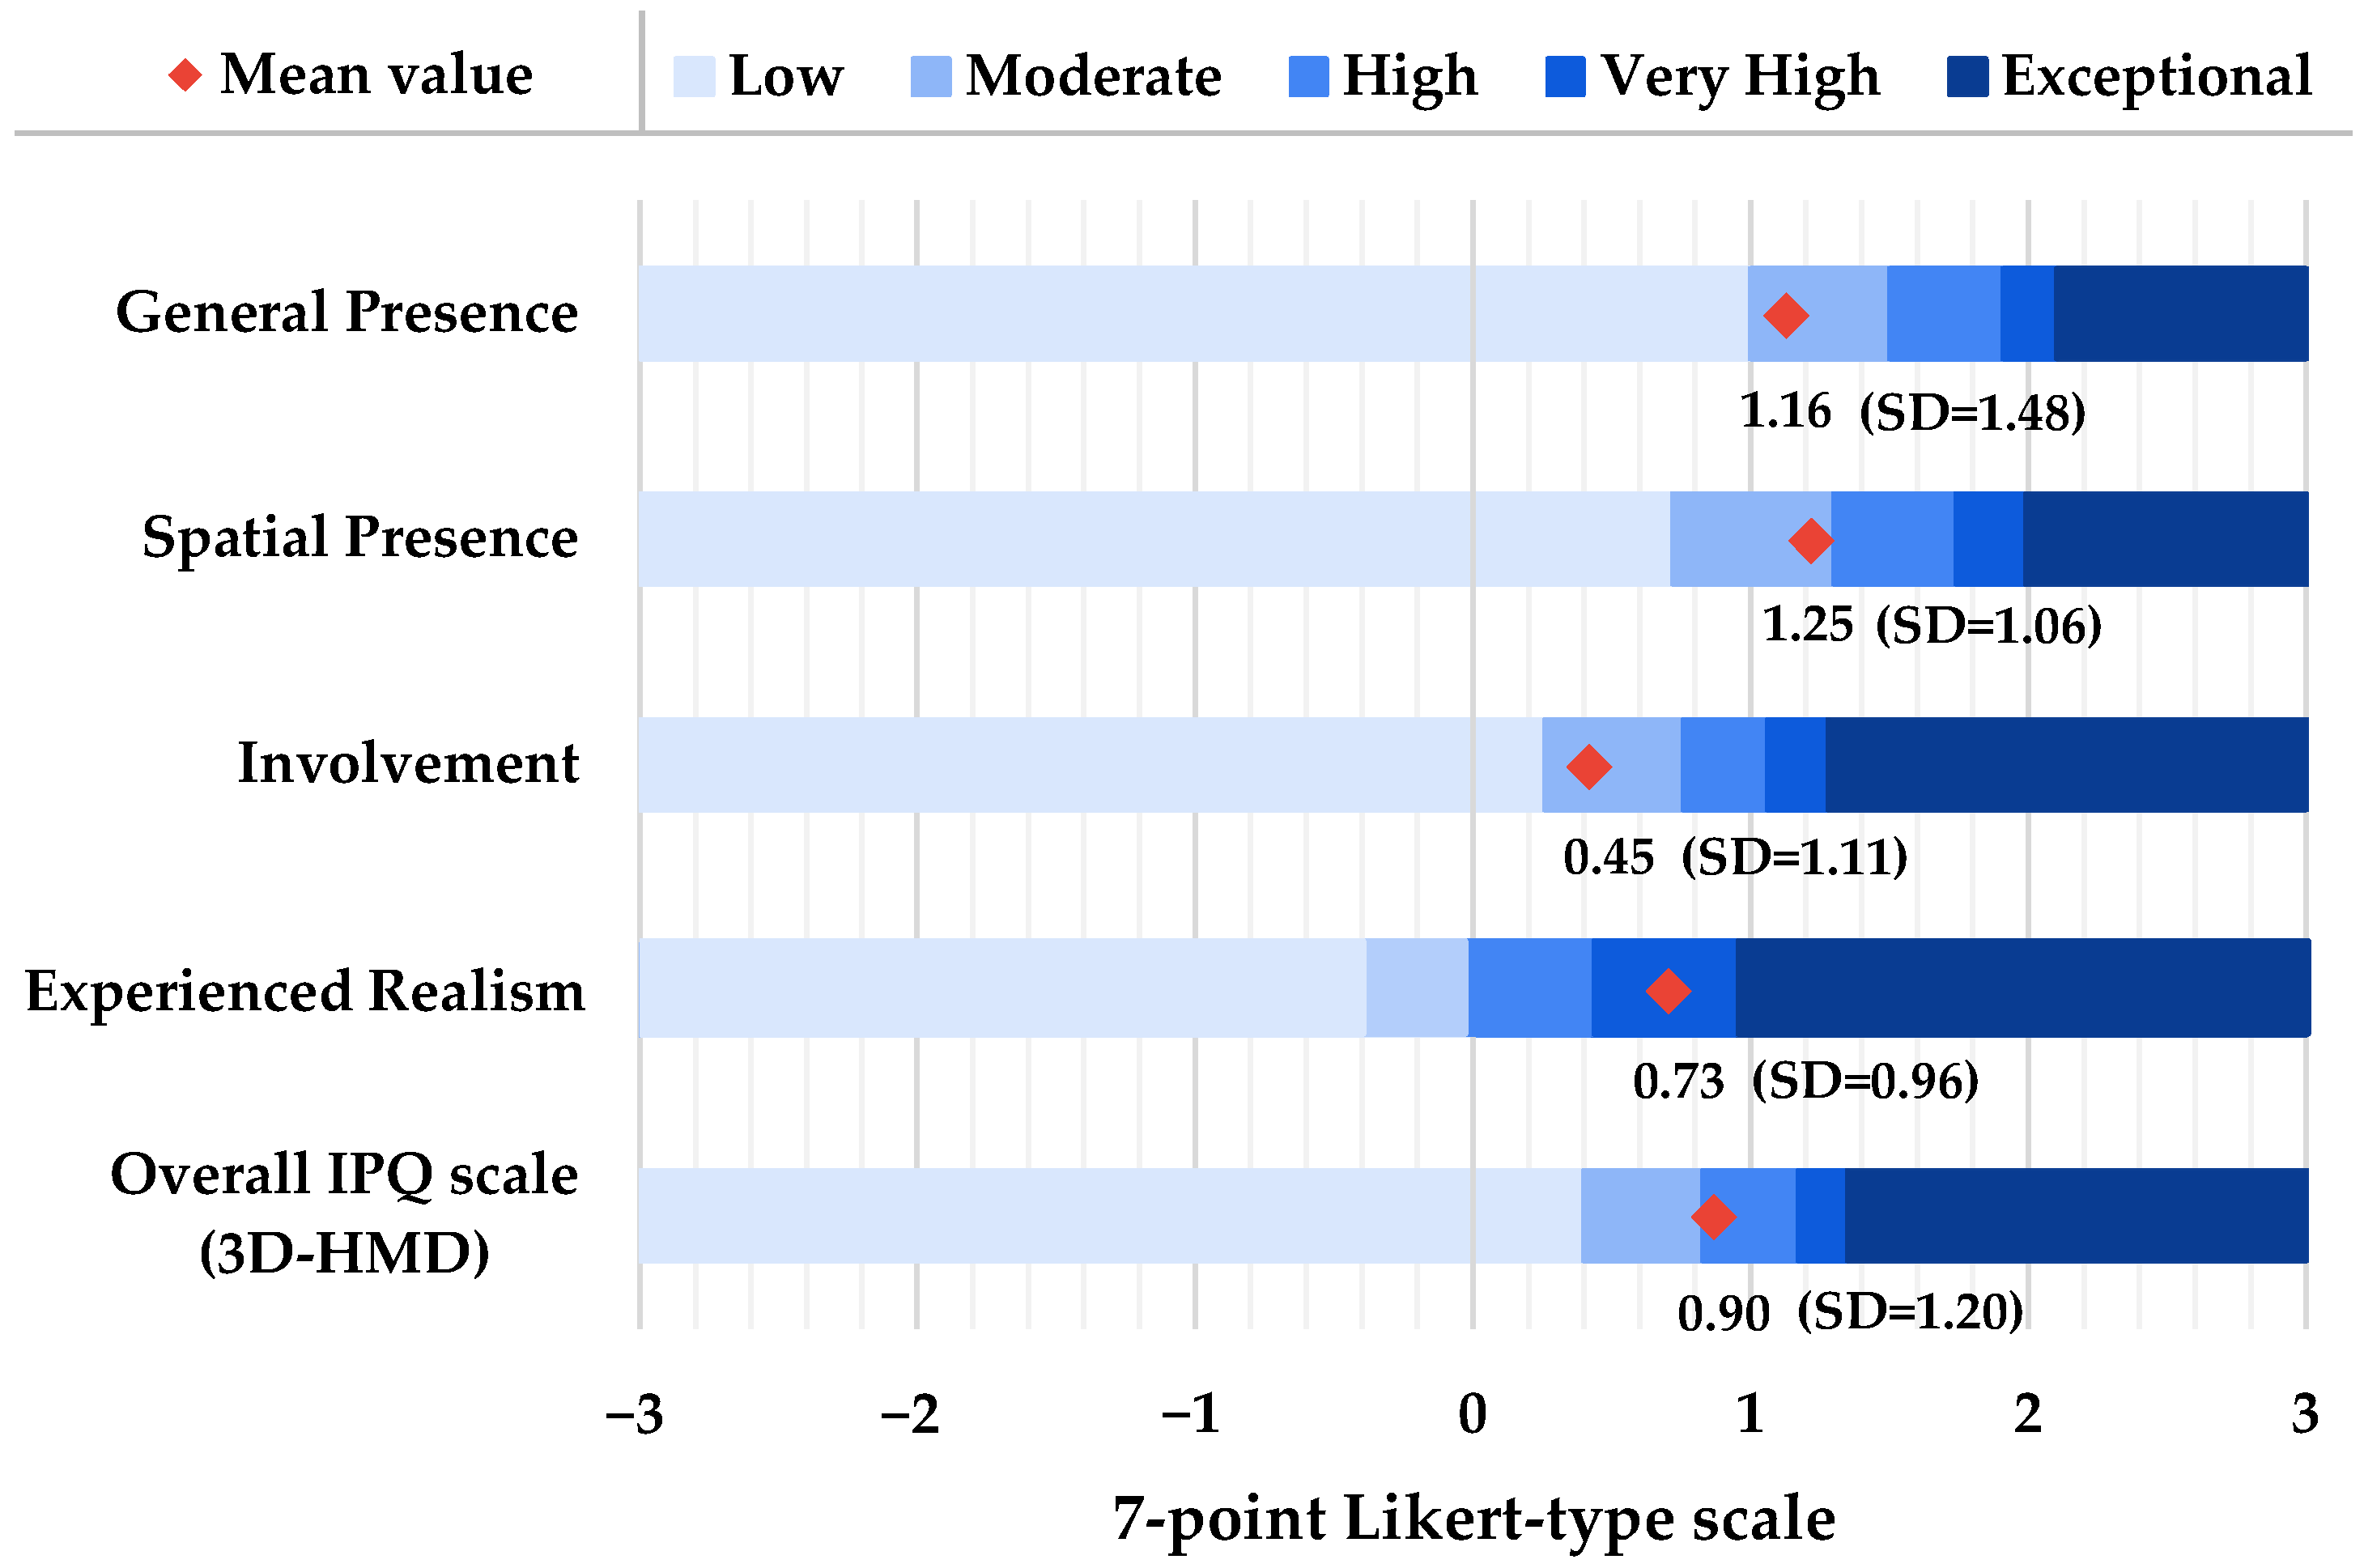
- General Presence achieved a mean value of 1.16 (SD = 1.48), corresponding to the Moderate category. In detail, G exhibits an average value higher than 50% of the 162 total studies analyzed by Tran et al. [48], which fall within the Low range. Additionally, SP shows similar values at 25% of the total, while only 25% of the studies exhibit greater values, placed in the High, Very High, and Exceptional ranges. This indicates that participants experienced a Moderate feeling of "being there", considered acceptable as it exceeds the 50th percentile and is only below the 25th percentile.
- Spatial Presence recorded a mean value of 1.25 (SD = 1.06), classified as moderate. The SP value (as for the values of G) is higher than 50% of scientific works examined in [48], similar to 25%, and lower than only 25%.
- This suggests that participants have a "moderate" sense of physically being in the environment, which is acceptable as it exceeds the 50th percentile and is only lower than the 25th percentile.
- Involvement showed a mean value of 0.45 (SD = 1.11), still within the Moderate range. It ranks above 50% of the 162 studies analyzed in [48], similar to 25%, and below only the top 25%.
- This allows us to affirm that participants have a ‘moderate’ degree of engagement and focus within the environment, which is acceptable as it surpasses the 50th percentile and is lower than only the 25th percentile.
- Experienced Realism with a mean value of 0.73 (SD = 0.96), reached the Very High class. Compared to the 162 works examined in [48], the REAL value is higher than 90% of the cases, similar to 5%, and below only 5%.
- This highlights that, due to the design and technology employed, participants perceived the virtual environment as highly realistic.
- Overall IPQ Scale with a mean value of 0.90 (SD = 1.20), reached the High class. Compared to the 180 works examined in [48], the Overall IPQ Scale value is higher than 75% of the cases, similar to 15%, and below only 10%. This highlights that participants perceived a high level of presence in the experimental virtual environment.
3.2. Restorativeness
- the maximum marginal means of fascination is observed in SV_L1, with a value of 7.24, characterized by the maximum WWR (53.5%) and the minimum FR (6.71%), as can be seen from Figure 9;
- when comparing the SV_L1 scenario with CBD_L1 under the same window design conditions (WWR of 53.5% and FR of 6.71%), participants attributed higher fascination to the Small Village (mean value = 7.24) than to the City Business District (mean value = 5.64), as shown in Figure 9;
- the SV_S3 scenario, despite having a lower WWR (35.7%) and a higher FR (13.67%), still elicits significantly higher fascination compared to CBD_L1 (WWR = 53.5% and FR 6.71%);
- in SV_L4 (with WWR = 53.5%, FR = 15.41%, and GP = 6), the “fascination” effect associated with the Small Village (obtained in the cases SV_L1, SV_L2, SV_L3 and SV_S3) decreases, becoming comparable to that obtained in CBD_L1;
- comparing the marginal means of fascination reported in Figure 9 for SV_S1, SV_S2, and SV_S3 with SV_L4 reveals that, despite the former having a lower WWR (33.7% vs. 53.5%), they exhibit higher average fascination values. This suggests that a higher number of GPs, with both vertical and horizontal mullions, for a given WWR value determines lower levels of fascination than cases where both GPs and WWR are lower.
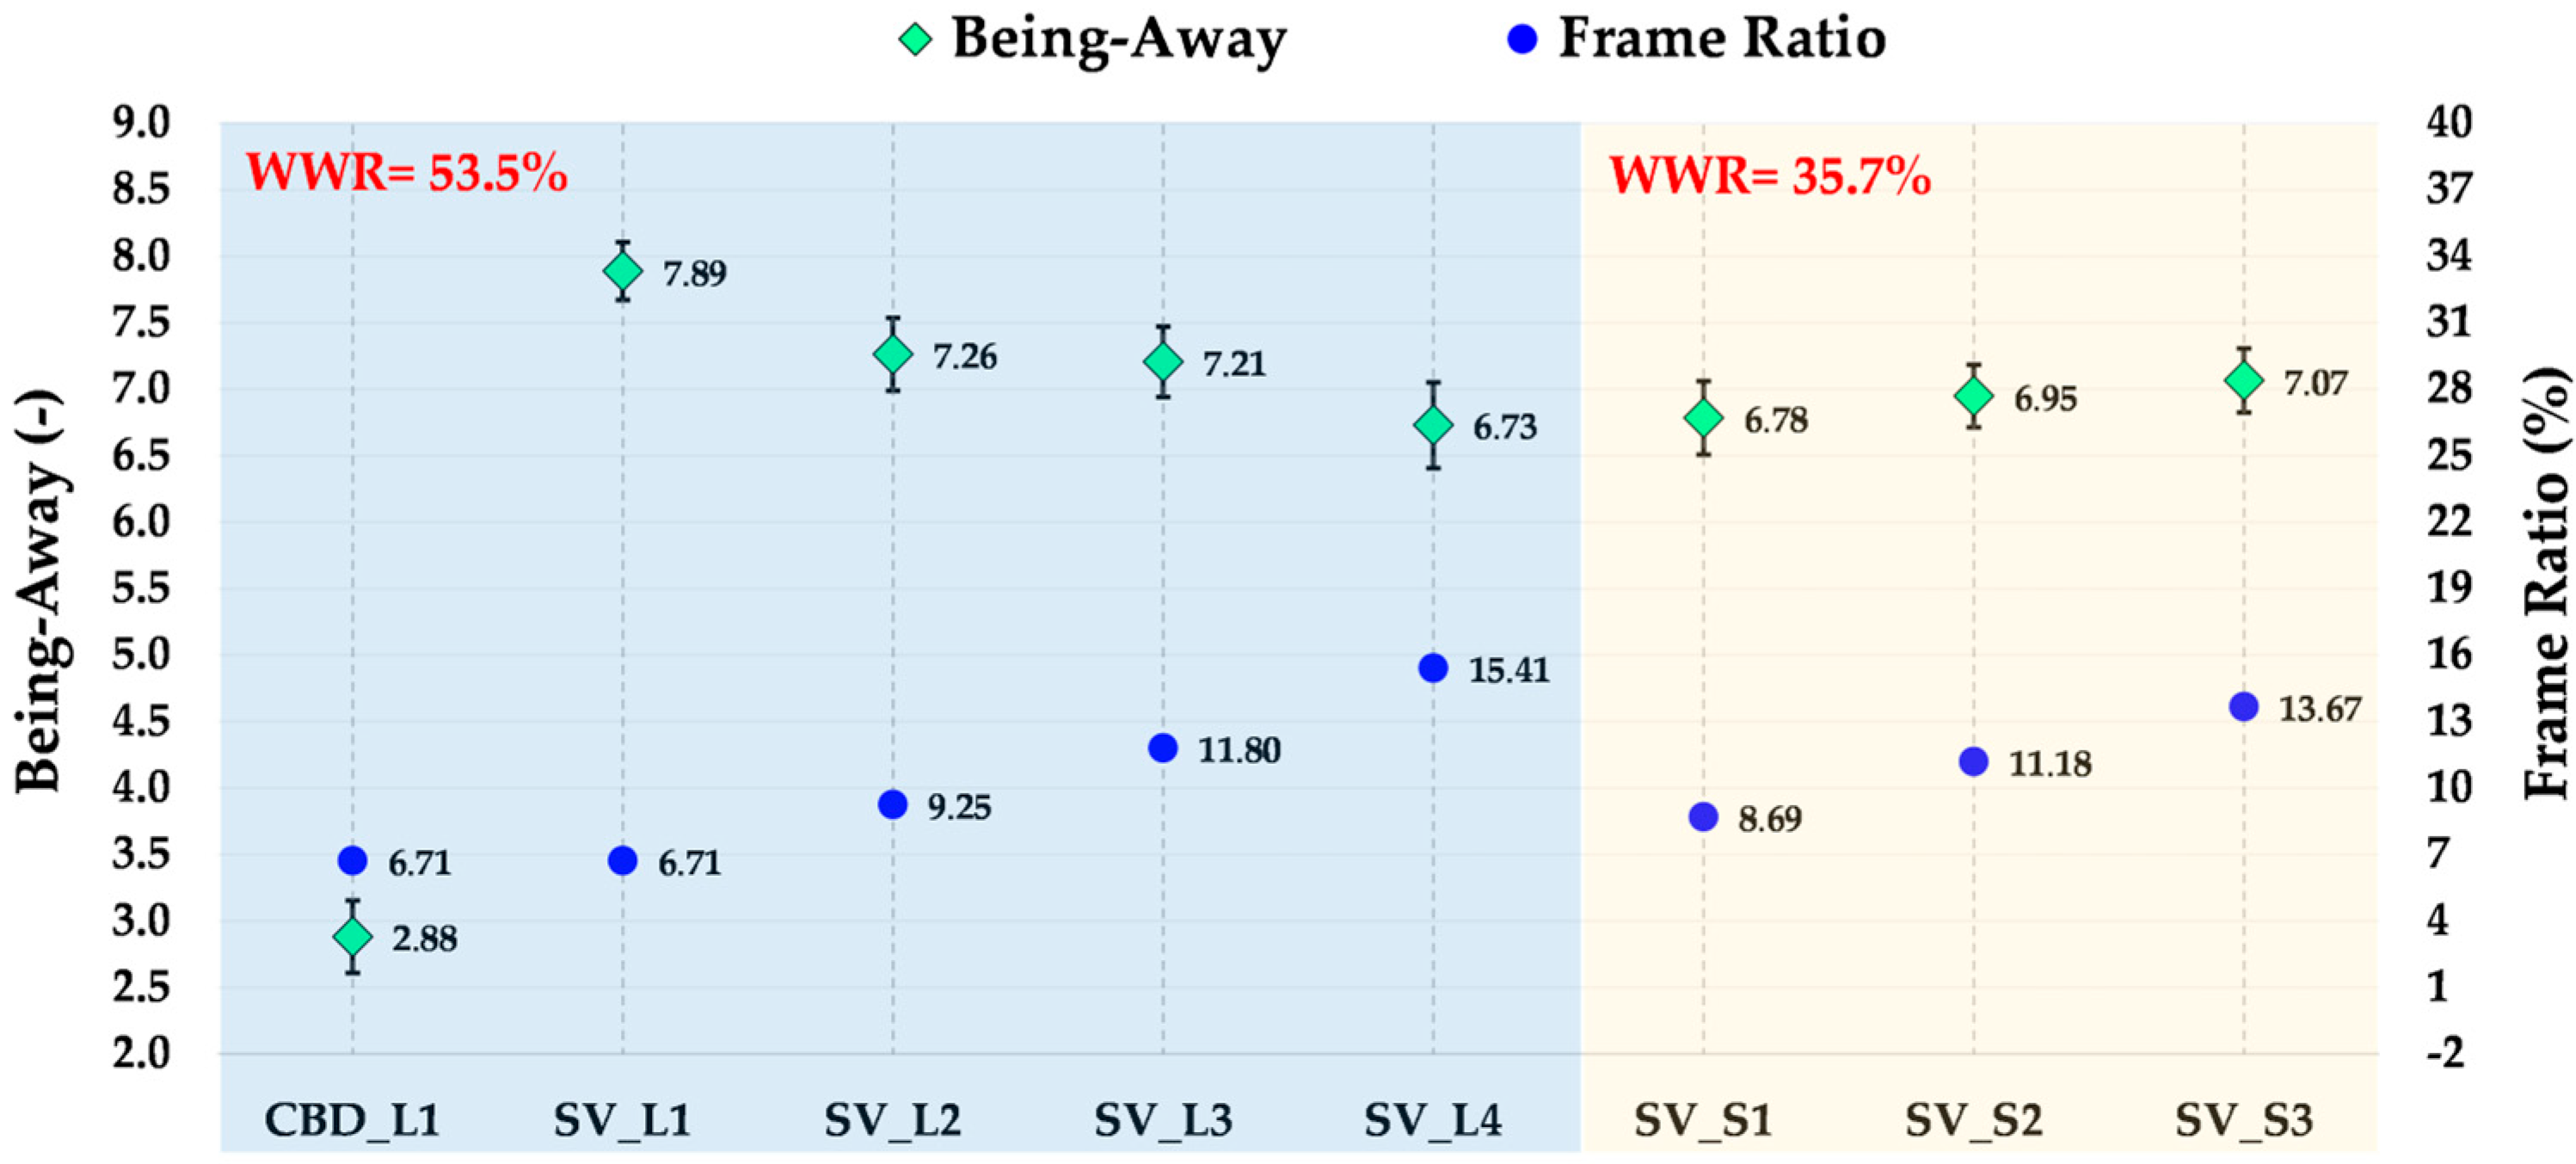
- the maximum marginal means of fascination is observed in SV_L1, with a value of 7.89, characterized by the maximum WWR (53.5%) and the minimum FR (6.71%), as can be seen from Figure 10;
- among the scenarios set in the Small Village, SV_L1 has a significantly higher marginal mean of ‘being-away’ than SV_L4 and SV_S1. SV_L4 and SV_L1 have the same WWR (equal to 53.5%) and differ for GP values (equal to 6 and 1, respectively); SV_S1 and SV_L1 have the same GP (equal to 1) and a lower WWR (equal to 35.7%).
| Scenario 1 | Scenario 2 | Mean Difference | pbonf | Condition | ||
|---|---|---|---|---|---|---|
| Case n. | Marginal Mean | Case n. | Marginal Mean | |||
| SV_L1 | 7.89 | CBD_L1 | 2.88 | 5.01 | <0.001 | p < 0.001 |
| SV_L1 | 7.89 | SV_L4 | 6.73 | 1.16 | 0.004 | p < 0.01 |
| SV_L1 | 7.89 | SV_S1 | 6.78 | 1.10 | 0.008 | p < 0.01 |
| SV_L2 | 7.26 | CBD_L1 | 2.88 | 4.38 | <0.001 | p < 0.001 |
| SV_L3 | 7.21 | CBD_L1 | 2.88 | 4.32 | <0.001 | p < 0.001 |
| SV_L4 | 6.73 | CBD_L1 | 2.88 | 3.85 | <0.001 | p < 0.001 |
| .SV_S1 | 6.78 | CBD_L1 | 2.88 | 3.90 | <0.001 | p < 0.001 |
| SV_S2 | 6.95 | CBD_L1 | 2.88 | 4.07 | <0.001 | p < 0.001 |
| SV_S3 | 7.07 | CBD_L1 | 2.88 | 4.18 | <0.001 | p < 0.001 |
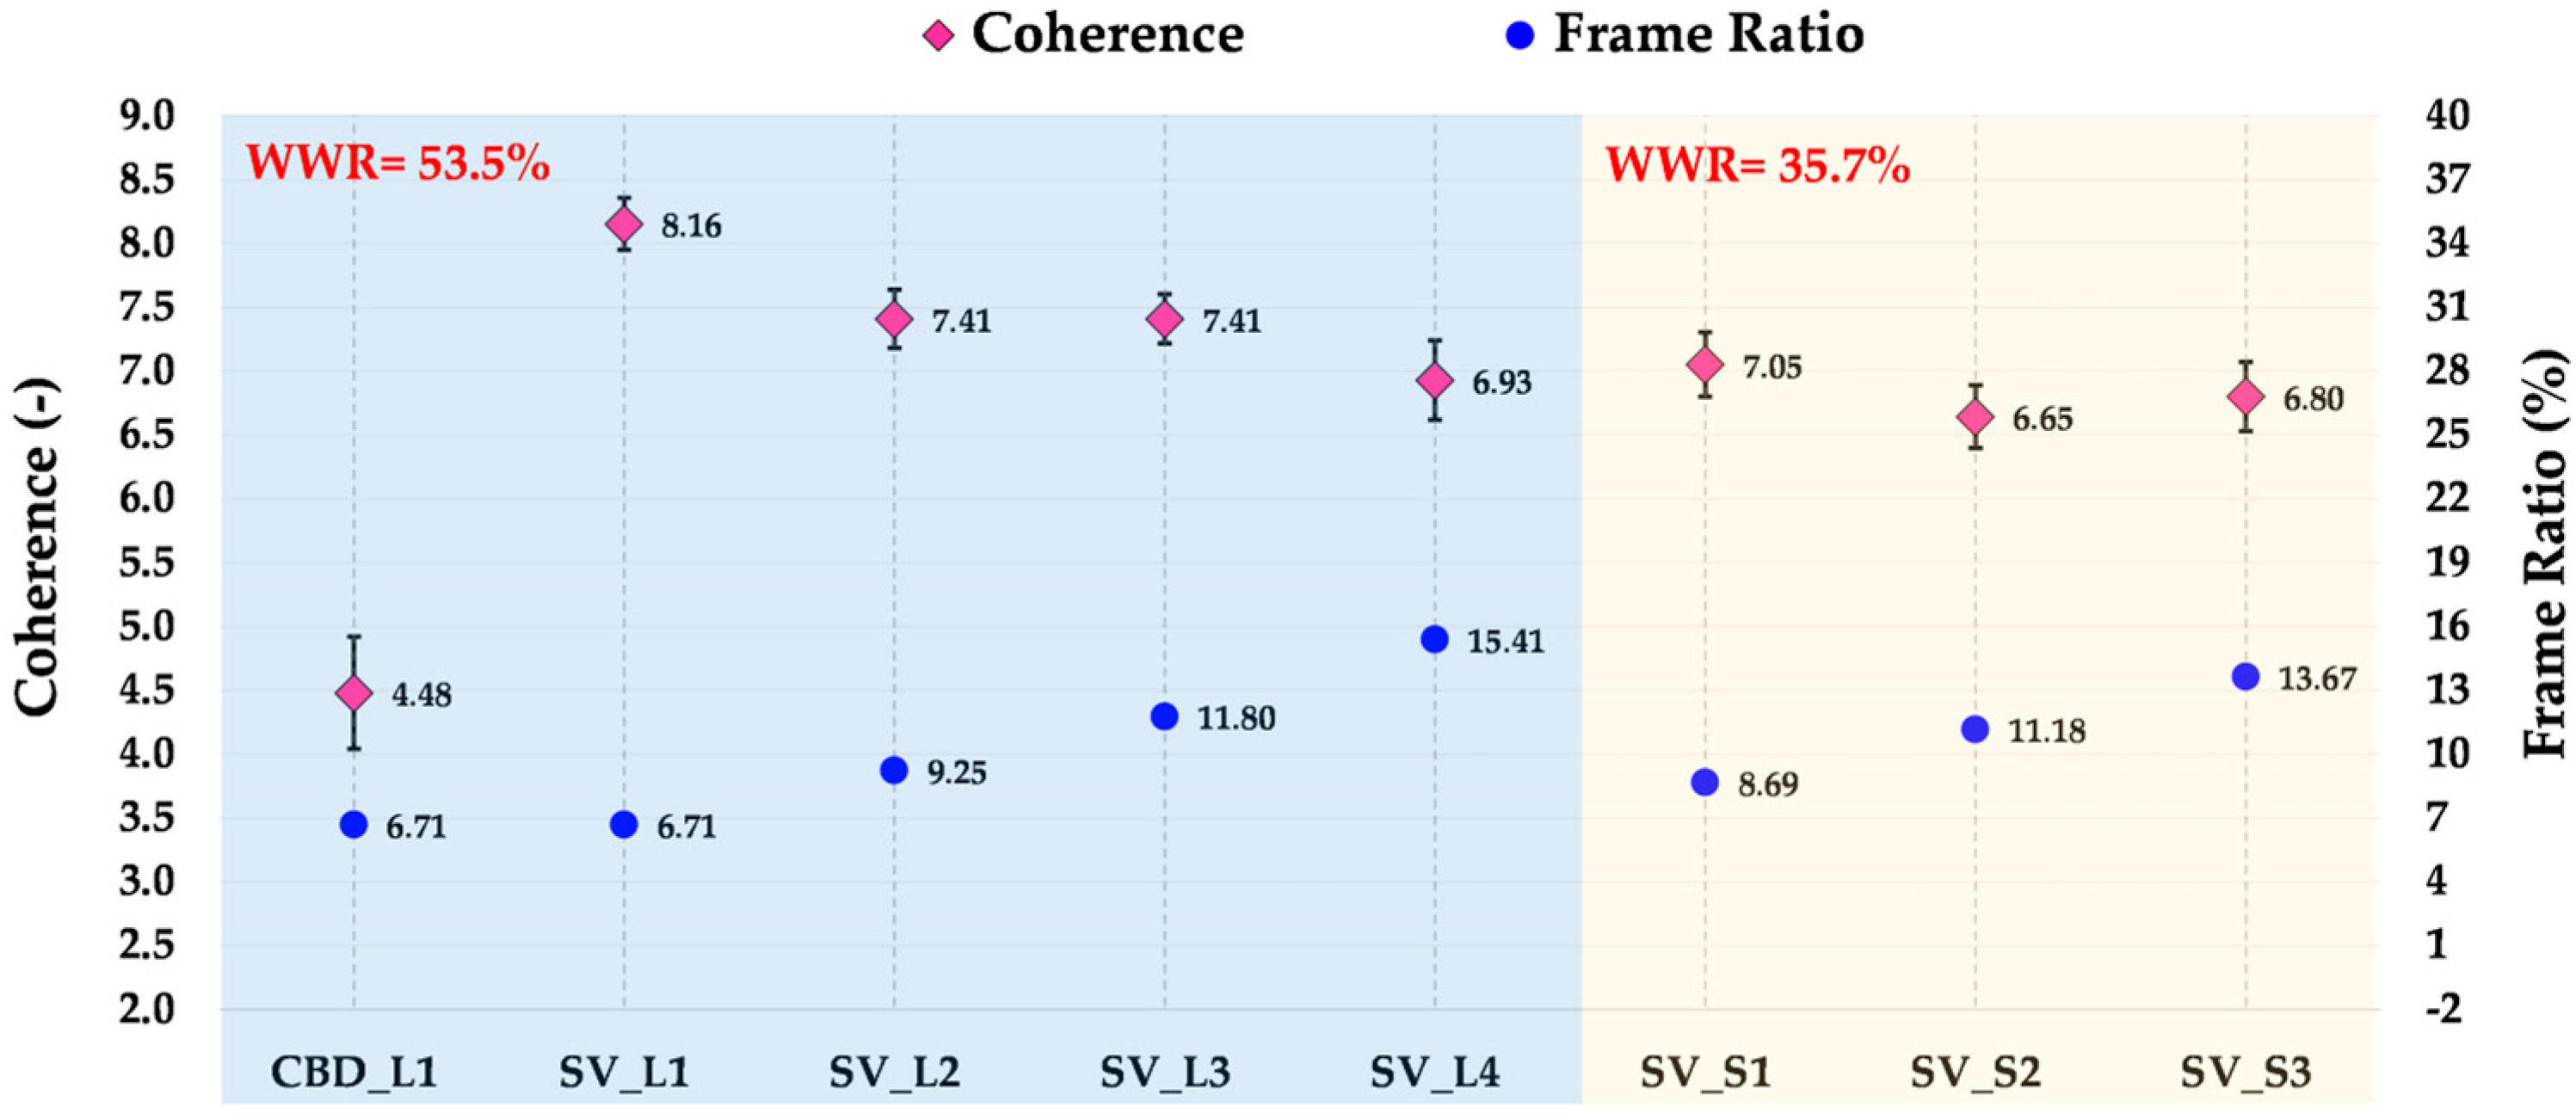
- the maximum marginal means of coherence is observed in SV_L1, with a value of 8.16, characterized by the maximum WWR (53.5%) and the minimum FR (6.71%), as can be seen from Figure 11;
- when comparing the SV_L1 scenario with CBD_L1 under the same window design conditions (WWR of 53.5% and FR of 6.71%), participants attributed higher coherence to the Small Village (mean value = 8.16) than to the City Business District (mean value = 4.48), as shown in Figure 11;
- comparing the marginal means of coherence reported in Figure 11 for SV_S1, SV_S2 and SV_S3 with those of SV_L4, it turns out that, despite the former having a lower WWR (35.7% compared to 53.5%), their coherence values do not show a significant difference, such that they can be considered almost constant (Figure 11 and Table 7). This suggests that a smart window with a WWR of 53.5% paired with 6 GPs (with both vertical and horizontal mullions), in comparison to a smart window with a WWR of 35.7% and GPs values ranging from 1 to 3 (with only vertical mullions), exhibits coherence values that are almost constant.
| Scenario 1 | Scenario 2 | Mean Difference | pbonf | Condition | ||
|---|---|---|---|---|---|---|
| Case n. | Marginal Mean | Case n. | Marginal Mean | |||
| SV_L1 | 8.16 | CBD_L1 | 4.48 | 3.67 | <0.001 | p < 0.001 |
| SV_L1 | 8.16 | SV_L4 | 6.93 | 1.23 | 0.007 | p < 0.01 |
| SV_L1 | 8.16 | SV_S1 | 7.05 | 1.10 | 0.027 | p < 0.05 |
| SV_L1 | 8.16 | SV_S2 | 6.65 | 1.51 | <0.001 | p < 0.001 |
| SV_L1 | 8.16 | SV_S3 | 6.80 | 1.35 | 0.002 | p < 0.01 |
| SV_L2 | 7.41 | CBD_L1 | 4.48 | 2.93 | <0.001 | p < 0.001 |
| SV_L3 | 7.41 | CBD_L1 | 4.48 | 2.93 | <0.001 | p < 0.001 |
| SV_L4 | 6.93 | CBD_L1 | 4.48 | 2.45 | <0.001 | p < 0.001 |
| SV_S1 | 7.05 | CBD_L1 | 4.48 | 2.57 | <0.001 | p < 0.001 |
| SV_S2 | 6.65 | CBD_L1 | 4.48 | 2.16 | <0.001 | p < 0.001 |
| SV_S3 | 6.80 | CBD_L1 | 4.48 | 2.32 | <0.001 | p < 0.001 |
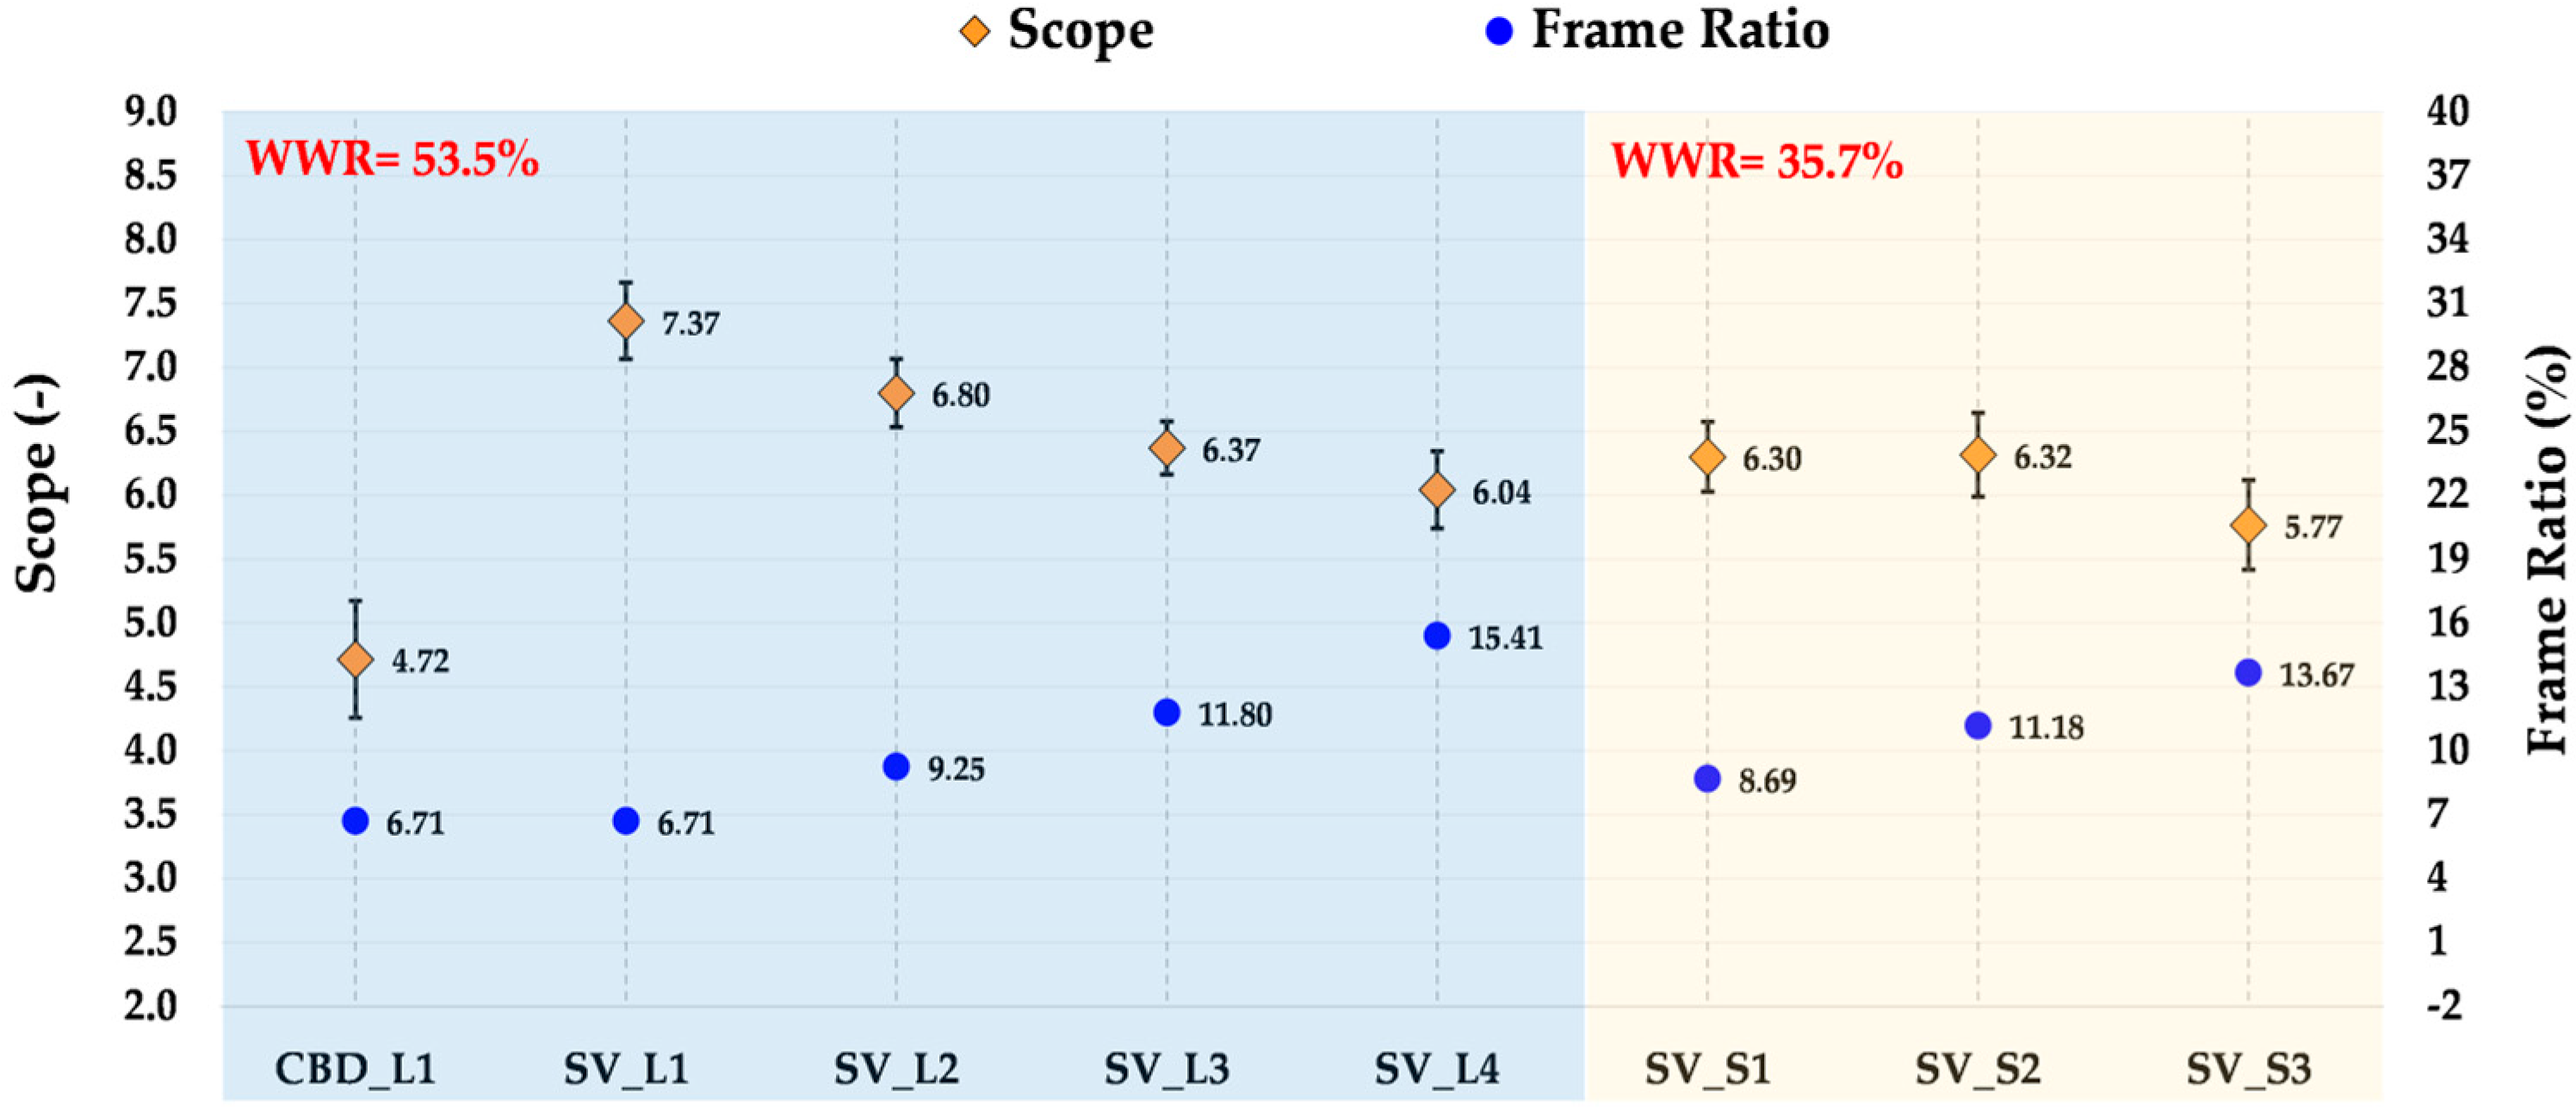
- the maximum marginal means of scope is observed in SV_L1, with a value of 7.37, characterized by the maximum WWR (53.5%) and the minimum FR (6.71%), as can be seen from Figure 12;
- when comparing the SV_L1 scenario with CBD_L1 under the same window design conditions (WWR of 53.5% and FR of 6.71%), participants attributed higher scope to the Small Village (mean value = 7.37) than to the City Business District (mean value = 4.72), as shown in Figure 12;
- scenarios SV_L1, SV_L2, SV_L3, SV_L4, SV_S1 and SV_S2 have significantly higher scope values than scenario CBD_L1 (Table 8).
- the SV_L1, SV_L2, SV_L3, SV_L4 scenarios with WWR equal to 53.5% as the FR increases (from 6.71% to 15.41%) and therefore the GP value (from 1 to 6) progressively reduces the marginal mean scope from the value of 7.37 to 6.04 (Figure 12).
- among the scenarios set in the Small Village, the pairwise comparison of the scope value of SV_L1(mean value = 7.37) with both SV_L4 (mean value = 6.04) and SV_S3 (mean value = 5.77) reveals a significant difference (see Figure 12 and Table 8), in particular, higher values for SV_L1 (with WWR = 53.5% and GP = 1) compared to SV_L4 (with WWR = 53.5% and GP = 6) and SV_S3 (with WWR = 35.7% and GP = 3).

- the maximum marginal means of PRS-11 is observed in SV_L1, with a value of 7.66, characterized by the maximum WWR (53.5%) and the minimum FR (6.71%) and one GP, as can be seen from Figure 13;
- when comparing the SV_L1 scenario with CBD_L1 under the same window design conditions (WWR of 53.5% and FR of 6.71%), participants attributed higher PRS-11 to the Small Village (mean value = 7.66) than to the City Business District (mean value = 4.43), as shown in Figure 13;
- among the scenarios set in the Small Village, the pairwise comparison of the PRS-11 value of SV_L1 (mean value = 7.66) with SV_L4 (mean value = 6.40), SV_S1 (mean value = 6.45), SV_S2 (mean value = 6.55) and SV_S3 (mean value = 6.55) reveals a significant difference (see Figure 13 and Table 9), in particular, higher values for SV_L1 (with WWR = 53.5% and GP = 1) compared to SV_L4 (with WWR = 53.5% and GP = 6) and cases SV_S1, SV_S2, SV_S3 with same WWR = 35.7% and value of GPs ranges from 1 to 3.
- as the WWR increases (from 35.7% to 53.5%) while maintaining the same GP, an increase in the marginal means PRS-11 value is observed (Figure 13);
- for a given WWR value (53.5% or 35.7%), when varying the number of GPs (from 1 to 6), a higher marginal means PRS-11 value is found for cases with GP equal to 1 (Figure 13).
- the SV_L1, SV_L2, SV_L3, SV_L4 scenarios with WWR equal to 53.5% as the FR increases (from 6.71% to 15.41%) and therefore the GP value (from 1 to 6) progressively reduces the marginal mean PRS-11 from the value of 7.66 to 6.40 (Figure 11).
4. Discussion
5. Conclusions
Author Contributions
Funding
Institutional Review Board Statement
Informed Consent Statement
Data Availability Statement
Acknowledgments
Conflicts of Interest
Appendix A
| Question | ||
| Quanto eri consapevole del mondo reale circostante mentre navigavi nel mondo virtuale (ad esempio suoni, temperatura ambiente, altre persone, ecc.)? | ||
| estremamente consapevole −3 −2 −1 0 +1 +2 +3 non ne ero affatto consapevole | ||
| moderatamenteconsapevole | INV1 | |
| Quanto ti è sembrato reale l’ambiente virtuale? | ||
| completamente reale −3 −2 −1 0 +1 +2 +3 per niente reale | ||
| REAL1 | ||
| Avevo la sensazione di agire nello spazio virtuale, piuttosto che controllarlo dall’esterno. | ||
| completamente in disaccordo −3 −2 −1 0 +1 +2 +3 pianamente d’accordo | ||
| SP4 | ||
| Quanto la tua esperienza nell’ambiente virtuale ti è sembrata coerente con la tua esperienza nel mondo reale? | ||
| non coerente −3 −2 −1 0 +1 +2 +3 molto coerente | ||
| moderatamentecoerente | REAL2 | |
| Quanto ti è sembrato reale il mondo virtuale? | ||
| come un mondo immaginario −3 −2 −1 0 +1 +2 +3 indistinguibile dal mondo reale | ||
| REAL3 | ||
| Non mi sentivo presente nello spazio virtuale. | ||
| non mi sentivo presente −3 −2 −1 0 +1 +2 +3 mi sentivo presente | ||
| SP3 | ||
| Non ero consapevole dell’ambiente reale che mi circondava. | ||
| completamente in disaccordo −3 −2 −1 0 +1 +2 +3 pienamente d’accordo | ||
| INV2 | ||
| Nel mondo generato dal computer avevo la sensazione di “essere lì” | ||
| per niente −3 −2 −1 0 +1 +2 +3 molto | ||
| G1 | ||
| In qualche modo sentivo che il mondo virtuale mi circondava. | ||
| completamente in disaccordo −3 −2 −1 0 +1 +2 +3 pienamente d’accordo | ||
| SP1 | ||
| Mi sentivo presente nello spazio virtuale. | ||
| completamente in disaccordo −3 −2 −1 0 +1 +2 +3 pienamente d’accordo | ||
| SP5 | ||
| Ho continuato a prestare attenzione all’ambiente reale. | ||
| completamente in disaccordo −3 −2 −1 0 +1 +2 +3 pienamente d’accordo | ||
| INV3 | ||
| Il mondo virtuale sembrava più realistico del mondo reale. | ||
| completamente in disaccordo −3 −2 −1 0 +1 +2 +3 pienamente d’accordo | ||
| REAL4 | ||
| Mi sembrava di percepire solo delle immagini. | ||
| completamente in disaccordo −3 −2 −1 0 +1 +2 +3 pienamente d’accordo | ||
| SP2 | ||
| Ero completamente affascinato dal mondo virtuale. | ||
| completamente in disaccordo −3 −2 −1 0 +1 +2 +3 pienamente d’accordo | ||
| INV4 | ||
| Question |
| Luoghi come questo sono affascinanti |
| Per niente 1 2 3 4 5 6 7 8 9 10 Molto |
| In luoghi come questo la mia attenzione è attirata da molte cose interessanti |
| Per niente 1 2 3 4 5 6 7 8 9 10 Molto |
| In luoghi come questo è difficile annoiarsi |
| Per niente 1 2 3 4 5 6 7 8 9 10 Molto |
| Luoghi come questo sono un rifugio dai fastidi |
| Per niente 1 2 3 4 5 6 7 8 9 10 Molto |
| Per allontanarmi da cose che di solito richiedono la mia attenzione, mi piace andare in luoghi come questo |
| Per niente 1 2 3 4 5 6 7 8 9 10 Molto |
| Per smettere di pensare alle cose che devo fare, mi piace stare in luoghi come questo |
| Per niente 1 2 3 4 5 6 7 8 9 10 Molto |
| C’è un ordine chiaro nella disposizione fisica dei luoghi come questo |
| Per niente 1 2 3 4 5 6 7 8 9 10 Molto |
| In posti come questo è facile vedere come sono organizzate le cose |
| Per niente 1 2 3 4 5 6 7 8 9 10 Molto |
| In luoghi come questo tutto sembra avere il suo giusto posto |
| Per niente 1 2 3 4 5 6 7 8 9 10 Molto |
| Questo posto è abbastanza grande per consentire l’esplorazione in molte direzioni |
| Per niente 1 2 3 4 5 6 7 8 9 10 Molto |
| In luoghi come questo ci sono pochi elementi che limitano la possibilità di muovermi |
| Per niente 1 2 3 4 5 6 7 8 9 10 Molto |
| Sub-Scale | MeanValue | StandardDeviation | RankingClass | VisualModalityUsed | SampleSize |
| General Presence | 1.16 | 1.48 | Moderate | 3D-HMD | 32 |
| Spatial Presence | 1.25 | 1.06 | Moderate | ||
| Involvement | 0.45 | 1.11 | Moderate | ||
| Experienced Realism | 0.73 | 0.96 | Very High | ||
| Overall IPQ scale (3D-HMD) | 0.90 | 1.20 | High |
References
- Battisti, E.; Alfiero, S.; Leonidou, E. Remote Working and Digital Transformation during the COVID-19 Pandemic: Economic–Financial Impacts and Psychological Drivers for Employees. J. Bus. Res. 2022, 150, 38–50. [Google Scholar] [CrossRef] [PubMed]
- Dominoni, A.; Scullica, F. Designing Behaviours for Well-Being Spaces; Barbara, A., Bosoni, G., Camocini, B., Dominoni, A., Rossi, M., Scullica, F., Eds.; FrancoAngeli s.r.l: Milano, Italy, 2022; ISBN 9788835133636. [Google Scholar]
- Bosworth, G.; Whalley, J.; Fuzi, A.; Merrell, I.; Chapman, P.; Russell, E. Rural Co-Working: New Network Spaces and New Opportunities for a Smart Countryside. J. Rural. Stud. 2023, 97, 550–559. [Google Scholar] [CrossRef]
- Wijesooriya, N.; Brambilla, A. Bridging Biophilic Design and Environmentally Sustainable Design: A Critical Review. J. Clean Prod. 2021, 283, 124591. [Google Scholar] [CrossRef]
- Zhong, W.; Schroeder, T.; Bekkering, J. Designing with Nature: Advancing Three-Dimensional Green Spaces in Architecture through Frameworks for Biophilic Design and Sustainability. Front. Archit. Res. 2023, 12, 732–753. [Google Scholar] [CrossRef]
- Elnagar, E.; Düvier, C.; Batra, Z.; Christoffersen, J.; Mandin, C.; Schweiker, M.; Wargocki, P. Creating a Comprehensive Framework for Design, Construction and Management of Healthy Buildings. Energy Build. 2024, 324, 114883. [Google Scholar] [CrossRef]
- Ko, W.H.; Schiavon, S.; Santos, L.; Kent, M.G.; Kim, H.; Keshavarzi, M. View Access Index: The Effects of Geometric Variables of Window Views on Occupants’ Satisfaction. Build Environ. 2023, 234, 110132. [Google Scholar] [CrossRef]
- Ko, W.H.; Kent, M.G.; Schiavon, S.; Levitt, B.; Betti, G. A Window View Quality Assessment Framework. LEUKOS 2022, 18, 268–293. [Google Scholar] [CrossRef]
- Meng, X.; Wang, M. Exploring the Health Impacts of Window Views: A Literature Review. J. Asian Archit. Build. Eng. 2024, 1–24. [Google Scholar] [CrossRef]
- Kim, J.; de Dear, R. Nonlinear Relationships between Individual IEQ Factors and Overall Workspace Satisfaction. Build. Environ. 2012, 49, 33–40. [Google Scholar] [CrossRef]
- Ochoa, C.E.; Aries, M.B.C.; van Loenen, E.J.; Hensen, J.L.M. Considerations on Design Optimization Criteria for Windows Providing Low Energy Consumption and High Visual Comfort. Appl. Energy 2012, 95, 238–245. [Google Scholar] [CrossRef]
- Rosato, A.; El Youssef, M.; Guarino, F.; Ciervo, A.; Sibilio, S. Experimental Studies of Air-Handling Units’ Faulty Operation for the Development of Data-Driven Fault Detection and Diagnosis Tools: A Systematic Review. Energy Rep. 2022, 8, 494–503. [Google Scholar] [CrossRef]
- Ciampi, G.; Ciervo, A.; Rosato, A.; Sibilio, S.; Di Nardo, A. Parametric Simulation Analysis of a Centralized Solar Heating System with Long-Term Thermal Energy Storage Serving a District of Residential and School Buildings in Italy. Adv. Model. Anal. A 2018, 55, 165–172. [Google Scholar] [CrossRef]
- Beute, F.; de Kort, Y.A.W. Salutogenic Effects of the Environment: Review of Health Protective Effects of Nature and Daylight. Appl. Psychol. Health Well Being 2014, 6, 67–95. [Google Scholar] [CrossRef] [PubMed]
- Küller, R.; Ballal, S.; Laike, T.; Mikellides, B.; Tonello, G. The Impact of Light and Colour on Psychological Mood: A Cross-Cultural Study of Indoor Work Environments. Ergonomics 2006, 49, 1496–1507. [Google Scholar] [CrossRef]
- Benfield, J.A.; Rainbolt, G.N.; Bell, P.A.; Donovan, G.H. Classrooms With Nature Views: Evidence of Differing Student Perceptions and Behaviors. Environ. Behav. 2015, 47, 140–157. [Google Scholar] [CrossRef]
- Ko, W.H.; Schiavon, S.; Zhang, H.; Graham, L.T.; Brager, G.; Mauss, I.; Lin, Y.W. The Impact of a View from a Window on Thermal Comfort, Emotion, and Cognitive Performance. Build. Environ. 2020, 175, 106779. [Google Scholar] [CrossRef]
- Leather, P.; Pyrgas, M.; Beale, D.; Lawrence, C. Windows in the Workplace: Sunlight, View, and Occupational Stress. Environ. Behav. 1998, 30, 739–762. [Google Scholar] [CrossRef]
- Yildirim, K.; Akalin-Baskaya, A.; Celebi, M. The Effects of Window Proximity, Partition Height, and Gender on Perceptions of Open-Plan Offices. J. Environ. Psychol. 2007, 27, 154–165. [Google Scholar] [CrossRef]
- Aries, M.B.C.; Veitch, J.A.; Newsham, G.R. Windows, View, and Office Characteristics Predict Physical and Psychological Discomfort. J. Environ. Psychol. 2010, 30, 533–541. [Google Scholar] [CrossRef]
- Hellinga, H.I. Daylight and View: The Influence of Windows on the Visual Quality of Indoor Spaces. Ph.D. Thesis, Delft University of Technology, Delft, The Netherlands, 2013. [Google Scholar]
- Jamrozik, A.; Clements, N.; Hasan, S.S.; Zhao, J.; Zhang, R.; Campanella, C.; Loftness, V.; Porter, P.; Ly, S.; Wang, S.; et al. Access to Daylight and View in an Office Improves Cognitive Performance and Satisfaction and Reduces Eyestrain: A Controlled Crossover Study. Build. Environ. 2019, 165, 106379. [Google Scholar] [CrossRef]
- Hill, A.R.; Markus, T.A. Some Factors Influencing Vision through Meshes. Arch. Sci. Rev. 1968, 11, 123–136. [Google Scholar] [CrossRef]
- Markus, T.A. The Function of Windows—A Reappraisal. Build. Sci. 1967, 2, 97–121. [Google Scholar] [CrossRef]
- Ne’eman, E.; Hopkinson, R.G. Critical Minimum Acceptable Window Size: A Study of Window Design and Provision of a View. Light. Res. Technol. 1970, 2, 17–27. [Google Scholar] [CrossRef]
- Ko, W.H.; Schiavon, S.; Altomonte, S.; Andersen, M.; Batool, A.; Browning, W.; Burrell, G.; Chamilothori, K.; Chan, Y.C.; Chinazzo, G.; et al. Window View Quality: Why It Matters and What We Should Do. LEUKOS—J. Illum. Eng. Soc. Nor. Am. 2022, 18, 259–267. [Google Scholar] [CrossRef]
- Abd-Alhamid, F.; Kent, M.; Wu, Y. Quantifying Window View Quality: A Review on View Perception Assessment and Representation Methods. Build. Environ. 2023, 227, 109742. [Google Scholar] [CrossRef]
- Keighley, E.C. Visual Requirements and Reduced Fenestration in Offices—A Study of Multiple Apertures and Window Area. Build. Sci. 1973, 8, 321–331. [Google Scholar] [CrossRef]
- Li, J.; Zheng, B.; Bedra, K.B.; Li, Z.; Chen, X. Evaluating the Effect of Window-to-Wall Ratios on Cooling-Energy Demand on a Typical Summer Day. Int. J. Environ. Res. Public Health 2021, 18, 8411. [Google Scholar] [CrossRef]
- Ma, R.; Ma, R.; Long, E. Analysis of the Rule of Window-to-Wall Ratio on Energy Demand of Residential Buildings in Different Locations in China. Heliyon 2023, 9, e12803. [Google Scholar] [CrossRef]
- Tawfeeq, H.; Qaradaghi, A.M.A. Optimising Window-to-Wall Ratio for Enhanced Energy Efficiency and Building Intelligence in Hot Summer Mediterranean Climates. Sustainability 2024, 16, 7342. [Google Scholar] [CrossRef]
- Cherier, M.K.; Hamdani, M.; Kamel, E.; El Amine Bekkouche, S.M.; Guermoui, M.; Al-Saadi, S.; Djeffal, R.; Bashir, M.O.; Elshekh, A.E.A.; Drozdova, L.; et al. Impact of Glazing Type, Window-to-Wall Ratio, and Orientation on Building Energy Savings Quality: A Parametric Analysis in Algerian Climatic Conditions. Case Stud. Therm. Eng. 2024, 61, 104902. [Google Scholar] [CrossRef]
- Dogrusoy, I.T.; Tureyen, M. A Field Study on Determination of Preferences for Windows in Office Environments. Build. Environ. 2007, 42, 3660–3668. [Google Scholar] [CrossRef]
- Hong, T.; Lee, M.; Yeom, S.; Jeong, K. Occupant Responses on Satisfaction with Window Size in Physical and Virtual Built Environments. Build. Environ. 2019, 166, 106409. [Google Scholar] [CrossRef]
- Yeom, S.; Kim, H.; Hong, T.; Lee, M. Determining the Optimal Window Size of Office Buildings Considering the Workers’ Task Performance and the Building’s Energy Consumption. Build. Environ. 2020, 177, 106872. [Google Scholar] [CrossRef]
- Zhang, Y.; Jing, X.; Liu, C.; Sun, Y.; Wang, W.; Gao, W. Restorative Benefits of Classroom Windows: A Study on the Effect of Window:Wall Ratio on Task Load and Learning Performance Based on VR Technology. Int. J. Low-Carbon Technol. 2024, 19, 1491–1500. [Google Scholar] [CrossRef]
- Scorpio, M.; Bladowski, A.; Geisler-Moroder, D.; Martyniuk-Pęczek, J.; Sibilio, S.; Pfluger, R.; Sokół, N. Virtual Reality in Lighting Design: Insights from Academia and an International Survey among Professionals. J. Build. Eng. 2025, 102, 112036. [Google Scholar] [CrossRef]
- Contini, G.; Grandi, F.; Peruzzini, M. Human-Centric Green Design for Automatic Production Lines: Using Virtual and Augmented Reality to Integrate Industrial Data and Promote Sustainability. J. Ind. Inf. Integr. 2025, 44, 100801. [Google Scholar] [CrossRef]
- Abd-Alhamid, F.; Kent, M.; Bennett, C.; Calautit, J.; Wu, Y. Developing an Innovative Method for Visual Perception Evaluation in a Physical-Based Virtual Environment. Build. Environ. 2019, 162, 106278. [Google Scholar] [CrossRef]
- Adams, R.; Finn, P.; Moes, E.; Flannery, K.; Rizzo, A. Distractibility in Attention/Deficit/Hyperactivity Disorder (ADHD): The Virtual Reality Classroom. Child Neuropsychol. 2009, 15, 120–135. [Google Scholar] [CrossRef]
- Parsons, T.D.; Bowerly, T.; Buckwalter, J.G.; Rizzo, A.A. A Controlled Clinical Comparison of Attention Performance in Children with ADHD in a Virtual Reality Classroom Compared to Standard Neuropsychological Methods. Child Neuropsychol. 2007, 13, 363–381. [Google Scholar] [CrossRef]
- Ali, Z.; Usman, M. A Framework for Game Engine Selection for Gamification and Serious Games. In Proceedings of the 2016 Future Technologies Conference (FTC), San Francisco, CA, USA, 6–7 December 2016; pp. 1199–1207. [Google Scholar] [CrossRef]
- Iftekhar, M.W.; Prajapati, R.J. Impact of Virtual Reality and Eco-Friendly Interior Design Tool on Carbon Emission. J. Online Eng. Educ. 2023, 14, 32–40. [Google Scholar] [CrossRef]
- Lombard, M.; Ditton, T. At the Heart of It All: The Concept of Presence. J. Comput.-Mediat. Commun. 1997, 3. [Google Scholar] [CrossRef]
- Schubert, T.; Friedmann, F.; Regenbrecht, H. The Experience of Presence: Factor Analytic Insights. Presence Teleoperators Virtual. Environ. 2001, 10, 266–281. [Google Scholar] [CrossRef]
- Müller, J.; Langlotz, T.; Regenbrecht, H. PanoVC: Pervasive Telepresence Using Mobile Phones. In Proceedings of the 2016 IEEE International Conference on Pervasive Computing and Communications (PerCom), Sydney, Australia, 14–19 March 2016; pp. 1–10. [Google Scholar]
- Schwind, V.; Knierim, P.; Haas, N.; Henze, N. Using Presence Questionnaires in Virtual Reality. In Proceedings of the 2019 CHI Conference on Human Factors in Computing Systems (CHI ’19), Glasgow, Scotland, 4–9 May 2019; ACM: New York, NY, USA, 2019; pp. 1–12. [Google Scholar]
- Tran, T.Q.; Langlotz, T.; Young, J.; Schubert, T.W.; Regenbrecht, H. Classifying Presence Scores: Insights and Analysis from Two Decades of the Igroup Presence Questionnaire (IPQ). ACM Trans. Comput Hum. Interact. 2024, 1, 1–26. [Google Scholar] [CrossRef]
- Pasini, M.; Brondino, M.; Trombin, R.; Filippi, Z. A Participatory Interior Design Approach for a Restorative Work Environment: A Research-Intervention. Front Psychol. 2021, 12, 3742. [Google Scholar] [CrossRef]
- Bluyssen, P.M.; Aries, M.; van Dommelen, P. Comfort of Workers in Office Buildings: The European HOPE Project. Build. Environ. 2011, 46, 280–288. [Google Scholar] [CrossRef]
- Ulrich, R.S. Aesthetic and Affective Response to Natural Environment. In Behavior and the Natural Environment; Springer: Boston, MA, USA, 1983; pp. 85–125. [Google Scholar] [CrossRef]
- Kaplan, S. The Restorative Benefits of Nature: Toward an Integrative Framework. J. Environ. Psychol. 1995, 15, 169–182. [Google Scholar] [CrossRef]
- Berman, M.G.; Jonides, J.; Kaplan, S. The Cognitive Benefits of Interacting with Nature. Psychol. Sci. 2008, 19, 1207–1212. [Google Scholar] [CrossRef]
- Watts, G. The Effects of “Greening” Urban Areas on the Perceptions of Tranquillity. Urban Urban Green 2017, 26, 11–17. [Google Scholar] [CrossRef]
- Dzhambov, A.; Dimitrova, D. Urban Green Spaces′ Effectiveness as a Psychological Buffer for the Negative Health Impact of Noise Pollution: A Systematic Review. Noise Health 2014, 16, 157–165. [Google Scholar] [CrossRef]
- De Coensel, B.; Vanwetswinkel, S.; Botteldooren, D. Effects of Natural Sounds on the Perception of Road Traffic Noise. J. Acoust. Soc. Am. 2011, 129, EL148–EL153. [Google Scholar] [CrossRef]
- Watts, G.R.; Pheasant, R.J.; Horoshenkov, K.V.; Ragonesi, L. Measurement and Subjective Assessment of Water Generated Sounds. Acta Acust. United Acust. 2009, 95, 1032–1039. [Google Scholar] [CrossRef]
- Jeon, J.Y.; Lee, P.J.; You, J.; Kang, J. Perceptual Assessment of Quality of Urban Soundscapes with Combined Noise Sources and Water Sounds. J. Acoust. Soc. Am. 2010, 127, 1357–1366. [Google Scholar] [CrossRef] [PubMed]
- Axelsson, Ö.; Nilsson, M.E.; Hellström, B.; Lundén, P. A Field Experiment on the Impact of Sounds from a Jet-and-Basin Fountain on Soundscape Quality in an Urban Park. Landsc. Urban Plan 2014, 123, 49–60. [Google Scholar] [CrossRef]
- Chau, C.K.; Leung, T.M.; Xu, J.M.; Tang, S.K. Modelling Noise Annoyance Responses to Combined Sound Sources and Views of Sea, Road Traffic, and Mountain Greenery. J. Acoust. Soc. Am. 2018, 144, 3503–3513. [Google Scholar] [CrossRef]
- Lugten, M.; Karacaoglu, M.; White, K.; Kang, J.; Steemers, K. Improving the Soundscape Quality of Urban Areas Exposed to Aircraft Noise by Adding Moving Water and Vegetation. J. Acoust. Soc. Am. 2018, 144, 2906–2917. [Google Scholar] [CrossRef]
- Chung, W.K.; Chau, C.K.; Masullo, M.; Pascale, A. Modelling Perceived Oppressiveness and Noise Annoyance Responses to Window Views of Densely Packed Residential High-Rise Environments. Build. Environ. 2019, 157, 127–138. [Google Scholar] [CrossRef]
- Kaplan, R. The Role of Nature in the Context of the Workplace. Landsc. Urban Plan. 1993, 26, 193–201. [Google Scholar] [CrossRef]
- Kaplan, R.; Kaplan, S. The Experience of Nature: A Psychological Perspective; Cambridge University Press: Cambridge, UK, 1989. [Google Scholar]
- Hartig, T.; Korpela, K.; Evans, G.W.; Gärling, T. A Measure of Restorative Quality in Environments. Scand. Hous. Plan. Res. 1997, 14, 175–194. [Google Scholar] [CrossRef]
- Hartig, T.; Evans, G.W.; Jamner, L.D.; Davis, D.S.; Gärling, T. Tracking Restoration in Natural and Urban Field Settings. J. Environ. Psychol. 2003, 23, 109–123. [Google Scholar] [CrossRef]
- Pasini, M.; Berto, R.; Brondino, M.; Hall, R.; Ortner, C. How to Measure the Restorative Quality of Environments: The PRS-11. Procedia. Soc. Behav. Sci. 2014, 159, 293–297. [Google Scholar] [CrossRef]
- Krzywicka, P.; Byrka, K. Restorative Qualities of and Preference for Natural and Urban Soundscapes. Front. Psychol. 2017, 8, 268521. [Google Scholar] [CrossRef] [PubMed]
- Alvarsson, J.J.; Wiens, S.; Nilsson, M.E. Stress Recovery during Exposure to Nature Sound and Environmental Noise. Int. J. Environ. Res. Public Health 2010, 7, 1036. [Google Scholar] [CrossRef] [PubMed]
- Medvedev, O.; Shepherd, D.; Hautus, M.J. The Restorative Potential of Soundscapes: A Physiological Investigation. Appl. Acoust. 2015, 96, 20–26. [Google Scholar] [CrossRef]
- Zhang, Y.; Kang, J.; Kang, J. Effects of Soundscape on the Environmental Restoration in Urban Natural Environments. Noise Health 2017, 19, 65–72. [Google Scholar] [CrossRef]
- Guo, X.; Liu, J.; Albert, C.; Hong, X.C. Audio-Visual Interaction and Visitor Characteristics Affect Perceived Soundscape Restorativeness: Case Study in Five Parks in China. Urban Urban Green 2022, 77, 127738. [Google Scholar] [CrossRef]
- Ma, H.; Shu, S. An Experimental Study: The Restorative Effect of Soundscape Elements in a Simulated Open-Plan Office. Acta Acust. United Acust. 2018, 104, 106–115. [Google Scholar] [CrossRef]
- Masullo, M.; Maffei, L.; Pascale, A.; Senese, V.P.; De Stefano, S.; Chau, C.K. Effects of Evocative Audio-Visual Installations on the Restorativeness in Urban Parks. Sustainability 2021, 13, 8328. [Google Scholar] [CrossRef]
- Jahncke, H.; Halin, N. Performance, Fatigue and Stress in Open-Plan Offices: The Effects of Noise and Restoration on Hearing Impaired and Normal Hearing Individuals. Noise Health 2012, 14, 260–272. [Google Scholar] [CrossRef]
- Watts, G.; Khan, A.; Pheasant, R. Influence of Soundscape and Interior Design on Anxiety and Perceived Tranquillity of Patients in a Healthcare Setting. Appl. Acoust. 2016, 104, 135–141. [Google Scholar] [CrossRef]
- Scopelliti, M.; Carrus, G.; Bonaiuto, M. Is It Really Nature That Restores People? A Comparison with Historical Sites with High Restorative Potential. Front. Psychol. 2019, 9, 2742. [Google Scholar] [CrossRef]
- Berto, R.; Barbiero, G.; Pasini, M.; Pieter, U. Biophilic Design Triggers Fascination and Enhances Psychological Restoration in the Urban Environment. J. Biourbanism. 2015, 1, 27–34. [Google Scholar] [CrossRef]
- Weber, A.M.; Trojan, J. The Restorative Value of the Urban Environment: A Systematic Review of the Existing Literature. Environ. Health Insights. 2018, 12, 1–13. [Google Scholar] [CrossRef] [PubMed]
- Wang, S.S.; Xu, Y.; Yang, X.; Zhang, Y.; Yan, P.; Jiang, Y.; Wang, K. Urban Cultural Heritage Is Mentally Restorative: An Experimental Study Based on Multiple Psychophysiological Measures. Front. Psychol. 2023, 14, 1132052. [Google Scholar] [CrossRef]
- Masullo, M.; Ozcevik Bilen, A.; Toma, R.A.; Akin Güler, G.; Maffei, L. The Restorativeness of Outdoor Historical Sites in Urban Areas: Physical and Perceptual Correlations. Sustainability 2021, 13, 5603. [Google Scholar] [CrossRef]
- Fornara, F.; Troffa, R. Restorative Experiences and Perceived Affective Qualities in Different Built and Natural Urban Places. In Proceedings of the International IAPS-CSBE & HOUSING Network 2009, Amasya, Turkey, 13–16 October 2009; pp. 1–10. [Google Scholar]
- Galindo, M.A.P.; Hidalgo, M.A.C. Aesthetic Preferences and the Attribution of Meaning: Environmental Categorization Processes in the Evaluation of Urban Scenes. Int. J. Psychol. 2005, 40, 19–26. [Google Scholar] [CrossRef]
- Hidalgo, M.C.; Berto, R.; Galindo, M.P.; Getrevi, A. Identifying Attractive and Unattractive Urban Places: Categories, Restorativeness and Aesthetic Attributes. Medio. Ambiente Y Comport. Hum. 2006, 7, 115–133. [Google Scholar]
- Rapuano, M.; Ruotolo, F.; Ruggiero, G.; Masullo, M.; Maffei, L.; Galderisi, A.; Palmieri, A.; Iachini, T. Spaces for Relaxing, Spaces for Recharging: How Parks Affect People’s Emotions. J. Environ. Psychol. 2022, 81, 101809. [Google Scholar] [CrossRef]
- Kim, M.J.; Lee, C.K.; Kim, J.S.; Petrick, J.F. Wellness Pursuit and Slow Life Seeking Behaviors: Moderating Role of Festival Attachment. Sustainability 2019, 11, 2020. [Google Scholar] [CrossRef]
- Botta, M. Evolution of the Slow Living Concept within the Models of Sustainable Communities. Futures 2016, 80, 3–16. [Google Scholar] [CrossRef]
- Parkins, W.; Craig, G. Slow Living; Berg: Oxford, UK, 2006; ISBN 9781845201609. [Google Scholar]
- Italian Ministry of Cultural Heritage National Small Villages Plan. Available online: https://cultura.gov.it/pnrr-borghi (accessed on 18 June 2025).
- Ivona, A.; Lopez, L. Preserving and Developing Small Italian Borghi. An Economic Strategy to Enhance Sustainable Cultural Tourism? Sustainability 2025, 17, 1621. [Google Scholar] [CrossRef]
- Maffei, L.; Ciervo, A.; Marzocchi, R.; Masullo, M. Exploring the Restorative Benefits of Work in Smart Working Structures on Vacations in Small Villages. Front. Psychol. 2023, 14, 1232318. [Google Scholar] [CrossRef] [PubMed]
- Italian Government. Italia Domani: The National Recovery and Resilience Plan. Available online: https://www.italiadomani.gov.it (accessed on 18 June 2025).
- Castanò, F.; Maffei, L.; Marzocchi, R.; Morelli, M.D. Slowork, Room with View. Behaviors, Heritage, Design for New Lifestyles. In Proceedings of the Proceedings Book of Extended Abstracts “BEYOND ALL LIMITS—International Conference on Sustainability in Architecture, Planning, and Design”, 2022, Caserta, Italy, 11–12 May 2022; pp. 469–474. [Google Scholar]
- Maffei, L.; Ciervo, A.; Perrotta, A.; Masullo, M.; Rosato, A. Innovative Energy-Efficient Prefabricated Movable Buildings for Smart/Co-Working: Performance Assessment upon Varying Building Configurations. Sustainability 2023, 15, 9581. [Google Scholar] [CrossRef]
- Ciervo, A.; Masullo, M.; Boucherit, S.; Maffei, L.; Rosato, A. Effects of Climatic Conditions on Performance of Innovative Prefabricated Movable Buildings for Smart/Co-Working in Small Villages of Southern Italy. Int. J. Sustain. Dev. Plan. 2024, 19, 4127–4134. [Google Scholar] [CrossRef]
- Browning, W.D.; Ryan, C.O. Nature Inside, A Biophilic Design Guide; RIBA Publishing: London, UK, 2020. [Google Scholar]
- Ciervo, A.; Rosato, A.; Castanò, F.; Morelli, M.D.; Masullo, M.; Marzocchi, R.; Boucherit, S. Research Project Title: New Movable Systems for Smart/Co-Working Taking Advantage of Life Quality, Sustainability and Energy Efficiency (RESTANZA); University of Campania Luigi Vanvitelli: Aversa, Italy, 2023. [Google Scholar]
- Italian Government. National Recovery and Resilience Plan. Available online: https://www.governo.it/sites/governo.it/files/PNRR_0.pdf (accessed on 18 June 2025).
- Ministry of Business and Made in Italy Ultra-Broadband Plan. Available online: https://bandaultralarga.italia.it/ (accessed on 18 June 2025).
- Trimble SketchUp Pro. Available online: https://www.sketchup.com/en (accessed on 18 June 2025).
- Autodesk 3ds Max Software. Available online: https://www.autodesk.com/asean/products/3ds-max/overview?term=1-YEAR&tab=subscription (accessed on 18 June 2025).
- Head Acoustics SQobold. Available online: https://www.head-acoustics.com/products/data-acquisition/sqobold (accessed on 18 June 2025).
- Svobodova, K.; Vojar, J.; Sklenicka, P.; Filova, L. Presentation Matters: Causes of Differences in Preferences for Agricultural Landscapes Displayed via Photographs and Videos. Space Cult. 2018, 21, 259–273. [Google Scholar] [CrossRef]
- Palmer, J.F.; Hoffman, R.E. Rating Reliability and Representation Validity in Scenic Landscape Assessments. Landsc Urban Plan 2001, 54, 149–161. [Google Scholar] [CrossRef]
- Lin, T.Y.; Le, A.V.; Chan, Y.C. Evaluation of Window View Preference Using Quantitative and Qualitative Factors of Window View Content. Build. Environ. 2022, 213, 108886. [Google Scholar] [CrossRef]
- Schubert, T.W. The Sense of Presence in Virtual Environments: A Three-Component Scale Measuring Spatial Presence, Involvement, and Realness. Z. Für. Medien. 2003, 15, 69–71. [Google Scholar] [CrossRef]
- Igroup Presence Questionnaire (IPQ). Available online: https://www.igroup.org/pq/ipq/download.php (accessed on 18 June 2025).
- Slater, M.; Usoh, M. Representations Systems, Perceptual Position, and Presence in Immersive Virtual Environments. Presence Teleoperators Virtual. Environ. 1993, 2, 221–233. [Google Scholar] [CrossRef]
- Witmer, B.G.; Singer, M.J. Measuring Presence in Virtual Environments. In ARI Technical Report; Army Research Institute for the Behavioral and Social Sciences: Alexandria, VA, USA, 1994; pp. 1–53. [Google Scholar]
- Hendrix, C.M. Exploratory Studies on the Sense of Presence in Virtual Environments as a Function of Visual and Auditory Display Parameters. Master’ s thesis, University of Washington, Seattle, WA, USA, 1994. [Google Scholar]
- Carlin, A.S.; Hoffman, H.G.; Weghorst, S. Virtual Reality and Tactile Augmentation in the Treatment of Spider Phobia: A Case Report. Behav. Res. Ther. 1997, 35, 153–158. [Google Scholar] [CrossRef]
- Unicampania SENS I-Lab. Available online: https://www.architettura.unicampania.it/images/ricerca/laboratori/EN/SENS-i_Lab_2024_EN_REV01.pdf (accessed on 15 March 2025).
- Oculus Oculus Rift, S. Available online: https://vr-compare.com/headset/oculusrifts (accessed on 18 June 2025).
- Faul, F.; Erdfelder, E.; Lang, A.-G.; Buchner, A. G*Power 3: A Flexible Statistical Power Analysis Program for the Social, Behavioral, and Biomedical Sciences. Behav. Res. Methods 2007, 32, 175–191. [Google Scholar] [CrossRef]
- Faul, F.; Erdfelder, E.; Buchner, A.; Lang, A.G. Statistical Power Analyses Using G*Power 3.1: Tests for Correlation and Regression Analyses. Behav. Res. Methods 2009, 41, 1149–1160. [Google Scholar] [CrossRef] [PubMed]
- Damien Masson Balanced Latin Square Generator. Available online: https://damienmasson.com/tools/latin_square/ (accessed on 18 June 2025).
- Klinke, T.; Hannak, W.; Böning, K.; Jakstat, H. A Comparative Study of the Sensitivity and Specificity of the Ishihara Test With Various Displays. Int. Dent. J. 2024, 74, 892–896. [Google Scholar] [CrossRef]
- Ishihara Ishihara Test. Available online: https://www.it.colorlitelens.com/ishihara-test-di-daltonismo.html (accessed on 18 June 2025).
- Gargiulo, M.; Carleo, D.; Ciampi, G.; Masullo, M.; Chìas Navarro, P.; Maliqari, A.; Scorpio, M. Assessment of the Historical Gardens and Buildings Lighting Interaction through Virtual Reality: The Case of Casita de Arriba de El Escorial. Buildings 2024, 14, 273. [Google Scholar] [CrossRef]
- Fotios, S.A.; Cheal, C. Lighting for Subsidiary Streets: Investigation of Lamps of Different SPD. Part 1—Visual Performance. Light. Res. Technol. 2007, 39, 215–232. [Google Scholar] [CrossRef]
- Fairchild, M.D.; Reniff, L. Time Course of Chromatic Adaptation for Color-Appearance Judgments. J. Opt. Soc. Am. A 1995, 12, 824. [Google Scholar] [CrossRef]
- Tabachnick, B.G.; Fidell, L.S. Using Multivariate Statistics, 3rd ed.; HarperCollins College, Ed.; Alyn and Bacon: New York, NY, USA, 1996; ISBN 0673994147/9780673994141. [Google Scholar]


| Factors | Item Name | Items | Anchors |
|---|---|---|---|
| Fascination | 1 | Places like that are fascinating | not at all/-/very much |
| 2 | In places like this my attention is drawn to many interesting things | not at all/-/very much | |
| 3 | In places like this it is hard to be bored | not at all/-/very much | |
| Being Away | 4 | Places like that are a refuge from nuisances | not at all/-/very much |
| 5 | To get away from things that usually demand my attention I like to go to places like this | not at all/-/very much | |
| 6 | To stop thinking about the things that I must get done I like to go to places like this | not at all/-/very much | |
| Coherence | 7 | There is a clear order in the physical arrangement of places like this | not at all/-/very much |
| 8 | In places like this it is easy to see how things are organised | not at all/-/very much | |
| 9 | In places like this everything seems to have its proper place | not at all/-/very much | |
| Scope | 10 | That place is large enough to allow exploration in many directions | not at all/-/very much |
| 11 | In places like that there are few boundaries to limit my possibility for moving about | not at all/-/very much |
| Scenario 1 | Scenario 2 | Mean Difference | pbonf | Condition | ||
|---|---|---|---|---|---|---|
| Case n. | Marginal Mean | Case n. | Marginal Mean | |||
| SV_L1 | 7.24 | CBD_L1 | 5.64 | 1.60 | <0.001 | p < 0.001 |
| SV_L1 | 7.24 | SV_L4 | 5.91 | 1.33 | <0.001 | p < 0.001 |
| SV_L1 | 7.24 | SV_S2 | 6.29 | 0.95 | 0.03 | p < 0.05 |
| SV_L2 | 6.62 | CBD_L1 | 5.64 | 0.98 | 0.023 | p < 0.05 |
| SV_L3 | 6.77 | CBD_L1 | 5.64 | 1.13 | 0.003 | p < 0.01 |
| SV_S3 | 6.57 | CBD_L1 | 5.64 | 0.93 | 0.04 | p < 0.05 |
| Scenario 1 | Scenario 2 | Mean Difference | pbonf | Condition | ||
|---|---|---|---|---|---|---|
| Case n. | Marginal Mean | Case n. | Marginal Mean | |||
| SV_L1 | 7.37 | CBD_L1 | 4.72 | 2.65 | <0.001 | p < 0.001 |
| SV_L1 | 7.37 | SV_L4 | 6.04 | 1.32 | 0.009 | p < 0.01 |
| SV_L1 | 7.37 | SV_S3 | 5.77 | 1.60 | <0.001 | p < 0.001 |
| SV_L2 | 6.80 | CBD_L1 | 4.72 | 2.09 | <0.001 | p < 0.001 |
| SV_L3 | 6.37 | CBD_L1 | 4.72 | 1.65 | <0.001 | p < 0.001 |
| SV_L4 | 6.04 | CBD_L1 | 4.72 | 1.33 | 0.008 | p < 0.01 |
| SV_S1 | 6.30 | CBD_L1 | 4.72 | 1.59 | <0.001 | p < 0.001 |
| SV_S2 | 6.32 | CBD_L1 | 4.72 | 1.60 | <0.001 | p < 0.001 |
| Scenario 1 | Scenario 2 | Mean Difference | pbonf | Condition | ||
|---|---|---|---|---|---|---|
| Case n. | Marginal Mean | Case n. | Marginal Mean | |||
| SV_L1 | 7.66 | CBD_L1 | 4.43 | 3.23 | <0.001 | p < 0.001 |
| SV_L1 | 7.66 | SV_L4 | 6.40 | 1.26 | <0.001 | p < 0.001 |
| SV_L1 | 7.66 | SV_S1 | 6.65 | 1.01 | <0.001 | p < 0.001 |
| SV_L1 | 7.66 | SV_S2 | 6.55 | 1.12 | <0.001 | p < 0.001 |
| SV_L1 | 7.66 | SV_S3 | 6.55 | 1.11 | <0.001 | p < 0.001 |
| SV_L2 | 7.02 | CBD_L1 | 4.43 | 2.59 | <0.001 | p < 0.001 |
| SV_L3 | 6.94 | CBD_L1 | 4.43 | 2.51 | <0.001 | p < 0.001 |
| SV_L4 | 6.40 | CBD_L1 | 4.43 | 1.97 | <0.001 | p < 0.001 |
| SV_S1 | 6.65 | CBD_L1 | 4.43 | 2.22 | <0.001 | p < 0.001 |
| SV_S2 | 6.55 | CBD_L1 | 4.43 | 2.12 | <0.001 | p < 0.001 |
| SV_S3 | 6.55 | CBD_L1 | 4.43 | 2.12 | <0.001 | p < 0.001 |
Disclaimer/Publisher’s Note: The statements, opinions and data contained in all publications are solely those of the individual author(s) and contributor(s) and not of MDPI and/or the editor(s). MDPI and/or the editor(s) disclaim responsibility for any injury to people or property resulting from any ideas, methods, instructions or products referred to in the content. |
© 2025 by the authors. Licensee MDPI, Basel, Switzerland. This article is an open access article distributed under the terms and conditions of the Creative Commons Attribution (CC BY) license (https://creativecommons.org/licenses/by/4.0/).
Share and Cite
Ciervo, A.; Masullo, M.; Morelli, M.D.; Maffei, L. Exploring the Effects of Window Design on the Restorative Potential of Movable Smart Co-Working Offices in Small Village Environments Through Immersive Virtual Reality. Sustainability 2025, 17, 5851. https://doi.org/10.3390/su17135851
Ciervo A, Masullo M, Morelli MD, Maffei L. Exploring the Effects of Window Design on the Restorative Potential of Movable Smart Co-Working Offices in Small Village Environments Through Immersive Virtual Reality. Sustainability. 2025; 17(13):5851. https://doi.org/10.3390/su17135851
Chicago/Turabian StyleCiervo, Antonio, Massimiliano Masullo, Maria Dolores Morelli, and Luigi Maffei. 2025. "Exploring the Effects of Window Design on the Restorative Potential of Movable Smart Co-Working Offices in Small Village Environments Through Immersive Virtual Reality" Sustainability 17, no. 13: 5851. https://doi.org/10.3390/su17135851
APA StyleCiervo, A., Masullo, M., Morelli, M. D., & Maffei, L. (2025). Exploring the Effects of Window Design on the Restorative Potential of Movable Smart Co-Working Offices in Small Village Environments Through Immersive Virtual Reality. Sustainability, 17(13), 5851. https://doi.org/10.3390/su17135851