1. Introduction
The relationship between firm size and the achievement of the Sustainable Development Goals (SDGs) is an important aspect of modern corporate performance research, especially in creative industries such as advertising and marketing. Finding the optimal balance between scale of operations and financial efficiency is of particular importance for the implementation of SDG 8 (decent work and economic growth) and SDG 12 (responsible consumption and production). In the context of SDG 12, understanding how company size affects resource efficiency (indicator 12.1.1: resource intensity of GDP) is crucial, as smaller advertising and marketing agencies might be better positioned to develop business models that reduce resource consumption while maintaining high financial performance. Large companies, taking advantage of economies of scale and a wider portfolio of services, have the potential to have a greater impact on SDG 17 (partnerships for the goals), while small firms, thanks to their flexibility and innovativeness, better contribute to SDG 9 (industry, innovation, and infrastructure). Understanding this relationship allows advertising and marketing companies in Western Europe to form balanced growth strategies that take into account not only financial indicators, but also the principles of sustainable development in conditions of dominance of intangible assets and intellectual capital.
Firm size is one of the most studied factors influencing the financial performance of companies in the academic literature. However, its role in the context of advertising and marketing agencies remains understudied, especially in the Western European region. The contradictory nature of the existing empirical results on the impact of a firm’s size on its profitability gives rise to two camps of researchers: the first proves a statistically significant impact, while the second concludes that this relationship is insignificant [
1,
2,
3,
4,
5,
6]. At the same time, among the researchers who established a statistically significant effect, there is also a discrepancy in the results:
- some scientists empirically confirm a positive relationship [
7,
8,
9,
10,
11], i.e., larger companies demonstrate better financial performance due to economies of scale, a wider portfolio of services, and a stronger market position;
- another group of researchers finds a negative relationship [
12,
13,
14], i.e., smaller firms are more flexible, innovative, and able to adapt more quickly to changing market conditions, which is especially important in creative industries.
There are also studies in which this relationship may vary depending on the proxy measure for financial performance, the chosen model, the industry, the country, etc. [
15,
16,
17,
18,
19,
20,
21,
22,
23,
24].
This study aims to determine the nature and strength of the relationship between firm size and the financial performance of advertising and marketing companies in Western Europe, taking into account the specifics of the industry, where intangible assets and intellectual capital dominate. Unlike previous studies, which focused mainly on individual countries of Central and Eastern Europe (Ukraine, Poland, the Czech Republic, and Slovakia) [
9,
24], this study expands the geographical context, including companies from developed markets in Western Europe, and takes a comprehensive approach to measuring firm size using various proxies such as total assets (TA), number of employees (NE), and sales. The results of this study are important not only for the theoretical understanding of the optimal scale of activity in the advertising and marketing industry, but also for industry practitioners who formulate balanced growth strategies taking into account the principles of sustainable development and the optimal ratio of the scale of activity and the financial efficiency of companies. This is particularly relevant in the context of SDG 8, as it provides empirical insights into the efficiency of different business models and demonstrates how intellectual capital-intensive approaches compare to material-intensive structures in contributing to sustainable economic growth.
Based on the contradictory findings in the literature regarding the relationship between firm size and profitability in creative industries, this study formulates the following hypotheses to test these relationships, specifically in the Western European advertising and marketing sector:
Hypothesis 1.1. Firm size, as measured by total assets, number of employees, and sales, has a significant impact on return on assets.
Hypothesis 1.2. Firm size, as measured by total assets, number of employees, and sales, has a significant impact on profit margin.
Hypothesis 2.1. Firm size, as measured by total assets, has a significant impact on return on assets.
Hypothesis 2.2. Firm size, as measured by the number of employees, has a significant impact on return on assets.
Hypothesis 2.3. Firm size, as measured by sales, has a significant impact on return on assets.
Hypothesis 3.1. Firm size, as measured by total assets, has a significant impact on profit margin.
Hypothesis 3.2. Firm size, as measured by the number of employees, has a significant impact on profit margin.
Hypothesis 3.3. Firm size, as measured by sales, has a significant impact on profit margin.
Understanding these size–performance relationships has critical practical implications for strategic decision-making in the advertising and marketing industry. Company owners and managers need evidence-based guidance to optimize resource allocation, growth strategies, and operational structures in an increasingly competitive and digitally transformed marketplace. The findings of this study provide actionable insights for developing sustainable business models that balance growth ambitions with financial performance requirements, which is particularly relevant for creative industries where traditional scaling assumptions may not apply. These management implications extend beyond individual firm performance to influence industry-wide strategic approaches and investment patterns in Western European advertising and marketing markets.
The main objective of this study is to determine the nature and strength of the relationship between firm size (measured using various proxies) and the financial performance (return on assets (ROA) and profit margin (PM)) of advertising and marketing companies in Western Europe based on panel data for the years 2019–2023. The study aims to establish how different dimensions of a company’s size influence its financial performance in the context of the specifics of the advertising and marketing industry.
This study is grounded in several theoretical perspectives that help explain the relationship between firm size and performance. While traditional economies of scale theory (Marshall, 1890) [
25] suggests that larger firms should outperform smaller ones, the resource-based view (Barney, 1991) [
26] and dynamic capabilities theory (Teece et al., 1997) [
27] provide alternative explanations for why smaller firms might excel in knowledge-intensive industries.
This research makes several significant contributions to the existing literature. First, it addresses a notable gap in empirical studies examining size–performance relationships, specifically within Western European advertising and marketing companies, expanding beyond previous research concentrated on Central and Eastern European markets. Second, the study provides a comprehensive analysis using three distinct firm size proxies (total assets, number of employees, and sales) simultaneously, offering more robust evidence than single-measure studies. Third, it demonstrates the methodological importance of addressing multicollinearity in size–performance research through systematic model decomposition. Fourth, the findings contribute to sustainable development discourse by showing how resource-optimized business models align with SDGs 8, 9, and 12, particularly highlighting the superior performance of intellectual capital-intensive structures over material-intensive approaches in creative industries. Finally, the study provides practical insights for industry practitioners and policymakers regarding optimal scaling strategies in knowledge-intensive sectors.
The results of such studies are of great practical importance for developing effective financial management strategies and making informed investment decisions in advertising and marketing companies in Western Europe. Moreover, these findings contribute to the implementation of SDG 8 by enhancing our understanding of which business models are more effective for sustainable economic growth and how the efficient use of intellectual capital can provide advantages over material-intensive operations in knowledge-intensive industries. Furthermore, our analysis of resource-optimized structures versus material-intensive ones provides valuable insights for SDG 12 implementation, specifically addressing resource intensity (Indicator 12.1.1) and demonstrating how intellectual capital-intensive approaches can foster responsible consumption and production patterns in creative industries.
2. Literature Review
2.1. Proxy Measures of Firm Size
The study of firm size occupies a fundamental place in economic science and management practice, acting as a key factor in determining an enterprise’s strategic capabilities, competitive position, and development prospects. The importance of studying the size of a company is due to the multifaceted influence of this parameter on various areas of the company’s activities—from operational efficiency to investment attractiveness, and from organizational structure to the ability to implement sustainable business models that ensure a balanced use of resources and long-term environmental responsibility in today’s environment of climate change.
Researchers pay much attention to studying the influence of firm characteristics (size, age, industry, and ownership) on financial performance. The relationship between firm size and firm performance is a key topic of many scientific studies. Firm performance and its measurement are very important and discussed issues not only in the academic environment, but also at the level of top management and corporate owners [
17]. Firm size affects how well an organization performs [
28]. One explanation for why firm size matters is that it reflects a firm’s access to capital markets and the associated transaction costs [
29].
Firm size is a complex, multidimensional concept that does not have a single, unambiguous definition. The difficulties of measuring it are due to a number of reasons. Firstly, a company’s size can characterize various aspects of its activities—from quantitative financial indicators (TA, sales volume) to qualitative parameters of the organizational structure (NE, number of structural divisions). Second, the criteria for determining firm size may vary significantly depending on the specifics of economic sectors, industry characteristics, and national regulatory frameworks. Empirical studies also show that the initial size of a company, particularly the amount of the start-up capital, may be another factor influencing firm performance, especially in the case of new firms and capital-intensive industries [
17]. Thirdly, constant transformations in market conditions, technological shifts, and structural changes in the economy complicate the static assessment of firm size, necessitating the use of flexible and adaptive methodological approaches. Firm size can be measured in several ways [
30]. Consequently, generally accepted measures of firm size, called firm size proxies, emerge.
Firm size remains an ill-defined concept in the scientific literature. Where theory requires the use of size, empirical studies typically resort to some proxies such as the number of employees, total assets, sales, or market capitalization. It is therefore not surprising that data on firm size characteristics come largely from outside accounting [
31]. In business research, firm size is a ubiquitous and easily measured indicator [
32]. Different size proxies capture different aspects of ‘firm size’ and thus have different implications [
33]. Value added or number of employees, rather than assets or sales, are better measures of firm size for organizational theories [
30]. Firm size is determined by both financial and non-financial measures, such as profit and number of employees, respectively [
34].
A number of alternative measures of firm size led to the identification of a group of commonly used and specific firm size measures. Commonly used ones include TA, sales, NE, and market capitalization (market value). Existing studies on measuring firm size mainly include three proxies: sales revenue, number of employees, and total assets [
35]. Growth rate, total assets, and total labor force are three variables that serve as proxies for firm size [
7]. According to a review of 100 research papers, three measures of firm size—total assets, total sales, and market value of equity—are the most popular firm size proxies in corporate finance [
33].
The choice of a firm size proxy is deeply context-dependent and largely determined by the industry specifics. In some industries, it may be appropriate to use specific proxy measures of firm size. For example, when studying farms, one can use proxies for firm size, such as the acres under cultivation and the number of livestock [
36], or the number of licenses [
37].
Proxies for firm size can be classified according to several criteria: by type of indicators (financial and non-financial), by industry specifics (general and industry), and by data source (financial reporting indicators, market indicators). The main reasons for using proxy measures of firm size are the methodological complexity of quantifying company size due to the multidimensionality of this parameter and the impossibility of reflecting it with one indicator, availability of public reporting data and unavailability of internal management information, the possibility of inter-corporate comparisons, and establishing relationships between company characteristics and their performance indicators.
The variety of possible proxies and their relationship with financial results determine different approaches to studying the relationship between a firm’s size and its efficiency. The following sections of the literature review explore the role of firm size as a control, independent, and moderating variable, as well as the specifics of the influence of firm size on the financial performance of advertising and marketing enterprises.
2.2. Firm Size as a Control Variable for Financial Performance
A review of the literature shows that firm size can be used as a control variable in various industry studies that identify factors influencing financial performance. It has been argued that control variables, although an important component in many causal research designs, do not have the same status as the main variables of interest in empirical analysis [
38]. That is, as a control variable, firm size has a special status, serving as a tool for isolating the effects of the main variables of interest and ensuring the reliability of causal relationships in econometric models. According to this logic, failure to take these effects into account may lead to erroneous conclusions regarding the influence of the main factors under study on a company’s financial performance.
A common practice is to add firm size as a control variable to improve the level of determination of the models, along with other control variables such as legal form (dummy variable) [
18]; leverage, firm age, ratio of the shares held by the largest shareholder to the second one, total shareholding ratio held by the firm’s top five shareholders, and market concentration rate of the largest five enterprises [
13]; leverage, fixed asset intensity, market capitalization, R&D, financial volatility, economic development, and culture [
14]; leverage [
21]; and market-to-book ratio of equity, current earnings-to-price ratio, leverage, and a dummy variable that equals 1 if a company has less than 50% of its shares in free float, meaning dominant shareholders control the majority of shares [
39].
Appendix A.1 presents the results of studies that use firm size as a control variable. The researchers determine the impact on financial performance measures (MTB, OPM, PE, ROA, ROE, ROS, and Tobin’s Q) and strengthen their models with control variables such as firm size. Given the ambiguity of the influence of this control variable, we can talk about the characteristics of the studied samples that affect the results of the statistical significance or insignificance of the proxy for firm size, and the positive or negative sign of the corresponding coefficient (number of objects studied, specifics of the region/country, specifics of the industry, time coverage of the study, etc.). It is appropriate to discuss the results in terms of individual financial indicators.
2.3. Firm Size as an Independent Variable for Financial Performance
In the regression models of the impact on financial performance, firm size was also used as the main independent variable. The results of the studies that use firm size as an independent variable are presented in
Appendix A.2. Some authors argue that size has a negative relationship with profitability, saying that smaller firms tend to have a higher level of risk and investors are compensated with higher returns. On the contrary, others argue that size has a positive relationship with profitability [
6]. Overall, the analysis of
Table A2 (
Appendix A.2) confirms the high contextual dependence of the relationship between firm size and financial performance, which depends on the country, industry, time period, selected size metrics, methodological approaches, and specific financial performance indicators. This indicates the need for a comprehensive approach when assessing the impact of firm size on financial performance.
Given the contradictory findings in the literature regarding the relationship between firm size and profitability, this study formulates the following hypotheses to test these relationships, specifically in the advertising and marketing sector: Hypothesis 1.1 and Hypothesis 1.2. To examine these relationships more precisely, we further decompose these general hypotheses more specifically: Hypothesis 2.1., Hypothesis 2.2., Hypothesis 2.3., Hypothesis 3.1., Hypothesis 3.2., and Hypothesis 3.3.
2.4. Firm Size as a Moderating Variable for Financial Performance
Another perspective on firm size research focuses on its role as a moderating variable (moderator) between two specific indicators. Previously unaccounted for variables (e.g., firm size) may influence the direction and magnitude of the interaction between market orientation and environmental factors, as well as their impact on firm performance [
40]. This moderating effect of firm size is determined in studies between the following indicators: the relationship between firm growth and its performance [
41], the impact of ESG scores on the value and financial performance of firms [
42]; the relationship between digital marketing innovation and financial performance [
43]; the impact of sustainability indicators on financial performance [
44]; the impact of gender diversity on boards of directors on company performance [
13]; the impact of profitability on company value [
45]; and the relationship between financial performance and dividend policy [
46].
Appendix A.3 presents the results of studies that use firm size as a moderating variable. These studies highlight that the role of firm size as a moderator is context-dependent and may vary across countries, industries, study periods, and the specific relationships being studied. This confirms the need to consider the specific context when analyzing the impact of firm size on the different aspects of corporate performance and effectiveness.
2.5. Impact of Firm Size on the Financial Performance of Advertising and Marketing Companies
The previous paragraphs of the literature review confirm the need to study the impact of firm size on financial performance, considering the specifics and industry of companies. The relationship between size, number of employees, and profitability is industry-specific and should be studied on an industry-by-industry basis [
30].
The study of the influence of firm size on the financial performance of companies in the advertising and marketing sector is of particular interest given the unique characteristics of this service sector. Advertising and marketing agencies operate in an environment dominated by intangible assets, intellectual capital, and creative processes, which significantly distinguishes them from traditional manufacturing or other service companies [
47,
48,
49]. Unlike other sectors of the economy, where scale often brings clear cost-saving benefits, in advertising and marketing, the relationship between a company’s size and its financial performance is more complex. The agility of small agencies can give them a competitive advantage in innovation and speed of adaptation to change [
50], while larger chains can leverage their expanded resources, geographic reach, and diversified service portfolio to attract larger clients. However, in the era of digitalization, tools typical for large companies are becoming available to small and medium-sized enterprises [
51]. The digital transformation of the industry further complicated these relationships, creating new business models that potentially challenge traditional notions about the optimal scale of operations in the sector.
By analyzing Lehenchuk et al.’s study, one can draw an important conclusion regarding the relationship between firm size and financial performance in the advertising industry [
9]. A study conducted on a sample of 88 advertising agencies in Slovakia in 2020 found a significant positive impact of firm size (measured by total assets) on ROA. This indicates that larger agencies in the Slovak advertising industry demonstrate better financial results than smaller market players. The positive relationship between size and profitability may indicate that in the advertising industry, larger companies may have advantages due to a broader range of services, a larger client base, better access to talent, or a stronger market position. However, it is worth noting that the study is limited to one year (2020) and one country (Slovakia), which may limit the applicability of its findings to other regions or periods, especially given the unique characteristics of the advertising industry and its rapid digital transformation.
Zavalii et al. analyzed the impact of firm size on the financial performance of advertising and marketing companies in four countries: the Czech Republic, Poland, Slovakia, and Ukraine, for the period 2021–2023. The results show that the impact of firm size (measured as total assets or number of employees) on financial performance (ROA, ROE, and OPM) varies significantly across countries. In particular, in Slovakia, total assets had a positive impact on ROE and OPM, whereas in Ukraine, the number of employees was negatively correlated with ROA and OPM [
24]. This highlights the importance of considering the geographical context and the choice of firm size measurement method when analyzing their impact on firms’ financial performance.
The impact of firm size on the financial performance of advertising and marketing companies varies significantly depending on the geographic context and measurement method. Further exploration of these relationships remains relevant, especially in the context of the digital transformation of the industry, which is creating new business models and changing the traditional understanding of the optimal scale of advertising and marketing agencies.
2.6. Impact of Firm Size on the Financial Management Strategies and Making Investment Decisions
The relationship between firm size and financial management strategies is particularly important in knowledge-intensive sectors such as advertising and marketing, where intellectual capital dominates over physical assets. The literature reveals significant distinctions in how companies of different sizes approach financial planning, resource allocation, and investment decisions, with direct implications for SDGs 8, 9, and 12.
Smaller firms generally demonstrate higher operational flexibility, which translates into more adaptive financial management strategies [
52,
53,
54]. These organizations often prioritize lean resource allocation, maintaining lower fixed costs while maximizing the utilization of intellectual capital. Their investment decisions tend to focus on specialized talent acquisition and the development of niche competencies rather than physical assets or infrastructure expansion. This agility can provide smaller companies with a competitive advantage in innovation and adaptation speed, which directly supports SDG 9′s emphasis on fostering innovation in industry infrastructure.
Conversely, larger companies leverage their scale to implement more complex financial management frameworks [
55,
56,
57,
58]. These organizations typically maintain more sophisticated budgeting processes, formalized investment evaluation criteria, and diversified risk management strategies. Their investment decisions often prioritize market expansion, service portfolio diversification, and technological infrastructure that can support operations at scale.
The implications for resource efficiency (SDG 12) are particularly notable in knowledge-intensive industries. Unlike traditional manufacturing sectors where economies of scale often lead to resource optimization, the relationship between size and efficiency in creative and service industries appears more complex. As firms grow, they face increasing challenges in maintaining efficient resource utilization, with financial management complexity rising disproportionately with firm size, often resulting in suboptimal allocation of both financial and human resources. This challenges conventional assumptions about economies of scale in knowledge-intensive industries and has direct implications for SDG 12′s focus on responsible consumption and production patterns.
Investment decision-making processes also transform with increasing firm size. Smaller companies typically employ more informal, opportunity-driven investment approaches, while larger organizations implement structured capital budgeting techniques and more conservative risk assessment frameworks. These differences significantly impact short-term financial performance indicators and long-term sustainable growth trajectories. In the era of digitalization, tools typically available only to large companies are becoming accessible to small and medium-sized enterprises, potentially narrowing some traditional advantages of scale in investment capability.
The contextual nature of this relationship is evident in numerous empirical studies, which demonstrate that the relationship between firm size and financial performance depends on the country, industry, time period, selected size metrics, methodological approaches, and specific financial performance indicators. This contextual dependence underscores the need for an industry-specific analysis of the relationship between firm size and financial management strategies, particularly in rapidly evolving sectors where digital transformation is creating new business models that potentially challenge traditional notions about the optimal scale of operations.
The empirical evidence from various regional market studies reveals varying relationships between firm size and financial performance across different countries and time periods, further emphasizing the need to expand this analysis to Western European markets where specific market dynamics may influence the optimal approach to financial management and investment decisions in support of sustainable development goals.
3. Materials and Methods
3.1. Sampling
The initial study sample consisted of 16,365 companies with the status of “Active companies” in the Orbis system as of 1 March 2025, and belonging to the Advertising and Marketing Research category (code 73 according to the NACE Rev. 2 classification, primary codes only). Geographically, the selected companies are located in Western European countries (Andorra, Austria, Belgium, Cyprus, Denmark, Finland, France, Germany, Gibraltar, Greece, Iceland, Ireland, Italy, Liechtenstein, Luxembourg, Malta, Monaco, the Netherlands, Norway, Portugal, San Marino, Spain, Sweden, Switzerland, Turkey, the United Kingdom, and Vatican City State/Holy See). Another criterion for inclusion in the sample was the availability of complete data on companies’ performance indicators for 2019 to 2023.
Further data ranking by the value of the “Profit (loss) before tax” indicator for 2023 allowed us to identify the 500 most profitable companies in the advertising and marketing sector for in-depth research. The final study sample included companies from 16 Western European countries, although the geographic representativeness was reduced (from 27 to 16 countries) due to the lack of complete statistical data on business entities from some jurisdictions.
Table 1 presents the list of countries whose companies were included in the sample, indicating the number and share of companies of each country in the overall structure.
The complete dataset containing all 500 companies with their financial indicators for the period 2019–2023 is provided in the
Supplementary Materials.
Given the sample size (500 companies) and the five-year period (2019–2023), the number of observations was 2500, which provides sufficient statistical power to conduct a comprehensive analysis.
3.2. Variables
Panel data regression analysis was selected as the most appropriate methodological approach for several key reasons. First, this technique allows for the simultaneous examination of cross-sectional variation between companies and temporal dynamics within the same firms, providing a more comprehensive understanding of the size–performance relationship than cross-sectional or time series analysis alone. Second, panel data models effectively control for unobserved heterogeneity between firms that might otherwise bias the results, such as differences in management quality, corporate culture, or strategic positioning that remain relatively constant over time. Third, the panel data approach increases the degrees of freedom and reduces multicollinearity problems compared to pure cross-sectional analysis, thereby improving the statistical power and reliability of the estimates. Fourth, given the nature of the advertising and marketing industry, where firm performance can be influenced by both company-specific factors and time-varying market conditions, panel data regression enables the separation of these effects and provides more robust estimates of the relationship between firm size and financial performance.
In regression models, profitability ratios were used as dependent variables, and firm size proxies were used as independent variables. The study uses two key financial performance indicators—ROA, which evaluates an enterprise’s ability to generate profits using its existing assets, and PM, which reflects sales profitability. These indicators are used as dependent variables for several important reasons. First, they complement each other, allowing us to look at profitability from different perspectives: ROA measures how effectively a company uses its assets to generate profits, while PM shows what share of profit the company receives from each monetary unit of sales. Secondly, different aspects of financial efficiency are considered: ROA focuses more on the efficiency of asset use, and PM allows you to evaluate the efficiency of the company and its pricing policy. Thirdly, the use of both indicators allows you to take into account industry specifics, within which companies may have different asset structures and different levels of sales profitability. Fourth, it is assumed that these indicators (ROA and PM) react differently to different proxies of a company’s size (assets, number of employees, and sales volume). It is worth noting that the return on sales (ROS) indicator is similar to PM.
Table 2 provides a summary of the dependent and independent variables, their calculation methods, and abbreviations used in the study.
The raw data for all variables (ROA, PM, TA, NE, and Sales) for each company across the five-year period are available in the
Supplementary Materials.
The study identifies dependent variables (ROA and PM) used as key indicators of companies’ financial performance. The selection of ROA is consistent with recent research by Zavalii et al. [
24], who used ROA as one of the key dependent variables in their analysis of advertising and marketing companies in Central and Eastern European markets. However, the current study differs in its approach by using firm size proxies (total assets, number of employees, and sales) as independent variables rather than control variables, allowing for a more direct examination of the size–performance relationship. Both indicators are calculated based on profit (loss) before tax, but relative to different business parameters—TA and sales, respectively. The independent variables (TA, NE, and sales) are presented in logarithmic form, which reduces the impact of outliers and normalizes the data for more accurate statistical analysis, following the methodological approach established in previous studies [
24].
Table 3 shows the descriptive statistics (mean, median, standard deviation, minimum, and maximum) of all variables for Western European advertising and marketing companies.
For certain reasons, the study uses logarithmic values of independent variables. Firstly, the distribution of the absolute values of these indicators is characterized by significant asymmetry and the presence of extreme values, which is confirmed by the significant difference between the mean and median values, as well as high standard deviation values (
Table 3). Logarithmization allows for normalization of data distribution, an important prerequisite for applying parametric statistical methods. Second, the logarithmic transformation allows us to interpret the analysis results in terms of elasticity, i.e., the percentage change in the dependent variable in response to a percentage change in the independent variable. This is particularly important when studying the impact of firm size on profitability, as it allows one to compare the effects across firms of different sizes. Third, the use of logarithmic values helps reduce the heteroscedasticity of residuals in regression analysis, improving the efficiency and reliability of panel data model estimates.
The median was used to analyze the trend of changes in the profitability ratios (ROA and PM), taking into account standard deviation values (
Figure 1). Unlike the mean, the median in such conditions will give a more representative idea of the “typical” company in the sample under study.
Analysis of ROA and PM indicators of advertising and marketing companies in Western Europe for the period 2019–2023 shows a general positive trend in the development of the industry, with individual periods of fluctuation. In 2019, both indicators had similar values: ROA was 6.99%, and PM was 6.78%. In 2020, there was an overall decrease in profitability, with ROA decreasing more significantly, to 5.91% (a decrease of 1.08 percentage points), and PM decreasing less, to 6.21% (a decrease of 0.57 percentage points). The 2020 crisis associated with the COVID-19 pandemic led to mixed results, with some industries showing growth and others declining. For example, studying the performance of Polish companies before and during the pandemic (2017–2021), Kubiczek and Derej [
59] found that companies in certain industries experienced revenue growth, in particular: capital market, games, medical equipment and supplies, biotechnology, internet commerce, real estate, new technologies, rubber and plastics, supply, and construction. Instead, significant revenue declines were seen in the following industries: media, electromechanical industry, transport and logistics, hospitals and clinics, fuel and gas, receivables, trade, and services—other, financial intermediation, recreation, and relaxation.
In the context of this study, the industry’s recovery began in 2021, when both indicators grew rapidly: ROA increased to 8.8%, and PM even exceeded it, reaching 8.98%. In 2022, the indicators diverged in their dynamics—ROA continued to grow to 9.73%, while PM decreased to 8.34%. In 2023, the industry reached its peak profitability for the entire period under review: ROA rose to 11.78%, and PM to 11.24%. Overall, over the period of 2019–2023, ROA increased by 4.79 percentage points and PM by 4.46 percentage points. This demonstrates a significant increase in the asset use efficiency and growth in sales profitability of Western European advertising and marketing companies, despite temporary fluctuations caused by the crisis.
Similarly, the median was used to analyze the trend in changing values of proxies for firm size (TA, NE, and sales), taking into account significant values of standard deviations (
Figure 2).
Analysis of trends in changes in firm size proxies of Western European advertising and marketing companies during 2019–2023 demonstrates stable growth in all three measures. TAs show steady growth throughout the period, increasing from USD 13,409 thousand in 2019 to USD 18,114 thousand in 2023. This represents a 35.1% increase over the five years studied. The growth of the median value of TA was uniform, without sharp fluctuations, which indicates stable investments in the development of the industry. NE also demonstrates constant growth, although at a more moderate pace. The median number of employees increased from 45 in 2019 to 56 in 2023, representing a 24.4% increase. A special feature of this trend is its stability, even during the crisis year of 2020, which may indicate the relative stability of jobs in the advertising and marketing companies sector. Sales increased from USD 16,640 thousand in 2019 to USD 23,444 thousand in 2023, representing a 40.9% increase. Notably, sales growth in 2019–2020 was relatively modest (only 2.5%), with a subsequent acceleration in 2021–2023. Particularly noticeable growth occurred in 2022–2023, when sales increased by 9.4%. Comparison of the trends of all three indicators shows the positive dynamics of industry development, with sales growth rates exceeding TA growth rates and NE growth rates being the lowest. This may indicate increased resource efficiency and increased labor productivity in Western European advertising and marketing companies.
3.3. Research Model
3.3.1. Conceptual Framework of Study
Figure 3 shows the conceptual framework of study.
The conceptual framework illustrates the hypothesized relationships between firm size measures and financial performance indicators. The framework demonstrates three distinct firm size proxies (TA, NE, sales) as independent variables, each hypothesized to influence two key financial performance measures: ROA and PM as dependent variables.
The framework is structured around two main hypothesis groups: Hypotheses 1.1 and 1.2 examine the simultaneous impact of all three size measures on ROA and PM, respectively, while Hypotheses 2.1–2.3 and 3.1–3.3 test the individual effects of each size proxy on the respective performance indicators. This decomposition approach was necessitated by the high multicollinearity observed between the firm size measures, requiring separate analysis of each size–performance relationship to ensure methodological rigor and statistical validity.
3.3.2. Model 1
As part of a study of the relationship between firm size and financial performance, an analysis of the influence of firm size proxies on the effectiveness of Western European advertising and marketing companies was first conducted. Model 1 represents a specification that simultaneously controls for three measures of firm size. The following hypotheses were formulated for this model: Hypothesis 1.1 and Hypothesis 1.2.
A special feature of these models is that three proxies for firm size (TA, NE, and sales) are used simultaneously as independent variables.
The following model was examined:
where DV—dependent variable (ROA, PM), with i = entity and t = time; α–identifier; β–regression coefficient; 1_TA, 1_NE, and 1_Sales–independent variables, where i = entity and t = time; and ε
it—error term.
Studies of firm size metrics typically find high correlations between different size measures. This is because larger companies typically have more assets, more employees, and higher sales; these measures tend to converge as firms expand; a log transformation preserves these relationships by normalizing the distributions. When analyzing firm size, researchers often encounter strong positive correlations between various proxies for firm size [
30,
60,
61]. Industry specificity influences the choice of optimal indicators of firm size, encouraging researchers to analyze the degree of correlation between various firm size measures in individual sectors of the economy [
62]. This relationship exists because business growth typically involves simultaneous expansion across multiple dimensions: companies that increase revenue typically need more employees and assets to support that growth. The interconnected nature of these variables creates a natural multicollinearity challenge in regression models using multiple size indicators. While the log transformation helps normalize the distribution of these variables (reducing the impact of outliers and removing skewness), it does not remove the underlying correlations.
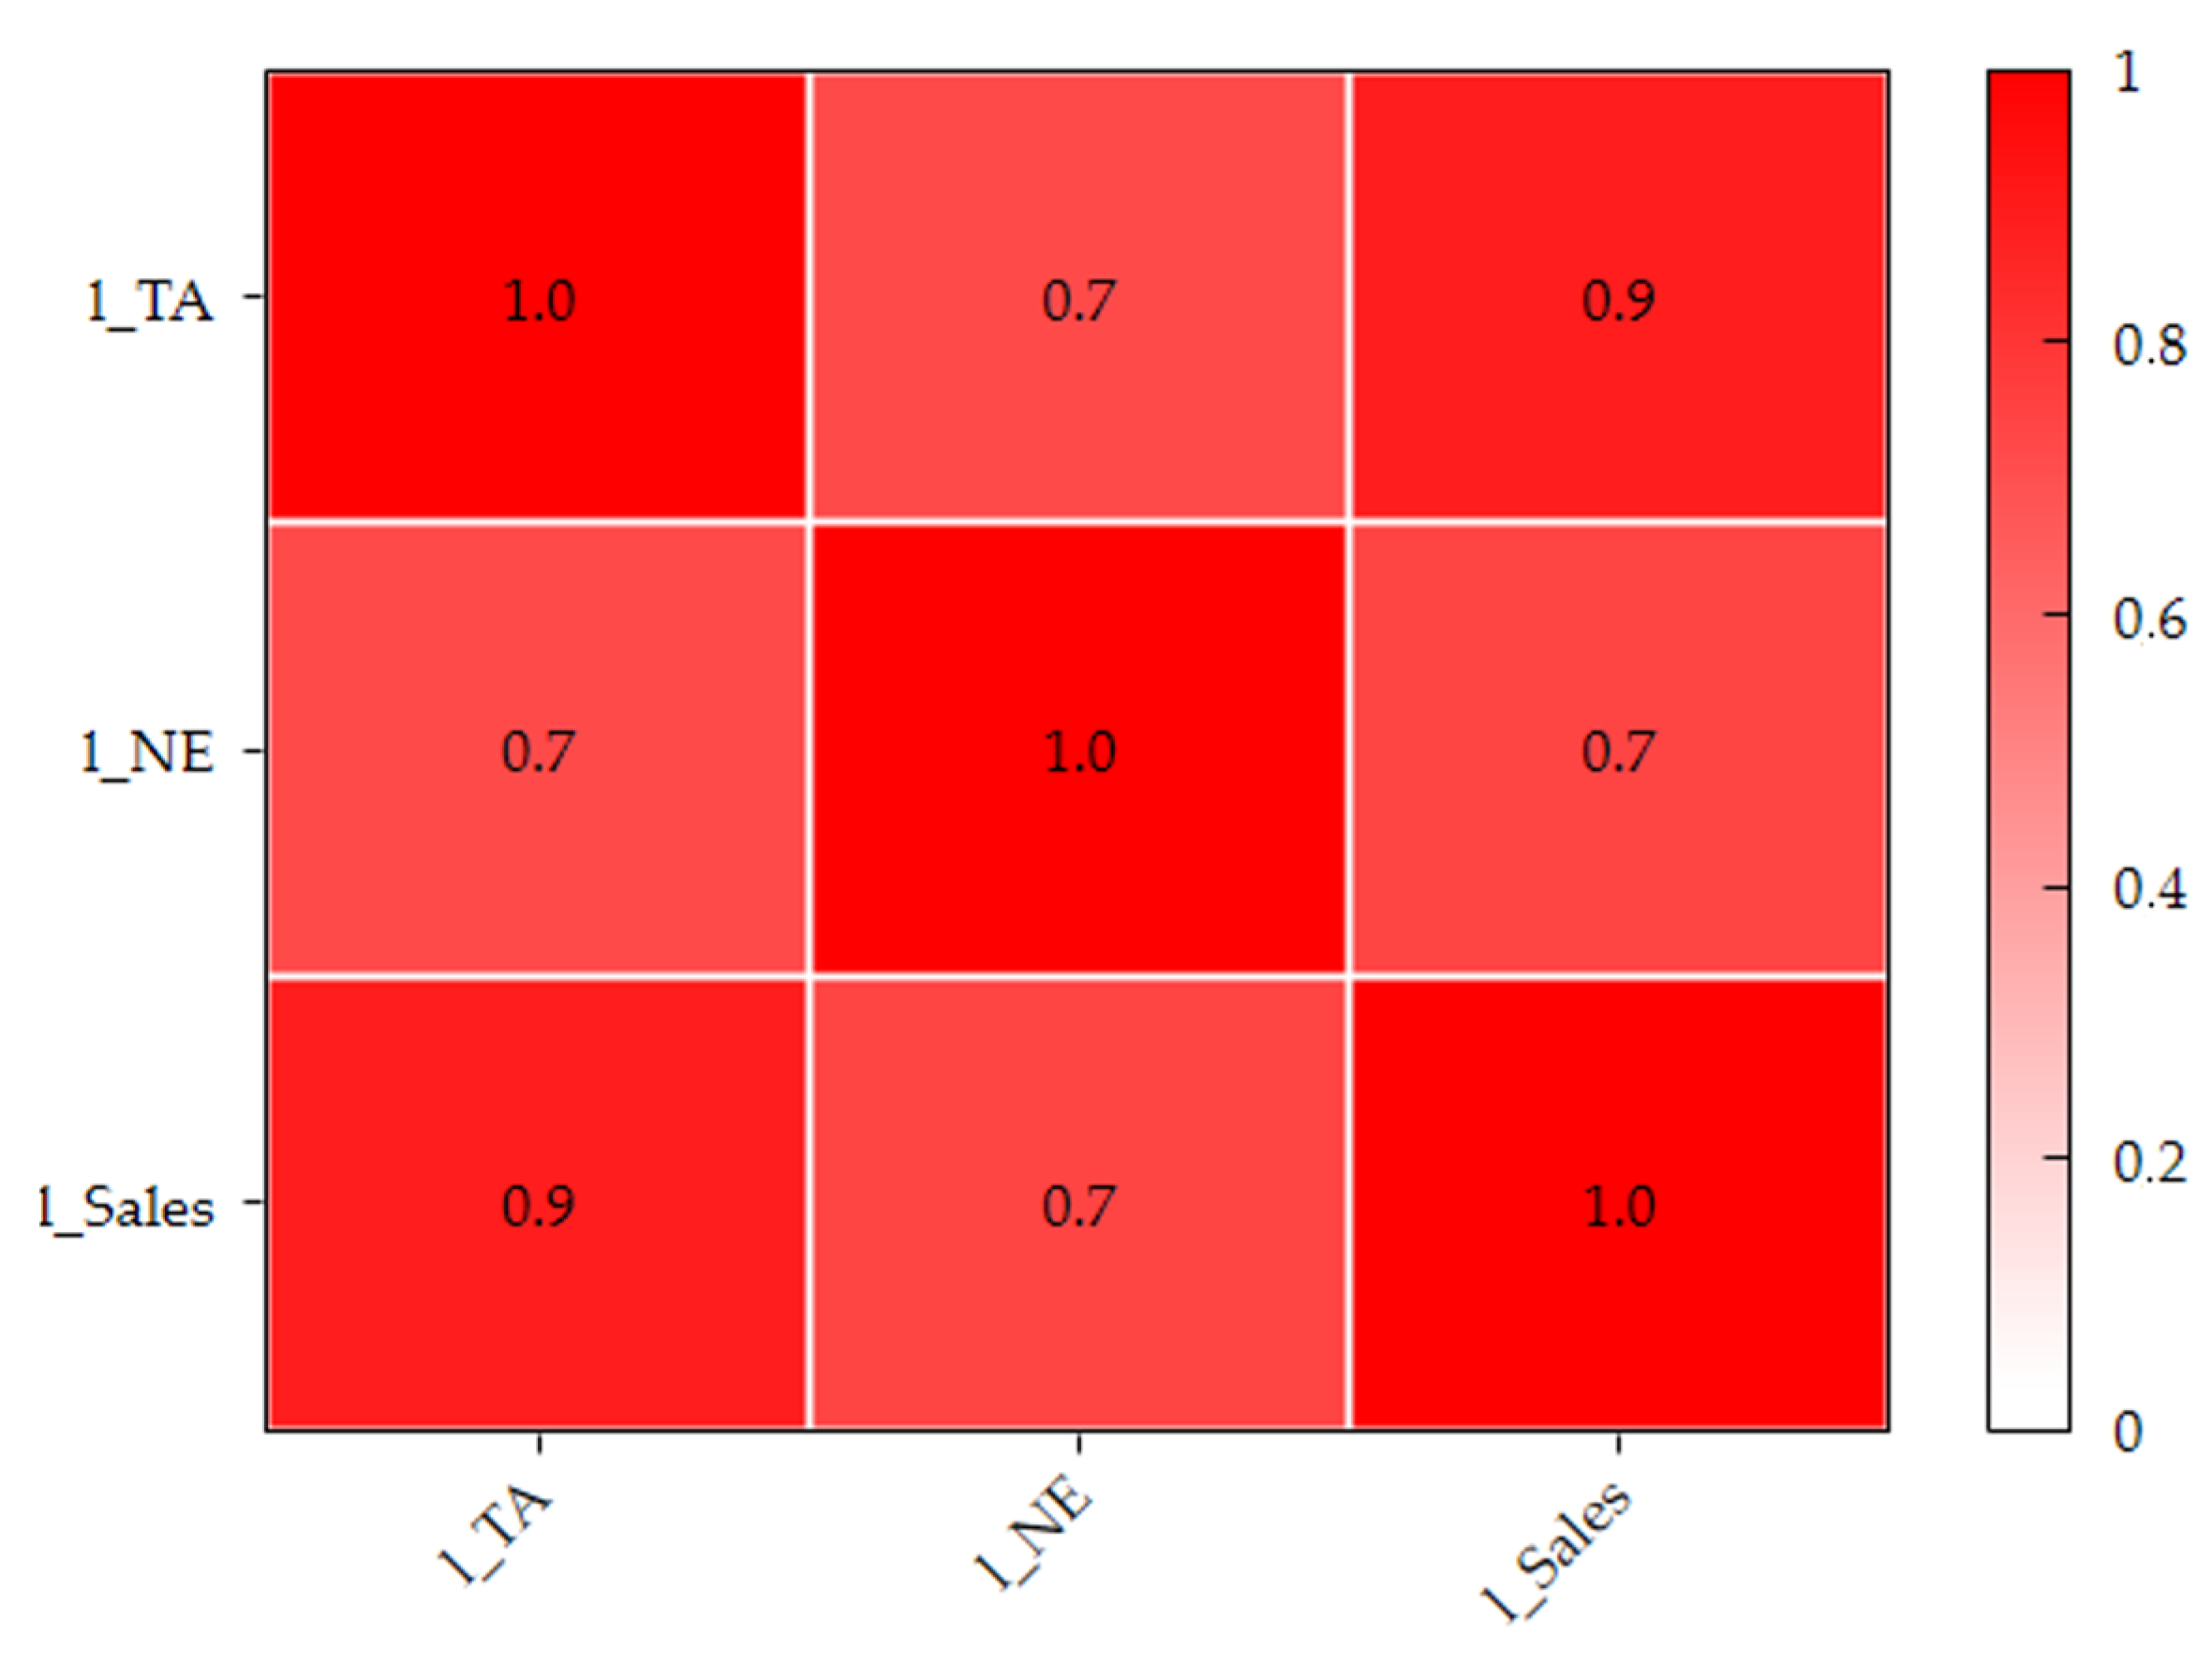
Figure 4 shows the correlation matrix for the independent variables in Model 1, which also confirms multicollinearity.
Analyzing the correlation matrix for three variables (1_TA, 1_NE, and 1_Sales) in the study of 500 advertising and marketing companies in Western Europe, it can be stated that
- −
there is a strong positive correlation (0.9) between l_TA and l_Sales, which indicates that companies with larger assets tend to generate higher sales;
- −
a strong positive correlation (0.7) was also recorded between l_NE and l_Sales, which indicates that companies with more employees have higher sales;
- −
there is also a strong positive correlation (0.7) between l_TA and l_NE, indicating that companies with more assets have more employees.
Correlation analysis results show statistically significant relationships between all the studied indicators of the size of advertising and marketing companies in Western Europe (1_TA, 1_NE, and 1_Sales). The identified multicollinearity makes it impossible to simultaneously include all three proxies for firm size in a single regression model without significantly distorting the obtained estimates and their statistical significance. Therefore, to ensure the reliability and accuracy of the econometric analysis, a methodologically sound decision was made to decompose the original model into three separate specifications with sequential testing of each proxy for firm size.
3.3.3. Model 2 (ROA), Model 3 (PM)
To determine the impact of various firm size indicators on financial performance, two groups of models (Model 2.X and Model 3.X) were developed, which separately assess the impact on ROA and PM. In each group, three alternative measures of firm size were analyzed: TA, NE, and sales. Accordingly, the following hypotheses were formulated: Hypothesis 2.1, Hypothesis 2.2, Hypothesis 2.3, Hypothesis 3.1, Hypothesis 3.2, and Hypothesis 3.3.
The following models were examined:
where ROA, PM—dependent variable, with i = entity and t = time; α—identifier; β—regression coefficient; 1_TA, 1_NE, 1_Sales—independent variables, where i = entity and t = time; and ε
it—error term.
Panel data analysis requires special attention to methodological aspects, particularly to the correct specification of the model. Determining the most appropriate model is a critical step that affects the reliability of the results obtained and the validity of the research conclusions. Model selection is a key stage in the analysis, the first step of which is to test for significant individual effects using the Breusch–Pagan test, the results of which are presented in
Table 4.
Since the Breusch–Pagan test showed a p-value greater than 0.05 in all models, we cannot reject the null hypothesis of no significant individual effects. That is, the individual effects are statistically insignificant.
In such a situation, there is no need to choose between FEM and REM models, as neither is recommended for use. Instead, it is advisable to use the weighted least squares (WLS) method. Given that the Breusch–Pagan test did not reveal statistically significant individual effects (p ≥ 0.05), it is not appropriate to conduct the Hausman test, since it is only used in the presence of confirmed individual heterogeneity of the data (p < 0.05).
The Wooldridge test checks for first-order autocorrelation in panel data, which can lead to inefficient parameter estimates and erroneous standard errors even when using WLS (
Table 5).
The Wooldridge test results show no first-order autocorrelation in all the models considered. These results indicate a lack of serial correlation in the model residuals, which is a positive indicator for statistical analysis. This allows us to continue using WLS without additional adjustments for autocorrelation.
3.4. Empirical Results
The correlation analysis in Model 1, which was designed to examine the simultaneous impact of the three firm size measures on financial performance, revealed strong multicollinearity between TA, NE, and sales, with correlation coefficients ranging from 0.7 to 0.9. Given this methodological limitation, which makes it impossible to simultaneously include all three proxies for size in a single regression model, it was decided to decompose the original model into three separate specifications for a sequential analysis of the impact of each indicator on the ROA and PM of Western European advertising and marketing companies.
Given the absence of statistically significant individual effects according to the Breusch–Pagan test (p ≥ 0.05) and the absence of first-order autocorrelation according to the Wooldridge test in all model specifications, the WLS method was used to further study the influence of various firm size measures on financial performance. The evaluation of regression models (Model 2.X and Model 3.X) using the WLS methodology establishes the nature and strength of the influence of each of the three firm size indicators analyzed on the ROA and PM of Western European advertising and marketing companies.
Table 6 presents the results of the panel data regression analysis (
p-value and significance level) for 6 model specifications implemented using WLS.
Regression analysis results using the WLS method show a statistically significant negative impact of all studied firm size indicators on the financial performance of advertising and marketing companies in Western Europe. All coefficients for the independent variables (TA, NE, and sales) have negative values and are statistically significant at the 1% level. The most significant negative impact on ROA is observed in the case of TA (–3.71), while for PM, the most negative effect is found in the case of sales (−3.58). The models’ coefficients of determination (R2) range from 5.93% to 13.62%, indicating the presence of other factors that also affect the financial performance of companies.
The obtained results confirm the hypotheses about the significant influence of firm size on financial performance, however, the nature of this influence turned out to be negative for all three size indicators. This shows that in the Western European advertising and marketing services sector, smaller companies perform better financially than larger ones. This finding may be explained by the greater flexibility and adaptability of small companies in the creative sector, their ability to respond more quickly to changing market conditions and customer needs, and potentially lower operating costs. These results support the position of researchers who argue for the advantages of smaller firms in industries where innovation and speed of adaptation to change are important.
4. Discussion
The results of this study reveal a statistically significant negative relationship between firm size and financial performance in Western European advertising and marketing companies, regardless of which proxy measure for firm size is used (TA, NE, or sales). This finding contributes to the ongoing academic debate about the impact of firm size on financial performance, particularly in creative industries where intangible assets and intellectual capital play dominant roles. In the context of SDG 8, these findings enhance our understanding of which business models are more effective for economic growth, highlighting the advantages of resource-optimized structures with higher management flexibility over material-intensive operations, directly supporting target 8.4 on improving resource efficiency in consumption and production systems. Smaller companies demonstrate higher labor productivity per unit of resources, aligning with target 8.2 on achieving higher levels of economic productivity through diversification, technological upgrading, and innovation.
Table 7 presents the comprehensive analysis of the tested models to provide a detailed breakdown of the hypothesis testing results and statistical evidence supporting these conclusions.
The negative coefficients for all three proxy measures of firm size in relation to both ROA and PM suggest that smaller advertising and marketing companies in Western Europe demonstrate better financial performance than their larger counterparts. This aligns with research identifying that smaller firms may benefit from greater flexibility, innovation capability, and quicker adaptation to changing market conditions—characteristics particularly valuable in creative industries. This adaptability of small companies creates more resilient business models, supporting target 8.3 on encouraging the formalization and growth of micro, small, and medium-sized enterprises, while simultaneously promoting labor market inclusivity through the creation of quality jobs in accordance with target 8.5.
The strongest negative impact on ROA was observed when using TA (−3.71), which confirms the results of studies by some researchers [
12,
15] and contradicts the results of others [
7,
9,
10,
16,
18,
21,
63]. The most significant negative effect on PM was associated with sales (−3.58), which is not supported by the results of similar relationships in the study by Kuncova et al. [
17], where this relationship was found to be significant and positive in the example of the Czech swine sector, and in the work of Niresh et al. [
6], where this relationship was found to be insignificant in the sample of listed Sri Lankan manufacturing companies.
The impact of firm size on financial performance is highly context-dependent, varying substantially across geographical regions, industries, and methodological approaches.
The geographical scope of our study is confirmed by results from different Western European research. Boussenna [
15] found a significant negative relationship between firm size and ROA among 27 French listed non-financial firms (2005–2017), while Kyere and Ausloos [
12] identified similar negative effects on both ROA and Tobin’s Q for 252 UK listed companies in 2014. Lopez-Valeiras et al. [
19] reported mixed results in Spain’s agribusiness sector, showing insignificant direct effects but significant negative indirect effects of firm size on ROA through indebtedness. In contrast, Vieira et al. [
6] found insignificant relationships between firm size and financial performance among 37 Portuguese non-financial firms (2010–2015), possibly due to sample-specific characteristics. These findings collectively support the regional specificity of Western European markets, where smaller companies demonstrate superior or at least comparable financial performance relative to their larger counterparts.
The industry-specific context of our findings reveals mixed evidence within the advertising and marketing sector. Zavalii et al. [
24] found varying relationships between firm size and financial performance across Central and Eastern European advertising and marketing companies, while Lehenchuk et al. [
9] identified positive size–performance relationships among Slovak advertising agencies. However, these studies focused on emerging markets where competitive dynamics and client expectations differ significantly from mature Western European markets, where operational efficiency and specialized service delivery may be more critical success factors than scale advantages.
The methodological approaches employed across studies examining firm size–performance relationships vary significantly, potentially influencing the comparability of results. Sample sizes demonstrate considerable variation, ranging from small-scale studies of 7 Kenyan agricultural companies [
63] to large cross-sectional analyses of over 190,000 Vietnamese enterprises [
7]. Time periods also differ substantially, from single-year cross-sections such as Kyere and Ausloos [
12] analyzing UK firms in 2014, to multi-decade longitudinal studies such as Boussenna [
15] covering 2005–2017 in France. Furthermore, studies employ different financial performance measures—some focus solely on ROA [
8], others combine multiple metrics such as ROA, ROE, and ROS [
17], while market-based measures such as Tobin’s Q are used in studies such as Li and Chen [
13]. Statistical techniques also vary from simple OLS regression to sophisticated panel data models with fixed/random effects, contributing to the heterogeneity of findings across the literature and highlighting the challenges in drawing definitive conclusions about size–performance relationships.
These findings suggest that as advertising and marketing companies grow, they may experience declining returns on assets and reduced profit margins. This pattern contradicts the conventional wisdom that larger companies benefit from economies of scale, broader service portfolios, and stronger market positions.
Our results contrast with findings from studies conducted in Central and Eastern Europe, particularly those by Lehenchuk et al. [
9] and Zavalii et al. [
24], which identified positive relationships between firm size and financial performance for advertising agencies and marketing companies in Slovakia, Poland, the Czech Republic, and Ukraine. This geographical divergence underscores the importance of the regional context. Several factors might explain these differences: Western European advertising markets are generally more established and competitive; clients in mature markets may value the personalized service and agility that smaller agencies offer; smaller agencies might leverage digital technologies more effectively; and larger Western European agencies potentially face higher overhead costs without corresponding revenue benefits.
Furthermore, the emphasis on innovation and technological upgrading inherent in SDG 9 is supported by our findings. The agility and adaptability of smaller advertising and marketing companies allow them to rapidly adopt and implement new technologies, driving innovation within the industry. This capacity for innovation contributes directly to building resilient infrastructure and promoting sustainable industrialization, key targets within SDG 9. Specifically, their efficient use of digital tools and platforms facilitates the development of new marketing strategies and services, enhancing the industry’s overall innovativeness and contributing to economic growth. Smaller companies often act as technological pioneers, corresponding to target 9.5 on enhancing scientific research and upgrading technological capabilities across all sectors, as well as target 9.4 on upgrading infrastructure and retrofitting industries to increase resource-use efficiency and greater adoption of clean and environmentally sound technologies and industrial processes.
From the perspective of SDG 12, the negative relationship between firm size and financial performance in Western European advertising and marketing companies suggests that smaller organizations might better embody target 12.4′s principles of waste reduction through more efficient operational models that minimize unnecessary resource consumption. This efficiency aligns with target 12.2 on achieving sustainable management and efficient use of natural resources and target 12.5 on substantially reducing waste generation through prevention, reduction, recycling, and reuse. Smaller companies often demonstrate a lower environmental footprint per unit of value added, creating a model for more sustainable business practices in the industry. Additionally, their ability to quickly adapt to market changes allows them to more effectively implement sustainable procurement practices in accordance with target 12.7, thus promoting more responsible supply chains.
From a strategic management perspective, these results suggest that advertising and marketing companies should pursue «smart growth» strategies that emphasize efficiency gains over scale expansion. Rather than focusing on traditional expansion metrics such as headcount or asset accumulation, managers should prioritize investments in employee training, digital tools, and client relationship management systems that enhance productivity without proportional increases in operational complexity. The superior financial performance of smaller agencies indicates that competitive advantage in this industry stems from operational agility, specialized expertise, and rapid adaptation capabilities rather than economies of scale. This finding challenges conventional corporate strategy paradigms and suggests that sustainable competitive advantage in creative industries requires fundamentally different approaches to organizational development and resource allocation.
These findings support the theoretical perspective that in industries where innovation, flexibility, and rapid adaptation are crucial success factors, smaller organizations may have inherent advantages. The observed negative relationship between firm size and financial performance suggests that value creation in advertising and marketing may differ fundamentally from more traditional sectors where scale economies dominate. This aligns with the objectives of SDG 8, particularly target 8.2, regarding increased economic productivity through diversification, technological upgrading, and innovation, as our research demonstrates the efficiency of intellectual capital utilization compared to material-intensive structures in creative industries. Our findings also affirm the importance of policies aimed at supporting small and medium enterprises in the context of target 8.3, and offer a fresh perspective for target 8.1 on sustaining per capita economic growth, as they show that such growth might be more effectively achieved through a network of smaller, innovative companies than through the dominance of large corporate structures.
For practitioners, these findings provide valuable insights for strategic decision-making. Executives should approach growth strategies cautiously, recognizing that expansion may adversely affect financial performance if not managed properly. Larger agencies might benefit from adopting more decentralized structures that preserve agility and entrepreneurial spirit. Rather than focusing on size expansion, firms might achieve better financial performance by optimizing existing resources and enhancing operational efficiency.
This study establishes that smaller firms in Western European advertising and marketing tend to achieve better financial performance. This finding challenges conventional wisdom about the advantages of scale and highlights the unique characteristics of creative industries where flexibility, innovation, and rapid adaptation may be more valuable than scale economies. These insights contribute to the implementation of SDG 8 by demonstrating how intellectual capital-intensive business models can outperform material-intensive structures, offering important lessons for sustainable economic growth strategies in knowledge-based sectors.
These research findings translate into concrete implementation strategies for industry stakeholders pursuing sustainable development objectives. Management practitioners should prioritize human capital development and flexible organizational structures over traditional asset accumulation, implementing lean operational frameworks that maximize output per employee while maintaining service quality. Investment decisions should favor digital infrastructure and employee training programs that enhance productivity without proportional increases in material resources, directly operationalizing targets 8.2 and 9.5. For industry transformation toward sustainability, smaller agencies can serve as innovation laboratories, rapidly testing and implementing emerging sustainable marketing technologies, eco-friendly service delivery methods, and circular economy principles in client relationships. Policymakers should design support mechanisms that recognize the superior resource efficiency of smaller enterprises, creating regulatory frameworks and incentive structures that encourage sustainable scaling practices rather than mere size expansion. Industry associations can facilitate knowledge sharing networks among smaller agencies to accelerate the adoption of best practices in sustainable operations, digital transformation, and responsible client engagement. These targeted interventions can transform the documented size–performance relationship into a competitive advantage for sustainable business models, demonstrating that economic success and environmental responsibility are mutually reinforcing rather than competing objectives in knowledge-intensive creative industries.
Our findings align with dynamic capabilities theory, suggesting that in rapidly changing creative industries, the ability to quickly adapt and innovate may be more valuable than traditional scale advantages.
5. Limitations
Despite its significant contribution to understanding size–performance relationships in Western European advertising and marketing companies, this study acknowledges several critical limitations that warrant careful consideration when interpreting the results and their broader applicability. The complete panel dataset spanning 2019–2023 for all 500 companies is provided in
Supplementary Materials, enabling researchers to conduct alternative analyses or examine specific sub-periods.
The study covers 2019–2023, which encompasses the unprecedented global disruption caused by the COVID-19 pandemic. This extraordinary period fundamentally altered business operations, client behaviors, and market dynamics in ways that may have uniquely influenced the observed relationships between firm size and financial performance. The pandemic accelerated digital transformation processes, with smaller agencies potentially benefiting disproportionately from their inherent agility in adopting remote work technologies and digital service delivery models. Simultaneously, changes in consumer behavior toward digital channels and cost-conscious spending may have favored the lean operational models typical of smaller agencies. The economic uncertainty and financial constraints experienced by many businesses during this period could have affected larger agencies more severely due to their higher fixed costs and operational complexity. These pandemic-specific effects may not reflect normal market conditions, potentially limiting the generalizability of findings to post-pandemic or stable economic periods.
The relatively low R2 values observed in the regression models indicate that firm size variables explain only a portion of the variance in financial performance measures (ROA and PM). This suggests that numerous other factors not captured in our models significantly influence financial performance in the advertising and marketing sector. Critical omitted variables likely include firm age and organizational maturity, which may confound the size–performance relationship as younger, smaller firms might demonstrate different performance patterns compared to established small agencies. The level of digital maturity and technological sophistication represents another crucial factor, as agencies with advanced digital capabilities may outperform regardless of size. Client portfolio quality, including the stability of long-term contracts and the prestige of client relationships, significantly impacts financial performance but remains unmeasured in our analysis. Additionally, the qualitative aspects of human capital, such as creative talent quality, management expertise, and team cohesion, are difficult to quantify but critically important in creative industries.
The measurement approach itself presents limitations. Traditional financial metrics such as ROA and PM may inadequately capture value creation in creative industries where intangible assets, brand reputation, and long-term client relationships constitute primary sources of competitive advantage. These conventional metrics may undervalue the strategic investments in creativity, innovation, and client relationship building that characterize successful agencies. Furthermore, the annual measurement frequency may not capture the cyclical nature of advertising expenditures and seasonal variations in agency performance, potentially missing important temporal dynamics in the size–performance relationship.
The dataset across 16 Western European countries creates a significant regional aggregation bias that potentially masks substantial cross-country variations in market structures, competitive dynamics, and optimal firm sizes. Developed advertising markets such as Germany, France, and the United Kingdom operate under different competitive conditions compared to smaller European economies, where market concentration and client expectations may favor different organizational scales. Regulatory environments vary considerably across countries, with some nations implementing policies that explicitly support small and medium enterprises while others maintain neutral stances toward firm size.
Cultural business practices significantly influence optimal organizational structures and client relationship management approaches. Nordic countries’ emphasis on flat organizational structures and collaborative decision-making may favor smaller agency models, while hierarchical business cultures in other regions might reward larger, more structured organizations. The study fails to account for language barriers and cultural preferences that may influence client selection of agency partners, potentially favoring locally rooted smaller agencies in some markets while benefiting internationally capable larger agencies in others.
The advertising and marketing industry encompasses remarkably diverse business models and service offerings that may respond differently to scale effects. Traditional full-service advertising agencies operate under different economic models compared to specialized digital marketing firms, public relations agencies, or media buying specialists. The relationship between size and performance likely varies significantly across these subsectors, with some services potentially benefiting from scale economies while others favor boutique approaches. B2B agencies serving corporate clients may face different optimal size considerations compared to B2C agencies focused on consumer markets.
The sample selection focusing on the top 500 performing companies introduces survivorship bias that may not represent the full spectrum of industry participants. This selection criterion excludes struggling firms, recent market entrants, and companies that ceased operations during the study period, all of which could provide crucial insights into the size–performance relationship. Start-up agencies and recently established digital-native firms may demonstrate different patterns compared to established players included in the sample. Additionally, privately held agencies may exhibit different financial performance patterns compared to publicly listed companies due to varying growth objectives, investment strategies, and performance measurement approaches.
Financial data quality and comparability present additional challenges when analyzing multinational samples. Accounting standards, while harmonized through IFRS adoption, may still reflect country-specific interpretations and practices that affect financial metric comparability. The treatment of intangible assets, particularly intellectual property and client relationships, varies across jurisdictions and may systematically bias performance measures for different types of agencies.
The binary classification of companies as large or small based on quantitative thresholds may not capture the complex, multidimensional nature of organizational scale. Agencies may be large in terms of employee count but maintain lean asset structures, or conversely, possess significant technological assets while operating with small teams. These nuanced differences in organizational configuration may significantly impact the observed size–performance relationships.
These limitations do not diminish the value of the current findings, but rather emphasize the need for cautious interpretation and highlight important avenues for future investigation. The consistent negative relationship between firm size and financial performance across multiple size measures and performance indicators provides robust evidence of the pattern, while acknowledging that the underlying mechanisms and contextual factors require further exploration to fully understand the implications for industry strategy and sustainable development practices.
6. Conclusions
This study established a significant negative relationship between firm size and financial performance in Western European advertising and marketing companies, providing important insights for both researchers and industry practitioners. This result is consistent regardless of the proxy measure of firm size used (total assets, number of employees, or sales) and has important implications for the development of financial strategies and making investment decisions in the industry. The advantages of resource-optimized structures with high management flexibility and effective use of intellectual capital over material-intensive structures are particularly noticeable in the context of implementing SDGs 8, 9, and 12. For example, within SDG 8, more flexible and compact companies demonstrate more efficient conversion of resources into financial results, which suggests the need to revise traditional approaches to scaling businesses in creative industries where intangible assets dominate. For making optimal investment decisions, managers should focus on strategies that maximize the efficiency of using available resources and intellectual capital, rather than simply striving to increase company size through building up assets or expanding staff.
The key contributions of this study include: (1) providing the first comprehensive empirical evidence of size–performance relationships in Western European advertising and marketing companies using panel data methodology; (2) demonstrating the methodological necessity of addressing multicollinearity when analyzing multiple firm size indicators; (3) establishing theoretical support for dynamic capabilities theory over traditional economies of scale in creative industries; and (4) linking empirical findings to sustainable development goals by showing how smaller, resource-optimized firms better embody SDG principles of efficient resource utilization and innovation-driven growth.
Based on a comprehensive panel data analysis of 500 top-performing companies across 16 Western European countries during 2019–2023, our results consistently demonstrate that smaller firms in this sector achieve better financial results. All three proxy measures of firm size (TA, NE, and sales) exhibited statistically significant negative relationships with financial performance (ROA and PM). TA showed the strongest negative impact on ROA, while sales had the most significant negative effect on PM. These outcomes challenge conventional wisdom about economies of scale in the advertising and marketing industry and suggest that smaller agencies benefit from greater flexibility, innovation capacity, and adaptability to rapidly changing market conditions—qualities particularly valuable in creative industries where intellectual capital predominates over tangible assets.
The findings fill an important gap in the literature concerning Western European advertising and marketing companies, expanding beyond previous studies focused primarily on Central and Eastern European markets. They provide empirical support for business models that emphasize resource optimization, organizational agility, and efficient intellectual capital utilization over material-intensive approaches. For industry practitioners, these results suggest that strategic growth should prioritize qualitative improvements in service delivery and operational efficiency rather than merely increasing company size. Investors and financial analysts should recognize that traditional assumptions about scale advantages may not apply to this sector when evaluating companies or making investment decisions.
The results of our study have important implications for achieving SDGs in the context of the advertising and marketing industry. The negative relationship between firm size and financial performance highlights the potential of small- and medium-size enterprises to achieve SDG 8 and SDG 9. Smaller agencies, with their increased flexibility and innovation, demonstrate a development model that is consistent with the principles of SDG 12 through more efficient use of resources and optimization of business processes.
Based on the empirical evidence demonstrating a negative relationship between firm size and financial performance in Western European advertising and marketing companies, these management implications and recommendations provide several actionable insights for company owners and managers in the industry, challenging conventional wisdom about optimal firm scaling strategies.
Company owners should fundamentally reconsider traditional growth strategies that prioritize scale expansion through asset accumulation or workforce increases, as these approaches may negatively impact financial performance. Instead, owners should focus on strategic investment in intellectual capital by prioritizing digital infrastructure and employee skill development over physical asset expansion, as intellectual capital utilization proves more effective than material-intensive structures. Additionally, owners should consider implementing decentralized organizational structures that preserve agility and entrepreneurial spirit, even as firms grow, to maintain the flexibility advantages typically associated with smaller agencies. Strategic partnerships and outsourcing arrangements may provide scale benefits without the negative performance impacts of internal expansion.
Managers should focus on operational efficiency optimization by streamlining processes, eliminating redundancies, and maximizing output per employee rather than pursuing headcount increases. They should establish lean operational frameworks that emphasize quality service delivery and client satisfaction over traditional metrics of company size, aligning business strategies with the demonstrated superior performance of resource-optimized business models. Investment decisions should prioritize technologies and training programs that enhance productivity without proportional increases in operational complexity or fixed costs.
Future research should explore how digital transformation impacts these relationships and investigate potential non-linear effects or threshold levels where the relationship between firm size and financial performance might change. Additionally, examining how these relationships vary across different market segments within the advertising and marketing industry could provide more nuanced insights for strategic decision-making.


