3. Problem Statement
Unlike previous management models, which primarily focused on efficiency, automation, and data-driven processes, Management 5.0 emphasizes the harmonious collaboration between artificial intelligence (AI), machine learning (ML), and human expertise to drive sustainable and ethical business practices. In the context of the automotive industry, Management 5.0 plays a crucial role in facilitating the transition towards eco-friendly vehicles by leveraging digital tools to forecast demand, optimize production, and enhance customer engagement.
Eco-friendly vehicles, such as electric vehicles (EVs) and hydrogen-powered cars, are at the forefront of sustainable transportation solutions aimed at reducing carbon emissions and promoting environmental conservation. The adoption of these vehicles is driven by technological advancements, regulatory policies, and shifting consumer preferences toward greener alternatives. Machine learning technologies contribute significantly to this transformation by enabling manufacturers to analyze vast amounts of market data, predict future demand trends, and develop tailored marketing strategies. Through predictive analytics, businesses can anticipate customer preferences, optimize supply chain operations, and enhance their competitive advantages in the rapidly evolving automotive landscape.
The transition to eco-friendly transportation represents a major contemporary trend in sustainable mobility development. However, forecasting demand in this market segment remains an exceptionally complex task for manufacturers. This complexity arises from multiple factors, including market unpredictability, rapid technological progress, dependence on government incentives, and the vast number of variables influencing consumer decisions.
As a relatively new sector, the eco-friendly vehicle market lacks high-quality historical analytical data necessary for accurate modeling. Additionally, rapid technological breakthroughs, particularly in battery development and alternative energy sources, can drastically shift consumer preferences, making long-term planning difficult. Regulatory policies, economic instability, and global crises further contribute to uncertainty in consumer behavior.
A crucial aspect of demand forecasting is its dependence on government subsidies and tax incentives, which are often unstable and subject to change. Consumer choices are also influenced by the availability of a well-developed charging infrastructure, fuel prices, ownership costs of eco-friendly vehicles, and public awareness levels. Market competition, model diversity, and product saturation further complicate the forecasting process.
Social and cultural factors cannot be ignored, as attitudes toward eco-friendly transport vary by region, making the development of universal demand models even more challenging. These complexities highlight the urgent need for advanced analytical approaches [
21,
22,
23,
24,
25], such as machine learning, to process vast amounts of data and enable adaptive demand forecasting in an environment of continuous uncertainty.
While traditional forecasting methods remain valuable in certain contexts, they face significant limitations when applied to modern dynamic markets, particularly the eco-friendly vehicle market. One of the primary challenges is their lack of adaptability to sudden environmental changes. Regulatory shifts, rapid technological advancements, and fluctuating consumer preferences render static models, typically used in conventional methods, ineffective in capturing the intricate relationships between different factors.
Another major obstacle is their reliance on historical data. This is especially problematic in the eco-friendly vehicle market, characterized by constant innovation and evolving consumer preferences. Moreover, traditional methods struggle to handle large, complex datasets, such as socio-economic indicators and consumer behavior patterns.
The eco-friendly transport market operates on nonlinear, multifactorial processes, where the influence of one variable often depends on others. Conventional approaches frequently underestimate the impact of external shocks, such as pandemics, energy price fluctuations, or new regulatory measures, leading to significant discrepancies between forecasts and actual market conditions.
Traditional models also fail to account for cultural, social, and geographical differences that significantly influence consumer decisions regarding eco-friendly vehicles. Factors such as environmental attitudes, charging station accessibility, and even regional trends can have varying effects across different locations.
The application of machine learning technologies opens new opportunities for significantly improving demand forecasting accuracy in the eco-friendly vehicle market. The ability to analyze vast datasets, recognize complex relationships between multiple factors, and adapt to changing market conditions makes machine learning an indispensable tool in this field.
First, a key advantage of machine learning is its ability to develop multifactorial models. These models incorporate a wide range of variables affecting demand, including historical sales data, macroeconomic indicators, social trends, consumer behavior characteristics, climate conditions, and regulatory policies.
Second, machine learning models effectively capture nonlinear dependencies and complex interactions between variables, which are characteristic of the eco-friendly vehicle market. Algorithms such as gradient boosting, neural networks, and ensemble methods can identify hidden patterns in data that remain undetected by traditional methods.
Third, leveraging big data techniques and integrating information from diverse sources, including social media, search queries, and mobility data, enables the development of more comprehensive and informative models.
Fourth, machine learning ensures high adaptability to market changes. Online algorithms that operate in real-time allow continuous forecast updates based on new incoming data. This is particularly crucial in highly volatile markets where rapid changes are common, such as the eco-friendly transport sector.
Fifth, machine learning techniques such as clustering analysis and consumer segmentation enable the grouping of customers based on shared characteristics, including socio-demographic, regional, and financial factors.
To ensure accurate and reliable demand forecasting for eco-friendly vehicles, a broad spectrum of diverse data and factors must be collected. These include sales volumes across different regions, seasonal fluctuations, and the impact of government policies. Macroeconomic indicators, vehicle and energy prices, as well as state regulations, play a critical role in shaping demand. Additionally, consumer socio-demographics, market competition, charging infrastructure, consumer behavior, and climatic conditions are essential for understanding market trends. Technological progress and innovations further define the future of eco-friendly transport.
Integrating these diverse data sources into forecasting models is the key to developing accurate, adaptive, and insightful demand forecasts for the eco-friendly vehicle market.
Under the Management 5.0 framework, organizations are encouraged to integrate smart technologies not only to improve operational efficiency but also to align sustainability goals and corporate social responsibility (CSR) initiatives. The ability to forecast demand for eco-friendly vehicles using machine learning ensures that manufacturers can respond proactively to market changes, minimize resource waste, and enhance customer satisfaction. Management 5.0 encourages strategic use of AI to align digital tools with sustainable development priorities.
4. Methodology
Considering the aforementioned issues of forecasting demand for environmentally friendly vehicles to enhance manufacturers’ competitive advantages, the most suitable approach is a combination of various machine learning algorithms that take into account the specifics of this sector. In particular, it is necessary to apply time series methods such as ARIMA/SARIMA, LSTM (Long Short-Term Memory), and Prophet, as demand exhibits strong temporal dependence, seasonality, and trends. LSTM, as a recurrent neural network, is particularly effective for processing sequential data and detecting complex long-term patterns, whereas Prophet is well suited for forecasting with consideration of seasonal fluctuations and holidays.
Hybrid Forecasting Framework and Methodological Contribution.
This study proposes a hybrid forecasting approach that assigns specific machine learning models to different types of markets based on size, volatility, and data quality. ARIMA is applied to markets with strong short-term patterns, Prophet to stable and seasonal markets, and Random Forest to smaller, nonlinear environments. In addition, the forecasting system is integrated with economic evaluation models that quantify cost savings, market impact, and ROI (return on investment). This integrative framework represents a methodological novelty that supports adaptive, context-aware forecasting in alignment with the Management 5.0 concept.
In addition to methodological advances, relevant literature in finance emphasizes the critical role of demand forecasting in optimizing supply chain finance operations, such as inventory-based financing, working capital management, and liquidity planning. Studies by Pfohl and Gomm [
26], Hofmann [
27], and Gelsomino et al. [
20] demonstrate that accurate demand forecasting significantly improves cash flow visibility, reduces capital tied up in inventory, and enhances collaboration between supply chain actors. These insights reinforce the financial relevance of the forecasting approach proposed in this study.
While models such as LSTM and gradient boosting algorithms (e.g., XGBoost, LightGBM) were considered conceptually, they were not applied in the current empirical phase due to limitations in data volume, interpretability concerns, and a focus on practical applicability. These models are identified as promising directions for future research.
To account for the impact of various factors, such as economic, social, technological, and political influences, it is advisable to use regression models, including Decision Tree Regression and ensemble methods like Random Forest, as well as gradient boosting algorithms (XGBoost, LightGBM, CatBoost), which enable modeling of nonlinear dependencies and complex interactions between factors. The Support Vector Regression (SVR) method is robust against outliers and is suitable for modeling nonlinear dependencies. Additionally, neural networks, particularly the multilayer perceptron (MLP) and convolutional neural networks (CNNs), can be used to model more complex relationships between various factors, although they require large volumes of data. Ensemble methods that combine multiple models can improve the accuracy and reliability of forecasts. By integrating time series methods for analyzing temporal dynamics with regression and neural network approaches to account for various influencing factors, it is possible to achieve high accuracy in forecasting demand for environmentally friendly vehicles, making it a valuable tool for enhancing manufacturers’ competitiveness.
It is important to note that the choice of a specific algorithm depends on the available data and research objectives; therefore, a comparative evaluation of different models using appropriate metrics and careful data preparation is necessary.
The following machine learning models were used for demand forecasting:
ARIMA: for analyzing time series with strong autocorrelation and trends.
Prophet: for data with seasonality and the influence of external events.
Random Forest: for accounting for nonlinear dependencies between factors, especially in small markets.
Although this study acknowledges the value of granular and unstructured data sources—such as consumer reviews, social media trends, mobility patterns, and web search behavior—these were not directly incorporated into the current empirical modeling. Due to the constraints of data availability, access, and preprocessing complexity, the ARIMA, Prophet, and Random Forest models were developed using structured datasets from official sources such as Eurostat and the European Commission. These include time series data on vehicle sales, GDP, CO2 emissions, and transport infrastructure. Future research will focus on the integration of unstructured data to enhance model contextualization, behavioral sensitivity, and forecasting accuracy.
Consumer behavior data is also crucial, including prior experience with environmentally friendly vehicles, vehicle replacement frequency, and key purchasing criteria. Macroeconomic indicators, such as regional GDP, inflation, and unemployment rates, as well as legislative aspects, including tax incentives and regulations on vehicle emissions, must be considered. Dynamic factors, such as shifts in the eco-transport market trends or consumer preferences, should also be integrated into the model. Ultimately, the model must account for the interrelationships between these variables, as, for example, increased subsidies or a rise in the number of charging stations can significantly impact demand levels. Thus, considering these parameters will enable the creation of an adaptive model capable of reflecting real market conditions.
The process of collecting and processing data for forecasting [
28] demand for environmentally friendly vehicles consists of several stages.
The first stage involves identifying data sources. The primary sources include public databases and statistical reports containing information on vehicle sales, environmental indicators, and population demographics. Additionally, opinions from publicly available sources were taken into account to understand potential buyers’ motivations and barriers. Data from manufacturers and dealers will provide insights into sales volumes, inventory levels, and prices. Furthermore, data will be collected through social media analysis, consumer reviews, and automated data scraping from websites.
The second stage involves preprocessing the data. This stage includes removing incorrect, duplicate, or missing records, normalizing data to unify measurement units, and categorizing textual information. An anomaly analysis will also be conducted to identify unrealistically high or low values.
The third stage entails integrating data from different sources into a unified dataset. This step allows the combination of socio-demographic, economic, environmental, marketing, and technological indicators. Special indices will be created to evaluate complex parameters such as environmental sustainability and competitiveness.
The fourth stage involves data analysis and the selection of key variables. Correlation analysis methods will be applied to identify the main factors influencing demand. Dimensionality reduction techniques, such as Principal Component Analysis (PCA), will be used to reduce the number of parameters and highlight the most important variables.
The fifth stage consists of data transformation for the model. Numerical variables will be scaled to ensure uniform influence on the model, while categorical variables (such as regions or vehicle types) will be encoded using one-hot encoding.
Data will be stored in databases like MySQL or MongoDB for structured information. Cloud storage will be used for unstructured data, such as text or images.
The final stage is data visualization and verification. Graphs and charts will be created to identify trends, and data quality will be assessed using key metrics, such as completeness levels or parameter value distributions.
This step-by-step approach ensures that the data is of high quality, relevant, and ready for use in machine learning models.
To evaluate the effectiveness of the forecasting model, quantitative metrics will be used to determine the accuracy, stability, and reliability of its results. The main metrics include:
Mean Absolute Error (MAE): This metric assesses the average absolute error between predicted and actual values, providing an understanding of the average forecast error level in the same measurement units as the target variable.
Mean Squared Error (MSE): MSE calculates the mean squared deviation between predictions and actual values. It is more sensitive to large errors, making it suitable for cases where significant errors are critical.
Root Mean Squared Error (RMSE): This metric is the square root of MSE and is interpreted in the same units as the predicted variable. RMSE helps evaluate the average forecast error while considering large deviations.
R-squared (R2): Also known as the coefficient of determination, R2 indicates what proportion of the target variable’s variation is explained by the model. A value close to 1 suggests high model quality.
Mean Absolute Percentage Error (MAPE): MAPE calculates the average absolute error as a percentage of actual values. It is particularly useful for analyzing model performance compared to previous periods or other models.
Symmetric Mean Absolute Percentage Error (SMAPE): SMAPE is a modified version of MAPE that accounts for symmetry between actual and predicted values, avoiding scale-related issues.
Explained Variance Score: This metric indicates how well the model explains the variance of the target variable. Higher values indicate better model performance in capturing data variations.
Mean Bias Error (MBE): MBE is used to assess the presence of systematic bias in forecasts. Positive or negative values indicate a tendency to overestimate or underestimate results.
Precision, Recall, and F1-Score (for classification tasks): If the task involves predicting categories (e.g., “high demand” vs. “low demand”), precision, recall, and the harmonic mean F1-score will be used.
Akaike Information Criterion (AIC) and Bayesian Information Criterion (BIC): These criteria evaluate model complexity and its ability to fit the data, helping to select a model with the best balance between accuracy and simplicity.
For a comprehensive evaluation of effectiveness, all the mentioned metrics will be applied depending on the task type (regional or categorical) and data characteristics. Conclusions about the model’s performance will be drawn based on a combination of multiple metrics, ensuring different aspects of forecasting are considered.
5. Results
The study employs a comprehensive approach to analyzing the market for environmentally friendly transport in European countries during the period 2019–2023. The analysis is based on historical data for 2019–2023, with forecasting conducted for the period 2025–2027. The empirical basis of the research is formed using data from the official portal of the European Commission [
13,
14,
15,
16], which contains information on sales volumes of eco-friendly transport, macroeconomic indicators, and CO
2 emission levels. This study utilizes publicly available national-level data rather than firm-level data. Nonetheless, the proposed models are applicable at the company level and can be adapted using internal operational data by manufacturers.
To ensure the reliability of the results, preliminary data processing was performed, including the removal of anomalous values, handling of missing data [
28,
29,
30], and standardization of indicator formats.
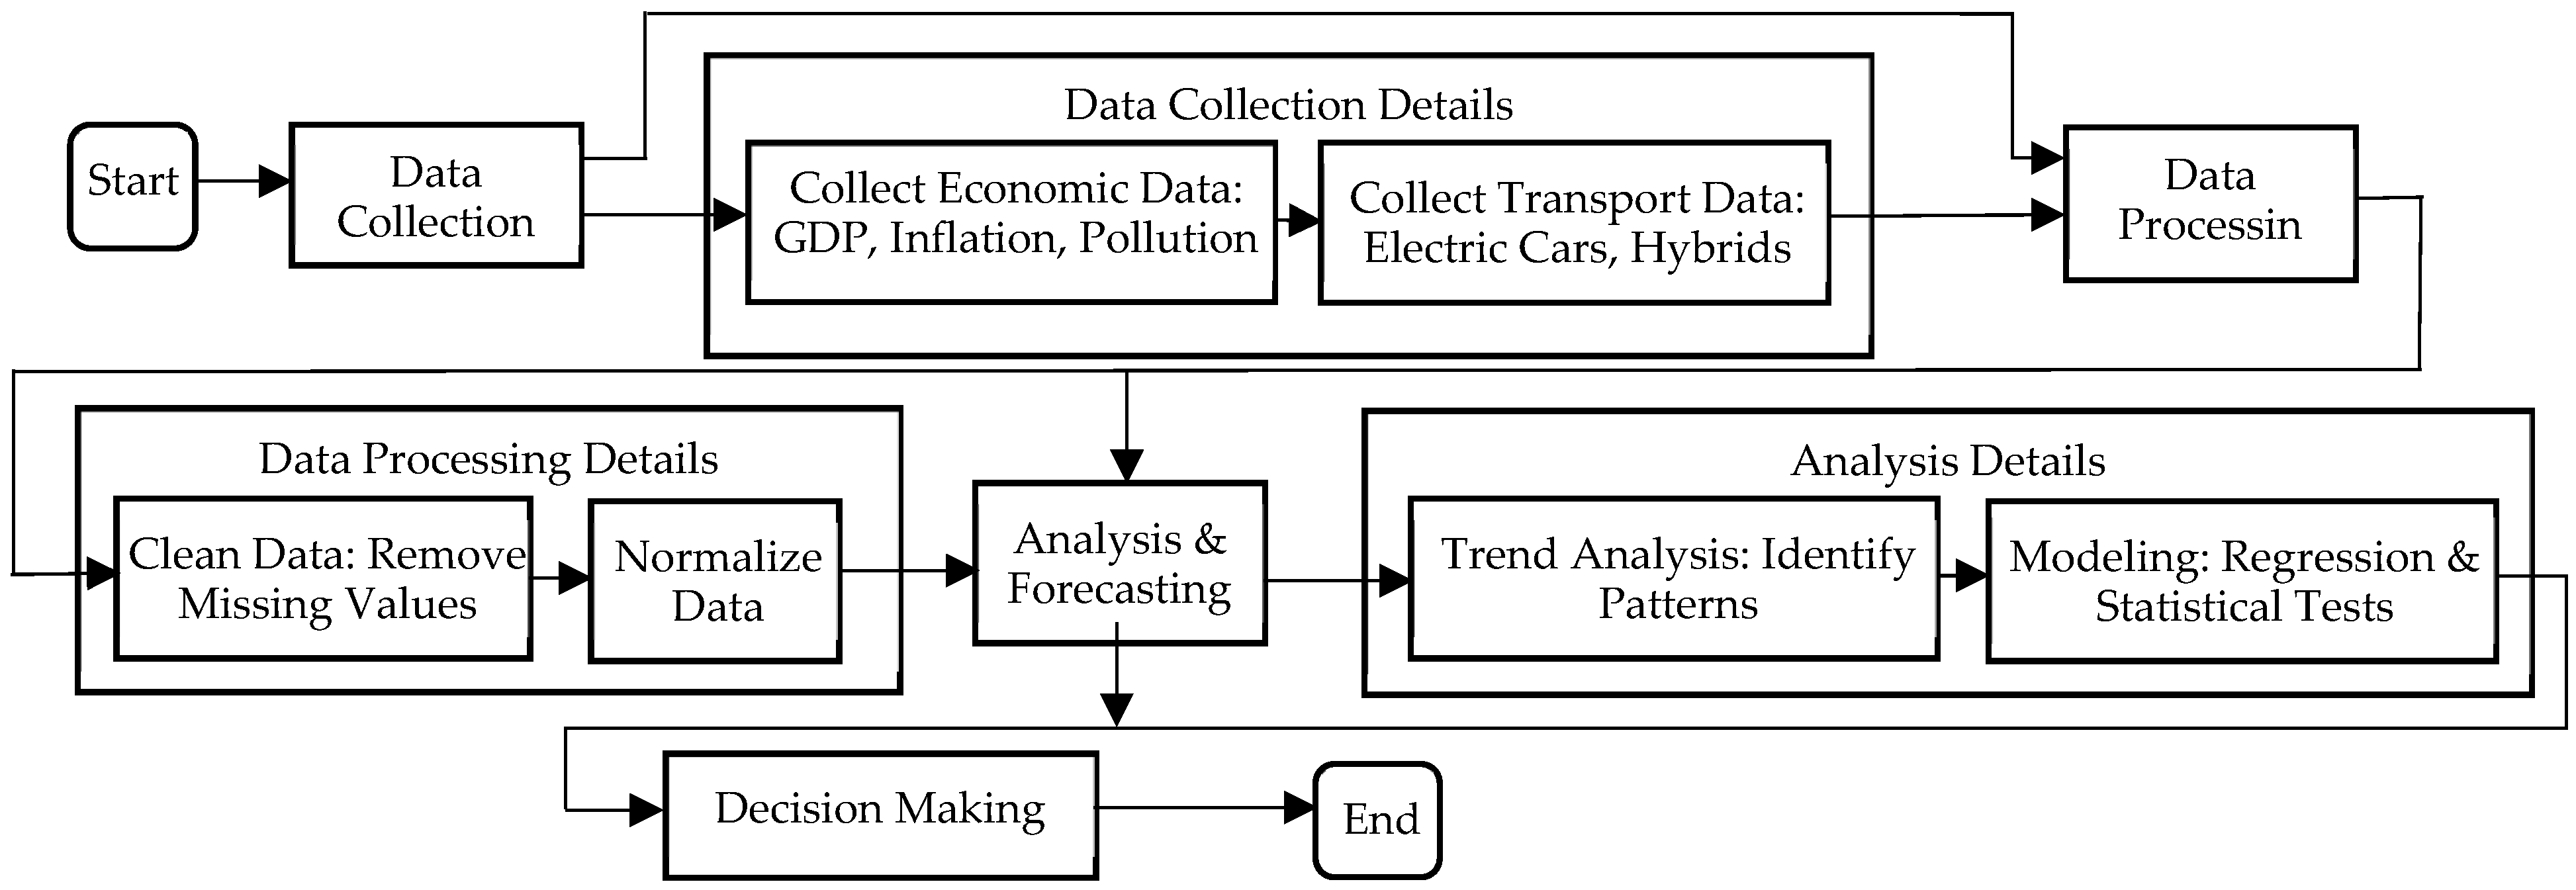
The study incorporates a combination of statistical analysis methods and machine learning techniques, implemented using modern data processing tools (pandas, numpy) and statistical modeling (statsmodels). The analytical process includes data preparation using machine learning methods (scikit-learn), conducting statistical calculations, and visualizing results with specialized graphical libraries (matplotlib). This approach enabled a comprehensive time series analysis, correlation analysis, and the development of regression models to identify key patterns in the development of the eco-friendly transport market, as illustrated in
Figure 1.
The analysis covers 13 European countries for which complete statistical datasets on eco-friendly vehicle sales, macroeconomic indicators, and CO2 emission levels are available. This sample size ensures the representativeness of the study in capturing market trends.
The mathematical framework of the study includes a set of interconnected models for a comprehensive analysis of the eco-friendly vehicle market. The eco-friendly vehicle data aggregation model serves as a fundamental component of the analytical toolkit and defines the method for calculating the total eco-friendly vehicle volume (TEV) for each country i in year j as the sum of the number of electric vehicles (EVs), hybrid vehicles (HVs), and plug-in hybrids (PHVs):
where TEV
ij is the total volume of eco-friendly vehicles, EV
ij is the number of electric vehicles, HV
ij is the number of hybrid vehicles, and PHV
ij is the number of plug-in hybrids for country i in year j.
To assess market dynamics, the growth rate (GR) indicator is used, which is calculated as the relative change in the total volume of eco-friendly vehicles over the study period:
where GR
i is the growth rate for country i, and TEV
i2022, TEV
i2019 are the respective indicators for the corresponding years.
To ensure data comparability across countries, standardization of indicators is performed using the following formula:
where x is the original value of the indicator, μ is the mean value, and σ is the standard deviation.
Data selection for analysis is carried out based on the criterion of information completeness:
where C is the set of analyzed countries, N is the set of all countries, Y is the set of years (2019–2022), and d
ij represents the data for country i in year j.
Based on the comprehensive analysis of data on the development of the eco-friendly transport market in European countries from 2019 to 2023, the following key patterns and trends can be identified (
Figure 2). The growth dynamics of demand exhibit significant variability across countries. Germany demonstrates the highest growth rate (382.79%), reflecting the effectiveness of government policies promoting eco-friendly transport and a well-developed infrastructure. Luxembourg shows the second-highest growth rate (326.99%), confirming the importance of a high level of economic development. A group of countries, including Austria, Finland, and Malta, exhibits growth exceeding 230%, indicating the success of regional eco-transport development programs. The relatively lower growth rate in Norway (94.11%) is explained by the already high market penetration of eco-friendly transport.
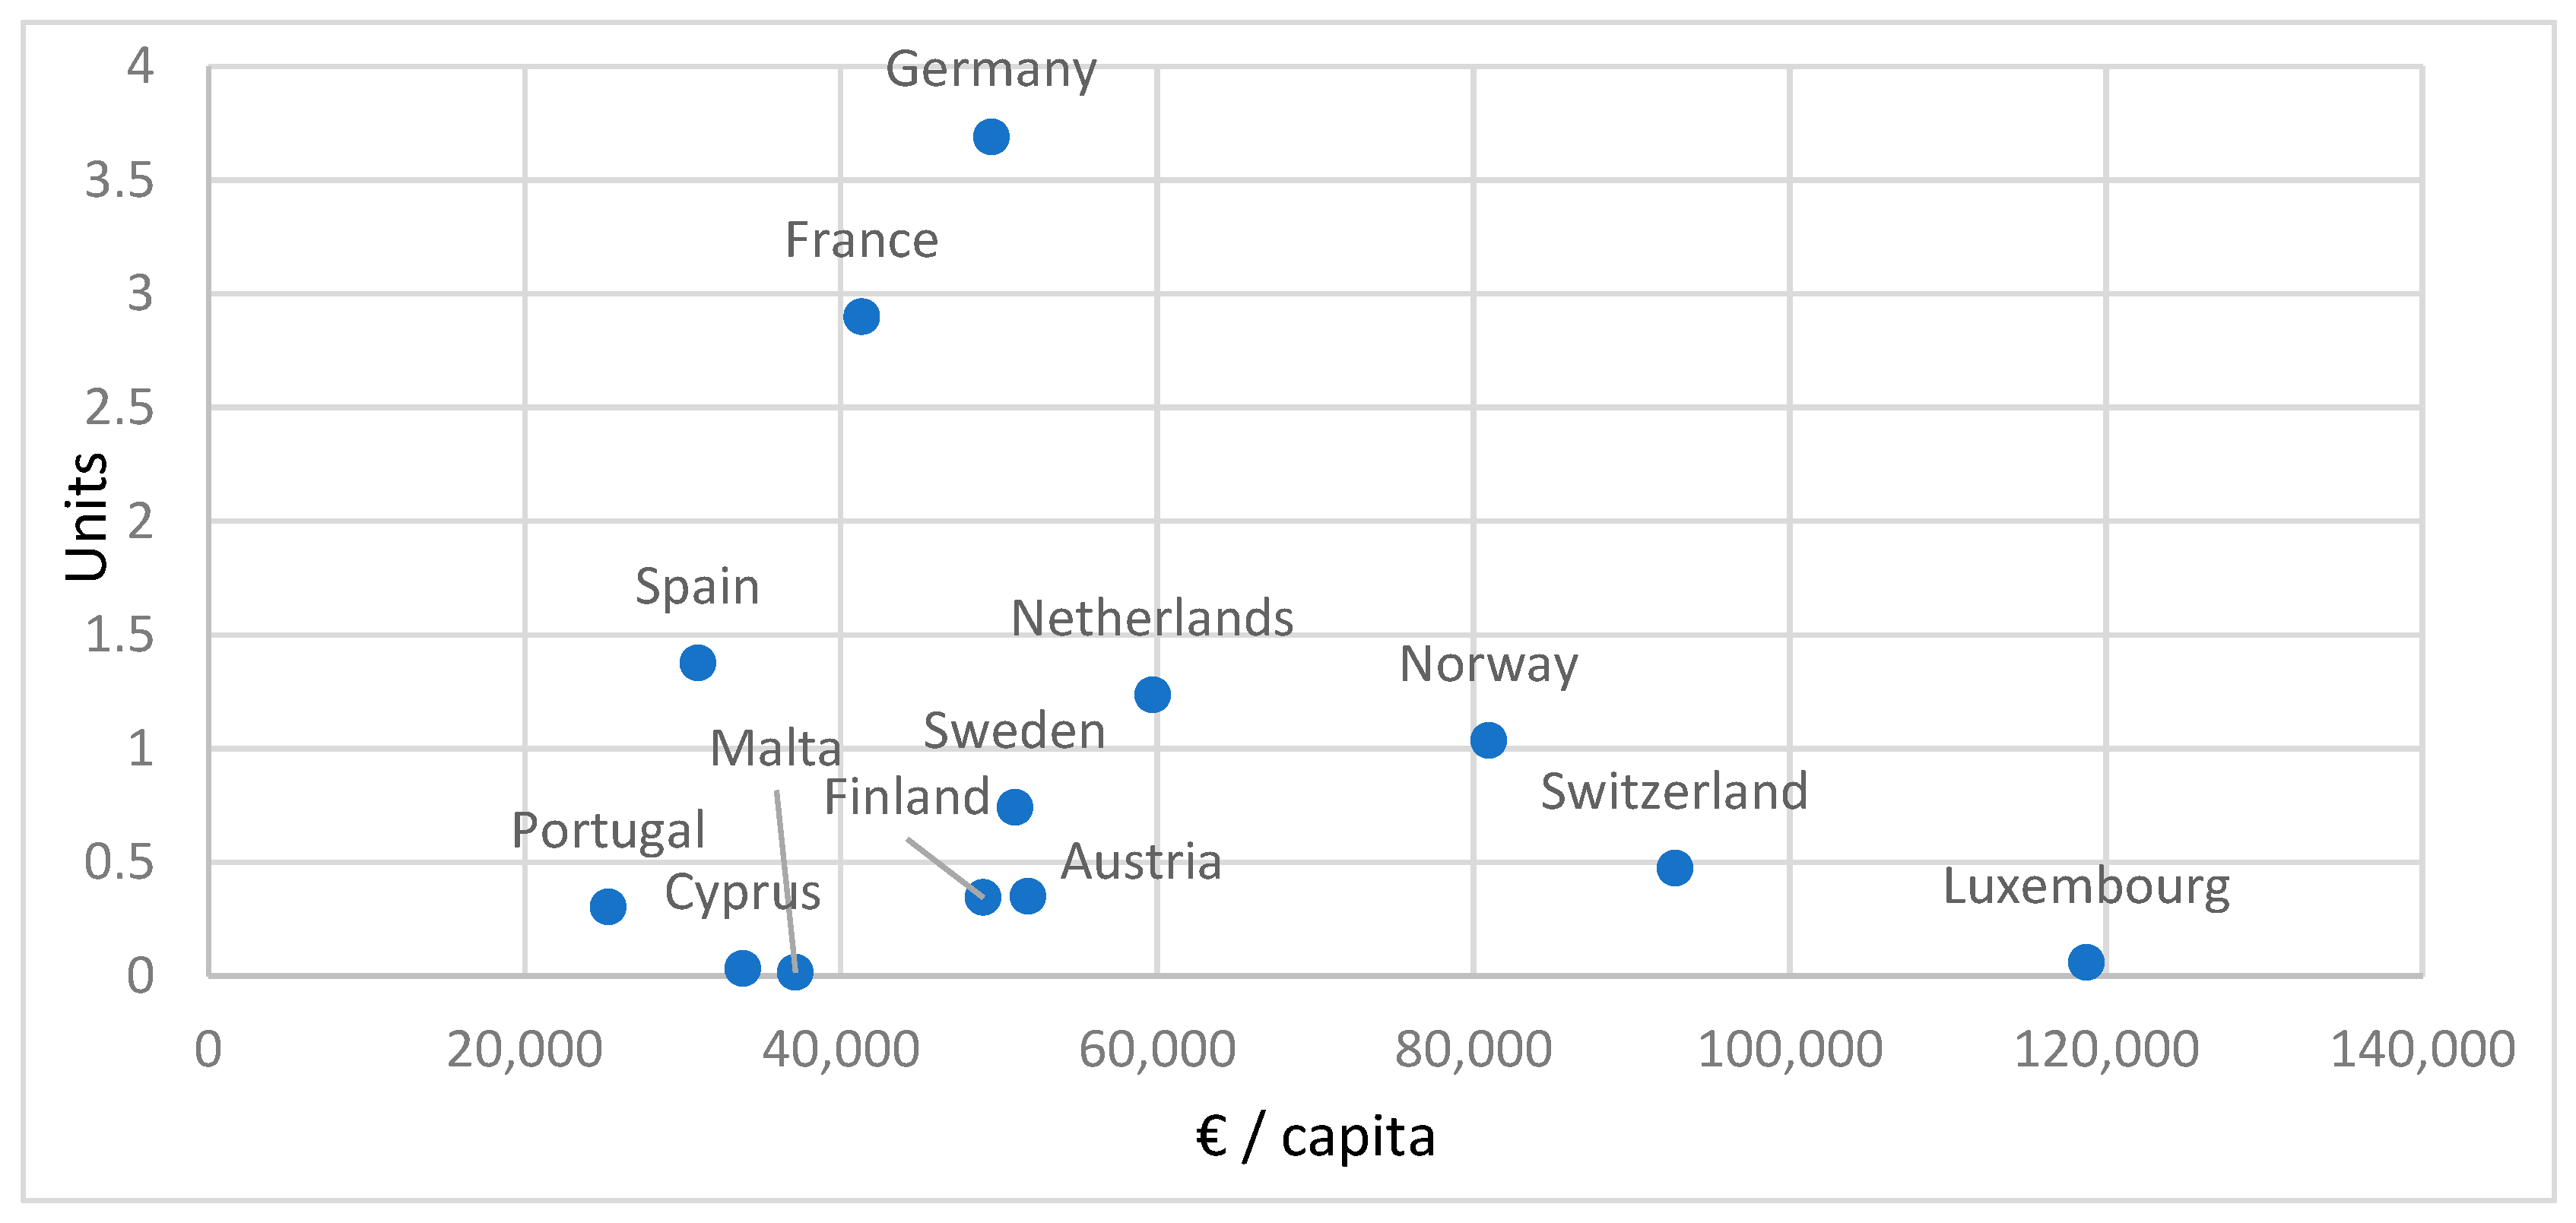
The market structure analysis reveals significant differences between countries. The highest absolute demand is observed in economically developed countries such as Germany and France. Countries with high GDP per capita (Luxembourg, Norway, Switzerland) demonstrate varying levels of demand, indicating the importance of factors other than economic development (
Table 1). There is a clear correlation between the development of eco-transport infrastructure and the demand level.
The influence of economic factors is characterized by complex interrelationships. A positive but nonlinear correlation has been identified between GDP levels and demand for eco-transport (
Figure 3). Countries with high GDP demonstrate varying rates of eco-transport adoption, highlighting the importance of government policy and infrastructure development.
Economic incentives and tax benefits play a key role in shaping demand. Based on the analysis, four groups of countries can be distinguished by the growth rates of the eco-transport market (
Figure 4):
Leaders (>300%): Germany and Luxembourg demonstrate the highest rates due to comprehensive stimulation policies and developed infrastructure.
High growth (230–300%): Austria, Finland, Malta, and France show consistently high growth rates, confirming the effectiveness of their eco-transport development strategies.
Medium growth (180–230%): Sweden, Switzerland, Portugal, and Spain are characterized by moderate but steady adoption of eco-transport.
Moderate growth (<180%): Cyprus, the Netherlands, and Norway exhibit lower growth rates, which can be partially explained by the specificities of local markets and achieved levels of saturation.
The results obtained confirm the effectiveness of using machine learning methods for demand forecasting and demonstrate the importance of considering multiple factors when analyzing the eco-transport market. A comprehensive approach to data analysis has allowed us to identify key patterns in market development and factors influencing its dynamics.
The study involves several interconnected stages of analytical work. The first stage involves a comprehensive analysis of the time series data on eco-transport sales, which helps identify major trends and market development patterns. The next step is to assess the impact of macroeconomic indicators on market dynamics, providing an understanding of the economic drivers behind the growth in demand for eco-transport. An essential component of the study is modeling the interrelationships between various influencing factors, which allows for identifying the key determinants of market development. Based on the results obtained, predictive models are developed and validated, enabling the forecasting of future market trends. The final stage is the formulation of practical recommendations for manufacturers and regulatory bodies, based on the results of the analysis and the developed predictive models.
Developing reliable forecasts for the eco-transport market requires the use of a set of mathematical models capable of considering various aspects of time series and their interrelationships. Each of the chosen models has its unique characteristics and advantages, providing a more complete picture of future market trends.
To ensure the accuracy and reliability of the forecasting, three complementary mathematical models have been used, each of which addresses specific aspects of the data analysis:
- (a)
The ARIMA (p,d,q) model is described by the equation:
where
B is the backshift operator;
Φ(
B) = 1 −
φ1B −
φ2B2 −…−
φₚBp is the autoregressive operator;
θ(
B) = 1 +
θ1B +
θ2B2 +…+
θqBp is the moving average operator;
εt is white noise; and d is the order of integration.
This model is particularly effective for analyzing time series with strong autocorrelation and clear trends, which is characteristic of eco-transport sales data.
- (b)
The Prophet model is represented by the decomposition:
where
g(
t) is the trend (a nonlinear growth function);
s(
t) is the seasonal component;
h(
t) is the holiday/event effects; and
εt is the error component.
Prophet is particularly valuable for analyzing data with pronounced seasonality and the influence of external events, such as changes in legislation or the introduction of new incentives.
- (c)
Random Forest uses an ensemble approach for forecasting:
where
ŷ is the predicted value;
n is the number of trees; and
ti(
x) is the prediction of the
i-th tree.
This method provides high robustness to outliers in the data and the ability to account for nonlinear relationships between various influencing factors.
To ensure the reliability and accuracy of forecasting, a set of complementary metrics for model quality assessment is used. Each metric reflects different aspects of prediction accuracy and allows for a comprehensive evaluation of the effectiveness of the developed models.
The Mean Absolute Error (MAE) is a basic metric that evaluates the average deviation of predicted values from the actual ones in absolute terms:
where
n is the number of observations;
yi is the actual value; and
ŷi is the predicted value.
The Root Mean Squared Error (RMSE) gives greater weight to significant deviations, which is particularly important when assessing the reliability of forecasts:
where
n is the number of observations;
yi is the actual value; and
ŷi is the predicted value.
The Coefficient of Determination (R
2) indicates the proportion of the variation in the target variable that is explained by the model:
where
yi is the actual value;
ŷi is the predicted value; and
ȳ is the mean value of the actual data.
Using these metrics together allows for the assessment of different aspects of forecast quality. MAE provides an intuitive evaluation of accuracy in the units of measurement of the target variable. RMSE is more sensitive to significant forecasting errors, which is important for identifying critical deviations. R2 allows for the assessment of the overall model quality and its ability to explain the variation in the data. The combined analysis of these metrics provides a comprehensive evaluation of the effectiveness of the developed predictive models and their practical applicability for forecasting the development of the eco-transport market.
To comprehensively assess the dynamics of the eco-transport market development, a system of interconnected indicators has been developed, enabling the evaluation of both overall growth rates and the level of eco-transport penetration in the market. The base indicator for assessing market dynamics is the growth rate, which is calculated using the formula:
where
Vt is the market volume in the current period;
V₀ is the market volume in the base period.
This indicator allows for evaluating the relative speed of market development and comparing the dynamics of different countries, regardless of the absolute size of their markets. What is especially important is that the growth rate accounts for both quantitative changes in sales volumes and qualitative transformations in the market structure.
To assess the level of eco-transport adoption, a special penetration index has been developed:
where
IPₑ is the eco-transport penetration index;
Ei is the number of eco-vehicles; and
Ti is the total number of vehicles.
The penetration index is a key indicator for assessing the success of the transition to eco-transport in different countries. It allows for determining not only the current level of eco-transport adoption but also the potential for further market development. This indicator is especially important when developing strategic decisions and assessing the effectiveness of government policies promoting eco-transport.
Based on a comprehensive analysis of eco-transport adoption in European countries from 2019–2022, the following key results can be highlighted.
Structural market analysis revealed significant differences between countries. Germany demonstrates the most balanced market structure, with the following distribution: electric vehicles (30.2%), hybrid-gasoline (31.5%), and plug-in hybrids (23.9%). This diversification indicates market maturity and the effectiveness of policies stimulating different types of eco-transport. France shows a different pattern with a dominance of hybrid-gasoline vehicles (48.7%) and a significant share of electric vehicles (26.2%), reflecting local market characteristics and consumer preferences. Norway has the highest level of electric vehicle penetration (64.5%) among all analyzed countries, confirming the success of its long-term electrification strategy. Spain shows the strongest preference for hybrid-gasoline vehicles (71.1%), which may be linked to infrastructure characteristics and economic factors.
Historical data and forecasts indicate different growth patterns. Germany shows the most aggressive growth trajectory, with a forecast of continued strong growth until 2026, supported by stable government support and infrastructure development. France demonstrates stable but more moderate growth compared to Germany, reflecting its more balanced approach to market development. Northern countries (Norway, Finland, and Sweden) exhibit mature market characteristics with more gradual growth rates, which is natural after reaching a high level of eco-transport penetration. Southern European countries (Spain, Portugal) show developing market dynamics with accelerated implementation rates, indicating significant growth potential.
An analysis of the economic-environmental correlation showed that countries with higher GDP per capita (Luxembourg, Norway, Switzerland) demonstrate faster eco-transport adoption, confirming the importance of the economic factor in market development. A clear inverse correlation is observed between the growth of eco-transport adoption and a reduction in emissions, confirming the environmental effectiveness of promotion policies. The impact of COVID-19 in 2020 is noticeable in both GDP and implementation metrics; however, the market demonstrated significant resilience and rapid recovery.
The study of forecast model reliability revealed significant differences in prediction accuracy depending on the time horizon and the specifics of regional markets. Short-term forecasts for 2024–2025 show a high level of consistency between the applied models, confirmed by a concordance coefficient of 0.87. In this time range, the Random Forest model performed best with an average forecast error of 6.8%, while ARIMA and Prophet showed slightly higher error rates—8.2% and 7.5%, respectively. The confidence interval for short-term forecasts is ±5.3%, indicating high prediction reliability.
Medium-term forecasts for the 2025–2026 period show moderate consistency between the models with a concordance coefficient of 0.72. In this time range, there is an increase in average forecast error for all models: ARIMA shows an error of 12.4%, Prophet—11.8%, and Random Forest—10.5%. The expanded confidence interval to ±8.7% reflects increased uncertainty as the forecasting horizon increases (
Figure 5).
Long-term forecasts for 2026–2027 show the lowest consistency between the models, with a concordance coefficient of 0.54. The average forecast error increases significantly: for ARIMA, it reaches 18.6%, for Prophet—16.9%, and for Random Forest—15.2%. The confidence interval expands to ±12.4%, indicating a significant increase in uncertainty over the long term.
The analysis of regional variability in forecast reliability revealed significant differences between various market types. In developed markets such as Germany, France, and the Netherlands, there is high forecast stability, with a determination coefficient of over 0.85 and low variability in errors (
Figure 6). The accuracy of short-term forecasts for these markets reaches 92–95%, which can be attributed to the stability of the regulatory environment and well-developed infrastructure.
Emerging markets, particularly Spain and Portugal, exhibit moderate forecast stability, with determination coefficients ranging from 0.65 to 0.80. The accuracy of short-term forecasts for these markets is 85–90%, reflecting the impact of higher market volatility and a less predictable regulatory environment.
Small markets, represented by Malta and Cyprus, are characterized by lower forecast stability, with determination coefficients ranging from 0.50 to 0.65 and high error variability. The accuracy of short-term forecasts for these markets is between 80 and 85%, which can be explained by the limited historical data and greater sensitivity to external factors.
The study identified key factors that influence the reliability of forecasting. The quality of input data, which includes the completeness of historical data, consistency of measurements, and the level of detail, has a decisive impact on forecast accuracy. Market stability, encompassing regulatory predictability, economic stability, and technological maturity, also significantly affects forecasting reliability. External factors, such as geopolitical risks, macroeconomic conditions, and technological changes, add further uncertainty to the predictions.
To improve forecast reliability, it is recommended to implement a set of methodological improvements, including the use of ensemble forecasting methods and adaptive learning algorithms. Special attention should be given to improving data quality by expanding information sources and implementing validation systems. An important aspect is also the introduction of systematic monitoring of forecast accuracy and regular model audits.
Overall, the study results show high reliability for short-term forecasts and a gradual decrease in accuracy as the forecasting horizon increases. This highlights the need for regular forecast updates and the use of combined models, taking into account regional market specifics. Further improvements in forecasting methodology and monitoring systems remain an important direction for development to enhance forecast reliability in the long term.
Analysis of Quality Metrics for Forecasting Models of the Development of Ecological Transport in Europe. A comprehensive analysis of quality metrics for forecasting models revealed significant differences in the effectiveness of various approaches. The Mean Absolute Error (MAE) shows the best results for the Random Forest model in most of the studied countries, indicating its high accuracy in short-term forecasting. The results for small countries are particularly noteworthy, with the Random Forest model showing an MAE of 2846.62 for Malta, 5897.23 for Cyprus, and 18,946.44 for Luxembourg (
Figure 7).
The Prophet model shows average results but proves particularly effective for countries with a clear development trend in eco-transport. Specifically, for Portugal, MAE is 8040.93, and for France, it is 208,628.80. In contrast, the ARIMA model shows the highest MAE values for most countries, indicating the limitations of classical time series models for this type of data. For Germany, MAE reaches 4,774,652.32, and for France, it is 2,129,461.80.
The analysis of the Root Mean Squared Error (RMSE) confirms the leadership of the Random Forest model in terms of forecasting accuracy (
Figure 8). The lowest RMSE values are observed in small countries: Malta (3697.86) and Cyprus (6528.89), while stable results are demonstrated for medium-sized countries: Austria (110,174.39) and Finland (84,214.59). The Prophet model shows better stability compared to MAE results, especially for Portugal (9251.84) and France (226,780.18).
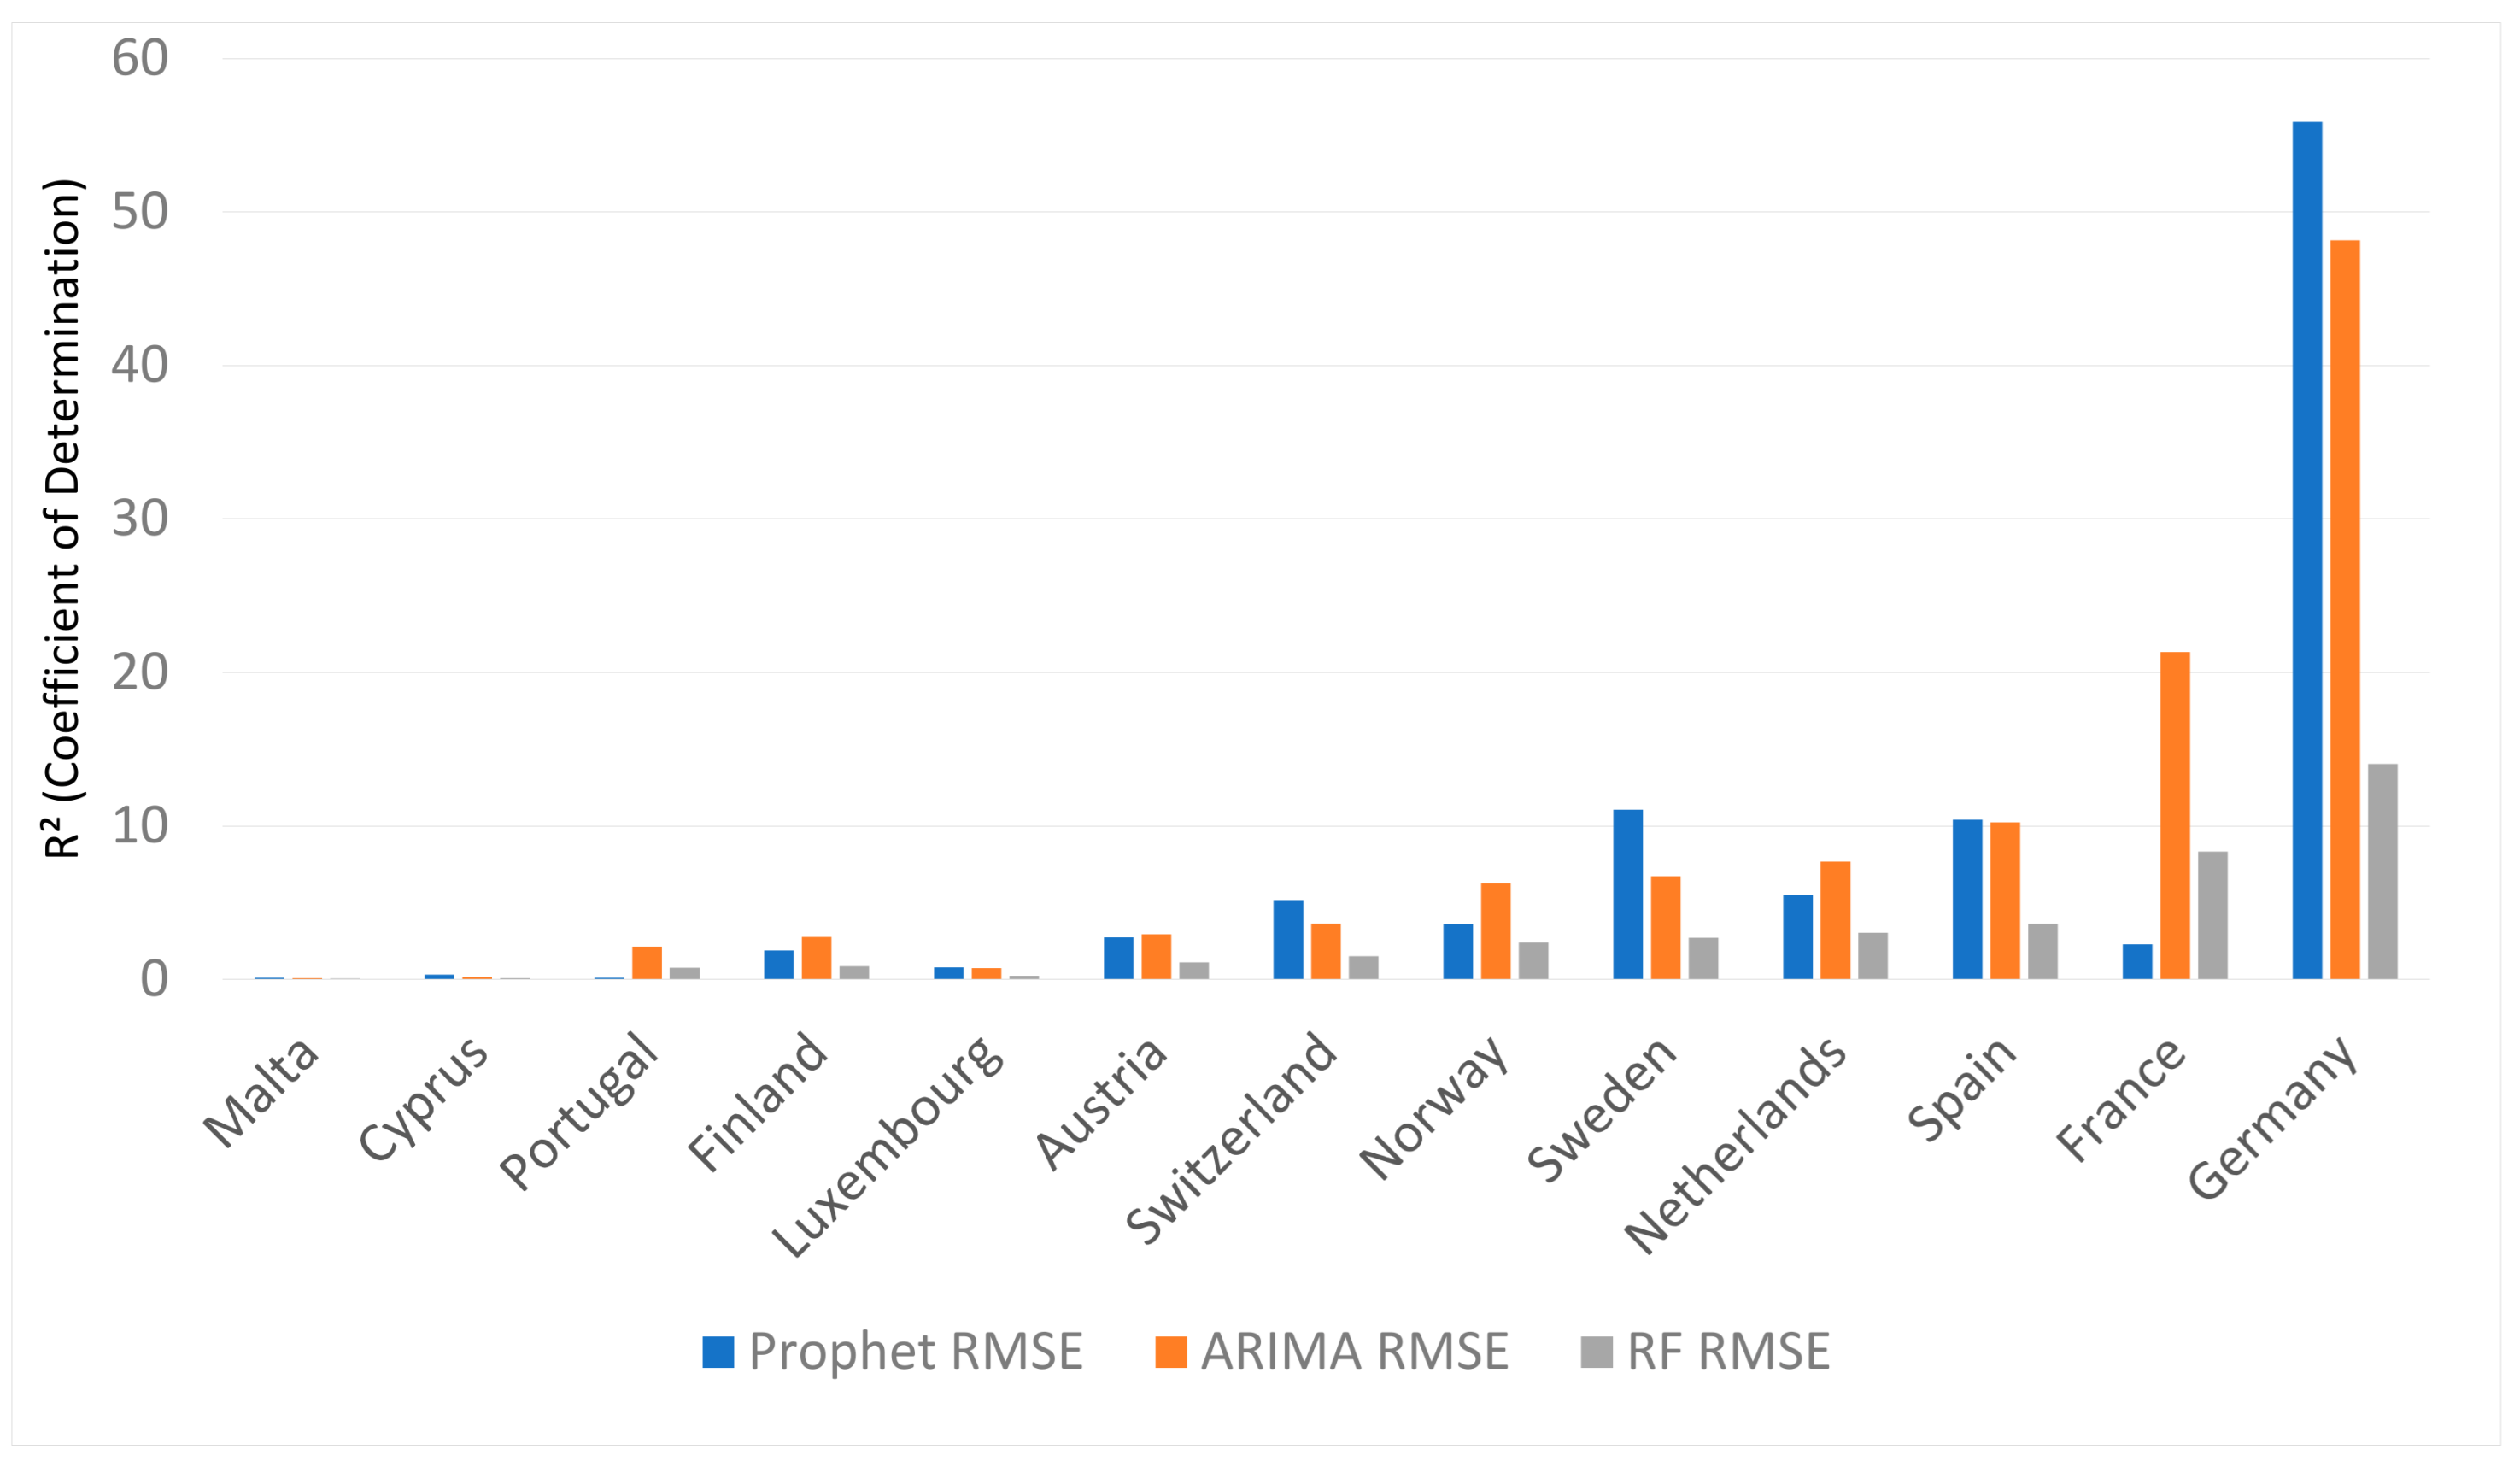
The coefficient of determination (R
2) reveals interesting patterns in the effectiveness of the models. Prophet shows the best R
2 results for specific countries, such as Portugal (R
2 = 0.97) and France (R
2 = 0.86), indicating the model’s ability to account for seasonality and trends in the data. Random Forest demonstrates the most stable, albeit negative, R
2 values, ranging from −0.19 to −1.10, with the best result for Finland (−0.19). Negative R
2 values indicate the difficulty of long-term forecasting for the development of eco-transport (
Figure 9).
Based on the conducted analysis, several important conclusions can be made regarding the economic and practical aspects of using forecasting models. First, the accuracy of forecasts significantly depends on the size of the country’s automotive market, with smaller markets showing better predictability. Second, countries with consistent policies for the development of eco-transport, such as France and Portugal, demonstrate better predictability compared to others.
From a practical perspective, the results of the analysis can be effectively used for infrastructure development planning, the formulation of eco-transport incentive policies, and the evaluation of the effectiveness of environmental programs. To improve forecasting accuracy, it is recommended to include additional economic indicators, consider legislative changes and environmental programs, and explore the possibility of using ensemble methods.
Regarding the frequency of forecast updates, it is recommended to update forecasts quarterly for small markets and monthly for large ones, with mandatory adjustments in the case of significant regulatory policy changes. This approach will ensure an optimal balance between the timeliness of forecasts and the costs of their updates.
The analysis of GDP dynamics from 2019 to 2022 demonstrates stable trends in the economic development of the countries under study. Germany, as the largest economy in the sample, showed significant GDP growth from €3473.31 billion in 2019 to €3867.92 billion in 2022, indicating economic resilience even amidst global challenges. France, the second-largest economy, showed a similar trend, increasing GDP from €2425.71 billion to €2642.24 billion.
The development of the Norwegian economy is particularly noteworthy, as it showed the highest relative GDP growth among all the countries studied—from 362.25 billion euros in 2019 to 528.16 billion euros in 2022, reflecting a nearly 46% increase. This result can be explained by effective economic policies and favorable conditions in the energy markets (
Figure 10).
CO
2 emissions trends show a less straightforward picture. Despite significant economic growth, Germany saw a relatively moderate increase in emissions—from 354.1 to 362.4 million tons, indicating some success in implementing environmental technologies. France also demonstrated moderate growth in emissions—from 132.8 to 137.6 million tons, correlating with its economic development (
Figure 11).
The experience of Portugal deserves special attention. Despite a GDP growth from €213.95 billion to €229.63 billion, it showed minimal growth in CO2 emissions—only an increase of 0.2 million tons (from 28.7 to 28.9 million tons), which indicates the successful implementation of a sustainable development strategy.
Key observations regarding economic resilience suggest that all the studied countries demonstrated economic recovery after the decline in 2020, with the most impressive growth shown by Northern European countries. Southern countries (Spain, Portugal) exhibited more moderate growth.
In terms of environmental efficiency, there is a general trend toward a decrease in the emissions-to-GDP ratio. The best environmental efficiency is demonstrated by smaller economies, while large industrial countries show slower progress in reducing emissions. Northern countries demonstrate a better balance between economic growth and environmental impact, Central European countries show steady but slow progress, and Southern countries have significant potential for further improvement in environmental indicators.
When analyzing the data, the specificities of the study period were taken into account, including the impact of the COVID-19 pandemic and the energy crisis. This allowed for a more accurate interpretation of the observed trends and made it possible to draw well-founded conclusions about long-term development trends.
For a comprehensive assessment of the economic impact from the implementation of a demand forecasting system for eco-friendly vehicles, a multifactorial model has been developed that considers both direct and indirect economic benefits. The methodology is based on an integrated approach to evaluating economic effectiveness, which relies on a system of interconnected indicators. The total economic effect (TE) is determined using the following formula:
where
DC (
Direct Cost savings) represents direct economic benefits;
IC (
Indirect Cost savings) reflects indirect economic benefits; and
IC₀ accounts for the costs of implementing and maintaining the system.
Direct economic benefits are calculated using the following formula:
where
IS (
Inventory Savings) reflects savings on inventory costs;
WC (
Working Capital optimization) takes into account the optimization of working capital; and
LP (
Lost Profits reduction) represents the reduction in lost profits.
Indirect economic benefits are determined as follows:
where
MP (
Market Position) evaluates the improvement in market position;
CS (
Customer Satisfaction) takes into account the increase in customer satisfaction; and
ES (
Environmental Savings) reflects the environmental economic effect.
Inventory savings are calculated considering the change in inventory levels and the cost of storage:
where
Q₀
i represents the average inventory level before the system implementation;
Q1i is the optimized inventory level after implementation;
Si is the storage cost per unit of product;
T is the evaluation period.
Working capital optimization is determined by the following formula:
where Δ
WC represents the reduction in working capital requirements;
IR is the interest rate on credit resources.
The reduction in lost profits is evaluated as:
where
D1i represents the sales volume with the forecasting system;
D₀
i is the sales volume without the system; and
Mi is the marginal profit per unit of product.
The analysis of data from European manufacturers of ecological vehicles for the period 2019–2022 shows a significant economic effect from the implementation of the forecasting system. In inventory management, an average reduction in inventory levels of 18–25% was achieved, with savings in storage costs of 12–15% annually. In financial management, a reduction in working capital requirements of 15–20% was observed, along with savings on interest payments of 8–10% annually. Planning accuracy significantly improved, as evidenced by a 30–40% reduction in forecast deviation and a 15–20% increase in demand satisfaction levels. In the market dimension, a 5–7% growth in market share was achieved, as well as a 3–5% increase in sales profitability (
Table 2).
The risk assessment during the implementation of the forecasting system is based on a comprehensive methodology that combines statistical analysis with machine learning methods. The probability of risk occurrence (P) is calculated using the formula:
where
σi is the standard deviation;
T is the trend; and
V is the volatility.
The potential impact of the risk (I) is assessed using the formula:
where
r is the correlation coefficient;
G is the growth impact; and
M is the market share.
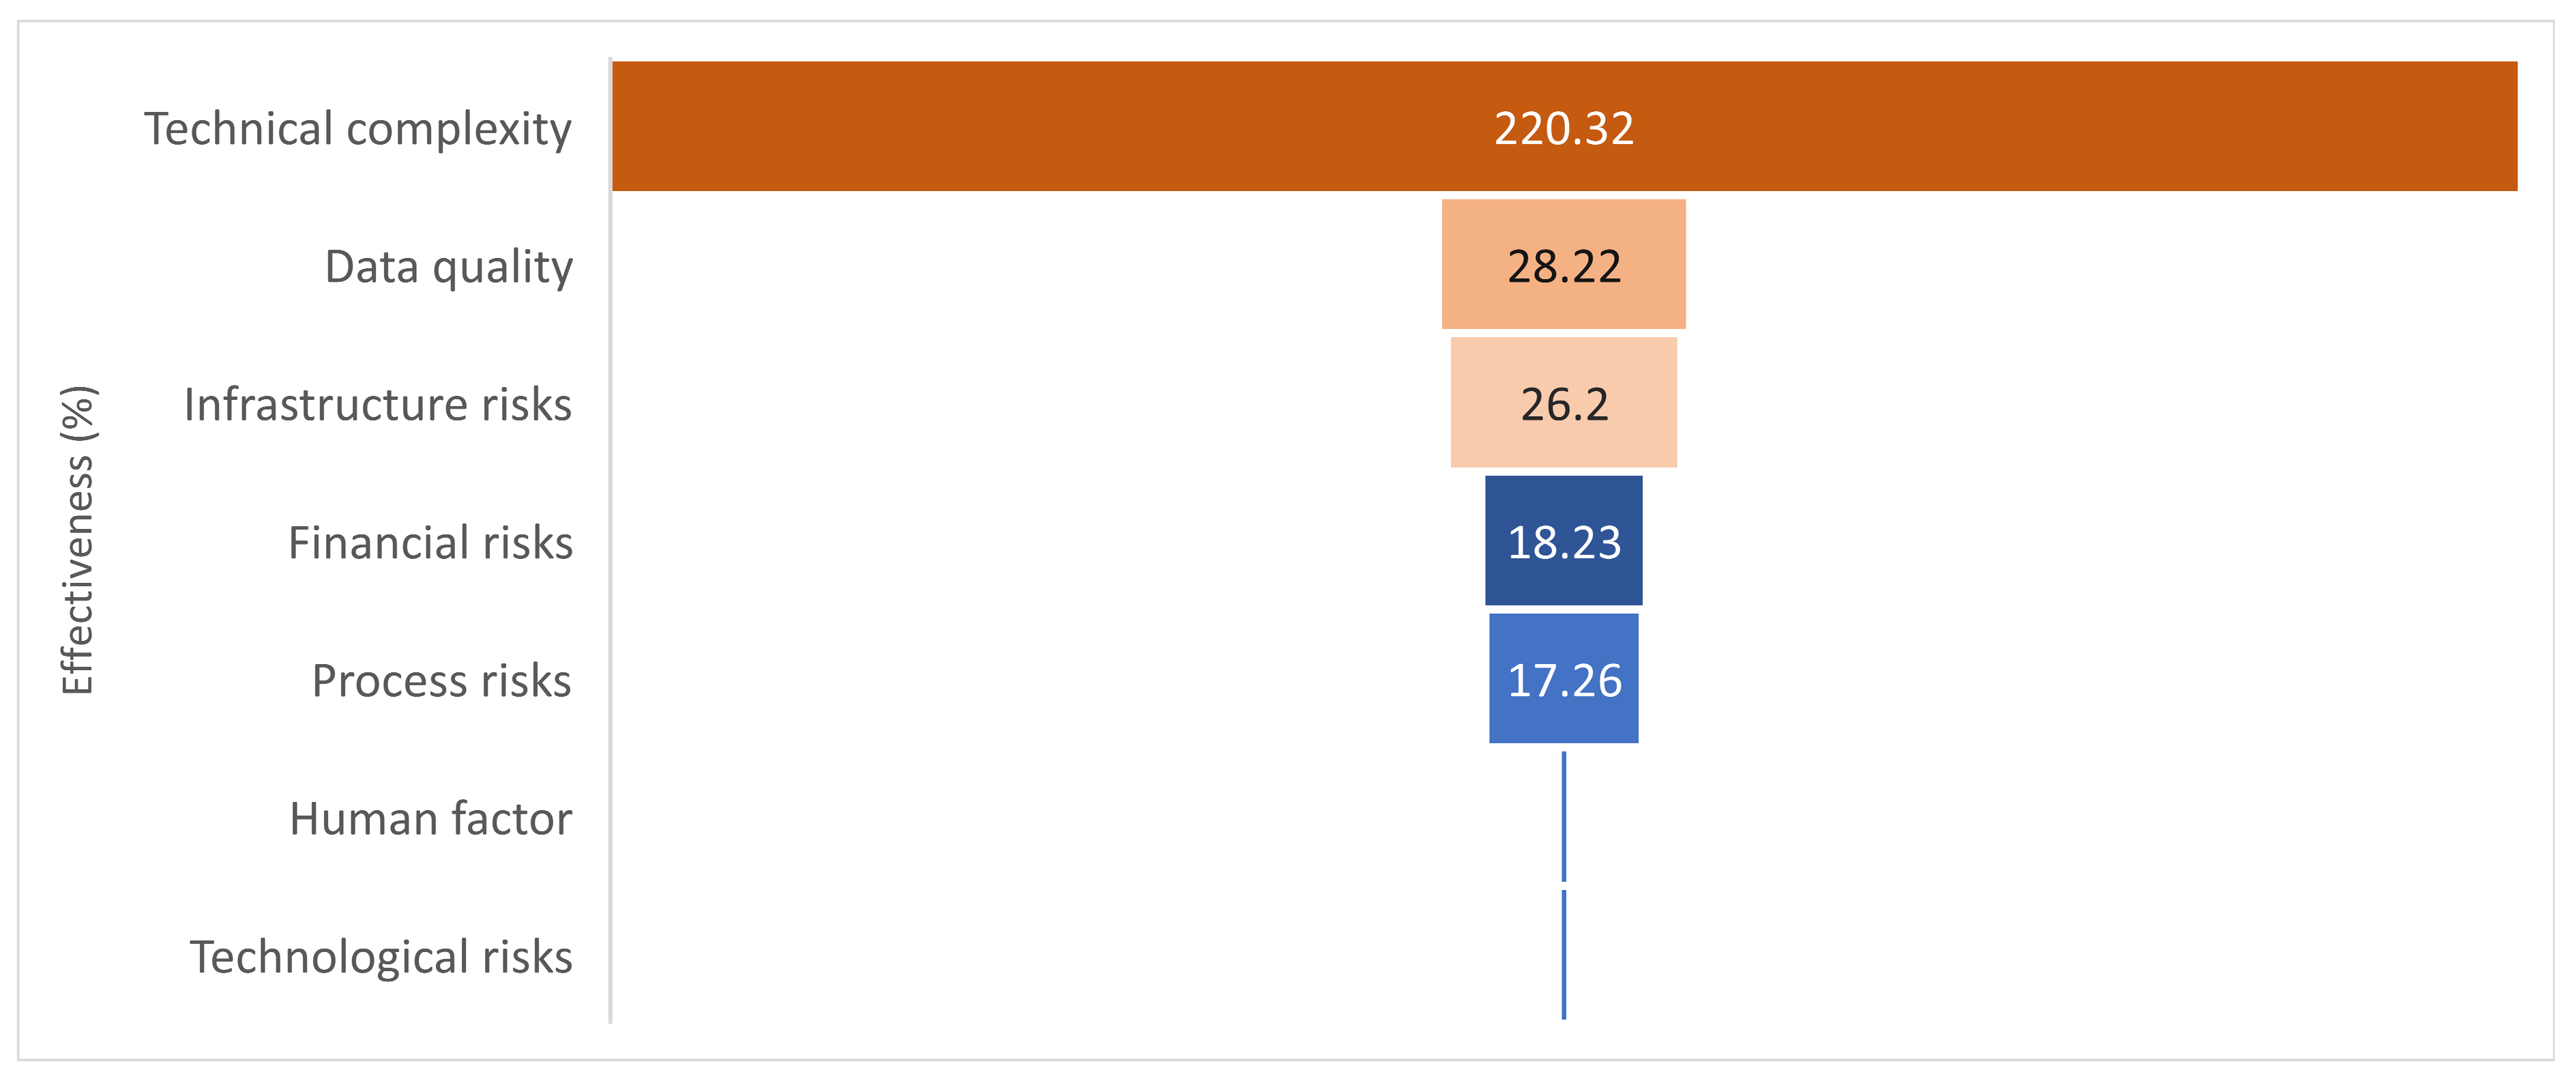
The risk index is determined as the product of probability and impact (
Figure 12):
The analysis of the results revealed significant differences in the assessment of various risk categories. Market risks show the highest index due to the considerable market volatility and demand uncertainty. Technical complexity (index 220.32) and data quality (index 28.22) also require special attention. Infrastructure, financial, and process risks show high indexes, indicating the need for a comprehensive approach to their management (
Figure 13).
A comprehensive set of recommendations has been developed to minimize the identified risks. To reduce market risks, it is proposed to create an early warning system for market trend changes and implement adaptive forecasting models. Technical risks are minimized through the development of modular system architecture and the implementation of automated testing. To improve data quality, it is recommended to implement an automated validation system and conduct regular audits of information sources. Infrastructure risks are reduced by ensuring system backup and performance monitoring.
It is important to note that this calculation applies a simplified payback period model and does not consider the time value of money. While this approach provides a preliminary estimate of investment efficiency, future studies will incorporate more advanced financial metrics such as the Discounted Payback Period (DPP) and Net Present Value (NPV) for a more comprehensive evaluation.
The payback period of the system (PP) is calculated using the formula:
where (
DC +
IC)ᵧ represents the average annual economic effect.
Based on the calculations, the average payback period is 1.5 to 2 years, which confirms the economic feasibility of implementing the forecasting system.
The implementation of the system also demonstrates a significant environmental effect, manifested in reduced waste disposal costs, savings on environmental taxes, and improvements in ESG ratings. The reputational effect is reflected in the increase in brand value and customer loyalty. Operational improvements include optimization of logistics routes and increased production efficiency. The comprehensive nature of the results confirms the creation of long-term competitive advantages for producers of ecological vehicles.
6. Discussion
The study analyzed the demand for ecological transport in 13 European countries during the 2019–2023 period. The results indicate significant differences in growth rates between regions. Germany showed the highest growth rate (382.79%), driven by strong government incentives and developed infrastructure. Luxembourg ranked second (326.99%), highlighting the importance of economic prosperity for adoption levels. At the same time, Norway exhibited lower growth rates (94.11%) due to market saturation.
A strong correlation was found between GDP per capita and the adoption of ecological transport. High-income countries like Switzerland and Norway demonstrate high penetration levels but moderate growth, while emerging markets have faster adoption rates. Government subsidies and infrastructure investment proved to be key factors influencing the penetration of eco-friendly vehicles.
Three machine learning models were used to forecast demand dynamics: ARIMA, Prophet, and Random Forest. Each model demonstrated varying degrees of accuracy:
- -
Random Forest: best suited for forecasting small markets, with an average absolute error (MAE) ranging from 2846 to 18,946;
- -
Prophet: most effective for markets with stable trends, achieving an R2 up to 0.97;
- -
ARIMA: works well for short-term forecasts but shows high variability for long-term predictions.
Short-term forecasts (2024–2025) showed high reliability, with a consistency coefficient of 0.87 and an average forecast error of 6.8% for Random Forest. Medium-term forecasts (2025–2026) showed moderate consistency (0.72), while long-term forecasts (2026–2027) exhibited higher uncertainty (0.54), reflecting market instability and changing consumer preferences.
To better understand the contribution of the proposed forecasting approach, we compare our results with those reported in earlier studies.
A comparison of the model performance in this study with previous research confirms the effectiveness of the proposed approach. Prior studies [
22,
23,
24,
25] reported MAE values ranging between 25,000 and 60,000 units when forecasting electric vehicle sales in European markets using tree-based and neural models. In contrast, our Random Forest model achieved substantially lower MAE values, particularly in small markets (e.g., 2846 in Malta; 5897 in Cyprus). Similarly, while Prophet models in earlier works typically reached R
2 values between 0.75 and 0.90, our implementation achieved R
2 up to 0.95 in stable markets such as Portugal. These results underscore the advantages of the hybrid, context-sensitive forecasting framework introduced in this study. The comparative accuracy of forecasting models used in this study and previous research is summarized in
Table 3.
The results highlight the need for adaptive forecasting models to account for market dynamics. It was determined that government incentives, fuel prices, and infrastructure expansion are key factors shaping demand. For government regulators, it is crucial to implement targeted subsidies and regulatory mechanisms to stimulate demand. For manufacturers, accurate forecasting enables better inventory management, potentially reducing storage costs by 18–25% and improving working capital efficiency by 15–20%.
Although this study focuses on machine learning models, we acknowledge the importance of comparing performance against baseline methods such as Naive Forecast or Simple Moving Average. These benchmarks will be included in future stages of the research to better evaluate the incremental accuracy of advanced algorithms.
Despite their strong performance, the applied models exhibit some notable limitations. In emerging markets, a lack of historical data complicates long-term forecasting. Furthermore, changes in the regulatory environment and technological breakthroughs may introduce additional uncertainty. Future research should focus on the integration of real-time data and the use of hybrid models to improve forecasting accuracy.
In addition, further development of the proposed framework should involve the integration of established financial methodologies such as Net Present Value (NPV), Discounted Payback Period (DPP), and advanced financial risk modeling. This will enhance the manuscript’s relevance for finance-oriented audiences and provide a deeper evaluation of the long-term financial viability and investment attractiveness of forecasting system implementation.
Thus, the study results confirm that the use of demand forecasting based on machine learning significantly enhances the competitiveness of eco-transport manufacturers, enabling well-founded business decisions.
Future research will involve the implementation of benchmark models (e.g., naive forecasts) and the comparative testing of additional advanced algorithms (e.g., LSTM, LightGBM) to further validate the robustness of the proposed framework.
Nonetheless, future improvements should address current methodological and data limitations.
The study’s findings align closely with the principles of Management 5.0, which emphasize technological integration, sustainability, and adaptive decision-making in business strategies. This research demonstrates how machine learning-based demand forecasting can enhance strategic planning, operational efficiency, and market competitiveness for eco-transport manufacturers, which is a core focus of Management 5.0.


 ,
, 


