Abstract
Work–life balance (WLB) is central to sustainable social and economic development, as reflected in the UN Sustainable Development Goals 3, 5, and 8. The purpose of this article is to identify and examine the key organisational and personal factors influencing the perceived work–life balance of employees in rural areas. The theoretical framework is grounded in three complementary approaches: the job demands–resources (JD-R) model, spillover theory, and boundary theory. Together, they offer a comprehensive perspective on role dynamics in the context of limited resources, technostress, and family-related tensions. The study was conducted on a sample of 700 rural employees in Poland, predominantly women (60.6%), with the majority aged 35–55 years (53.0%). Data were collected via a structured questionnaire and analysed using an exploratory approach based on regression trees (CART), which are effective in identifying latent and multidimensional relationships. The findings highlight the mechanisms underlying WLB disruptions in rural contexts and pinpoint areas for intervention through public and organisational policies aimed at supporting employee well-being. The most influential factors were workplace comfort, work flexibility, time autonomy, and employee age. Notably, younger employees require better working conditions than older ones to achieve similar WLB levels. The CART analysis also indicates that some disadvantages, such as low workplace comfort, can be mitigated by more flexible work schedules. Employers should therefore provide multidimensional support through complementary measures, monitor job demands, and educate employees on the effective use of available resources.
1. Introduction
Contemporary society faces the growing challenge of balancing the demands of professional and private life. WLB is no longer solely a matter of individual well-being; it is increasingly recognised as a critical factor for sustainable social and organisational development. This issue is directly aligned with the United Nations Sustainable Development Goals (SDGs), particularly SDG 3 (Good Health and Well-being), SDG 5 (Gender Equality), and SDG 8 (Decent Work and Economic Growth).
The situation of employees from rural areas who often hold typical urban jobs and commute or work remotely is a growing concern in Poland and some EU countries [1,2]. These workers operate at the interface of dissimilar lifestyles and organisational patterns; on the one hand, they are influenced by strong social and family ties, and on the other hand, they are under pressure from intense work and employer expectations [3]. The reconciliation of job and private roles may be particularly complex in this group, which is not sufficiently discussed in the literature. The most commonly investigated topics in the context of the rural labour market are entrepreneurial women and young adults seeking employment after completing formal education [3,4,5]. The boundaries between professional and personal life become increasingly blurred in the era of remote work, mobile technologies, and flexible schedules [6,7,8]. This can aggravate the work–family conflict and hurt the quality of life among young workers [9], teachers [10], and health care workers [11].
Despite the growing prominence of WLB, the complex and multidimensional constraints of the balance have yet to be scientifically identified, notably among such peripheral social groups as rural residents. WLB is primarily investigated in quantitative terms in the context of work–home conflict, while interest in work–life domains is minimal [12]. As a result, studies on the boundaries and segmentation of work and home life overwhelm research that emphasises the importance of employees having time not only for their careers but also for family, friends, community, and entertainment.
Research on WLB to date is founded mostly on regression models. They assume a linear association between variables and independence of outcomes, which hinders their ability to reflect the complexity of relationships found in real-life social and work situations. These approaches are not sensitive enough to capture inter-variable interactions and fail to consider boundary conditions or threshold effects, which can significantly affect WLB. Medina-Garrido et al. [13], for example, evaluated the associations between access to flexible work arrangements, well-being, and performance of bank employees in Spain using a structural equation model (PLS-SEM). However, the model assumes a global uniformity of effects (no differentiation between sexes or age groups, for instance). On the other hand, Espinal Maya et al. [14] employed a logistic regression model to investigate the correlations between the autonomy of employees in Colombia and selected variables, like the size of the enterprise, income, tenure, place of work, or job satisfaction. Although they identified certain correlations, the mechanisms of complex interdependencies remained unclear.
The present study consciously adopts an exploratory approach based on regression trees (CART), which can identify non-linear relationships, interactions among predictors, and combinations of pivotal predictors that affect perceived WLB. This way, we could uncover latent patterns and variable significance hierarchies in a manner beyond the reach of traditional methods. This design enabled us to better adapt the analyses to the social and work constraints, where decisions are made in the context of multiple simultaneous factors rather than laboratory-grade conditions. Apparently, CART is also more transparent and useful for forming practical recommendations for employees or policymakers, for example, because the model’s effects can be easily translated into tangible decision-making scenarios.
The purpose of the study is to identify and investigate the primary organisational, job, and personal factors that influence perceived WLB among employees living in rural Poland. The study also attempted to identify employers’ and employees’ resources and practices that contribute the most to the improved well-being of individuals engaged in family and social life. The following research questions are posed:
- Does organisational flexibility (e.g., remote work, flexible work schedules, and attending to private matters while on the clock) improve perceived WLB?
- Does the quality of the workplace environment quality affect perceived WLB?
- Do family-related benefits (such as caregiving leave, leave at demand, and paternity leave) improve perceived WLB?
- Do the perceptions and effects of organisational WLB resources differ depending on individual employee characteristics, such as age or the ways they spend spare time?
- Can a lower level of one type of resource (such as workplace comfort) be offset by other forms of support (such as flexible working hours or time off), helping to maintain a positive work–life balance (WLB)?
The article’s literature review and theoretical background are followed by the methodology and analysis of the results. Their practical impact is considered through the concept of the boundary theory, spillover theory, and the job demands–resources model.
2. Literature Review and Theoretical Background—Organisational, Job and Personal Factors in Rural WLB
The concept of WLB has emerged as a critical component of an individual’s well-being and sustainable social and organisational development in recent decades [15]. The increasing focus on the topic is driven by dynamic changes in the labour market, heightened requirements towards employees, and changing work circumstances, including the popularity of remote work and flexible working arrangements [16]. The literature on the subject emphasises that effective job and life role reconciliation improves quality of life, organisational performance, and social stability [13].
This section focuses on the theoretical framework that can model the complexity and dynamics of role relationships, particularly in the context of rural populations, which face additional challenges from environmental and structural constraints. It discusses three approaches central to the study: the job demands–resources model (JD-R), the spillover theory, and the boundary theory, indicating the primary determinants of WLB.
2.1. Work–Life Balance: Definition and Its Importance in Rural Employment
WLB concerns how effectively an individual can manage concurrent requirements of work and private life [17]. It is a dynamic process driven by multiple individual and context-dependent factors rather than a permanent state. The literature emphasises that balanced roles promote mental well-being, health, productivity, and life satisfaction [18].
In rural populations, environmental, infrastructural and cultural constraints complicate role relationships; accordingly, the review examines three approaches central to the study: the job demands–resources model (JD-R), spillover theory and boundary theory and outlines the primary determinants of WLB relevant to rural settings [15,19].
Comparative evidence across countries and sectors shows that WLB outcomes vary with institutional context and sectoral conditions. For example, expanded work-from-home opportunities have reshaped residential choices and commuting patterns in Poland, altering time budgets relevant to WLB [1]. Country-specific policy frameworks and investment regimes also shape labour market quality and local opportunities, which in turn condition WLB [2]. Sectorally, education and community health frequently combine irregular schedules and high emotional demands [10,11], whereas knowledge-intensive digital work offers more temporal/spatial flexibility but risks greater boundary blurring and technostress [7,8,9]. Rural entrepreneurship ecosystems further mediate resources and constraints, particularly for women [4,5].
2.2. Theoretical Perspectives Guiding the Analysis of Organisational, Job and Personal Determinants
Proven theoretical concepts are needed to comprehend the mechanisms affecting WLB. The literature values three approaches: the job demands–resources model (JD-R), the spillover theory, and the boundary theory. Each contributes a different perspective explaining how individuals experience and manage multiple life roles, especially in rural environments, where organisational, infrastructural, and cultural constraints significantly impact the opportunities to find compatibility between job and life obligations.
2.2.1. JD-R Model: Demands, Resources and Rural Constraints
According to the JD-R model [20,21], two sets of factors jointly shape WLB. Demands include workload or commuting. Resources include autonomy, flexible schedules, and a supportive culture. Within the JD-R framework, sustained demand–resource imbalance is associated with strain and exhaustion that undermine WLB; digitalisation-related demands can amplify these risks [9]. Conversely, personal resources such as self-regulation and boundary control help employees convert flexibility into better balance [15], while technostress can erode those controls [6].
In the context of WLB, excessive job demands reduce the time and energy available for private life [22]. By contrast, resources such as flexible working hours or an inviting organisational culture foster more effective role reconciliation. Long commute times due to large distances can be a weighty factor for rural employees, aggravating time-related stress. Longer commute leads to less physical activity, which is detrimental to health [23]. Many researchers argue that work–life imbalance is detrimental to mental health, productivity, and employee engagement [17,24]. Despite these risks, rural industries often lack policies to support WLB. Analyses to date tend to focus on urban environments, which offer better access to flexible working arrangements and support schemes [15]. Rural employees face specific structural and cultural barriers that hinder and prevent WLB [25,26]. Mirza and Ojha [26] emphasised that WLB in rural industries is affected by the hours schedule, stress, job satisfaction, workplace support, etc. Results of an in-depth Flemish-Belgian study demonstrate that more farmers experienced WLB issues compared to business owners (43.4% and 30.4%, respectively) [27]. Long hours, unavailability of social services, job-related stress, and limited professional development opportunities hold rural careers back [27]. Work environment dissatisfaction (due to commuting issues caused by low mobility opportunities, for example) may contribute to perceived stress and make individuals more prone to negative emotions like anxiety or depression [28].
2.2.2. Spillover Theory: Cross-Domain Dynamics in Rural Households and Workplaces
The spillover theory explains how experiences from one domain may affect other areas positively or negatively [29]. Stress at work can, for example, permeate into private life and upset family relationships, while job satisfaction can contribute to personal fulfilment [13]. Increased resources, such as decision autonomy, support from colleagues and superiors, and strong family relationships, promote favourable spillover (less negative and more positive spillover). Barriers, like job pressure or marital issues, stimulate negative spillover and dampen positive permeation [29].
Authors have found that negative spillover is more common among women, particularly when they combine work, childcare, and household management [30,31]. It may be particularly weighty in the case of rural populations, considering traditional gender roles and a shortage of institutional support [4]. Research on rural female doctors indicates that flexible working hours, spousal and community support, and well-established work–life boundaries help promote better balance [31]. The critical factors for rural workers, especially women, are soft infrastructure (child/senior care) and competence-building schemes [4,27]. In Poland, rural women come across objective barriers (such as no child/senior care, limited Internet access, no job offers) and subjective barriers (family obligations, low self-esteem, discrimination, etc.) to business activity [4].
Farming families are often the go-to mental support for their members [27]. However, seeking help outside the family circle is often stigmatised, especially when it concerns mental health. It is labelled as ‘minimal help-seeking behaviour’ [27]. Work–family policies do not affect performance directly, but indirectly through the employee’s well-being [13,32]. The effectiveness of work–family policies depends on their accessibility, rather than mere presence [13,32]. Interventions that improve rural professionals’ well-being, such as mindfulness practices or peer support, can be effective but require flexibility and adaptation to rural circumstances, including online delivery [33]. High emotional demands in education and community health can intensify strain and negative spillover to the home domain; conversely, effective coping and boundary control may buffer these effects [10,15].
2.2.3. Boundary Theory: Role Transitions and Control in Rural Settings
The boundary theory concerns transitions between life roles [34]. Kossek et al. [35] and Gardner [36] further developed the concept, identifying three main characteristics of boundary management styles: cross-role interruption behaviours (work interrupting personal life and vice versa), identity centrality (work and family centrality), and perceived control of boundaries [35,36]. The perceived control of boundaries is particularly relevant to positive WLB outcomes, even more so than role segmentation or integration [35]. People may prefer segmentation, which involves a clear-cut boundary between work and private life, or integration of the two domains. Boundary management styles are highly relevant to perceived WLB. Representatives of the boundary theory [34,37,38,39] emphasise that today, society is facing a dynamic and unending process whereby individuals create, maintain, negotiate, and cross boundaries between work and family every day.
Rural employees, especially those working from home (in hybrid or remote arrangements, for example), may find it challenging to establish well-defined boundaries, which increases the risk of role conflict [35]. Phillips [31] also highlights that for rural female doctors in the USA, setting firm work boundaries, supported by flexible schedules and strong relationships, plays a vital role in achieving balance. Additionally, limited housing opportunities or the lack of infrastructure to facilitate remote work can worsen the imbalance [40].
Taken together, the literature suggests that WLB reflects an interplay between institutional context (country-level entitlements and norms), sectoral working conditions (emotional demands, schedule regularity, scope for flexibility) and individual resources (e.g., resilience). Positioning burnout, emotional demands and resilience within the JD-R, spillover and boundary lenses helps explain why the same policy instrument such as flexible scheduling can either protect or undermine balance depending on how boundaries are managed and how resources offset demands
2.3. Determinants of WLB in Rural Contexts
The literature groups determinants into three categories: personal and family, job and organisational, and lifestyle, capturing universal influences on WLB alongside those specific to rural settings.
Whether a person can maintain WLB depends on a multitude of personal, social, work, and cultural factors, which often overlap. According to the literature, WLB does not result only from organisational policies. Instead, it emerges from interactions between the person’s traits, lifestyle, family relationships, work circumstances, and social milieu [41]. These interrelations gain special significance in rural areas because of the specific life and work constraints and limited access to institutional support. The remainder of this subsection discusses the critical groups of factors that affect perceived balance between job and private roles.
2.3.1. Personal and Family Factors Shaping Perceived WLB
The literature points out age, sex, marital status, number of children, and personality as important factors [42,43]. Women, particularly those in the countryside, more often combine work and household management, which may hinder their WLB [3,5]. Age is also important; younger employees can be more flexible, while older ones often have more responsibilities at home [12]. The number of children, the age of other family members, and the level of support at home all directly affect WLB. However, these factors may add to the burden and provide support in rural milieus, where multigenerational families are not uncommon [44].
2.3.2. Job and Organisational Factors: Flexibility, Workplace Quality and Family Benefits
The type of work, intensity of responsibilities, shift work, timetable flexibility, or remote opportunities all affect role reconciliation [45,46,47]. Remote work and home office lead to unending transitions and role boundary blurring [34]. Long commute and limited remote work opportunities are particularly relevant to the rural setting [1]. Research suggests that long commute is detrimental to subjective well-being because people tend to underestimate the emotional side effects (such as commuting stress affecting both work and family lives) and resource limitations (such as less time for workout, sleep, and other daily activities) caused by everyday commute [48,49]. Still, another longitudinal study did not identify a coherent relationship between commuting and satisfaction. People can readily accept a longer commute if it is rewarded with better job or housing opportunities, which leads to similar levels of well-being compared to those with shorter distances to work [39]. What is more, there is evidence to suggest that the commuting method has an independent influence on perceived quality of life outside of work, and switching to biking or walking is notably linked to improved mental health and life satisfaction [50].
WLB policies, such as remote work, flexible hours schedules, and support from superiors, are critical [32]. Still, rural employees, who often work in microenterprises or the public sector, may have limited access to such practices [51]. Being a process, boundaries require symbolic actions [38] from rural employees to maintain role boundaries. A study by Nippert-Eng [52] suggests that certain everyday items, such as an ID badge, uniform, or laptop, serve as symbolic boundaries between the work and private domains. When they are in use, the person is ‘at work’; when they are taken off or put away, the employee turns into a private individual. In rural settings, where work often happens in the same place as family life and organisational structures are less formal, such boundaries can be harder to see or even absent, hindering mental role segmentation.
2.3.3. Lifestyle, Restoration and Compensatory Mechanisms
Changes in today’s lifestyle patterns affect perceived WLB. The Polish countryside absorbs urban trends, also brought by urban migrants seeking peace and a slower life (fresh air, better sleep, more natural landscape, access to nature). Nevertheless, rural residents spend more time on chores (home and farm). Even though they can count on the grandparents’ assistance with (grand)children, they do not change their pastime styles. When it comes to spare time activities in the place of living, there are—and will be—significant differences between rural and urban settings. They emerge from the neighbourly community inherent to rural areas. Rural residents cut down on hobby (and self-care) time, assuming they relax when working outside. The urban and rural relaxation styles differ. The rural culture, which combined farming and employment, compelled people to work on the farm after returning home from their jobs. As reported by the CPOR, ‘rural residents restored their energy by working in the field or around the house. They had no time for education because it was inappropriate not to go to the field’ [53]. The rural environment abounds in activities that are considered necessary and compulsory. However, rural residents still manage their time and make independent decisions regarding work and rest. They do not believe working all day is a problem, especially as there is a specific, compulsory sequence and timing to farm work. Still, the countryside is affected by the progress of urbanisation. Continuing settlement structure changes (new houses in the cheapest locations) bring patterns for spending spare time relaxing or pursuing a hobby (sports, handicraft, farm wives associations, etc.). Young generations of graduates leave the countryside for the city. And then again, they move from cities to live and work in rural areas. According to a CPOR survey from October 2024, nearly half of Poles (43%) would like to live in the countryside, and over 75% of the current rural population do not intend to move to urban areas. The barriers between urban and rural milieus are fading. Every fifth rural resident comes from a city [54].
3. Materials and Methods
3.1. Data Collection
The first stage involved reviewing the literature to develop the primary research problem and establish the theoretical framework. The review focused on WLB models, including the JD-R (job demands and resources) model, the spillover theory, and the boundary theory. Sources included academic publications and diverse reports (including by the OECD), which put the problem in a wider social and political context.
The primary data were collected using a standardised survey questionnaire, which was shared online (CAWI in 60%) and conducted by phone (CATI in 40%). The survey was carried out between 29 October and 28 November 2024 by a professional survey research centre in line with the applicable methodological standards. The random sampling was proportionate to the sizes of the working rural population in NUTS 1 units (voivodeships), thereby supporting national-level inference for rural employees with the reported margins of error. The sample consisted of 700 people (confidence level 95% and margin of error ±3.5 pp., by subsample: CATI, N = 280: 5.8 pp.; CAWI, N = 420: 4.8 pp.).
Rural communities are less aware of the available WLB support mechanisms [55]. Compared to urban populations, where organisational cultures tend to take into account employee needs regarding role reconciliation, those in the countryside come across WLB support less often [56]. People working in rural areas (regardless of whether they live in urban or rural locations) carry a special significance to society, and yet have not been sufficiently investigated. Therefore, their experiences of pursuing WLB demand an in-depth analysis.
The questionnaire consisted of over 40 closed-ended, ordinal, and partially open-ended questions. Its scope and structure were informed by the theoretical framework: the JD-R model guided the operationalisation of job demands and organisational resources; the spillover theory inspired questions on the transfer of experiences between work and private life; and the boundary theory shaped items on strategies for separating or integrating roles. It covered demographic and job information, followed by detailed questions on the organisation of work, household chores, care for children and dependants, spare time activities, and accessibility and subjective evaluation of WLB support mechanisms at work. Most of the questions employed a five-point Likert scale to identify respondents’ attitudes and opinions. Other scales were used as appropriate: quantitative, ordinal, and nominal.
Before taking the survey, every participant was informed about its purpose and anonymity policy. Survey participation was voluntary, and respondents could withdraw at any time. No personal data were collected, such as e-mail addresses or identifiers. The research project conformed to ethics standards and was approved by the Ethics Committee for Human Research of the University of Agriculture in Kraków. As per the committee’s policy, the collected data were used for research purposes only, and the respondents’ decisions to participate were not influenced in any way.
3.2. Methods
The results were analysed with several research methods for structural analysis of the answers, identification of latent relationships between variables, and evaluation of the strength and type of the relationships.
The first stage involved descriptive statistics: the arithmetic mean, standard deviation, and answer distribution, to characterise the generalised respondent profile and distribution of the characteristics of the variables. The questionnaire was validated using Cronbach’s α for assessing the internal consistency of scales [57]. Its high values supported the reliability of the multi-item measures.
The concept of WLB is multidimensional and involves several intertwined domains of human activity. The thematic question groups concerned diverse aspects of WLB and were logically arranged to appreciate the multiplexity adequately. Exploratory factor analysis (EFA) was used to identify latent patterns of relationships between variables and reduce their number to more general, explicable dimensions. Data suitability for factor analysis was preliminarily evaluated with the Kaiser–Meyer–Olkin test (KMO). Its result (KMO = 0.925) indicated excellent sampling adequacy and data suitability for EFA. The number of factors was determined with the Cattell scree test. They were rotated with varimax rotation to obtain a clear-cut and interpretable structure of variables [58].
Regression trees (CART) were employed to analyse the relationships between sociodemographic features and WLB attitudes carefully. Being non-parametric and exploratory, the method can detect complex relationships between predictors and the target variable without needing to conform to data distribution criteria [59,60]. Regression tree models can interpret if-then relationships and build logical rules for classifying respondents based on their WLB attitudes. Classification and regression trees are characterised in detail in such publications as [61,62]. Given their exploratory nature, CART models do not establish causality; we interpret splits and paths as associations rather than causal effects.
Another outcome of using CART was the calculation of predictor-importance scores, which reflects the weight of individual variables in explaining the variability of the target variable. The indicator is based on measurements of model improvement after each node [63,64]. This way, we identified variables with the most significant impact on the investigated attitudes and behaviours.
The computations were conducted in STATISTICA 13.0 (StatSoft, Tulsa, OK, USA). Microsoft Excel (Microsoft Corporation, Redmond, WA, USA) was used for preliminary data processing and descriptive statistics. Figures were prepared using STATISTICA 13.0 and Microsoft Excel, while the manuscript text and tables were compiled in Microsoft Word (Microsoft Corporation, Redmond, WA, USA).
3.3. Conceptual Model and Variable Operationalisation
The conceptual model in Figure 1 assumes that WLB assessment is shaped by multiplex interactions between individual respondent characteristics and their job functioning conditions. The starting point for the analysis is the personal and family situations of the individual as a context for the ensuing assessment of the impacts from job demands and job resources in the work environment. The model is founded on three theoretical pillars: the JD-R model, spillover theory, and boundary theory. They identify mechanisms with which job conditions (overtime, work arrangements, or benefits) affect the private domain, both directly and indirectly, depending on the person’s boundary management.
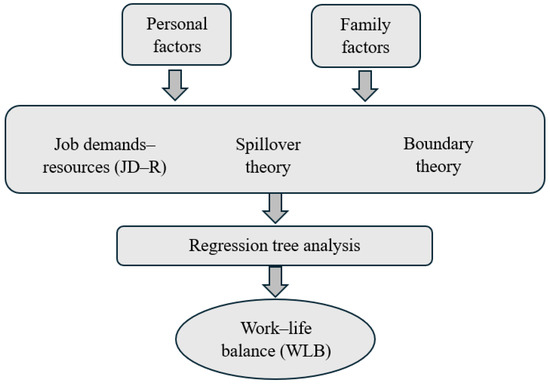
Figure 1.
Conceptual research model; source: original work.
All the relationships were analysed with regression trees that identify critical pathways to low or high WLB. The target variable was the subjective assessment of WLB measured with a five-point Likert scale from ‘very poor’ to ‘very good’ WLB. This indicator was the starting point for further analyses as a synthetic measure of WLB. The variable is discussed in detail in the next section.
The conceptual model explains WLB with four groups of independent variables: (1) personal and family characteristics, (2) lifestyle and restorative activities (spillover), (3) job demands linked to workplace organisation (JD-R, demands), and (4) availability of organisational resources that support role reconciliation (JD-R, resources, boundary theory).
The first variable category comprises sociodemographic and family characteristics treated as control variables and contextual variables (Table 1). The analysis took into account age, sex, education, type of work, number of children (including those below three years), etc. These data can reflect the diversity of respondents’ circumstances and identify potential factors that differentiate the level of perceived balance.

Table 1.
Variables reflecting personal and family characteristics.
The next component of the model is the spillover theory, which proposes that experiences from one domain of life (e.g., a job) can be transferred to another (e.g., private life). The impact can be both positive and negative. For example, fatigue or job stress can interfere with family duties, while job satisfaction can reinforce mental well-being. This phenomenon is examined through such variables as hours of chores per week, hours of childcare per week, hours of personal development per week, hours of sleep per day, and hours of hobby and recreation per week (Table 2).
Table 2.
Variables reflecting work–family spillover.
The third group consisted of variables related to job demands that the JD-R model defines as burdens for the everyday functioning of individuals (Table 3). The study covers such factors as overtime, commuting duration and frequency, business travel, and employment status. These factors are linked to time pressure and can hinder role management, especially if organisational support is poor. The data indicate a significant variability in job conditions (high values of standard deviation), which may diversify the respondents’ WLB experience.
Table 3.
Job demand variables, according to the JD-R model.
The fourth category of variables concerns organisational resources that support WLB (Table 4). It contains both formal instruments (flexible hours schedules, remote work, bonus annual leave, etc.) and an informal work environment (a relaxation area, mental health support, etc.). The JD-R model defines these variables as a buffer for job demands that can contribute to better employee well-being. Some of them align with the boundary theory as tools for integrating or segmenting domains. The averages of most variables did not exceed 2.5 on a five-point scale, suggesting that WLB tools were not readily available to the respondents. The set of variables concerning job resources (), based on the JD-R model and the theory of boundaries, covered multiple items linked to organisational flexibility and support provided by the employer. As many of the variables involve interconnected areas and can be highly interdependent, it was reasonable to employ exploratory factor analysis (EFA) to identify latent structures of organisational WLB resources.
Table 4.
Variables reflecting job resources and organisational flexibility.
The analysis covered nineteen metrics of the availability and frequency of use of various types of flexible hours schedules (Table 5). The high value of the measure of sample suitability for factor analysis (KMO = 0.925) confirmed that the direction was appropriate. The varimax rotation yielded cohesive and interpretable factor dimensions. Using eigenvalues and the Cattell scree test, we identified four factors that in total explain 64.7% of the overall variance. The high value of Cronbach’s α for the entire set of items (α = 0.922) reflects the very good internal consistency of the scale. Furthermore, α tests for individual items demonstrated that none of them reduces the overall tool reliability, which supports their further use in the analysis.
Table 5.
Factor loadings and Cronbach’s alpha for items measuring perceived organisational WLB resources (n = 700).
To sharpen construct meaning and keep a one-to-one link with the measured items, the factor labels are used with the following precision. F1 (employee health and wellness benefits) is interpreted as employer-provided health and well-being infrastructure rather than individual behaviours. In measurement this construct is indicated by items such as healthy lifestyle programmes (0.725), mental health support (0.707), sports and recreation benefits (0.760), workplace gym or sports activities (0.700), relaxation area (0.611), meal allowance (0.603), and additional medical insurance/package (0.614), which together represent an organisational commitment to physical and mental health.
F2 (work flexibility and time autonomy) denotes formal options offered by the employer to vary the timing, location and sequencing of work without penalty. In this instrument, autonomy is captured primarily as time autonomy embedded in F2 and refers to decision latitude over one’s schedule and pace, not broad task discretion. This construct is indicated by flexible hours schedule (0.693), remote work (0.681), permission to take care of private matters while on the clock (0.707), and permission to bring children to work (0.691), which together operationalise schedule/place flexibility and near-term boundary control.
F3 (family and caregiving leave entitlements) is treated as codified, formal rights that support family roles. The construct is indicated by time off for dependants (0.757), leave at demand (0.726), exhaustive use of parental leave (0.798), paternity leave (0.730), and force majeure or urgent family matters leave (0.729). These items capture access to protected time away from work to meet caregiving obligations.
F4 (comfort and adaptable working conditions) is interpreted as the fit of the physical and organisational work environment to individual needs that enables undisturbed work and recovery at work. In measurement this includes a quiet room (0.706), adaptability of work schedules to private obligations (0.611), and adaptability of annual leave schedules to personal preferences (0.753). The construct reflects environmental ergonomics and the alignment of temporal arrangements with private commitments, rather than generic job satisfaction.
To avoid conceptual redundancy in interpretation, the JD-R model is used to classify demands (Table 3) and resources (F1–F4) and to motivate buffering and motivational effects. Spillover theory is used to interpret cross-domain transmission and the lifestyle/restoration indicators from Table 2. Boundary theory is used when discussing boundary control and role-management styles in the context of flexibility and time autonomy captured by F2. This division of labour among theories is maintained in the Results and Discussion sections.
4. Results
4.1. WLB Factor Groups Analysed in the Study
The first investigated category is basic respondent characteristics (Figure 2 and Figure 3). As background, the distributions of respondents by age and sex are presented. Although these were not primary predictors in the CART model, the variables set the context for the WLB study. The sample was predominantly composed of women (60.6%), with the largest age group falling within the 35–55 years range (53.0%).
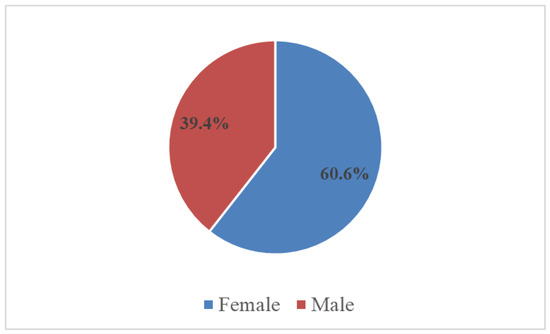
Figure 2.
Distribution of respondents by sex (n = 700); source: original work.
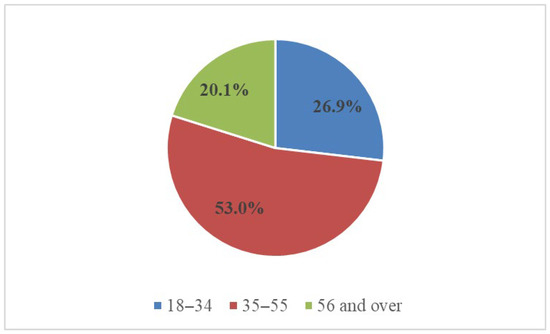
Figure 3.
Distribution of respondents by age group (n = 700); source: original work.
The second group of variables consists of lifestyle components, specifically, spare time management and balancing household and personal duties. According to the spillover theory, these resources can act as a buffer, reducing work stress and supporting a subjective sense of WLB. The respondents reported an average of 6.9 h of sleep per day and 9 h per week on recreation, which may indicate a moderate level of everyday restoration (Figure 4). Personal development amounted to 4.9 h a week, while household chores and caregiving exceeded 23 h a week.
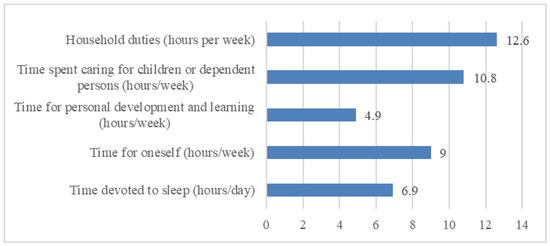
Figure 4.
Average time allocation to selected weekly and daily activities (n = 700); source: original work.
The data suggest that although some respondents have time to restore their energy, a significant burden from household chores can limit the effective use of personal resources, which is potentially detrimental to maintaining WLB.
The third group of variables concerned job demands, which put pressure on the everyday functioning at work. We covered such indicators as the number of overtime hours, frequency and duration of commute, employment status, and business travel. The high variability in the data is indicative of diversified levels of work pressures in the sample. Employment status is the basic characteristic of the job environment. The sample was predominantly composed of full-time employees (90%), followed by part-time workers (8%). Only 2% of the respondents reported other arrangements (Figure 5). This employment status structure can affect the availability of time resources and the degree of flexibility when managing job and private roles.
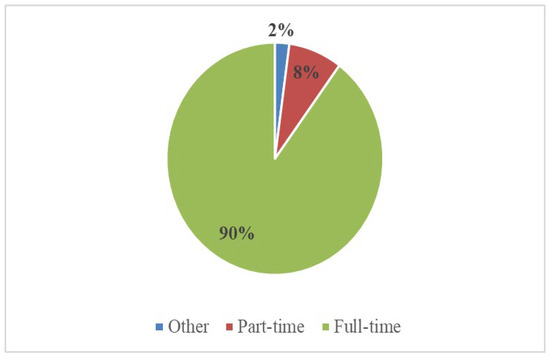
Figure 5.
Distribution of respondents by employment status (n = 700); source: original work.
Despite the significant share of full-time employees, over 70% of the respondents reported no overtime (Figure 6), which may indicate moderate time pressure or effective task management. About 15.9% of the sample receive satisfactory overtime remuneration, while 13.8% are not compensated sufficiently or at all, which may indicate an underdeveloped system of overtime compensation. Most respondents commute every day, typically for 16 to 45 min (45.7%) or less (39.4%). Only 7.1% work remotely every day (Figure 7). Business travel was reported by 15.9% of the respondents. Those who do, travel 19 days a year on average (Figure 8).
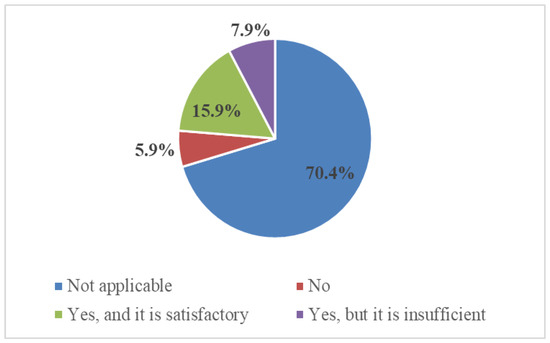
Figure 6.
Overtime compensation as reported by the respondents (n = 700); source: original work.
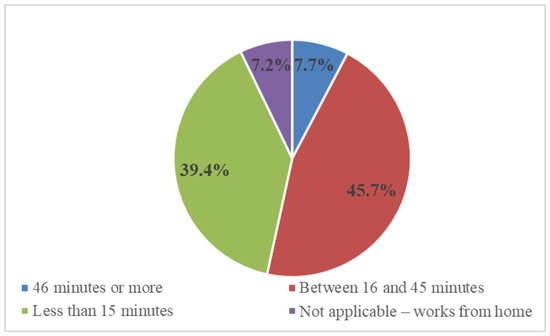
Figure 7.
Distribution of respondents by commute time (n = 700); source: original work.
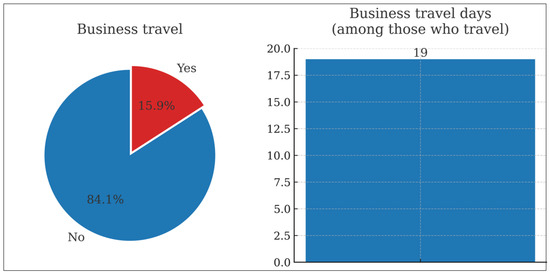
Figure 8.
Business travel: participation and average number of days (n = 700); source: original work.
In summary, the data reveal significant heterogeneity of job demands, which can be consequential to WLB. Some respondents work under significant time pressure, while others experience no additional burdens. This variability justifies implementing flexible organisational support that is adaptable to diverse work conditions and individual strategies for managing job demands.
The fourth group of variables is organisational job resources, meaning the availability of institutional solutions that facilitate reconciling job and private life. The exploratory factor analysis (EFA) of the ordinal data identified four synthetic dimensions: employee health and wellness benefits (F1), work flexibility and time autonomy (F2), family and caregiving leave entitlements (F3), and comfort and adaptable working conditions (F4). They are interpreted in Section 3.3. These indicators reflect the level of support from the employer and are central resources in the framework of JD-R (resources) and the theory of boundaries. As was the case for the original variables (survey questions) measured with the 0–5 scale, we identified six interpretation categories for the standardised factor results (Figure 9).
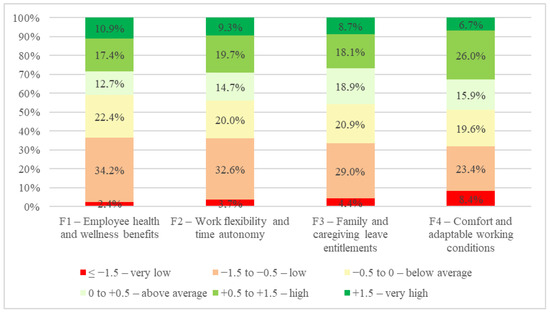
Figure 9.
Distribution of standardised factor scores for key organisational resources supporting WLB; source: original work.
It is relevant to the interpretation of the results that factor values in EFA follow the normal distribution with a mean of 0 and a standard deviation of 1. Hence, the intervals (from ‘very low’ to ‘very high’) have the potential to classify synthetic scores in relation to the mean rather than absolute values of the scale. The mean scores by the respondents in the original variables (survey questions) did not exceed 2.5. Therefore, they were below the median of the original scale. This means that scores classified as ‘above average’ in Figure 9 may still reflect moderate rather than high availability of the resources.
The distribution of factor values in Figure 9 demonstrates that a substantial group of respondents evaluated the availability of critical WLB resources as below average. Values under 0 (‘very low’, ‘low’, and ‘below average’) cover from 45% to 56% of the respondents, depending on the factor. We noticed particularly detrimental distributions for F1 (‘employee health and wellness benefits’) and F2 (‘work flexibility and time autonomy’). More than half of the respondents reported low or very low levels of these resources (56.1% and 51.8% in total). The same happened in the case of F3 (‘family and caregiving leave entitlements’), where 50.0% of the respondents were below the average. Factor F4 (‘comfort and adaptable working conditions’) fared relatively well; nearly one-third of the respondents were classified as ‘high’ or ‘very high’ (32.6%), and only 6.4% were assigned to the lowest group.
In summary, a significant proportion of the employees work in conditions of limited organisational support, which may be detrimental to their ability to reconcile job and private life. The averages of the original variables corroborate this conclusion. Many of them reach 2.0 or less (for example, remote work 1.17, mental support 1.2, sports benefits 1.28), which indicates poor availability of these types of support to the respondents.
4.2. Subjective WLB Evaluation
The respondents evaluated their WLB with a single-choice question with a five-point Likert scale (‘very poorly’ to ‘very well’). As shown in Figure 10, the answers varied but were mostly positive. Half of the respondents (50.1%) believed they were able to reconcile job and private life rather well, while 19.1% declared very good WLB. Still, over a quarter (27.2% in total) indicated some kind of problem, by evaluating their WLB as rather poor or very poor. This distribution of answers should be interpreted considering the work conditions discussed above and available resources. The average scores of most of the analysed organisational resources, such as flexible hours schedule, remote work, mental health support, or health-oriented benefits, were below the median of the scale. This means that the respondents tended to evaluate these aspects as insufficient or poorly available, which could result in problems with WLB due to limited support from the organisation.
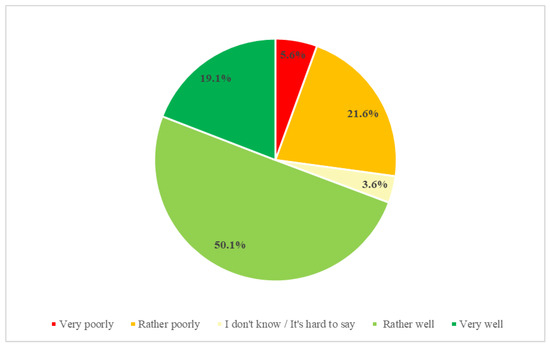
Figure 10.
Self-evaluation of WLB; source: original work.
Still, although many solutions supporting WLB proposed in the literature turned out to be poorly available to the respondents (such as flexible hours schedule, remote work, or mental health support), the general WLB evaluation tended to be positive. This could mean that respondents, who live in rural areas, have relatively low expectations of organisational resources, which makes their evaluation more forgiving. Possibly, they can effectively employ individual strategies to compensate for the limited access to formal resources. Advantageous family situation, slower rural life, or greater time management autonomy can aid in maintaining a sense of balance despite workplace shortcomings.
Below, regression trees are used to identify the factors and strategies that differentiate perceived WLB the most. This way, we can quantify the impact of organisational resources and personal characteristics that could potentially compensate for workplace deficits.
4.3. WLB Factors
The regression tree in Figure 11 was generated with the CART algorithm (Classification and Regression Trees) to explore associations between subjective evaluation of WLB and multiple independent variables. These were quantitative and qualitative indicators, and synthetic factors identified in the factor analysis (F1–F4) that reflect the key areas of organisational WLB resources.
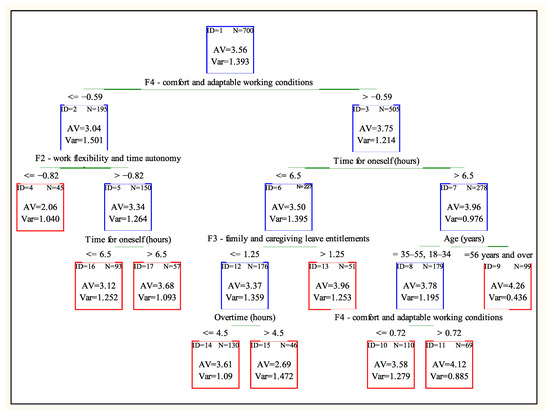
Figure 11.
Regression tree explaining WLB; source: original work.
The study indicates that the first and most influential split in the tree involvedF4, ‘comfort and adaptable working conditions’. Respondents who reported worse access to solutions that enable undisturbed work and recovery at work (e.g., a quiet room, flexibility in leave planning, schedules adaptable to private needs) (F4 ≤ −0.59), were assigned to node ID = 2. The mean WLB score in this group is 3.04. Their balance is much worse than for those who evaluated workplace comfort and adaptability (F4) higher (Node ID = 3; AV = 3.75). The difference between the groups is statistically significant (p < 0.05), indicating that subjective workplace comfort (F4) is pivotal for WLB.
The variable “comfort and adaptable working conditions (F4)” split the studied groups at the level of –0.59, which means that employees rated their WLB (AV = 3.04) lower only when their working conditions were much below the average level (a factor value of –0.59 corresponds roughly to a score of 2 on a 0–5 scale). This suggests that the respondents in the sample do not have very high expectations regarding comfort and adaptability. Only significantly poorer access to solutions that improve comfort and working conditions (such as adapting work schedules and leave plans to private life, and having a quiet place to work) leads to lower WLB ratings.
Factor F2 ‘work flexibility and time autonomy’ turned out to be a significant predictor for the respondents who assigned low scores comfort and adaptable working conditions (F4 ≤ −0.59). Higher scores of F2, above −0.82, as indicated by flexible hours schedules, remote work, permission to bring children to work, and permission to take care of personal matters when on the clock, meant a higher WLB score (AV = 3.34). This shows that formal schedule/place flexibility and time autonomy (F2) can partly compensate for deficits in comfort and adaptability (F4). Employees who reported low comfort and adaptability (F4) and low work flexibility and time autonomy (F2) had by far the lowest WLB scores in the entire model. The mean of 1.0 indicates very low WLB.
The presented results demonstrate that apart from F4 and F2, which are controlled by the employer and depend on the type of work, WLB can also be affected by how the employee manages their spare time. Interestingly, employees who evaluated workplace comfort (F4) as poor and work flexibility (F2) as relatively high, but declared allocating not less than 6.5 h a week to themselves (Node ID = 17) evaluated WLB relatively high at a level similar to the sample average. This example also demonstrates that slightly worse workplace conditions can be offset by other components, such as more spare time for oneself.
On the right side of the tree, one group stands out. Employees with relatively high comfort and adaptable working conditions (F4) and at least 6.5 h of spare time per week rated their WLB at 3.96 (0–5 scale). The next split shows that particularly high WLB scores were reported by those who combined higher F4, more than 6.5 h of spare time per week, and age above 56 (Node ID = 9). Their average WLB score of 4.26 is the highest in the model and represents a profile of a person who balances work and life very well. The following tree splits reveal an interesting finding: younger employees (under 56) report a similarly high WLB level (AV = 4.16) as the older group (AV = 4.26), but only if their ‘comfort and adaptable working conditions score (F4), reflecting the possibility of adjusting working hours and leave plans to personal preferences, is above average (factor value F4 > 0.72 compared to F4 > −0.59 for older employees). This means that younger employees need relatively higher comfort and adaptability (F4) to achieve a similar level of WLB as their older colleagues, even when other conditions are met.
Further down, the tree considers other variables for identifying subsequent respondent groups with different WLB patterns. The WLB scores of those who rated ‘comfort and adaptable working conditions’ (F4) higher while reserving less than 6.5 h a week for themselves (as for a hobby) (Node ID = 6) increase with better access to ‘family and caregiving leave entitlements’ (F3), which is represented by the WLB average at Node ID = 13. For these respondents, easier access to time off for dependants, parental leaves, and leaves at demand significantly increases the WLB score. The analyses further revealed that WLB self-evaluation depends on the number of overtime hours. People with more than 4.5 overtime hours a week scored their WLB much lower (WLB = 2.69). In contrast, the other group, those who have less overtime, scored their WLB at 3.61 (0–5 scale).
The regression tree model generated using the CART algorithm yields both valuable and unexpected results. Although such organisational factors as workplace comfort and work flexibility are pivotal to WLB, personal variables, like spare time use and employee age, are equally impactful. Notably, the model indicates the potential for favourable conditions in one area (flexible hours schedule or time for hobbies) to offset inconveniences in another area (like low workplace comfort), which supports its practicality.
The predictor importance was analysed to ensure a more in-depth interpretation of the regression tree outputs. When summarised, the results help assess which variables influenced subjective WLB more. The analysis provides a deeper understanding of the hierarchy of importance of individual factors and confirms observations based on the structure of the regression tree.
Perceived WLB is determined primarily by factors linked to organisational support and time management (Table 6). The factor ‘work flexibility and time autonomy’ (F2) shows the highest relative importance (1.000). The second strongest predictor is ‘comfort and adaptable working conditions’ (F4, 0.79), which emphasises the influence of work environment on WLB. Additionally, personal factors such as time allocated to hobbies (0.63) and sleep (0.54) are also important. They belong to the spillover category, which means that spare time management and restoration affect well-being. Such job demands as overtime remuneration and number of overtime hours (0.54 and 0.45, respectively) are significant, suggesting that job demands and compensations can meaningfully affect WLB.
Table 6.
Relative importance of variables explaining the level of WLB. Results of regression tree analysis (CART).
Organisational resources, such as family leave entitlements (F3), also contribute to WLB (0.37), but their influence is clearly smaller than that of flexibility (F2) and workplace comfort (F4). Employee age held a middling position (0.33), which may indicate generational differences in perceived WLB, although it was not a dominant factor. Demographic and family variables ranked the lowest (No. of children, sex, age, or caregiver duties). However important the context they provide, the impact of these variables on WLB turned out to be lower than that of available organisational resources and opportunities to improve one’s well-being.
In summary, the analysis demonstrates that WLB emerges mainly from the combination of flexibility, workplace comfort, and effective spare time management. These are clear suggestions for designing organisational policies and workplace environments that promote employee well-being.
5. Discussion
5.1. WLB: Key Determinants and Employee Profiles
The subjective WLB factors identified in the study indicate that the matter is complex and dynamic. As reported in the literature, WLB is not contingent on isolated types of resources or employee characteristics. Instead, it emerges from the interweaving of multiple organisational and private components [65,66,67]. The results of the exploratory factor analysis (EFA) and regression tree (CART) identify four primary groups of WLB constituents: organisational job resources, lifestyle and restoration, job demands, and demographic and family characteristics.
The most significant associations with the sample’s WLB were observed for organisational job resources, namely work flexibility and time autonomy (F2) and comfort and adaptable working conditions (F4) (as defined in Section 3.3). Their pattern of associations aligns with the premises of the job demands–resources model, according to which access to key resources can offset adverse impact of job demands [68,69]. Employees who have better control over the time and place of work and work in a friendly atmosphere reported much higher WLB.
Lifestyle factors were also important, especially time for oneself, sleep, and personal development. According to the spillover theory [34,70], experiences from one domain can influence the other, and subjective WLB can be improved through psychophysical restoration outside of the work context. The results show that spare time acted as a buffer, especially for people who suffered from shortages regarding organisational resources.
Overtime, no compensation for overtime, and other job demands had a substantial impact as well. These results align with findings by Abdulaziz et al. [71], Huo and Jiang [72], and Perreault and Power [41], who noted that uncompensated job overload can reduce an individual’s ability to manage work–life boundaries.
The collected data were sufficient to build profiles of employees who reported extreme WLB values. Older employees with high levels of workplace comfort, significant autonomy, and more than 6.5 h of spare time a week reported the highest WLB. Across the spectrum were younger people, bereft of flexibility and workplace comfort, who could not replenish their energy in their spare time. The analysis suggests individualising organisational policies to accommodate the needs and resources of specific employee groups. Modelling of high and low WLB profiles can aid with more targeted HR interventions aimed at improving employee well-being.
5.2. Work Flexibility and Time Autonomy as Pivotal Determinants of WLB
The regression tree (CART) analysis indicates that factors linked to work flexibility and time autonomy (F2; formal schedule/place flexibility and time autonomy) are central to shaping WLB. In this instrument, autonomy is captured primarily as time autonomy within F2 (decision latitude over one’s schedule and pace). This factor was the strongest relative-importance predictor in the model, with the highest importance indicator value. Importantly, high work flexibility was associated with higher WLB even if workplace comfort was low. It aligns well with the JD-R model framework, where autonomy and flexibility are the central organisational resources, and with the boundary theory, which posits that autonomy promotes individual strategies for managing life domains. Badri et al. [73] confirmed the positive effect of work autonomy on WLB. They have demonstrated that high levels of work autonomy lead to greater work-to-family enrichment and fewer work-to-family conflicts. The relationship between work autonomy and work-to-family enrichment increases as employees become more self-efficacious. Still, work flexibility poses certain conditions for employees. Dettmers and Bredehöft [74] argued that individuals involved in flexible work arrangements (such as remote work) should possess well-developed self-management skills to prevent deterioration in their well-being. In other words, the mere freedom to arrange the place and time of work does not guarantee balance. One needs to know how to enforce boundaries and organise their tasks as well [16]. Still, numerous studies confirm the overall advantageous effect of flexibility on WLB. Mattarelli et al. [75] concluded that flexible work arrangements significantly improved workers’ WLB. Additionally, a 2021 study on labour conditions in 36 European countries by Ferreira et al. [76] confirmed that time for family boosted WLB, and the spillover from personal to work–life is more significant in women than in men. Therefore, easier access to private time (through flexible hours schedules or leave planning) is central to WLB and protects particularly those employees who have intense caregiving roles outside of work.
5.3. Impact of Comfort and Adaptable Working Conditions on WLB
The second most significant predictor was F4 (comfort and adaptable working conditions), capturing the fit of physical and temporal work arrangements to employees’ needs that enables undisturbed work and recovery. Those respondents who assigned low scores to the comfort of their workplaces reported distinctly lower WLB (WLB = 3.04 on average) than those who experienced better conditions (WLB = 3.75), regardless of other resources. The difference was statistically significant (p < 0.05). This result corresponds with the JD-R model, which treats physical and psychosocial workplace conditions as environmental resources that mitigate stress. It also aligns with the spillover theory, where the work environment can have either a beneficial or degrading impact on personal well-being. This means that stifling atmosphere or inconveniences at work can spill over to home life, also reducing the employee’s well-being. On the other hand, supportive conditions, such as a quiet environment, a high level of ergonomics, a flexible hours schedule, or an annual leave plan, lead to high levels of energy after work. Hasan et al. [77] reported similar results. They indicated that beneficial workplace conditions and alignment of the job to the employee’s needs improve job satisfaction and promote WLB, which leads to more engagement, better mental state, and a stronger sense of belonging to the organisation. Meanwhile, a study by Bajrami et al. [78] on hospitality workers in Serbia showed that personal resources, such as optimism and resilience, can do little more than alleviate the negative relationship between workplace environment and employee well-being at work. For those who show signs of job dissatisfaction, support from superiors and colleagues (workplace comfort) is more important. The influence of the physical environment is even more pronounced in remote work contexts. Bölingen et al. [79] demonstrated that negative side effects of working from home (boundary blurring) can be alleviated by high-quality equipment and improved spatial conditions (if they were initially poor). In other words, if the employee has comfortable working conditions and effective tools at home, work-to-family spillover can be reduced even with intense work from home. It could even mean that working from home in a well-organised space can be less burdensome than working at the office in poor conditions. Still, the sine qua non is that the employee is capable of maintaining the work–life boundary.
5.4. Institutional Support and Its Role in the Case of Limited Time Resources
Data suggest that access to institutional resources to address family obligations (F3) can improve WLB substantially, particularly for people with limited opportunities for restoration in spare time. Employees who rarely engaged in hobbies or other non-work activities reported better WLB when they had easier access to family benefits (like parental leave, urgent family matters leave, etc.) This confirms the JD-R assumption that F3 is an offsetting resource as well as the boundary theory proposition that formal mechanisms for moderating job and life roles are important. Engagement in work and care [80] affects caregivers’ decisions and behaviour, straining their families’ resilience. An Australian study by Gulesserian et al. [81] praises the benefits of the ride-share system, where Uber drivers can provide childcare on a full- or part-time basis. As one of the interviewees put it: ‘And I turned to Uber because it was really the only job that was guaranteed that the flexibility would be there. I would be able to take care of my son when necessary.’
The institutional context also matters. Country-level WLB policies differ. A study from Romania [82] shed light on cultural and political tensions linked to the need for a durable balance between family life and the job and economic objectives of society. In Romania, women are typically the primary caregivers, and the public childcare system is ineffective. As a result, families that seek to reconcile work and childcare often have to rely on informal resources, such as the aid of grandmothers or nannies in wealthier households. This private offset mechanism addresses the gap left by the limited institutional care propositions. Where the system fails, the burden of ensuring WLB is taken over by individuals and families, which can increase the caregiver’s stress and exacerbate social inequalities. These examples emphasise the value of designing ‘family-friendly’ policies (leaves, crèches, flexible hours schedules, etc.) to provide support to those employees who have minuscule spare time for restoration.
5.5. Variability of WLB Resources Performance Depending on Personal Characteristics
The CART analysis indicates that personal characteristics of employees, such as age and lifestyle, affect how organisational WLB resources are perceived. Older employees reported high WLB at moderate workplace conditions, while younger people expected greater comfort and flexibility. Moreover, the respondents who had more spare time (for hobbies, for example) made better use of the available organisational resources. These results align with the spillover theory and the JD-R model. Personal resources (like restoration) moderate the relationship between workplace environment and well-being.
The analysis shows that younger employees more often report high WLB when higher comfort and adaptability (F4) and greater time flexibility (F2) are present. Older employees, especially those above the age of 56, tend to achieve high WLB scores even in moderate organisational conditions, which may result from higher professional maturity, a well-established role identity, or less tension between family and work. These differences could be interpreted in the context of generational differences and professional life stages [83,84]. Khallash and Kruse [83] predicted over a decade ago that demographic and technology changes would lead to the redefinition of the concept of WLB in light of ageing labour and increasing diversity of expectations. A different study demonstrated that younger generations more readily request flexibility and support with role management, while older workers more often segment job and life domains using their personal methods [85,86].
Although the impact of such variables as sex, number of children, or occupation was negligible in the overall model, they could be moderators in certain circumstances related to the family, available resources, or time management strategies. According to the boundary theory [34], segmentation or integration strategies are highly dependent on the personality and life situation, such as being a caregiver to small children, the type of work, and the partner’s support. For example, digital industry employees in Lithuania aged 18–24 considered lower costs of commute, lunch, and rent critical advantages of using a digital platform for work [87]. Still, their older colleagues, aged 34–55, were primarily concerned about the lack of paid breaks and annual leave. Freelancers and students were worried about irregular hours, varying job loads, and not being paid when searching for work. Parents whom the study investigated [87] prioritised flexibility and autonomy of using digital platforms. Therefore, organisational solutions should be individualised, and flexible policies are needed to accommodate various life stages and employee preferences.
5.6. Compensatory Mechanisms Between Resources for Enhancing WLB: Practical Insights for HR Management
The regression tree analysis suggests compensation mechanisms between different types of resources. For example, people who experienced low workplace comfort (F4) but had access to flexible work arrangements (F2) or enough time for themselves (e.g., hobbies) reported WLB levels comparable to employees with better working conditions. Similarly, limited spare time could be balanced out by access to family benefits (F3). This indicates that WLB resources do not have a purely linear or additive effect; instead, they work together in a complementary way. This conclusion is supported by the JD-R model, spillover theory, and boundary theory, all of which highlight the role of context and individual role management strategies [76,78,79,81,83,84,87].
These compensation mechanisms have meaningful implications for practical HR management. First, employers should provide multidimensional support. Focusing on just one element (like giving pay rises without improving workplace culture, or offering wellness programmes while demanding excessive overtime) might not bring the expected WLB benefits. The results suggest that high WLB can be achieved in different ways: for some employees, autonomy and remote work options are key; for others, it is a supportive team without overtime; and for some, flexible hours or family emergency support matter most. Employers should offer a package of complementary measures. Second, it is essential to monitor workload (such as overtime) and balance it with recovery opportunities or extra time off before it causes work–home conflicts. Third, companies should train employees on how to use the resources available to them.
6. Applicability to Other Contexts, Including Urban Settings, and Directions for Future Research
The methodological design is modular and transferable to other populations and research contexts. Grounding the instrument in the JD-R model, spillover theory and boundary theory allows the core constructs to be retained while questionnaire items are adapted to the specific features of the setting. In urban applications, the indicator set should expand to city-specific elements. Examples include commuting mode and intensity, crowding, availability and cost of public transport, neighbourhood noise and safety, intensity of remote work and coworking, prevalence of shift work, and participation in platform work. In comparative studies sample stratification by district, sector and income is advisable. Verification of the measurement structure (EFA/CFA), measurement invariance tests between rural and urban groups, and recalibration of cut-off thresholds to local distributions are also appropriate. CART remains suitable due to its capacity to capture non-linearities and interactions, and its results can be complemented with ensemble models to assess stability.
For rural–urban comparisons, parallel instruments and identical measurement procedures should be used to distinguish shared determinants from context-specific ones. Multi-group analyses with measurement invariance tests enable valid comparison of factor scores, and interaction-sensitive models (e.g., CART) help identify compensatory mechanisms that may differ across settings.
A specific direction for future research concerns gender differences. It is worth examining whether gender-specific factors influence WLB in rural conditions. In particular, differences in household duties, caregiving responsibilities and possible engagement in farm work may materially shape outcomes. The analytical approach should include separate modelling for women and men, interactions of gender with key resources (time flexibility, workplace comfort, caregiving entitlements), detailed decomposition of time allocation, and measurement invariance tests by gender to ensure comparability.
From the perspective of knowledge development, longitudinal and mixed-methods extensions are desirable. Panels with repeated measurements of WLB and resources and demands would allow analysis of trajectories and thresholds over time, and a qualitative component (e.g., more open-ended items) would better capture mechanisms and refine questionnaire items.
Methodological refinements may include stability checks of variable-importance rankings using random forest or gradient boosting, and, where causal interpretation is relevant, the use of multivariable regression with rich controls (ANCOVA), panel models with fixed effects, and difference-in-differences with panel data.
7. Conclusions
The article examines factors influencing perceived WLB among employees from rural areas. This topic is becoming increasingly relevant in the context of socio-professional changes, including the growing share of remote and hybrid work in rural settings. Combining traditional life patterns with modern work conditions creates specific challenges in managing professional and private roles. One of the main issues is the disturbance of WLB caused by role spillover, limited resources, and excessive demands, which make it harder to maintain boundaries between work and private life.
The theoretical framework of the study is based on the job demands–resources model (JD-R), spillover theory, and boundary theory. The combination of these approaches allows capturing the complex nature of WLB in rural conditions, especially in relation to infrastructural limitations, technostress, and family tensions. The analysis used classification and regression trees (CART), which revealed hidden relationships between environmental, organisational, and demographic variables and the WLB level.
The results show three main WLB resources: workplace comfort, flexibility in performing job duties, and time autonomy. Age also plays a significant role. Older employees (over 56 years) reported higher WLB with lower expectations regarding organisational support, while younger employees showed greater dependence on working conditions and required a wider range of tools to help balance roles. The analysis also confirmed the mechanism of resource substitution, where shortages of one type of support can be compensated by others. For example, a lack of workplace comfort can be alleviated by high time autonomy, and limited organisational flexibility can be offset by a friendly organisational culture and good relations with supervisors.
The practical implications include the need to adapt organisational policies to employees’ age, family situation, and environmental constraints. In rural areas, improving workplace comfort (on-site and remote), implementing flexible schedules, and increasing the sense of autonomy are particularly important. Support tools should be differentiated: younger employees may value flexibility and career development opportunities, while older employees may prioritise stability, health-related benefits, and predictable working hours. Additional measures may include training in boundary management, developing local psychological support programmes, and co-funding ergonomic home workstations.
When shaping WLB, organisations should invest in trust-based leadership, build a supportive organisational culture, and develop managers’ and employees’ skills in boundary management. These measures, adapted to the specific rural context, can improve the effectiveness of organisational policies and contribute to lasting employee well-being while supporting the achievement of SDG 3, SDG 5, and SDG 8.
8. Limitations of the Study
The main limitation of the study is its cross-sectional design, which does not allow for the observation of changes and trends in attitudes and behaviours over time. In addition, the exploratory classification method used in the study (CART) does not support causal inferences and can only identify patterns and co-occurrence of features.
Another limitation is the absence of a qualitative component such as in-depth interviews or open-ended questions, which makes it difficult to capture more nuanced experiences of respondents and their coping strategies related to work–life balance.
Furthermore, the study relied on self-reported data, which may be affected by cognitive errors or a tendency to give socially desirable responses.
Finally, the study focused exclusively on rural areas in Poland, which limits the possibility of directly applying the results to urban environments or to other countries with different cultural and institutional contexts.
Author Contributions
Conceptualisation, M.D.-G. and W.S.; methodology, W.S.; software, W.S.; validation, M.D.-G. and W.S.; formal analysis, W.S.; investigation, M.D.-G.; resources, M.D.-G.; data curation, W.S.; writing—original draft preparation, M.D.-G. and W.S.; writing—review and editing, M.D.-G. and W.S.; visualisation, M.D.-G. and W.S.; supervision, M.D.-G. and W.S.; project administration, M.D.-G.; funding acquisition, M.D.-G. All authors have read and agreed to the published version of the manuscript.
Funding
Co-financed by the Minister of Science under the ‘Regional Initiative of Excellence’ programme. Agreement No. RID/SP/0039/2024/01. Project period 2024–2027.
Institutional Review Board Statement
The study was conducted in accordance with the Declaration of Helsinki and was approved by the Rector’s Committee for the Ethics of Scientific Research Involving Human Subjects at the University of Agriculture in Krakow (Project Identification Code: 217/2024; approval date: 1 July 2024).
Informed Consent Statement
Informed consent was obtained from all subjects involved in the study.
Data Availability Statement
The data presented in this study are available on request from the corresponding author.
Conflicts of Interest
The authors declare no conflicts of interest.
References
- Woźniak-Jęchorek, B.; Kuźmar, S.; Bole, D. Moving to the suburbs? Exploring the potential impact of work-from-home on suburbanization in Poland. Reg. Stud. 2024, 58, 134–151. [Google Scholar]
- Alecke, B.; Mitze, T. Institutional Reforms and the Employment Effects of Spatially Targeted Investment Grants: The Case of Germany’s GRW. arXiv 2023, arXiv:2302.11376. [Google Scholar] [CrossRef]
- Pieczonka, J. Jakość życia na obszarach wiejskich według młodzieży w kontekście podejmowania decyzji o miejscu rozpoczęcia aktywności zawodowej. Zesz. Nauk. Wyższej Szkoły Bank. We Wrocławiu 2016, 46, 279–293. [Google Scholar]
- Ohimor, J. Significance of Female Entrepreneurship in Rural Development. Zesz. Nauk. Wyższej Szkoły Bank. W Pozn. 2019, 87, 103–112. [Google Scholar]
- Pomianek, I.; Niewęgłowska, M. Kreowanie warunków sprzyjających rozwojowi przedsiębiorczości na obszarach wiejskich. Zagadnienia Ekon. Rolnej 2010, 4, 65–85. [Google Scholar] [CrossRef]
- Mordi, C.; Akanji, B.; Ajonbadi, H. Exploring the impact of technostress on the work–life boundary of UK academics during the coronavirus pandemic. Inf. Technol. People 2025, in press. [Google Scholar] [CrossRef]
- Ollier-Malaterre, A.; Jacobs, J.A.; Rothbard, N.P. Technology, work, and family: Digital cultural capital and boundary management. Annu. Rev. Sociol. 2019, 45, 425–447. [Google Scholar] [CrossRef]
- Rainoldi, M.; Ladkin, A.; Buhalis, D. Blending work and leisure: A future digital worker hybrid lifestyle perspective. Ann. Leis. Res. 2022, 27, 215–235. [Google Scholar] [CrossRef]
- Gualano, M.R.; Buttigieg, S.; Moscato, U. Impact of digitalization on workers’ health and work-life balance. Front. Public Health 2023, 11, 1204465. [Google Scholar] [CrossRef]
- Rani, R.; Dua, K. Factors Influencing Work-Life Balance among Female School Teachers in Haryana State, India. J. Sci. Res. Rep. 2025, 31, 135–141. [Google Scholar] [CrossRef]
- Pandey, N. Exploring the factors affecting the work-life balance of ASHA’s health workers and their impact on performance in rural Uttarakhand. Int. J. Sci. Res. Eng. Manag. 2023, 7, 150–155. [Google Scholar] [CrossRef]
- Chang, A.; McDonald, P.; Burton, P. Methodological choices in work-life balance research 1987 to 2006: A critical review. Int. J. Hum. Resour. Manag. 2010, 21, 2381–2413. [Google Scholar] [CrossRef]
- Medina-Garrido, J.A.; Biedma-Ferrer, J.M.; Ramos-Rodríguez, A.R. Relationship between work-family balance, employee well-being and job performance. Acad. Rev. Latinoam. Adm. 2023, 30, 40–58. [Google Scholar] [CrossRef]
- Espinal Maya, C.; Jiménez Londoño, S. Determinants of Workplace Flextime Flexibility: An Empirical Analysis. arXiv 2024, arXiv:2409.14271. [Google Scholar] [CrossRef]
- Kossek, E.E.; Perrigino, M.B.; Lautsch, B.A. Work-life flexibility policies from a boundary control and implementation perspective: A review and research framework. J. Manag. 2023, 49, 2062–2108. [Google Scholar] [CrossRef]
- Baum, L.; Rau, R. Balancing work and private life: When does workplace flexibility really help? New insights into the interaction effect of working from home and job autonomy. Front. Organ. Psychol. 2024, 2, 1271726. [Google Scholar] [CrossRef]
- Greenhaus, J.H.; Allen, T.D. Work-family balance: A review and extension of the literature. J. Manag. 2011, 37, 17–41. [Google Scholar]
- Allen, T.D.; Johnson, R.C.; Kiburz, K.M.; Shockley, K.M. Work-family conflict and flexible work arrangements: Deconstructing flexibility. Pers. Psychol. 2013, 66, 345–376. [Google Scholar] [CrossRef]
- Junaid, M.; Ferretti, M.; Marinelli, G. Innovation and Sustainable Solutions for Mobility in Rural Areas: A Comparative Analysis of Case Studies in Europe. Sustainability 2025, 17, 871. [Google Scholar] [CrossRef]
- Demerouti, E.; Bakker, A.B.; Nachreiner, F.; Schaufeli, W.B. The job demands-resources model of burnout. J. Appl. Psychol. 2001, 86, 499–512. [Google Scholar] [CrossRef]
- Ferrari, L.; Romano, D. Remote work and well-being in rural areas: Infrastructure, space and social implications. Rural Sociol. 2023, 88, 122–138. [Google Scholar]
- Bakker, A.B.; Demerouti, E. The Job Demands-Resources model: State of the art. J. Manag. Psychol. 2007, 22, 309–328. [Google Scholar] [CrossRef]
- Wang, H.; Wang, Q.; Qu, Y.; Wu, X. Household responsibility and commuting: The spatial constraints of employees and self-employed rural-to-urban migrant women in China—The case of Nanjing. Transportation 2025, 52, 307–324. [Google Scholar] [CrossRef]
- Hammer, L.B.; Johnson, R.C.; Crain, T.L. Work-family interventions and work-family research: Recommendations for advancing the field. J. Occup. Health Psychol. 2021, 26, 261–275. [Google Scholar] [CrossRef]
- Atterton, J. The “strength of weak ties”: Social networking by business owners in the Highlands and Islands of Scotland. Sociol. Rural 2007, 47, 228–245. [Google Scholar] [CrossRef]
- Mirza, S.; Ojha, P. Understanding and dynamic work-life balance among employees in rural industries. Int. J. Humanit. Soc. Sci. Invent. 2025, 14, 108–111. [Google Scholar]
- Adam, J.; Messely, L. Horizon 2020: Mapping Report on Challenges: Improving Farmers’ Wellbeing Through Social Innovation (Belgium) (Deliverable D2.3/WP2). Ghent University—E40 Group: Ghent, Belgium, 2021; 39p. Available online: http://hdl.handle.net/1854/LU-01GK1V57CJRNG87CQACVMRECAA (accessed on 7 July 2025).
- Gan, Y.; Zhang, J. Study on the influence of commuting time on workers’ health status and its mechanism. J. Transp. Health 2025, 41, 102010. [Google Scholar] [CrossRef]
- Grzywacz, J.G.; Marks, N.F. Reconceptualizing the work-family interface: An ecological perspective on the correlates of positive and negative spillover between work and family. J. Occup. Health Psychol. 1999, 5, 111–126. [Google Scholar] [CrossRef]
- Shockley, K.M.; Shen, W.; DeNunzio, M.M.; Arvan, M.L.; Knudsen, E.A. Disentangling the relationship between gender and work–family conflict: An integration of theoretical perspectives using meta-analytic methods. J. Appl. Psychol. 2017, 102, 1601–1635. [Google Scholar] [CrossRef]
- Phillips, J.; Hustedde, C.; Bjorkman, S.; Prasad, R.; Sola, O.; Wendling, A.; Paladine, H. Rural women family physicians: Strategies for successful work-life balance. Ann. Fam. Med. 2016, 14, 244–251. [Google Scholar] [CrossRef]
- Allen, T.D. Family-supportive work environments: The role of organizational perceptions. J. Vocat. Behav. 2001, 58, 414–435. [Google Scholar] [CrossRef]
- McKennon, S.; Fricke, S.; DeWitt, D. Well-being interventions for rural health professionals: A scoping review. J. Rural Health 2025, 41, e12909. [Google Scholar] [CrossRef]
- Ashforth, B.E.; Kreiner, G.E.; Fugate, M. All in a day’s work: Boundaries and micro role transitions. Acad. Manag. Rev. 2000, 25, 472–491. [Google Scholar] [CrossRef]
- Kossek, E.E.; Ruderman, M.N.; Braddy, P.W.; Hannum, K.M. Work-nonwork boundary management profiles: A person-centered approach. J. Vocat. Behav. 2012, 81, 112–128. [Google Scholar] [CrossRef]
- Gardner, D.M.; Lauricella, T.; Ryan, A.M.; Wadlington, P.; Elizondo, F. Managing boundaries between work and non-work domains: Personality and job characteristics and adopted style. J. Occup. Organ. Psychol. 2021, 94, 132–159. [Google Scholar] [CrossRef]
- Zerubavel, E. The Fine Line: Making Distinctions in Everyday Life; Free Press: New York, NY, USA, 1991. [Google Scholar]
- Nippert-Eng, C.E. Home and Work: Negotiating Boundaries Through Everyday Life; University of Chicago Press: Chicago, IL, USA, 1996. [Google Scholar]
- Clark, S.C. Work/family border theory: A new theory of work/family balance. Hum. Relat. 2000, 53, 747–770. [Google Scholar] [CrossRef]
- von Braun, J. Rural-Urban Linkages for Growth, Employment, and Poverty Reduction. In Proceedings of the Fifth International Conference on the Ethiopian Economy, Ethiopian Economic Association, Addis Ababa, Ethiopia, 7–9 June 2007. [Google Scholar]
- Perreault, M.; Power, N. Work-life balance as a personal responsibility: The impact on strategies for coping with interrole conflict. J. Occup. Sci. 2023, 30, 160–174. [Google Scholar] [CrossRef]
- Powell, G.N.; Greenhaus, J.H. Sex, gender, and decisions at the family–work interface. J. Manag. 2010, 36, 1011–1039. [Google Scholar] [CrossRef]
- Ugwu, F.O.; Ugwu, L.E.; Nwali, A.C.; Onyishi, I.E.; Okafor, C.O. Cost of high workload on work-life balance: A moderated mediation model. Technol. Anal. Strateg. Manag. 2024, 36, 3326–3340. [Google Scholar] [CrossRef]
- Yabunaga, C. Family and the Evolutionary Development of the Welfare States: A Comparison of the Discourse on Child and Family Policy in Finland and Japan. In Creative Co-Evolution of the Economies and Welfare States in the Nordic Countries; Tokumaru, N., Yabunaga, C., Shibayama, Y., Eds.; Springer: Singapore, 2024; pp. 77–98. [Google Scholar] [CrossRef]
- Byron, K. A meta-analytic review of work-family conflict and its antecedents. J. Vocat. Behav. 2005, 67, 169–198. [Google Scholar] [CrossRef]
- Kinman, G. Work-life balance and wellbeing in academic employees. In Research Handbook of Academic Mental Health; Edward Elgar Publishing: Cheltenham, UK, 2024; pp. 276–289. [Google Scholar]
- Bai, B.; Gopalan, N.; Beutell, N.; Ren, F. Impact of absolute and relative commute time on work-family conflict: Work schedule control, child care hours, and life satisfaction. J. Fam. Econ. 2021, 42, 586–600. [Google Scholar] [CrossRef]
- Ingenfeld, J.; Wolbring, T.; Bless, H. Commuting and life satisfaction revisited: Evidence on a non-linear relationship. J. Happiness Stud. Interdiscip. Forum Subj. Well-Being 2019, 20, 2677–2709. [Google Scholar] [CrossRef]
- Tao, Y.; van Ham, M.; Petrović, A.; Ta, N. A household perspective on the commuting paradox: Longitudinal relationships between commuting time and subjective wellbeing for couples in China. Transp. Res. Part A Policy Pract. 2023, 170, 103640. [Google Scholar] [CrossRef]
- Jacob, N.; Munford, L.; Rice, N.; Roberts, J. Does commuting mode choice impact health? Health Econ. 2021, 30, 207–230. [Google Scholar] [CrossRef]
- Kryńska, E.; Kwiatkowski, E. Podstawy Wiedzy O Rynku Pracy; Wydawnictwo Uniwersytetu Łódzkiego: Łódź, Polska, 2013. [Google Scholar]
- Nippert-Eng, C.E. Calendars and keys: The classification of “home” and “work”. Sociol. Forum 1996, 11, 563–582. [Google Scholar] [CrossRef]
- Głodacki, M. Czas Wolny Na Wsi-Opowieść O Grillowaniu. CBOS Fokus, Nr 6/2023. Available online: https://www.cbos.pl/PL/publikacje/fokusy_tekst.php?nr=6/2023#rozdzial7 (accessed on 6 July 2025).
- Moving to the Countryside is Gaining Supporters. Cost and Nature are Tempting/Przeprowadzka Na Wieś Zyskuje Zwolenników. Koszty I Natura Kuszą/. Available online: https://businessinsider.com.pl/nieruchomosci/przeprowadzka-na-wies-czy-zycie-z-dala-od-miasta-to-dobry-wybor/7x5wek1 (accessed on 20 May 2025).
- Witczak-Roszkowska, D. Work-life-balance-Poland in comparison with selected European countries. Scientific Papers of Silesian University of Technology. Organization & Management/Zeszyty Naukowe Politechniki Slaskiej. Ser. Organ. I Zarz. 2023, 179, 681–694. [Google Scholar]
- Moglia, M.; Hopkins, J.; Bardoel, A. Telework, hybrid work and the United Nation’s Sustainable Development Goals: Towards policy coherence. Sustainability 2021, 13, 9222. [Google Scholar] [CrossRef]
- Adeniran, A.O. Application of Likert scale’s type and Cronbach’s alpha analysis in an airport perception study. Sch. J. Appl. Sci. Res. 2019, 2, 1–5. [Google Scholar]
- Fabrigar, L.R.; Wegener, D.T.; MacCallum, R.C.; Strahan, E.J. Evaluating the use of exploratory factor analysis in psychological research. Psychol. Methods 1999, 4, 272. [Google Scholar] [CrossRef]
- Breiman, L.; Ihaka, R. Nonlinear Discriminant Analysis via Scaling and ACE; Technical Report, Department of Statistics; University of California: Davis, CA, USA, 1984. [Google Scholar]
- Maimon, O.; Rokach, L. Decomposition methodology for knowledge discovery and data mining. In Data Mining and Knowledge Discovery Handbook; Springer: Boston, MA, USA, 2005; pp. 981–1003. [Google Scholar]
- Alami, T.; Doostparast, M. Weighted CART with spatially split rules: A new kernel-based approach in spatial classification trees. Commun. Stat. Theory Methods 2025, 1–26. [Google Scholar] [CrossRef]
- Lee, S.; Lee, C.; Mun, K.G.; Kim, D. Decision tree algorithm considering distances between classes. IEEE Access 2022, 10, 69750–69756. [Google Scholar] [CrossRef]
- Machuca, C.; Vettore, M.V.; Krasuska, M.; Baker, S.R.; Robinson, P.G. Using classification and regression tree modelling to investigate response shift patterns in dentine hypersensitivity. BMC Med. Res. Methodol. 2017, 17, 120. [Google Scholar] [CrossRef] [PubMed]
- Sroka, W.; Dudek, M.; Wojewodzic, T.; Król, K. Generational changes in agriculture: The influence of farm characteristics and socio-economic factors. Agriculture 2019, 9, 264. [Google Scholar] [CrossRef]
- De Silva, D.A.S.N. Examining the Factors Affecting the Work-Life Balance of Teachers in Sri Lankan Education Sector: The Case of ABC International School. Master’s Thesis, Ulster University Business School, Belfast, UK, 2024. [Google Scholar]
- Xu, M. Employee Perceptions of Work-Life Balance and Formal and Informal Approaches to Work-Life Management: A Case Study of China’s Pharmaceutical Sector. Ph.D. Thesis, Keele University, Keele, UK, 2019. [Google Scholar]
- Garg, R.K.; AtifJilani, S.; Rai, S.K.; Gupta, S.J.; Kumar, A. Assessing Employees’ Perspectives on Work-Life Equilibrium for Integrated Human Capital Governance. In Proceedings of the 2024 IEEE International Students’ Conference on Electrical, Electronics and Computer Science (SCEECS), Bhopal, India, 23–24 February 2024; pp. 1–9. [Google Scholar]
- Davidescu, A.A.; Apostu, S.A.; Paul, A.; Casuneanu, I. Work flexibility, job satisfaction, and job performance among Romanian employees—Implications for sustainable human resource management. Sustainability 2020, 12, 6086. [Google Scholar] [CrossRef]
- Poku, C.A.; Bayuo, J.; Agyare, V.A.; Sarkodie, N.K.; Bam, V. Work engagement, resilience and turnover intentions among nurses: A mediation analysis. BMC Health Serv. Res. 2025, 25, 71. [Google Scholar] [CrossRef]
- Bates, J.T. Motivations of Unethical Behavior. Ph.D. Thesis, Washington State University, Pullman, WA, USA, 2024. [Google Scholar]
- Abdulaziz, A.; Bashir, M.; Alfalih, A.A. The impact of work-life balance and work overload on teacher’s organizational commitment: Do Job Engagement and Perceived Organizational support matter. Educ. Inf. Technol. 2022, 27, 9641–9663. [Google Scholar] [CrossRef]
- Huo, M.L.; Jiang, Z. Work-role overload, work-life conflict, and perceived career plateau: The moderating role of emotional stability. Hum. Resour. Manag. 2023, 62, 867–882. [Google Scholar] [CrossRef]
- Badri, S.K.Z.; Panatik, S.A. The Roles of Job Autonomy and Self-Efficacy to Improve Academics’ Work-life Balance. Asian Acad. Manag. J. 2020, 25. [Google Scholar] [CrossRef]
- Dettmers, J.; Bredehöft, F. The ambivalence of job autonomy and the role of job design demands. Scand. J. Work Organ. Psychol. 2020, 5, 8. [Google Scholar] [CrossRef]
- Mattarelli, E.; Cochis, C.; Bertolotti, F.; Ungureanu, P. How designed work environment and enacted work interactions impact creativity and work-life balance. Eur. J. Innov. Manag. 2024, 27, 648–672. [Google Scholar] [CrossRef]
- Ferreira, P.; Gomes, S.; Lopes, J.M. Workplace practices and work-life balance in Europe: The role of gender and home and family care. Corp. Gov. 2025, 25, 1154–1172. [Google Scholar] [CrossRef]
- Hasan, T.; Jawaad, M.; Butt, I. The influence of person—Job fit, work-life balance, and work conditions on organizational commitment: Investigating the mediation of job satisfaction. Sustainability 2021, 13, 6622. [Google Scholar] [CrossRef]
- Bajrami, D.; Petrović, M.D.; Sekulić, D.; Radovanović, M.M.; Blešić, I.; Vuksanović, N.; Cimbaljević, M.; Tretiakova, T.N. Significance of the work environment and personal resources for employees’ well-being at work in the hospitality sector. Int. J. Environ. Res. Public Health 2022, 19, 16165. [Google Scholar] [CrossRef]
- Bölingen, F.; Hermida Carrillo, A.; Weller, I. Opening the doors for spillovers: A contingency view of the effects of work from home on the work-home interface. Front. Psychol. 2023, 14, 1191657. [Google Scholar] [CrossRef]
- Dobrotić, I. The (in) equality dynamic of childcare-related policy development in post-Yugoslav countries. J. Eur. Soc. Policy 2022, 32, 270–286. [Google Scholar] [CrossRef]
- Gulesserian, L.; Veen, A.; Baird, M. ‘Gig’ Work and Fatherhood: A Typology of Ride-Share Fathers in Australia. New Technol. Work Employ. 2025, 1–11. [Google Scholar] [CrossRef]
- Ion, I.E.; Popescu, R.; Grünberg, L. Home-Based Parental Involvement: Intersections of Gender, Childcare, Families and the Economy in Post-Socialist Romania. In Education and the Family: Parental Involvement Practices in the Home and School; Emerald Publishing Limited: Bingley, UK, 2025; pp. 107–134. [Google Scholar]
- Khallash, S.; Kruse, M. The future of work and work-life balance 2025. Futures 2012, 44, 678–686. [Google Scholar] [CrossRef]
- Rudolph, C.W.; Baltes, B.B. Age and health jointly moderate the influence of flexible work arrangements on work engagement: Evidence from two empirical studies. J. Occup. Health Psychol. 2017, 22, 40. [Google Scholar] [CrossRef]
- Twenge, J.M.; Campbell, S.M. Generational differences in psychological traits and their impact on the workplace. J. Manag. Psychol. 2008, 23, 862–877. [Google Scholar] [CrossRef]
- Jones, S.; Nćmethm, T.; Zekić, U.R. Leading and Managing Gen Z in the Workplace: Challenges for Boomers, Gen X and Millennials. Eff. Exec. 2025, 28, 37–46. [Google Scholar] [CrossRef]
- Remeikiene, R.; Gaspareniene, L.; Fedajev, A.; Hotkova, A.; Kovacs, S. A Study of Platform Workers’ Attitudes Towards Social Security, Legal Regulation and Job Satisfaction: Age and Status Differences. Transform. Bus. Econ. 2025, 24, 316–338. [Google Scholar]


Disclaimer/Publisher’s Note: The statements, opinions and data contained in all publications are solely those of the individual author(s) and contributor(s) and not of MDPI and/or the editor(s). MDPI and/or the editor(s) disclaim responsibility for any injury to people or property resulting from any ideas, methods, instructions or products referred to in the content. |
© 2025 by the authors. Licensee MDPI, Basel, Switzerland. This article is an open access article distributed under the terms and conditions of the Creative Commons Attribution (CC BY) license (https://creativecommons.org/licenses/by/4.0/).