
Analyzing Determinants of Farmers’ Participation in Agricultural Non-Point Source Pollution Control: An Application of the Theory of Planned Behavior

 ,
,
Abstract
1. Introduction
2. Data Sources and Research Methods
2.1. Data Sources
2.2. Theoretical Analysis and Hypotheses
2.2.1. Theoretical Analysis
2.2.2. Hypotheses
2.2.3. Scale Setting
2.3. Model Construction
2.4. Research Approach
3. Results and Analysis
3.1. Reliability and Validity of Constructs
3.2. Analysis of the Differences in Farmers’ Individual Characteristics
3.3. Structural Model and Hypothesis Testing
3.4. Mediation Analysis
3.5. Model Fitting Goodness Test
4. Discussions
5. Conclusions
- (1)
- Farmers’ individual characteristics have significant impacts on behavioral attitudes, perceived behavioral control, subjective norms, governance intention, and governance behavior. Individual characteristics significantly influence their participation in agricultural non-point source pollution control behaviors.
- (2)
- Farmers’ behavioral willingness is influenced by behavioral attitudes, subjective norms, and perceived behavioral control. Among them, behavioral attitudes have the greatest influence. Economic income is the primary factor affecting farmers’ pollution control behaviors.
- (3)
- Perceived behavioral control has a significantly positive impact on governance behavior. Increasing investments in policies, funds, and technology can promote farmers’ governance behaviors regarding agricultural non-point source pollution.
- (4)
- Subjective norms have a positive impact on promoting participation in governance behaviors, among which the influences of neighbors and village committees on farmers’ governance behaviors are more significant.
- (5)
- Farmers’ behavioral willingness has a significant positive impact on their pollution control behaviors and plays a mediating role between their cognition and pollution control behaviors.
- (1)
- According to farmers’ behavioral attitudes, from an economic perspective, local areas should be encouraged to develop green agriculture and increase ecological compensation. This can help farmers increase the added value of agricultural products and accordingly their income. At the same time, more channels should be available for farmers to increase their income and attract them to participate in agricultural non-point source pollution control.
- (2)
- Considering farmers’ subjective norms, the exemplary role of farmers and the leading role of village committees should be fully utilized. Guided by village committees, the demonstration-driving effect of “farmers teaching farmers” can be used to enhance their environmental awareness and enthusiasm for participation from point to area.
- (3)
- Based on perceived behavioral control, at the economic and technical levels, subsidy policies should be popularized among the public. Knowledge of non-point source pollution prevention and control should be included in training programs on rural practical technologies. Intensive training should be organized during key agricultural periods, such as plowing and preparation for sowing in spring. Professional agricultural technicians should be invited to help farmers master environmentally friendly production skills and advanced agricultural machinery should be introduced to optimize the external conditions so they can participate in pollution control and promote the sustainability of agriculture.
Author Contributions
Funding
Institutional Review Board Statement
Informed Consent Statement
Data Availability Statement
Conflicts of Interest
References
- Chen, M.; Chen, J.; Du, P. An inventory analysis of rural pollution loads in China. Water Sci. Technol. 2006, 54, 65–74. [Google Scholar] [CrossRef]
- Wang, M.; Huang, X.; Dong, Y.; Song, Y.; Wang, D.; Li, L.; Qi, X.; Lin, N. Spatiotemporal drivers of agricultural non-point source pollution: A case study of the Huang-Huai-Hai Plain, China. J. Environ. Manag. 2024, 370, 122606. [Google Scholar] [CrossRef] [PubMed]
- Srinivas, R.; Singh, A.P.; Dhadse, K.; Garg, C. An evidence based integrated watershed modelling system to assess the impact of non-point source pollution in the riverine ecosystem. J. Cleaner Prod. 2020, 246, 118963. [Google Scholar] [CrossRef]
- Liu, L.; Zhang, Q.; Huang, X. Comprehensive prevention and control of agricultural non-point source pollution with whole factors and chain in an integrated system. Trans. Chin. Soc. Agric. Eng. 2024, 40, 306–314. [Google Scholar]
- Gao, L.; Wu, Y.; Li, L.; Sun, C.; Li, D.; Liu, X. A Risk Assessment Method for Phosphorus Loss in Intensive Agricultural Areas—A Case Study in Henan Province, China. Agriculture 2024, 14, 1681. [Google Scholar] [CrossRef]
- Li, X.-P.; Cai, J.; Wang, Q.-J.; Wang, X.-W. Heterogeneous public preferences for controlling agricultural non-point source pollution based on a choice experiment. J. Environ. Manag. 2022, 305, 114413. [Google Scholar] [CrossRef]
- Ajzen, I. The theory of planned behavior. Organ. Behav. Hum. Decis. Process. 1991, 50, 179–211. [Google Scholar] [CrossRef]
- Savari, M.; Damaneh, H.E.; Damaneh, H.E.; Cotton, M. Integrating the norm activation model and theory of planned behaviour to investigate farmer pro-environmental behavioural intention. Sci. Rep. 2023, 13, 5584. [Google Scholar] [CrossRef]
- Khan, F.Z.A.; Amir, M.S.; Muhammad, A.; Usama, I.M.; Muhammad, T.; Asad, M.S.; Martin, L.; Tahira, G.H.; Joseph, S.V. Modeling pesticide use intention in Pakistani farmers using expanded versions of the theory of planned behavior. Hum. Ecol. Risk Assess. 2021, 27, 687–707. [Google Scholar] [CrossRef]
- Song, Y.; Wang, Y.; Hu, G. The analysis on forest farmers’ intention to participate in construction of the National Reserve Forest Project and its driving factors. Sci. Rep. 2025, 15, 182. [Google Scholar] [CrossRef]
- Batbay, Ö.; Kahramanoğlu, İ. Using theory of planned behaviour to understand and manage the factors affecting farmers’ intention in pesticide use. Clean. Circ. Bioecon. 2024, 9, 100126. [Google Scholar] [CrossRef]
- Bagheri, A.; Bondori, A.; Allahyari, M.S.; Damalas, C.A. Modeling farmers’ intention to use pesticides: An expanded version of the theory of planned behavior. J. Environ. Manag. 2019, 248, 109291. [Google Scholar] [CrossRef] [PubMed]
- Cammarata, M.; Scuderi, A.; Timpanaro, G.; Cascone, G. Factors influencing farmers’ intention to participate in the voluntary carbon market: An extended theory of planned behavior. J. Environ. Manag. 2024, 369, 122367. [Google Scholar] [CrossRef]
- Chen, Q. Analyzing Farmers’ Cultivated-Land-Abandonment Behavior: Integrating the Theory of Planned Behavior and a Structural Equation Model. Land 2022, 11, 1777. [Google Scholar] [CrossRef]
- Yang, S.; Wu, Y.; Gao, L.; Li, L.; Li, D.; Hu, Y. Estimation and control zones of agricultural non-point source pollution load in Henan Province. Environ. Pollut. Control. 2024, 46, 750–759. [Google Scholar] [CrossRef]
- Tuominen, L.S.; Helle, S.; Helanterä, H.; Karell, P.; Rapeli, L.; Richmond, D.; Vuorisalo, T.; Brommer, J.E. Structural equation modeling reveals decoupling of ecological and self-perceived outcomes in a garden box social-ecological system. Sci. Rep. 2022, 12, 6425. [Google Scholar] [CrossRef]
- Maleki, S.; Naeimi, A.; Bijani, M.; Salahi Moghadam, N. Comparing predictive power of planned behavior and social cognition theories on students’ pro-environmental behaviors: The case of University of Zanjan, Iran. J. Cleaner Prod. 2025, 486, 144386. [Google Scholar] [CrossRef]
- Li, D.; Chu, Z.; Li, P.; Xu, W.; Wang, E.; Jin, C.; Zheng, B. Impacts of landscape spatial configuration of integrated multi-pond constructed wetlands in a basin on the treatment of non-point source pollution. J. Cleaner Prod. 2023, 383, 135389. [Google Scholar] [CrossRef]
- Wen, W.; Zhuang, Y.; Jiang, T.; Li, W.; Li, H.; Cai, W.; Xu, D.; Zhang, L. “Period-area-source” hierarchical management for agricultural non-point source pollution in typical watershed with integrated planting and breeding. J. Hydrol. 2024, 635, 131198. [Google Scholar] [CrossRef]
- Kan, J.; Zhu, N.; Zhao, Y. Behavioral Response Analysis of Rural Residents’ Living Waste Classification: Evidence from Jiangsu, China. Sustainability 2025, 17, 3529. [Google Scholar] [CrossRef]
- Erokhin, V.; Mouloudj, K.; Bouarar, A.C.; Mouloudj, S.; Gao, T. Investigating Farmers’ Intentions to Reduce Water Waste through Water-Smart Farming Technologies. Sustainability 2024, 16, 4638. [Google Scholar] [CrossRef]
- Popa, B.; Niță, M.D.; Hălălișan, A.F. Intentions to engage in forest law enforcement in Romania: An application of the theory of planned behavior. For. Policy Econ. 2019, 100, 33–43. [Google Scholar] [CrossRef]
- Liang, Y.; Kee, K.F.; Henderson, L.K. Towards an integrated model of strategic environmental communication: Advancing theories of reactance and planned behavior in a water conservation context. J. Appl. Commun. Res. 2018, 46, 135–154. [Google Scholar] [CrossRef]
- Akhter, S.; Rather, M.I.; Zargar, U.R. Understanding the food waste behaviour in university students: An application of the theory of planned behaviour. J. Cleaner Prod. 2024, 437, 140632. [Google Scholar] [CrossRef]
- Zhang, T.; Yang, Y.; Ni, J.; Xie, D. Adoption behavior of cleaner production techniques to control agricultural non-point source pollution: A case study in the Three Gorges Reservoir Area. J. Cleaner Prod. 2019, 223, 897–906. [Google Scholar] [CrossRef]
- Fan, H.; Li, L.; Li, X.; Yu, Y.; Wu, Y.; Li, D.; Liu, J.; Wang, X. Analysis of the Interactive Response Relationships Between Agricultural Pollution Reduction and Carbon Emission Mitigation and Agricultural Economic Development: A Case Study of Henan Province, China. Agriculture 2025, 15, 1163. [Google Scholar] [CrossRef]
- Lee, E.W.J.; Ho, S.S.; Lwin, M.O. Extending the social cognitive model—Examining the external and personal antecedents of social network sites use among Singaporean adolescents. Comput. Hum. Behav. 2017, 67, 240–251. [Google Scholar] [CrossRef]
- Cohen, J.; Gil, J.; Rosado, L. Extending the TPB of residential waste sorting with situational factors using a data-driven approach: The case of Gothenburg, Sweden. Waste Manag. Bull. 2025, 3, 87–95. [Google Scholar] [CrossRef]
- Zhang, D.; Yang, T.; Lou, S. Combining Maslow’s hierarchy of needs theory with the TPB: What influences waste separation behavior in Chinese residents: Evidence from Shanghai. Sustain. Futures 2025, 9, 100660. [Google Scholar] [CrossRef]
- Wang, Q.-C.; Ren, Y.-T.; Liu, X.; Chang, R.-D.; Zuo, J. Exploring the heterogeneity in drivers of energy-saving behaviours among hotel guests: Insights from the theory of planned behaviour and personality profiles. Environ. Impact Assess. Rev. 2023, 99, 107012. [Google Scholar] [CrossRef]
- Garmendia-Lemus, S.; Moshkin, E.; Hung, Y.; Tack, J.; Buysse, J. European farmers’ perceptions and intentions to use bio-based fertilisers: Insights from the theory of planned behaviour and perceived utility. J. Cleaner Prod. 2024, 434, 139755. [Google Scholar] [CrossRef]
- Ali, T.; Ali, J. Factors affecting the consumers’ willingness to pay for health and wellness food products. J. Agric. Food Res. 2020, 2, 100076. [Google Scholar] [CrossRef]
- Malaza, N.N.C.; Wokadala, O.C.; Sibanyoni, J.J.; Stempa, T.; Christian, M.; McAta, B.; Mlambo, V. Moderation of the intention to purchase plant-based beverages by rural and urban dwelling area type: An application of the theory of planned behavior. Food Humanit. 2025, 4, 100589. [Google Scholar] [CrossRef]
- Tan, Y.; Ying, X.; Gao, W.; Wang, S.; Liu, Z. Applying an extended theory of planned behavior to predict willingness to pay for green and low-carbon energy transition. J. Cleaner Prod. 2023, 387, 135893. [Google Scholar] [CrossRef]
- Yang, L.; Hongyu, C. Research on factors influencing total carbon emissions of construction based on structural equation modeling: A case study from China. Build Environ. 2025, 275, 112396. [Google Scholar] [CrossRef]
- Jiang, S.; Li, X.; Lin, J.; Ji, X.; Ji, W. Research on restorative perception mechanisms in rural landscapes based on structural equation modelling. Ecol. Indic. 2025, 172, 113252. [Google Scholar] [CrossRef]
- Sun, D.; Wang, X.; Yu, M.; Ouyang, Z.; Liu, G. Dynamic evolution and decoupling analysis of agricultural nonpoint source pollution in Taihu Lake Basin during the urbanization process. Environ. Impact Assess. Rev. 2023, 100, 107048. [Google Scholar] [CrossRef]
- Zhao, H.; Wang, Y.; Dong, Y.; He, Z.; Wang, P.; Zheng, H.; He, J.; Zeng, W. Modeling the response of agricultural non-point source pollution to planting structure and fertilization level in Erhai Lake Basin under low-latitude plateau climate. Ecol. Indic. 2023, 154, 110829. [Google Scholar] [CrossRef]
- Li, X.; Liu, W.; Yan, Y.; Fan, G.; Zhao, M. Rural Households’ Willingness to Accept Compensation Standards for Controlling Agricultural Non-Point Source Pollution: A Case Study of the Qinba Water Source Area in Northwest China. Water 2019, 11, 1251. [Google Scholar] [CrossRef]
- Xiao, X.; He, B.; Ni, J.; Xie, T. Analysis of Farmers’ Willingness and Behavior to Participate in Controlling Agricultural Non-Point Pollution Sources in the Ecological Barrier Zone of Three Gorges Reservoir Area. J. Southwest Univ. Nat. Sci. Ed. 2015, 37, 136–145. [Google Scholar] [CrossRef]
- Feng, L.; Zhang, W.; Zhang, J. Analysis on spatial-temporal characteristics and Environmental Kuznets Curve of non-point source pollution in the ThreeGorges Reservoir Area. China Environ. Sci. 2022, 42, 3325–3333. [Google Scholar] [CrossRef]
- Huang, C.; Zhao, D.; Fan, X.; Liu, C.; Zhao, G. Landscape dynamics facilitated non-point source pollution control and regional water security of the Three Gorges Reservoir area, China. Environ. Impact Assess. Rev. 2022, 92, 106696. [Google Scholar] [CrossRef]


| Latent Variables | Observed Variables | Number | Mean Value | Standard Deviation |
|---|---|---|---|---|
| BA | The importance of agricultural non-point source pollution control | A1 | 3.31 | 1.161 |
| Participating in the control of agricultural non-point source pollution is beneficial to agricultural development | A2 | 3.44 | 1.164 | |
| Participating in the control of agricultural non-point source pollution is beneficial to food production | A3 | 3.34 | 1.088 | |
| The control of agricultural non-point source pollution is beneficial to environmental governance | A4 | 3.20 | 1.088 | |
| SN | The impact of family relationships | B1 | 3.54 | 1.291 |
| The impact of neighborhood relations | B2 | 3.52 | 1.240 | |
| The impact of village committee | B3 | 3.51 | 1.158 | |
| The impact of government organizations | B4 | 3.56 | 1.128 | |
| PBC | The degree of understanding of non-point source pollution policies | C1 | 3.36 | 1.150 |
| The transparency of non-point source pollution policies | C2 | 3.50 | 1.240 | |
| The degree of difficulty in obtaining relevant technologies | C3 | 3.14 | 0.876 | |
| The ability to participate in the treatment of non-point source pollution | C4 | 3.14 | 0.823 | |
| The degree of policy subsidies | C5 | 3.13 | 0.832 | |
| GI | Reduce the use of chemical fertilizers in planting | F1 | 3.36 | 1.045 |
| Reduce the use of pesticides in planting | F2 | 3.23 | 1.170 | |
| Increase the use of organic fertilizers | F3 | 3.35 | 1.134 | |
| GB | Take the initiative to participate in the control of agricultural non-point source pollution | D1 | 3.27 | 1.139 |
| Publicize the control of agricultural non-point source pollution | D2 | 3.33 | 1.075 | |
| Participate in the training on the control of agricultural non-point source pollution | D3 | 3.25 | 0.940 |
| Latent Variables | Observed Variables | Standard Factor Loading | Cronbach’s α | KMO | Bartlett Test of Sphericity |
|---|---|---|---|---|---|
| BA | A1 | 0.766 | 0.831 | 0.805 | 253.895 (p < 0.001) |
| A2 | 0.770 | ||||
| A3 | 0.812 | ||||
| A4 | 0.784 | ||||
| SN | B1 | 0.799 | 0.868 | 0.824 | 470.939 (p < 0.001) |
| B2 | 0.871 | ||||
| B3 | 0.842 | ||||
| B4 | 0.803 | ||||
| PBC | C1 | 0.833 | 0.879 | 0.888 | 632.165 (p < 0.001) |
| C2 | 0.827 | ||||
| C3 | 0.817 | ||||
| C4 | 0.817 | ||||
| C5 | 0.810 | ||||
| GI | F1 | 0.881 | 0.923 | 0.754 | 570.261 (p < 0.001) |
| F2 | 0.909 | ||||
| F3 | 0.857 | ||||
| GB | D1 | 0.841 | 0.866 | 0.723 | 267.216 (p < 0.001) |
| D2 | 0.831 | ||||
| D3 | 0.812 |
| Individual Characteristics | Proportion | Manner | Variable | t/F | Sig. |
|---|---|---|---|---|---|
| Sex | Male: 65.31 Female: 34.69 | The independent-samples t-test | BA | 6.027 | 0.001 |
| SN | 2.081 | 0.039 | |||
| PBC | 2.070 | 0.040 | |||
| GI | 2.934 | 0.004 | |||
| GB | 2.833 | 0.005 | |||
| Political affiliation | Communist Party member: 25.71 Non-Communist Party member: 74.29 | The independent-samples t-test | BA | 4.054 | 0.000 |
| SN | 5.547 | 0.000 | |||
| PBC | 3.149 | 0.002 | |||
| GI | 3.894 | 0.000 | |||
| GB | 3.144 | 0.002 | |||
| Age | <30: 13.06 30–39: 22.04 40–49: 26.94 50–59: 27.76 >60: 10.20 | Difference test | BA | 7.777 | 0.000 |
| SN | 3.675 | 0.006 | |||
| PBC | 3.656 | 0.007 | |||
| GI | 3.110 | 0.016 | |||
| GB | 6.085 | 0.000 | |||
| Educational background | Primary school: 11.02 Middle school: 57.14 High school: 22.04 Vocational college: 5.31 Regular college: 4.49 | Difference test | BA | 9.923 | 0.000 |
| SN | 4.397 | 0.002 | |||
| PBC | 3.259 | 0.013 | |||
| GI | 3.027 | 0.018 | |||
| GB | 4.589 | 0.001 | |||
| The proportion of agricultural income in the family income | 0–20(%): 41.22 21–40(%): 21.22 41–60(%): 11.84 61–80(%): 15.10 81–100(%): 10.61 | Difference test | BA | 11.242 | 0.000 |
| SN | 5.109 | 0.001 | |||
| PBC | 7.904 | 0.000 | |||
| GI | 2.440 | 0.048 | |||
| GB | 3.659 | 0.006 |
| Path Relationships | Significance Estimates | Residuals (ζ) | Compositional Reliability (CR) | Factor Loading | |||
|---|---|---|---|---|---|---|---|
| UnStd. | S.E. | C.R. | p | ||||
| BA→A4 | 1 | 0.567 | 0.832 | 0.743 | |||
| BA→A3 | 1.002 | 0.093 | 10.8 | *** | 0.569 | 0.765 | |
| BA→A2 | 1.065 | 0.099 | 10.74 | *** | 0.563 | 0.755 | |
| BA→A1 | 1.018 | 0.098 | 10.34 | *** | 0.517 | 0.712 | |
| SN→B4 | 1 | 0.491 | 0.870 | 0.701 | |||
| SN→B3 | 1.183 | 0.104 | 11.39 | *** | 0.653 | 0.809 | |
| SN→B2 | 1.364 | 0.114 | 12.00 | *** | 0.757 | 0.872 | |
| SN→B1 | 1.275 | 0.115 | 11.05 | *** | 0.610 | 0.777 | |
| PBC→C5 | 1 | 0.602 | 0.890 | 0.778 | |||
| PBC→C4 | 1.01 | 0.079 | 12.77 | *** | 0.629 | 0.796 | |
| PBC→C3 | 1.085 | 0.084 | 12.90 | *** | 0.640 | 0.798 | |
| PBC→C2 | 1.471 | 0.12 | 12.28 | *** | 0.587 | 0.765 | |
| PBC→C1 | 1.415 | 0.111 | 12.80 | *** | 0.632 | 0.795 | |
| GI→F1 | 1 | 0.887 | 0.925 | 0.937 | |||
| GI→F2 | 1.060 | 0.048 | 22.16 | *** | 0.797 | 0.900 | |
| GI→F3 | 0.982 | 0.049 | 20.02 | *** | 0.728 | 0.854 | |
| GB→D1 | 1 | 1 | 0.869 | 0.871 | |||
| GB→D2 | 0.94 | 0.061 | 15.38 | *** | 0.759 | 0.866 | |
| GB→D3 | 0.698 | 0.054 | 12.99 | *** | 0.548 | 0.745 | |
| Hypothesis | Path Relationships | Path Coefficient | p | Distinctiveness | Hypothesis Test |
|---|---|---|---|---|---|
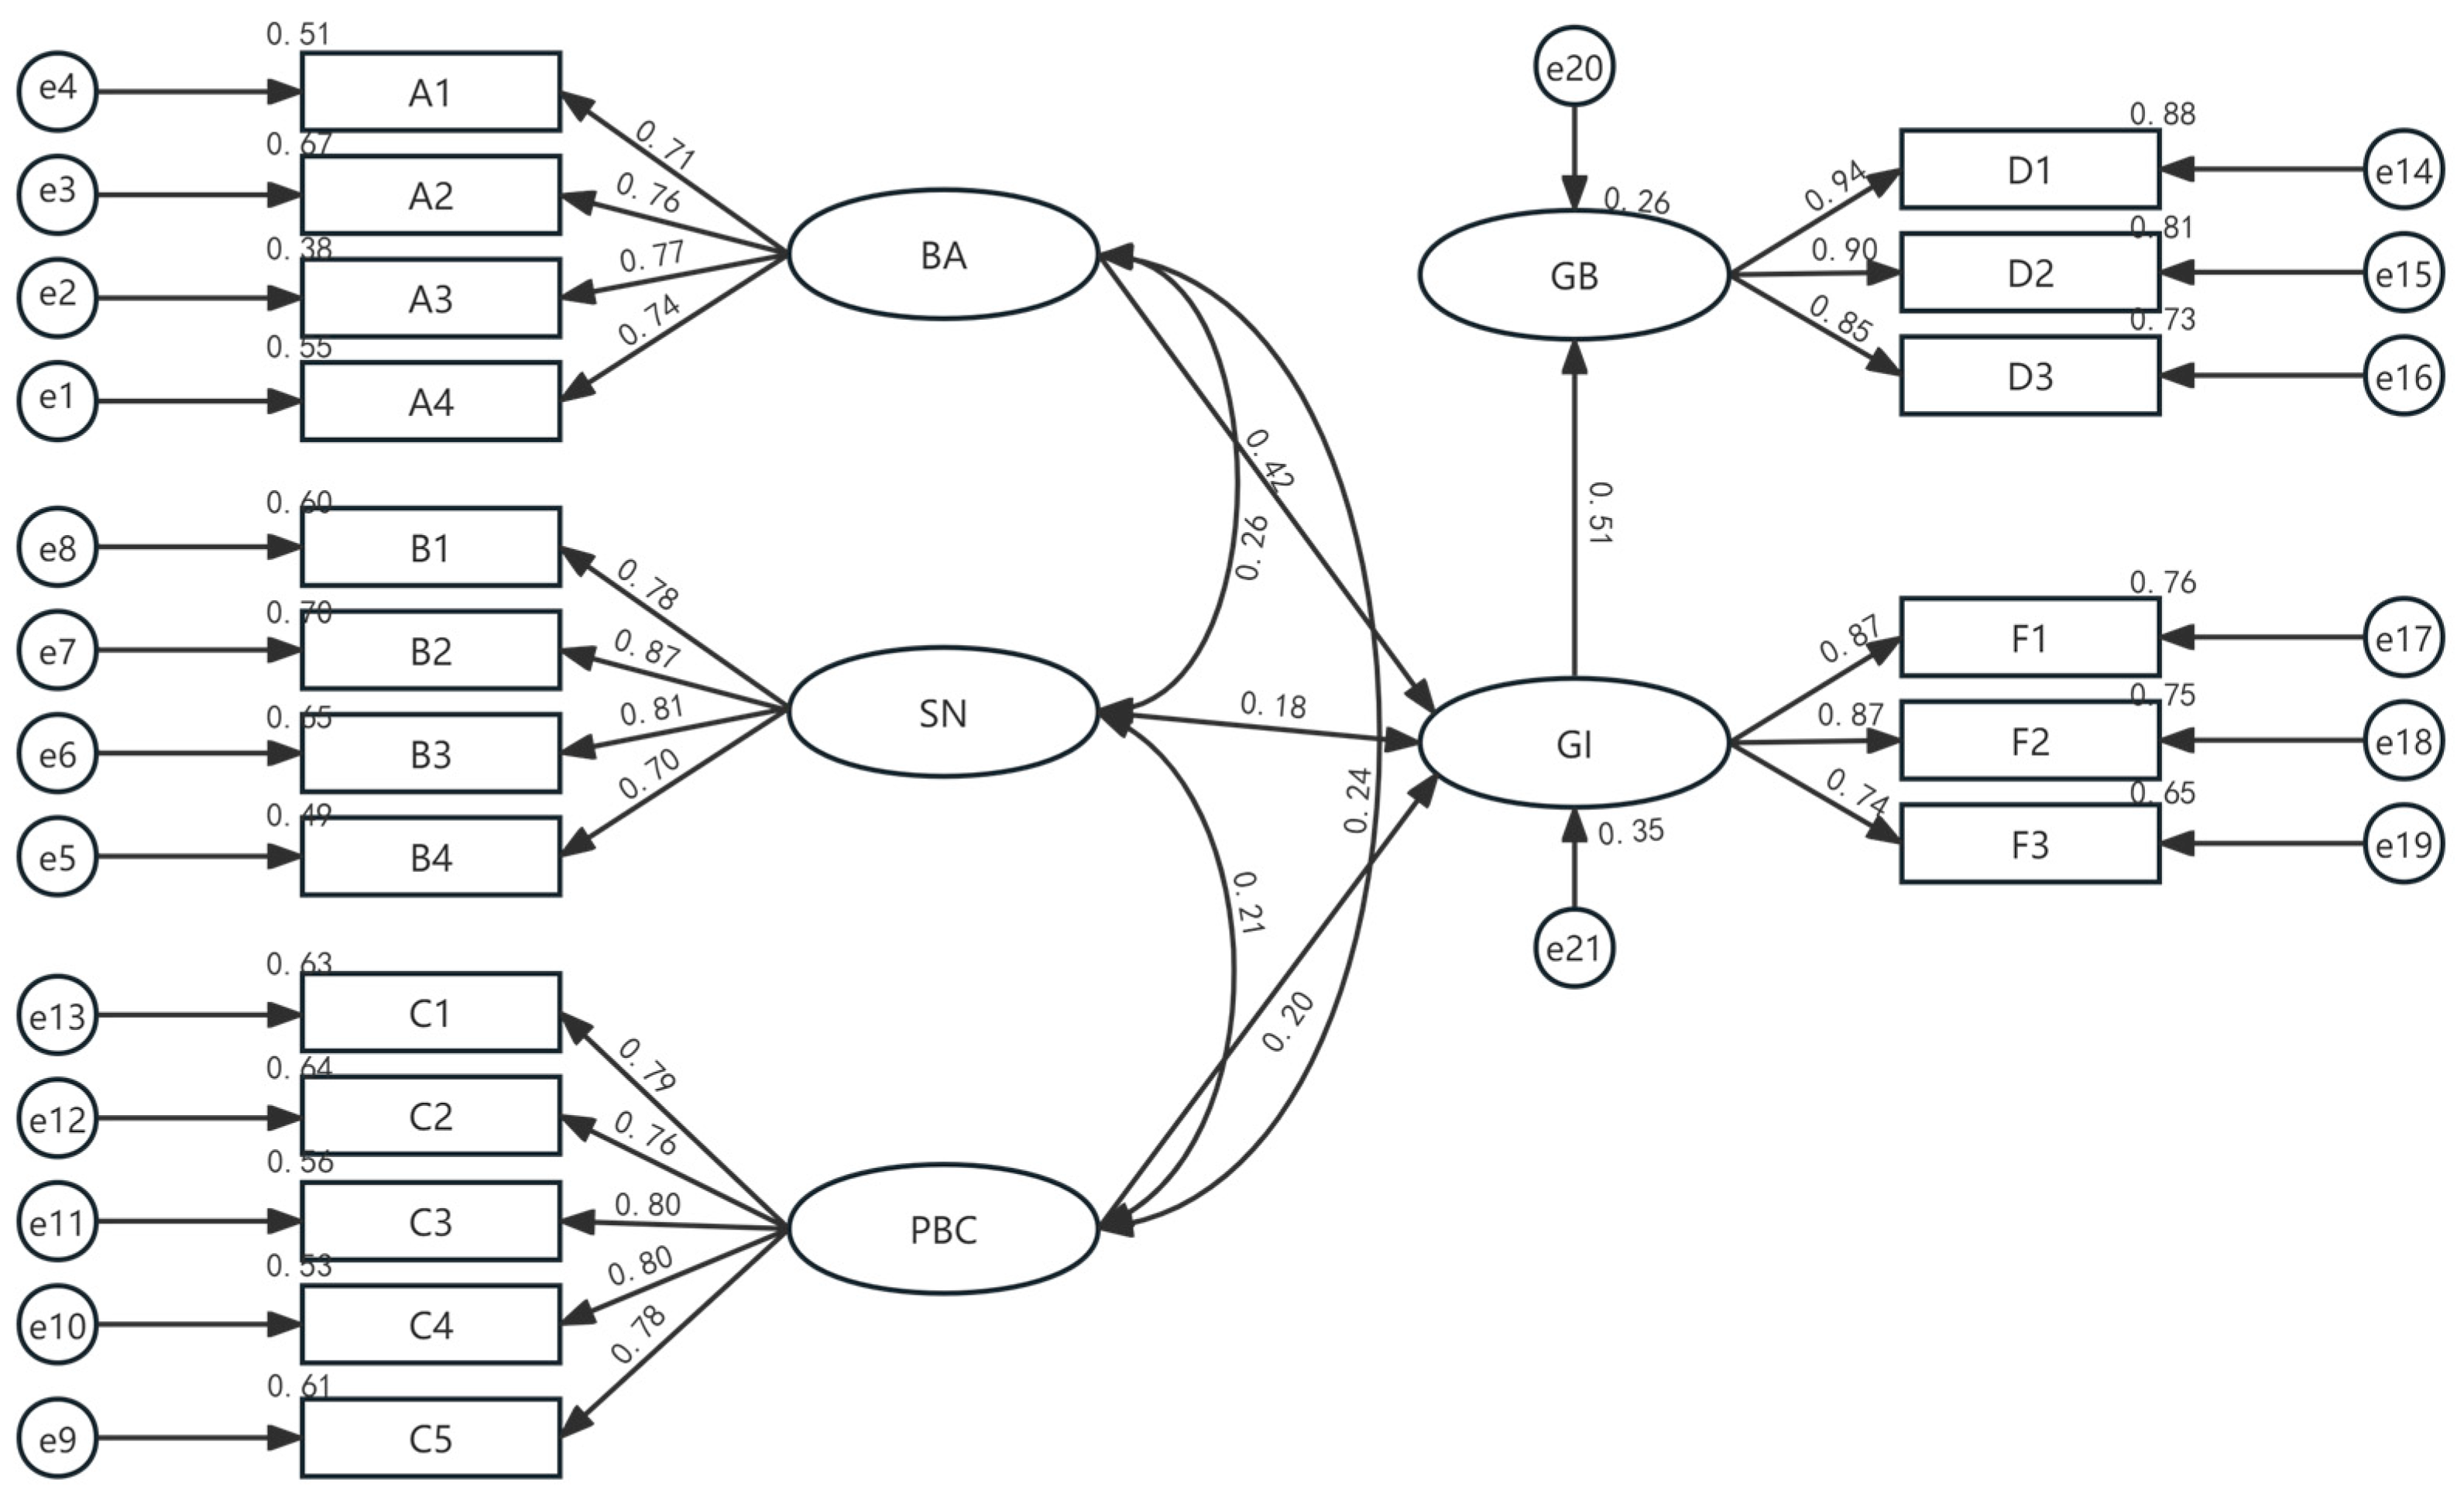
| H2 | BA→GI | 0.42 | 0.001 | *** | Support |
| H3 | SN→GI | 0.18 | 0.005 | ** | Support |
| H4 | PBC→GI | 0.20 | 0.009 | ** | Support |
| H5 | GI→GB | 0.51 | 0.001 | *** | Support |
| Path | Weights | LLCI | ULCI | Boot SE | |
|---|---|---|---|---|---|
| BA→GI→GB | Mediating effect | 0.129 | 0.070 | 0.206 | 0.035 |
| Direct effect | 0.311 | 0.190 | 0.432 | 0.061 | |
| Aggregate benefit | 0.440 | 0.323 | 0.556 | 0.060 | |
| SN→GI→GB | Mediating effect | 0.093 | 0.049 | 0.156 | 0.026 |
| Direct effect | 0.179 | 0.073 | 0.285 | 0.054 | |
| Aggregate benefit | 0.272 | 0.161 | 0.383 | 0.056 | |
| PBC→GI→GB | Mediating effect | 0.104 | 0.045 | 0.181 | 0.035 |
| Direct effect | 0.227 | 0.096 | 0.360 | 0.066 | |
| Aggregate benefit | 0.330 | 0.192 | 0.468 | 0.070 | |
| Types of Indices | Appraise Index | Fitting Value | Judging Standard | Adaptation Results |
|---|---|---|---|---|
| Absolute fit indices | Chi-square to degrees of freedom ratio(X2/df) | 1.529 | <3 | Support |
| Goodness-of-Fit Index | 0.916 | >0.9 | Support | |
| Root Mean Square Error of Approximation | 0.047 | <0.05 | Support | |
| Incremental fit indices | Normed Fit Index | 0.920 | >0.9 | Support |
| Incremental Fit Index | 0.971 | >0.9 | Support | |
| Comparative Fit Index | 0.971 | >0.9 | Support | |
| Parsimonious fit indices | Parsimonious Goodness of Fit Index | 0.699 | >0.5 | Support |
| Parsimony Normed Fit Index | 0.780 | >0.5 | Support |
Disclaimer/Publisher’s Note: The statements, opinions and data contained in all publications are solely those of the individual author(s) and contributor(s) and not of MDPI and/or the editor(s). MDPI and/or the editor(s) disclaim responsibility for any injury to people or property resulting from any ideas, methods, instructions or products referred to in the content. |
© 2025 by the authors. Licensee MDPI, Basel, Switzerland. This article is an open access article distributed under the terms and conditions of the Creative Commons Attribution (CC BY) license (https://creativecommons.org/licenses/by/4.0/).
Share and Cite
Zhang, X.; Wu, Y.; Li, L.; Sun, C.; Yang, S.; Lu, J.; Wang, W. Analyzing Determinants of Farmers’ Participation in Agricultural Non-Point Source Pollution Control: An Application of the Theory of Planned Behavior. Sustainability 2025, 17, 5746. https://doi.org/10.3390/su17135746
Zhang X, Wu Y, Li L, Sun C, Yang S, Lu J, Wang W. Analyzing Determinants of Farmers’ Participation in Agricultural Non-Point Source Pollution Control: An Application of the Theory of Planned Behavior. Sustainability. 2025; 17(13):5746. https://doi.org/10.3390/su17135746
Chicago/Turabian StyleZhang, Xiangyuan, Yong Wu, Ling Li, Chi Sun, Shuhan Yang, Jie Lu, and Wenzhen Wang. 2025. "Analyzing Determinants of Farmers’ Participation in Agricultural Non-Point Source Pollution Control: An Application of the Theory of Planned Behavior" Sustainability 17, no. 13: 5746. https://doi.org/10.3390/su17135746
APA StyleZhang, X., Wu, Y., Li, L., Sun, C., Yang, S., Lu, J., & Wang, W. (2025). Analyzing Determinants of Farmers’ Participation in Agricultural Non-Point Source Pollution Control: An Application of the Theory of Planned Behavior. Sustainability, 17(13), 5746. https://doi.org/10.3390/su17135746