
Using Augmented Reality to Improve Tourism Marketing Effectiveness


Abstract
1. Introduction
2. Theoretical Background
2.1. Augmented Reality: A Game Changer in the Landscape of Tourism Marketing
2.2. The Relevance of Augmented Reality to Tourism Marketing Effectiveness
2.3. The Technology Acceptance Model, Stimulus–Organism–Response Model and Flow Theory
3. Hypotheses Development
4. Research Methodology
4.1. Study Site Profile
4.2. Design and Sampling
4.3. Procedure
4.4. Survey Instrument
5. Results
5.1. Inner Model/Measurement Model Assessment
5.2. Outer Model
6. Discussion of the Findings
7. Theoretical Contribution, Practical Implications and Limitations
7.1. Theoretical Contribution
7.2. Practical Implications
7.3. Limitations and Future Research Directions
Author Contributions
Funding
Informed Consent Statement
Data Availability Statement
Conflicts of Interest
Appendix A
References
- Carmen, I.M.; Ciochina, I. Tourism brand-the premise of a positive image for a tourist destination. Study case: Romania. Int. J. Inf. Bus. Manag. 2014, 6, 218–235. [Google Scholar]
- Scurati, G.; Bertoni, M.; Graziosi, S.; Ferrise, F. Exploring the use of virtual reality to support environmentally sustainable behavior: A framework to design experiences. Sustainability 2021, 13, 943. [Google Scholar] [CrossRef]
- Cranmer, E.E. Developing an Augmented Reality Business Model for Cultural Heritage Tourism: The Case of Geevor Museum. Ph.D. Thesis, Manchester Metropolitan University, Manchester, UK, 2017. [Google Scholar]
- Cibilic, I.; Posloncec-Petric, V.; Tominic, K. Implementing Augmented reality in Tourism. In Proceedings of the ICA, Florence, Italy, 14–18 December 2021; Copernicus GmbH: Göttingen, Germany, 2021. [Google Scholar]
- Mele, C.; Spena, T.R.; Marzullo, M.; Di Bernardo, I. The phygital transformation: A systematic review and a research agenda. Ital. J. Mark. 2023, 2023, 323–349. [Google Scholar] [CrossRef]
- Vilkina, M.V.; Klimovets, O.V. Augmented reality as marketing strategy in the global competition. In Proceedings of the Institute of Scientific Communications Conference, Vladimir, Russia, 17–19 April 2019. [Google Scholar]
- Baber, R.; Baber, P. Influence of social media marketing efforts, e-reputation and destination image on intention to visit among tourists: Application of SOR model. J. Hosp. Tour. Insights 2023, 6, 2298–2316. [Google Scholar] [CrossRef]
- Riar, M.; Xi, N.; Korbel, J.J.; Zarnekow, R.; Hamari, J. Using augmented reality for shopping: A framework for AR induced consumer behavior, literature review and future agenda. Internet Res. 2022, 33, 242–279. [Google Scholar] [CrossRef]
- Nguyen, T.B.T.; Le, T.B.N.; Chau, N.T. How VR technological features prompt tourists’ visiting intention: An integrated approach. Sustainability 2023, 15, 4765. [Google Scholar] [CrossRef]
- Yim, M.Y.C.; Chu, S.C.; Sauer, P.L. Is augmented reality technology an effective tool for e-commerce? An interactivity and vividness perspective. J. Interact. Mark. 2017, 39, 89–103. [Google Scholar]
- Willems, K.; Brengman, M.; Van Kerrebroeck, H. The impact of representation media on customer engagement in tourism marketing among millennials. Eur. J. Mark. 2019, 53, 1988–2017. [Google Scholar] [CrossRef]
- Wi, J.H.; Cha, H.S.; Park, C.; Kim, T. Understanding Factors Influencing Virtual Reality Acceptance Using a Unified Sor-Tam Approach. Asia Pac. J. Inf. Syst. 2024, 34, 1025–1047. [Google Scholar] [CrossRef]
- Sengupta, A.; Cao, L. Augmented reality’s perceived immersion effect on the customer shopping process: Decision-making quality and privacy concerns. Int. J. Retail Distrib. Manag. 2022, 50, 1039–1061. [Google Scholar] [CrossRef]
- Daassi, M.; Debbabi, S. Intention to reuse AR-based apps: The combined role of the sense of immersion, product presence and perceived realism. Inf. Manag. 2021, 58, 103453. [Google Scholar] [CrossRef]
- Jacoby, J. Stimulus-organism-response reconsidered: An evolutionary step in modeling (consumer) behavior. J. Consum. Psychol. 2002, 12, 51–57. [Google Scholar] [CrossRef]
- Suh, A.; Prophet, J. The state of immersive technology research: A literature analysis. Comput. Hum. Behav. 2018, 86, 77–90. [Google Scholar] [CrossRef]
- Gharibi, N. An Eye to the Future: Defining a Framework for the VR Tourism Experience. Ph.D. Dissertation, Te Herenga Waka-Victoria University of Wellington, Wellington, New Zealand, 2023. [Google Scholar]
- Khalida, R.; Setiawati, S. Website Technology Trends for Augmented Reality Development. J. Ilm. Tek. Elektro Komput. Dan Inform. 2020, 6, 11. [Google Scholar] [CrossRef]
- Zhang, G. Design of virtual reality augmented reality mobile platform and game user behavior monitoring using deep learning. Int. J. Electr. Eng. Educ. 2023, 60, 205–221. [Google Scholar] [CrossRef]
- Du, Z.; Liu, J.; Wang, T. Augmented reality marketing: A systematic literature review and an agenda for future inquiry. Front. Psychol. 2022, 13, 925963. [Google Scholar] [CrossRef]
- Oliveira, T.; Martins, M.F. Literature review of information technology adoption models at firm level. Electron. J. Inf. Syst. Eval. 2011, 14, 110–121. [Google Scholar]
- Farrag, H. Augmented Reality in Tourist Guidance. Ann. Fac. Atrs Ain Shams Univ. 2021, 49, 389–405. [Google Scholar]
- Çalışkan, G.; Yayla, İ.; Pamukçu, H. The use of augmented reality technologies in tourism businesses from the perspective of UTAUT2. Eur. J. Innov. Manag. 2025, 28, 1498–1526. [Google Scholar] [CrossRef]
- Allal-Chérif, O. Intelligent cathedrals: Using augmented reality, virtual reality, and artificial intelligence to provide an intense cultural, historical, and religious visitor experience. Technol. Forecast. Soc. Change 2022, 178, 121604. [Google Scholar] [CrossRef]
- Neuburger, L.; Beck, J.; Egger, R. The ‘Phygital’tourist experience: The use of augmented and virtual reality in destination marketing. In Tourism Planning and Destination Marketing; Emerald Publishing Limited: Leeds, UK, 2018; pp. 183–202. [Google Scholar]
- Akmermer, B. The phygital experiential marketing practices: The conceptual framework and applications for tourism industry. In Handbook of Research on Interdisciplinary Reflections of Contemporary Experiential Marketing Practices; IGI Global: Hershey, PA, USA, 2022; pp. 289–309. [Google Scholar]
- Zasornova, I.; Zakharkevich, O.; Zasornov, A.; Kuleshova, S.; Koshevko, J.; Sharan, T. Usage of augmented reality technologies in the light industry. Vlak. A Text. (Fibres Text.) 2021, 28, 3. [Google Scholar]
- Chung, N.; Han, H.; Joun, Y. Tourists’ intention to visit a destination: The role of augmented reality (AR) application for a heritage site. Comput. Hum. Behav. 2015, 50, 588–599. [Google Scholar] [CrossRef]
- Pratt, S.; McCabe, S.; Cortes-Jimenez, I.; Blake, A. Measuring the effectiveness of destination marketing campaigns: Comparative analysis of conversion studies. J. Travel Res. 2010, 49, 179–190. [Google Scholar] [CrossRef]
- Doosti, S.; Jalilvand, M.R.; Asadi, A.; Khazaei Pool, J.; Mehrani Adl, P. Analyzing the influence of electronic word of mouth on visit intention: The mediating role of tourists’ attitude and city image. Int. J. Tour. Cities 2016, 2, 137–148. [Google Scholar] [CrossRef]
- Ayeh, J.K.; Au, N.; Law, R. Predicting the intention to use consumer-generated media for travel planning. Tour. Manag. 2013, 35, 132–143. [Google Scholar] [CrossRef]
- Gibson, A.; O’Rawe, M. Virtual reality as a travel promotional tool: Insights from a consumer travel fair. In Augmented Reality and Virtual Reality: Empowering Human, Place and Business; Springer: Cham, Switzerland, 2018; pp. 93–107. [Google Scholar]
- Do, H.N.; Shih, W.; Ha, Q.A. Effects of mobile augmented reality apps on impulse buying behavior: An investigation in the tourism field. Heliyon 2020, 6, e04667. [Google Scholar] [CrossRef]
- Wei, W. Research progress on virtual reality (VR) and augmented reality (AR) in tourism and hospitality: A critical review of publications from 2000 to 2018. J. Hosp. Tour. Technol. 2019, 10, 539–570. [Google Scholar] [CrossRef]
- Lin, H.F.; Chen, C.H. Combining the technology acceptance model and uses and gratifications theory to examine the usage behavior of an augmented reality tour-sharing application. Symmetry 2017, 9, 113. [Google Scholar] [CrossRef]
- Tom Dieck, M.C.; Jung, T.H.; Rauschnabel, P.A. Determining visitor engagement through augmented reality at science festivals: An experience economy perspective. Comput. Hum. Behav. 2018, 82, 44–53. [Google Scholar] [CrossRef]
- Jingen Liang, L.; Elliot, S. A systematic review of augmented reality tourism research: What is now and what is next? Tour. Hosp. Res. 2021, 21, 15–30. [Google Scholar] [CrossRef]
- Huang, T.L.; Liao, S.L. Creating e-shopping multisensory flow experience through augmented-reality interactive technology. Internet Res. 2017, 27, 449–475. [Google Scholar] [CrossRef]
- Bretos, M.A.; Ibáñez-Sánchez, S.; Orús, C. Applying virtual reality and augmented reality to the tourism experience: A comparative literature review. Span. J. Mark.-ESIC 2024, 28, 287–309. [Google Scholar] [CrossRef]
- Eltobgy, A.E. An Integrated Approach to Stimulate Users’ Involvement Behavior and Visiting Intention In Wadi Degla Virtual Museum Using PLS-SEM Data Analysis. Int. J. Tour. Hosp. Stud. 2024, 6, 104–125. [Google Scholar]
- Chan, T.K.; Cheung, C.M.; Lee, Z.W. The state of online impulse-buying research: A literature analysis. Inf. Manag. 2017, 54, 204–217. [Google Scholar] [CrossRef]
- Tsang, S.S.; Kuo, C.; Hu, T.K.; Wang, W.C. Exploring impacts of AR on group package tours: Destination image, perceived certainty, and experiential value. J. Vacat. Mark. 2023, 29, 84–102. [Google Scholar] [CrossRef]
- Steuer, J.; Biocca, F.; Levy, M.R. Defining virtual reality: Dimensions determining telepresence. Commun. Age Virtual Real. 1995, 33, 33–54. [Google Scholar] [CrossRef]
- Davis, F.D.; Bagozzi, R.P.; Warshaw, P.R. User acceptance of computer technology: A comparison of two theoretical models. Manag. Sci. 1989, 35, 982–1003. [Google Scholar] [CrossRef]
- Çelik, Z.; Uslu, A. Bibliometric analysis of flow theory from past to present with visual mapping technique: A marketing-sided approach. Öneri Derg. 2022, 17, 243–267. [Google Scholar] [CrossRef]
- McLean, G.; Wilson, A. Shopping in the digital world: Examining customer engagement through augmented reality mobile applications. Comput. Hum. Behav. 2019, 101, 210–224. [Google Scholar] [CrossRef]
- Anifa, N.; Sanaji, S. Augmented reality users: The effect of perceived ease of use, perceived usefulness, and customer experience on repurchase intention. J. Bus. Manag. Rev. 2022, 3, 252–274. [Google Scholar] [CrossRef]
- Qin, H.; Peak, D.A.; Prybutok, V. A virtual market in your pocket: How does mobile augmented reality (MAR) influence consumer decision making? J. Retail. Consum. Serv. 2021, 58, 102337. [Google Scholar] [CrossRef]
- Griffin, T.; Guttentag, D.; Lee, S.H.; Giberson, J.; Dimanche, F. Is VR always better for destination marketing? Comparing different media and styles. J. Vacat. Mark. 2023, 29, 119–140. [Google Scholar] [CrossRef]
- Gkoumas, A. Evaluating a standard for sustainable tourism through the lenses of local industry. Heliyon 2019, 5, e02707. [Google Scholar] [CrossRef] [PubMed]
- Yung, R.; Khoo-Lattimore, C.; Prayag, G.; Surovaya, E. Around the world in less than a day: Virtual reality, destination image and perceived destination choice risk in family tourism. Tour. Recreat. Res. 2021, 46, 3–18. [Google Scholar] [CrossRef]
- Bonnin, G. The roles of perceived risk, attractiveness of the online store and familiarity with AR in the influence of AR on patronage intention. J. Retail. Consum. Serv. 2020, 52, 101938. [Google Scholar] [CrossRef]
- Heller, J.; Chylinski, M.; de Ruyter, K.; Mahr, D.; Keeling, D.I. Let me imagine that for you: Transforming the retail frontline through augmenting customer mental imagery ability. J. Retail. 2019, 95, 94–114. [Google Scholar] [CrossRef]
- Xia, Y.X.; Chae, S.W.; Xiang, Y.C. How social and media cues induce live streaming impulse buying? SOR model perspective. Front. Psychol. 2024, 15, 1379992. [Google Scholar] [CrossRef] [PubMed]
- Kim, M.J.; Lee, C.K.; Jung, T. Exploring consumer behavior in virtual reality tourism using an extended stimulus-organism-response model. J. Travel Res. 2020, 59, 69–89. [Google Scholar] [CrossRef]
- Bae, S.; Jung, T.H.; Moorhouse, N.; Suh, M.; Kwon, O. The influence of mixed reality on satisfaction and brand loyalty in cultural heritage attractions: A brand equity perspective. Sustainability 2020, 12, 2956. [Google Scholar] [CrossRef]
- Lee, S.A.; Lee, M.; Jeong, M. The role of virtual reality on information sharing and seeking behaviors. J. Hosp. Tour. Manag. 2021, 46, 215–223. [Google Scholar] [CrossRef]
- Barhorst, J.B.; McLean, G.; Shah, E.; Mack, R. Blending the real world and the virtual world: Exploring the role of flow in augmented reality experiences. J. Bus. Res. 2021, 122, 423–436. [Google Scholar] [CrossRef]
- Zhang, D.; Yao, H. Research on Consumers’ Intention to Use and Promote Augmented Reality. In Proceedings of the 2023 2nd International Conference on Social Sciences and Humanities and Arts, Chengdu, China, 24–26 February 2023; pp. 1245–1253. [Google Scholar]
- Argyriou, E. Consumer intentions to revisit online retailers: A mental imagery account. Psychol. Mark. 2012, 29, 25–35. [Google Scholar] [CrossRef]
- Huang, T.L.; Chung, H.F. Impact of delightful somatosensory augmented reality experience on online consumer stickiness intention. J. Res. Interact. Mark. 2024, 18, 6–30. [Google Scholar] [CrossRef]
- Mou, Y.; Fan, J.; Ding, Z.; Khan, I. Impact of virtual reality immersion on customer experience: Moderating effect of cross-sensory compensation and social interaction. Asia Pac. J. Mark. Logist. 2024, 36, 26–47. [Google Scholar] [CrossRef]
- Hsu, W.C.; Lee, M.H.; Zheng, K.W. From virtual to reality: The power of augmented reality in triggering impulsive purchases. J. Retail. Consum. Serv. 2024, 76, 103604. [Google Scholar] [CrossRef]
- Barta, S.; Gurrea, R.; Flavián, C. Using augmented reality to reduce cognitive dissonance and increase purchase intention. Comput. Hum. Behav. 2023, 140, 107564. [Google Scholar] [CrossRef]
- Vishwakarma, P.; Mukherjee, S.; Datta, B. Antecedents of adoption of virtual reality in experiencing destination: A study on the Indian consumers. Tour. Recreat. Res. 2020, 45, 42–56. [Google Scholar] [CrossRef]
- Lee, W.J. Use of immersive virtual technology in consumer retailing and its effects to consumer. J. Distrib. Sci. 2020, 18, 5–15. [Google Scholar]
- Rasul, T.; Lim, W.M.; O’Connor, P.; Ahmad, A.; Farhat, K.; de Oliveira Santini, F.; Junior Ladeira, W. Immersive virtual reality experiences: Boosting potential visitor engagement and attractiveness of natural world heritage sites. Asia Pac. J. Tour. Res. 2024, 29, 515–526. [Google Scholar] [CrossRef]
- Wang, X.; Butt, A.H.; Zhang, Q.; Shafique, M.N.; Ahmad, H.; Nawaz, Z. Gaming avatar can influence sustainable healthy lifestyle: Be like an avatar. Sustainability 2020, 12, 1998. [Google Scholar] [CrossRef]
- Xie, T.; Zheng, L.; Liu, G.; Liu, L. Exploring structural relations among computer self-efficacy, perceived immersion, and intention to use virtual reality training systems. Virtual Real. 2022, 26, 1725–1744. [Google Scholar] [CrossRef] [PubMed]
- Magdi Orabi, R. The Influence of Experiential Value of Augmented Reality Technology on Destination Visit Intention: Evidence from A Multi-Mediation Model. J. Fac. Tour. Hotel. Mansoura Univ. 2020, 8, 117–188. [Google Scholar] [CrossRef]
- Hassan, M.; Mansour, A.; Osman, M.; Abdelkareem, M. Land use/cover change detection in the coastal zone of Safaga region, Red Sea, Egypt. SVU-Int. J. Agric. Sci. 2023, 5, 1–12. [Google Scholar] [CrossRef]
- Kline, R.B. Principles and Practice of Structural Equation Modeling; Guilford Publications: New York, NY, USA, 2023. [Google Scholar]
- Etikan, I.; Musa, S.A.; Alkassim, R.S. Comparison of convenience sampling and purposive sampling. Am. J. Theor. Appl. Stat. 2016, 5, 1–4. [Google Scholar] [CrossRef]
- Johanson, G.A.; Brooks, G.P. Initial scale development: Sample size for pilot studies. Educ. Psychol. Meas. 2010, 70, 394–400. [Google Scholar] [CrossRef]
- Hoang, S.D.; Dey, S.K.; Tučková, Z.; Pham, T.P. Harnessing the power of virtual reality: Enhancing telepresence and inspiring sustainable travel intentions in the tourism industry. Technol. Soc. 2023, 75, 102378. [Google Scholar] [CrossRef]
- Goedegebure, R.P.; Van Herpen, E.; Van Trijp, H.C. Using product popularity to stimulate choice for light products in supermarkets: An examination in virtual reality. Food Qual. Prefer. 2020, 79, 103786. [Google Scholar] [CrossRef]
- Chung, N.; Lee, H.; Kim, J.Y.; Koo, C. The role of augmented reality for experience-influenced environments: The case of cultural heritage tourism in Korea. J. Travel Res. 2018, 57, 627–643. [Google Scholar] [CrossRef]
- Jennett, C.; Cox, A.L.; Cairns, P.; Dhoparee, S.; Epps, A.; Tijs, T.; Walton, A. Measuring and defining the experience of immersion in games. Int. J. Hum.-Comput. Stud. 2008, 66, 641–661. [Google Scholar] [CrossRef]
- Yersüren, S.; Özel, Ç.H. The effect of virtual reality experience quality on destination visit intention and virtual reality travel intention. J. Hosp. Tour. Technol. 2024, 15, 70–103. [Google Scholar] [CrossRef]
- Hair, J.F.; Black, W.C.; Babin, B.J.; Anderson, R.E. Multivariate Data Analysis, 7th ed.; Prentice Hall: Englewood Cliffs, NJ, USA, 2014. [Google Scholar]
- Fornell, C.; Larcker, D.F. Evaluating structural equation models with unobservable variables and measurement error. J. Mark. Res. 1981, 18, 39–50. [Google Scholar] [CrossRef]
- Henseler, J.; Ringle, C.M.; Sarstedt, M. A new criterion for assessing discriminant validity in variance-based structural equation modeling. J. Acad. Mark. Sci. 2015, 43, 115–135. [Google Scholar] [CrossRef]
- Martin, J.; Mortimer, G.; Andrews, L. Re-examining online customer experience to include purchase frequency and perceived risk. J. Retail. Consum. Serv. 2015, 25, 81–95. [Google Scholar] [CrossRef]
- Javeed, S.; Rasool, G.; Pathania, A. Augmented reality in marketing: A close look at the current landscape and future possibilities. Mark. Intell. Plan. 2024, 42, 725–745. [Google Scholar] [CrossRef]
- Hinsch, C.; Felix, R.; Rauschnabel, P.A. Nostalgia beats the wow-effect: Inspiration, awe and meaningful associations in augmented reality marketing. J. Retail. Consum. Serv. 2020, 53, 101987. [Google Scholar] [CrossRef]
- Tom Dieck, M.C.; Jung, T.; Han, D.I. Mapping requirements for the wearable smart glasses augmented reality museum application. J. Hosp. Tour. Technol. 2016, 7, 230–253. [Google Scholar] [CrossRef]
- Chekima, B.; Wafa, S.A.W.S.K.; Igau, O.A.; Chekima, S. Determinant factors of consumers’ green purchase intention: The moderating role of environmental advertising. Asian Soc. Sci. 2015, 11, 318. [Google Scholar] [CrossRef]
- Bird, J.M.; Smart, P.A.; Harris, D.J.; Phillips, L.A.; Giannachi, G.; Vine, S.J. A magic leap in tourism: Intended and realized experience of head-mounted augmented reality in a museum context. J. Travel Res. 2023, 62, 1427–1447. [Google Scholar] [CrossRef]
- Qiao, X.; Ren, P.; Dustdar, S.; Liu, L.; Ma, H.; Chen, J. Web AR: A promising future for mobile augmented reality—State of the art, challenges, and insights. Proc. IEEE 2019, 107, 651–666. [Google Scholar] [CrossRef]
- Kounavis, C.D.; Kasimati, A.E.; Zamani, E.D. Enhancing the tourism experience through mobile augmented reality: Challenges and prospects. Int. J. Eng. Bus. Manag. 2012, 4, 10. [Google Scholar] [CrossRef]


| Characteristics | Group/Category | Frequency | Percent |
|---|---|---|---|
| Gender | Female | 248 | 64.6 |
| Male | 136 | 35.4 | |
| Age group | 18–24 | 164 | 42.7 |
| 25–34 | 140 | 36.5 | |
| 35–44 | 66 | 17.2 | |
| 45–54 | 8 | 2.1 | |
| 55+ | 6 | 1.6 | |
| Travel frequency | Once a year | 136 | 35.4 |
| Between 1 and 3 times a year | 181 | 47.1 | |
| More than 3 times a year | 67 | 17.4 | |
| Nationality | Egyptian | 101 | 26.3 |
| American | 44 | 11.45 | |
| British | 42 | 10.9 | |
| Asian | 75 | 19.5 | |
| Other | 122 | 31.7 |
| Constructs | Code | Statement | Source |
|---|---|---|---|
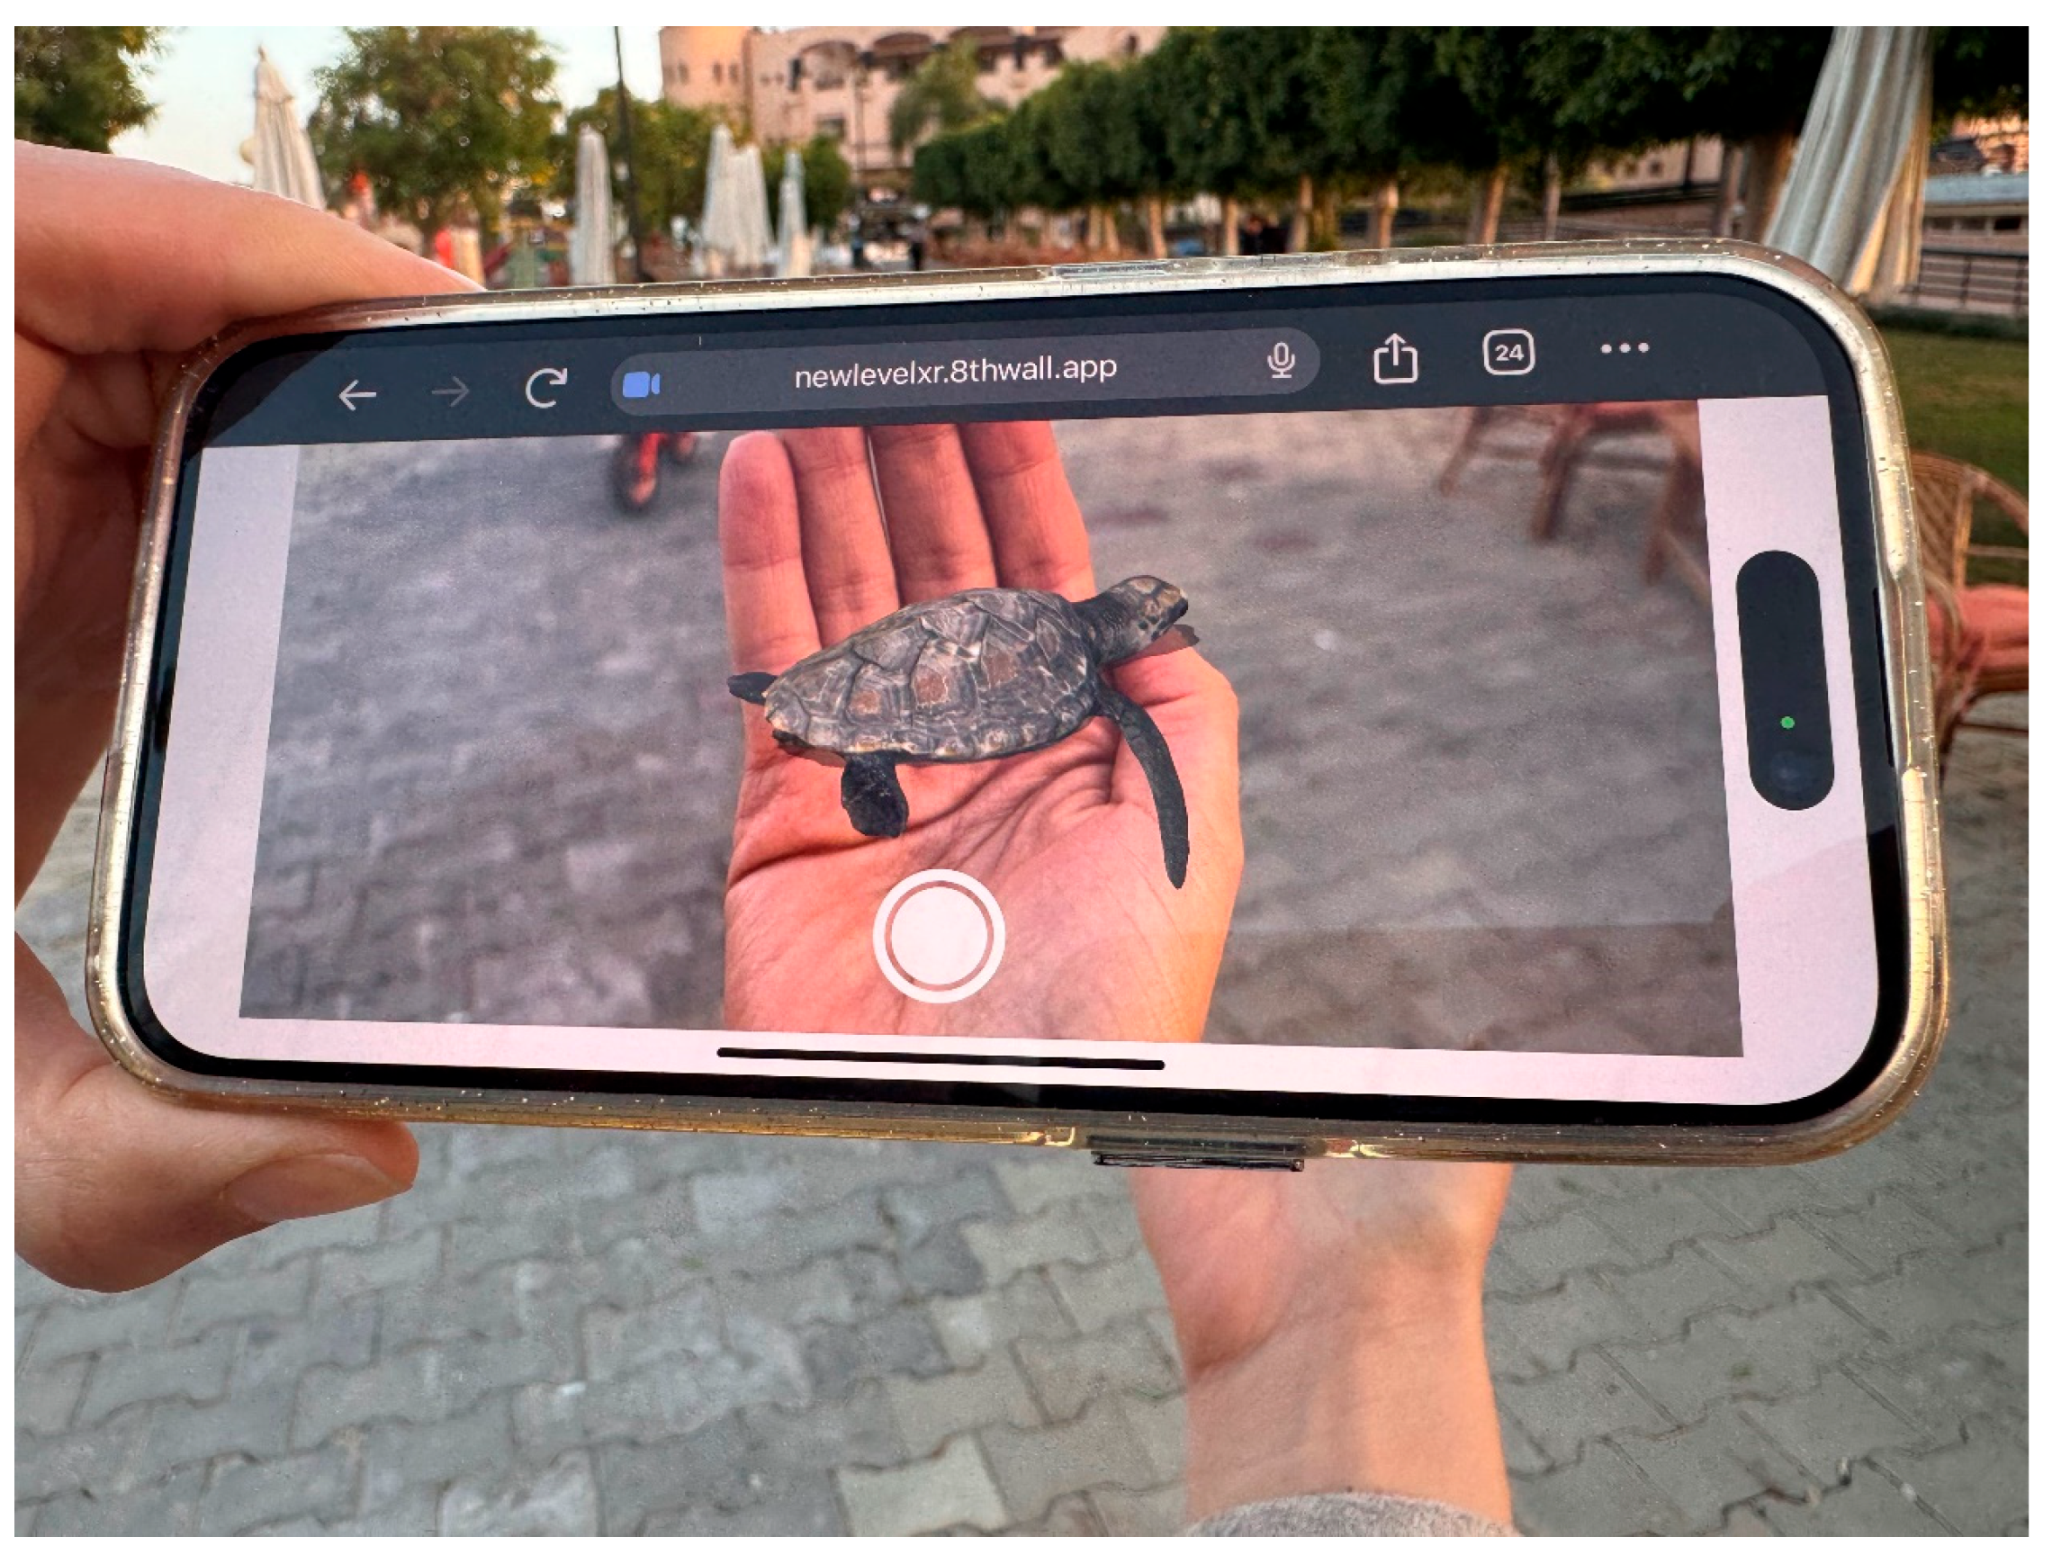
| Interactivity | INT1 | I was in control of my navigation through the Web AR. | [10] |
| INT2 | I had some control over the content (sea turtle) of the augmented reality technology (Web AR) that I wanted to see. | ||
| INT3 | I was in control over the pace (speed) to watch the digital objects (sea turtle). | ||
| INT4 | The augmented reality technology (Web AR) had the ability to respond to my specific needs quickly and efficiently. | ||
| Vividness | VIV1 | The visual display (sea turtle) through the AR technology was clear | [10] |
| VIV2 | The visual display (sea turtle) through AR was detailed. | ||
| VIV3 | The visual display (sea turtle) through AR was vague. | ||
| VIV4 | The visual display (sea turtle) through AR was vivid. | ||
| VIV5 | The visual display (sea turtle) through AR was sharp. | ||
| VIV6 | The visual display (sea turtle) through AR was well defined. | ||
| Perceived ease of use | PEU1 | The interaction with the Web AR is clear and understandable. | [75] |
| PEU2 | The interaction with the Web AR does not require a lot of effort. | ||
| PEU3 | I find Web AR easy to use. | ||
| PEU4 | I find it easy to access the desired information through the Web AR. | ||
| Perceived usefulness | PU1 | Through the Web AR, I can more quickly get an impression of Safaga red sea. | [75] |
| PU2 | Due to the Web AR, I can easily evaluate the Safaga red sea. | ||
| PU3 | By using the Web AR, I can better evaluate Safaga red sea. | ||
| PU4 | I find the Web AR useful to look at Safaga red sea. | ||
| PU5 | Overall, I find that the Web AR is useful to get an impression of Safaga red sea. | ||
| Perceived certainty | PC1 | It is likely that this destination meets my expectations. | [76] |
| PC2 | It is likely that I’m satisfied with this destination. | ||
| PC3 | There is a higher chance that this destination does not disappoint. | ||
| PC4 | Visiting this destination is probably a good choice. | ||
| Perceived enjoyment | PE1 | I had fun using Web AR. | [77] |
| PE2 | Using Web AR provided me with a lot of enjoyment. | ||
| PE3 | I enjoyed using Web AR. | ||
| PE4 | Using Web AR did not bore me. | ||
| Perceived immersion | PI1 | Once into the Web AR, I was unaware of what was happening around me. | [65,78] |
| PI2 | Once into the Web AR, I felt disconnected from outside world. | ||
| PI3 | I felt that I was actually traveling during my experience of Web AR. | ||
| PI4 | During Web AR, I feel in another world. | ||
| Destination visit intention | DV1 | Based on my Web AR experience, I will visit this destination in the future | [79] |
| DV2 | I intend to visit the destination I experienced in Web AR in the near future. | ||
| DV3 | I would not want to visit this destination after this Web AR experience. | ||
| DV4 | I would recommend the destination I experienced in Web AR to others. |
| Constructs | Code | Factor Loading | CA | (CR) | (AVE) | HTMT |
|---|---|---|---|---|---|---|
| Interactivity | INT1 | 0.667 | 0.745 | 0.746 | 0.424 | 0.746 |
| INT4 | 0.661 | |||||
| INT2 | 0.640 | |||||
| INT3 | 0.636 | |||||
| Vividness | VIV6 | 0.783 | 0.822 | 0.858 | 0.549 | 0.864 |
| VIV2 | 0.775 | |||||
| VIV4 | 0.767 | |||||
| VIV1 | 0.734 | |||||
| VIV5 | 0.635 | |||||
| Perceived ease of use | PEU3 | 0.783 | 0.822 | 0.806 | 0.511 | 0.815 |
| PEU1 | 0.729 | |||||
| PEU4 | 0.728 | |||||
| PEU2 | 0.608 | |||||
| Perceived usefulness | PU2 | 0.867 | 0.919 | 0.918 | 0.694 | 0.920 |
| PU5 | 0.836 | |||||
| PU3 | 0.834 | |||||
| PU4 | 0.834 | |||||
| PU1 | 0.793 | |||||
| Perceived certainty | PC1 | 0.849 | 0.858 | 0.871 | 0.629 | 0.880 |
| PC2 | 0.829 | |||||
| PC4 | 0.781 | |||||
| PC3 | 0.708 | |||||
| Perceived enjoyment | PE3 | 0.897 | 0.905 | 0.906 | 0.707 | 0.914 |
| PE2 | 0.862 | |||||
| PE1 | 0.830 | |||||
| PE4 | 0.770 | |||||
| Perceived immersion | PI4 | 0.874 | 0.870 | 0.855 | 0.600 | 0.887 |
| PI3 | 0.869 | |||||
| PI2 | 0.681 | |||||
| PI1 | 0.647 | |||||
| Destination visit intention | DV2 | 0.868 | 0.854 | 0.894 | 0.737 | 0.895 |
| DV1 | 0.865 | |||||
| DV4 | 0.844 |
| Constructs | Interactivity | Vividness | Perceived Ease of Use | Perceived Usefulness | Perceived Certainty | Perceived Enjoyment | Perceived Immersion | Destination Visit Intention |
|---|---|---|---|---|---|---|---|---|
| Interactivity | 0.651 | |||||||
| Vividness | 0.571 | 0.740 | ||||||
| Perceived ease of use | 0.556 | 0.625 | 0.714 | |||||
| Perceived usefulness | 0.549 | 0.558 | 0.403 | 0.833 | ||||
| Perceived certainty | 0.426 | 0.507 | 0.574 | 0.364 | 0.793 | |||
| Perceived enjoyment | 0.639 | 0.610 | 0.627 | 0.561 | 0.460 | 0.707 | ||
| Perceived immersion | 0.456 | 0.464 | 0.455 | 0.410 | 0.389 | 0.621 | 0.774 | |
| Destination visit intention | 0.644 | 0.658 | 0.714 | 0.696 | 0.653 | 0.797 | 0.634 | 0.858 |
| Relationship | Standardized Path Coefficient (β) | Standard Error | Result |
|---|---|---|---|
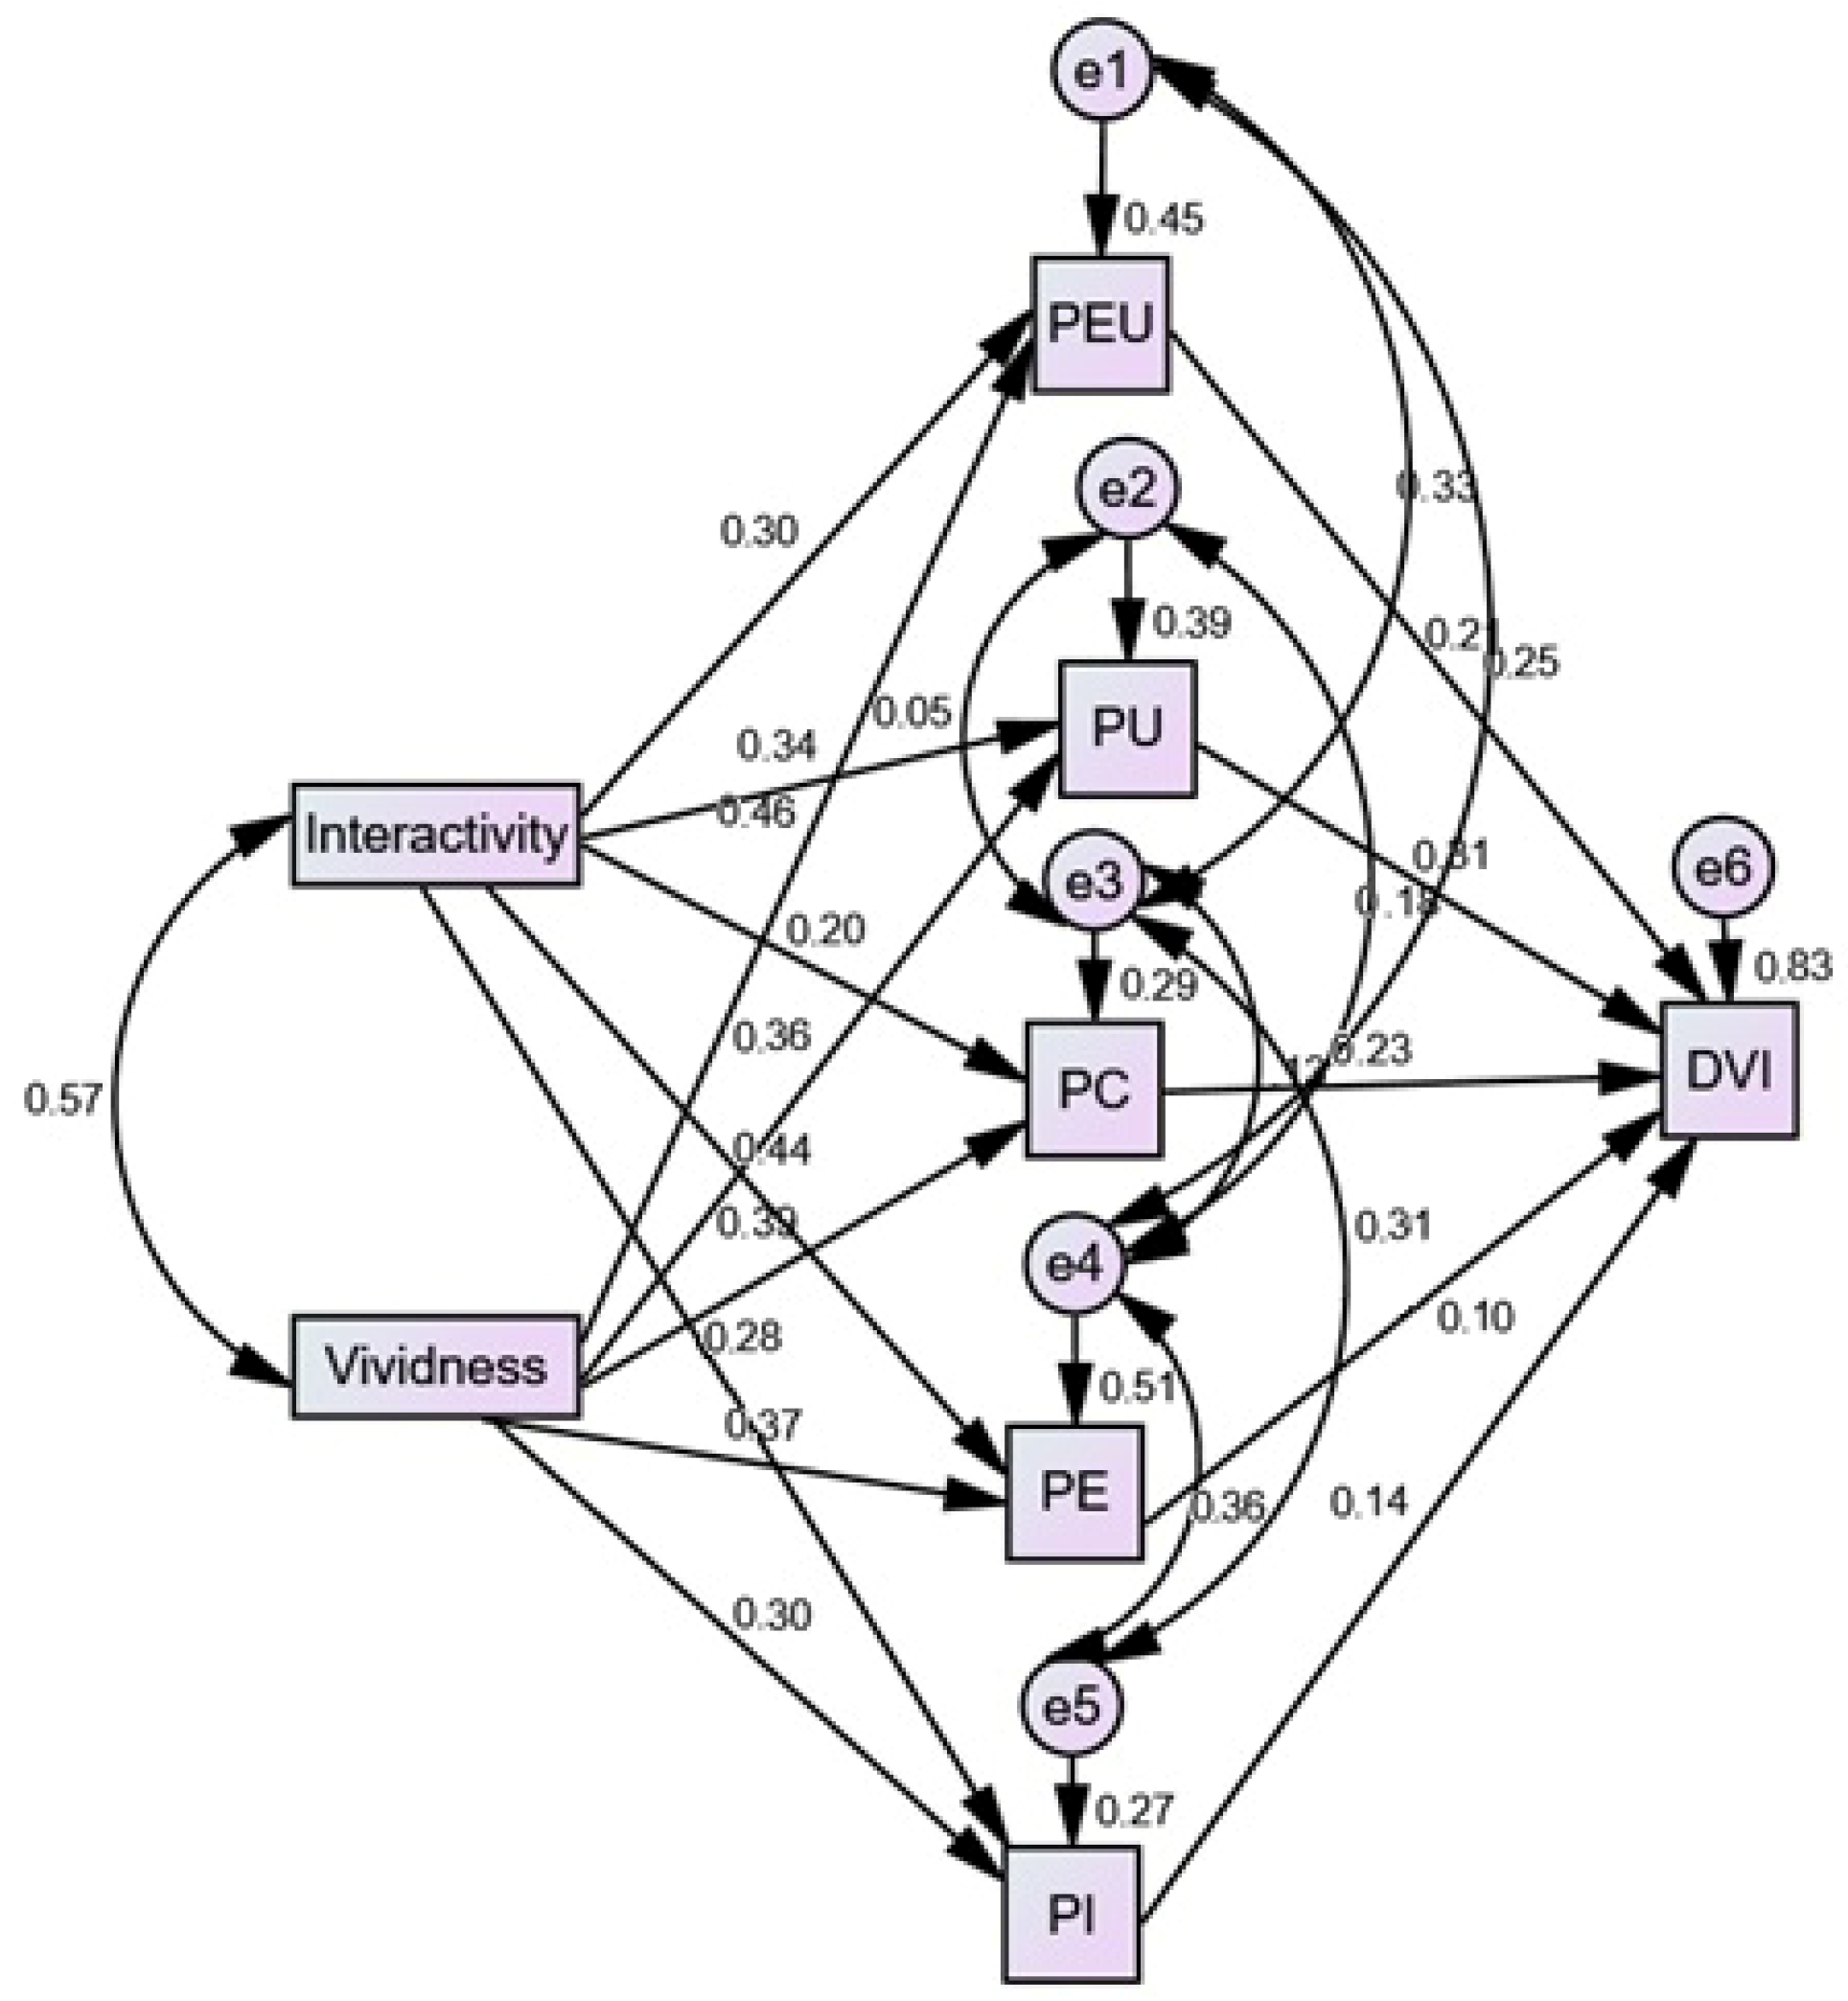
| H1a: Interactivity → Perceived ease of use | 0.296 *** | 0.039 | Supported |
| H1b: Interactivity → Perceived usefulness | 0.342 *** | 0.044 | Supported |
| H1c: Interactivity → Perceived certainty | 0.203 *** | 0.051 | Supported |
| H1d: Interactivity → Perceived enjoyment | 0.436 *** | 0.034 | Supported |
| H1e: Interactivity → Perceived immersion | 0.284 *** | 0.033 | Supported |
| H2a: Vividness → Perceived ease of use | 0.456 *** | 0.045 | Supported |
| H2b: Vividness → Perceived usefulness | 0.363 *** | 0.051 | Supported |
| H2c: Vividness → Perceived certainty | 0.393 *** | 0.059 | Supported |
| H2d: Vividness → Perceived enjoyment | 0.368 *** | 0.039 | Supported |
| H2e: Vividness → Perceived immersion | 0.302 *** | 0.038 | Supported |
| H3: Perceived ease of use → Destination visit intention | 0.212 *** | 0.023 | Supported |
| H4: Perceived usefulness → Destination visit intention | 0.305 *** | 0.018 | Supported |
| H5: Perceived certainty → Destination visit intention | 0.233 *** | 0.018 | Supported |
| H6: Perceived enjoyment → Destination visit intention | 0.309 *** | 0.027 | Supported |
| H7: Perceived immersion → Destination visit intention | 0.138 *** | 0.028 | Supported |
Disclaimer/Publisher’s Note: The statements, opinions and data contained in all publications are solely those of the individual author(s) and contributor(s) and not of MDPI and/or the editor(s). MDPI and/or the editor(s) disclaim responsibility for any injury to people or property resulting from any ideas, methods, instructions or products referred to in the content. |
© 2025 by the authors. Licensee MDPI, Basel, Switzerland. This article is an open access article distributed under the terms and conditions of the Creative Commons Attribution (CC BY) license (https://creativecommons.org/licenses/by/4.0/).
Share and Cite
Aggag, A.; Kortam, W. Using Augmented Reality to Improve Tourism Marketing Effectiveness. Sustainability 2025, 17, 5747. https://doi.org/10.3390/su17135747
Aggag A, Kortam W. Using Augmented Reality to Improve Tourism Marketing Effectiveness. Sustainability. 2025; 17(13):5747. https://doi.org/10.3390/su17135747
Chicago/Turabian StyleAggag, Alaa, and Wael Kortam. 2025. "Using Augmented Reality to Improve Tourism Marketing Effectiveness" Sustainability 17, no. 13: 5747. https://doi.org/10.3390/su17135747
APA StyleAggag, A., & Kortam, W. (2025). Using Augmented Reality to Improve Tourism Marketing Effectiveness. Sustainability, 17(13), 5747. https://doi.org/10.3390/su17135747