Article

Research on the Evaluation of Service Effectiveness of Urban Greenways: Taking Municipal Greenways in the Main City of Nanjing as an Example

College of Landscape Architecture, Nanjing Forestry University, Nanjing 210037, China
*
Author to whom correspondence should be addressed.
Sustainability 2025, 17(13), 5745; https://doi.org/10.3390/su17135745
Submission received: 22 May 2025 / Revised: 19 June 2025 / Accepted: 20 June 2025 / Published: 22 June 2025

Abstract

:
As an important green infrastructure, urban greenways can provide a range of socio-ecological benefits and play an important role in improving the urban ecological environment and enhancing the quality of living. Currently, the relationship between service quality and the actual benefits of greenways has not been sufficiently explored in urban greenway research. This study introduces the concept of “efficiency”, determines service efficiency and service effectiveness as the evaluation dimensions, selects 4 first-level indicators and 12 second-level indicators to evaluate the service efficiency of greenways, and constructs an evaluation model using a combination of subjective and objective assignments. This study uses the overall service effectiveness index and the efficiency–effectiveness balance index to measure the overall performance of the greenway space in the hope of revealing the key factors and reasons that affect the service effectiveness of the greenway and providing a theoretical basis for optimizing the planning and management of the greenway. Using ArcGIS network analysis technology, image semantic segmentation technology, a questionnaire survey, network text analysis, and other methods to quantify the indicators, this paper conducts an empirical study on four municipal greenways in Nanjing. This research shows that the factors affecting the service effectiveness of greenways mainly include the landscape environment, greenway functions, transportation conditions, and supporting facility factors. The contradiction between the single-function positioning and the variety of user needs is the main reason for the imbalance between the efficiency and effectiveness of urban greenways. This study provides a new path to quantify greenway service effectiveness and enriches the greenway evaluation theory.

1. Introduction

The idea of greenways originated with Frederick Law Olmsted’s plan for the “Emerald Necklace” of Boston’s park system, the completion of which in 1895 marked the first modern greenway [1]. The concept of “greenways” was formalized in 1987 in the U.S. Presidential Commission’s America’s Great Outdoors Report [2]. In the 1990s, scholars such as Charles Little, J.G. Fábos, and Turner T. successively defined greenway from different perspectives, gradually enriching its connotation. In 2002, Jack Ahern proposed a landmark definition, interpreting greenway as “a linear network of land that is planned, designed and managed for ecological, recreational, cultural, aesthetic or other purposes, and that is compatible with the concept of sustainable land use”. This definition not only emphasizes the linear spatial structure and connectivity of greenways but also highlights their ecological, social, cultural, and other multi-functional attributes, as well as the principle of sustainability in planning and management, which lays an important foundation for the subsequent theoretical research and practical application of greenways [3].
With the deteriorating global ecological environment and rapid urban development in the 21st century, people have become more and more interested in the emerging landscape planning concept of greenways, and greenway planning has been widely used in urban planning concepts and strategies. In the process of modern urban construction, urban greenways are usually regarded as ecological infrastructures of strategic significance [4]. As a form of adaptation, greenways help to mitigate and offset the loss of natural landscapes due to increased urbanization [5]. From a social perspective, in addition to meeting ecological needs, urban greenways can expand urban recreational and service facilities, provide satisfactory social services to urban residents and tourists, stimulate brownfield remediation and redevelopment, further explore the potential for urban development, and promote the economic development of urban societies [6,7]. As outdoor activity spaces open to the public, urban greenways have clear public service attributes and social service values. Identifying how to optimize the public service capacity of urban greenways and effectively improve the environmental quality of greenways has become a core issue in international greenway planning.
Effectiveness implies the ability to achieve goals individually or collectively and covers the combined effects of efficiency and effectiveness. Compared with efficiency, effectiveness focuses more on the quality dimension. Efficacy assessment has its roots in public management theory in Western countries, which emphasizes market or customer demand orientation, performance management, service quality, and effectiveness [8]. The overall context includes cost, efficiency, effectiveness, and social equity [9]. The ultimate goal is to use relevant information to improve organizational performance and lead to continuous improvement in the quality and level of public services [10]. In recent years, under the concepts of “people-centeredness” and “sustainable development”, the concept of effectiveness has been introduced into comprehensive evaluation studies of public space in order to more effectively and comprehensively evaluate the performance and operation of public space [11]. Current research on “service effectiveness” emphasizes the public good and service nature of urban management, including the service goals set by service providers, the process of achieving those goals, and the resulting service outcomes [12].
For a long time, the evaluation of urban greenways has mainly focused on user perception [13,14,15], the usage characteristics and limiting factors of the greenways [16,17,18], and the promotion of residents’ physical and mental health [19,20,21,22,23]. Studies have mostly explored greenway conditions and design preferences from a user demand-side perspective [24] or used supply-side approaches to assess user attitudes [25]. Influenced by the research on the evaluation of the supply and demand of urban green space [26,27], the assessment of the supply level of urban greenways has emerged in greenway research. Scholars have mostly drawn on the evaluation method of the environmental quality of urban green space, using spatial service efficiency as an indicator and spatial quantification to explore the service quality of greenways [11,28] and to judge whether the service capacity of greenways matches the recreational needs of users [29]. In previous studies, scholars have found it difficult to comprehensively reflect the complete service characteristics of greenways in urban greenway assessment. And few scholars have started from the reality of the mismatch between the construction situation and the construction goals of urban greenways and combined multiple subjective and objective factors of personal attributes and physical environment attributes to comprehensively evaluate the social service effectiveness of urban greenways.
Therefore, identifying how to systematically evaluate the service effectiveness of greenways and provide a scientific basis for optimizing the planning, construction, and management of greenways, so as to meet the rising public demand for high-quality public space, has become an important proposition for urban greenway research. This study is based on the special characteristics of urban greenway function and space, and it introduces the concept of effectiveness. It aims to construct a scientific and comprehensive evaluation system of urban greenway service effectiveness to examine the connection between the construction status and the utilization effect of urban greenways and provide planning guidance for greenway practice, which is of great significance in enhancing public satisfaction and improving the image and quality of urban greenways. This study selects municipal greenways in the main city of Nanjing for empirical research and evaluates the service efficiency of greenways using geographic data based on the “15-min city concept” [30,31], accessibility studies, and the connectivity characteristics of greenways [32]. The spatial service quality of greenways is analyzed using an image semantic segmentation technique based on the requirements of greenway components [33,34,35]. By collecting users’ opinions through questionnaires and online text data, we evaluate users’ satisfaction and experience to judge the service effect of the greenway [36,37]. Then, a quantitative model is constructed using a subjective–objective combination of empowerment to help calculate greenway service effectiveness. This study not only expands the research scope of urban greenway evaluation at the theoretical level, but it also helps designers and greenway managers improve greenway service quality and resource allocation efficiency in practice, thus promoting the benign development of urban greenway construction.

2. Relevant Research and Theoretical Frameworks

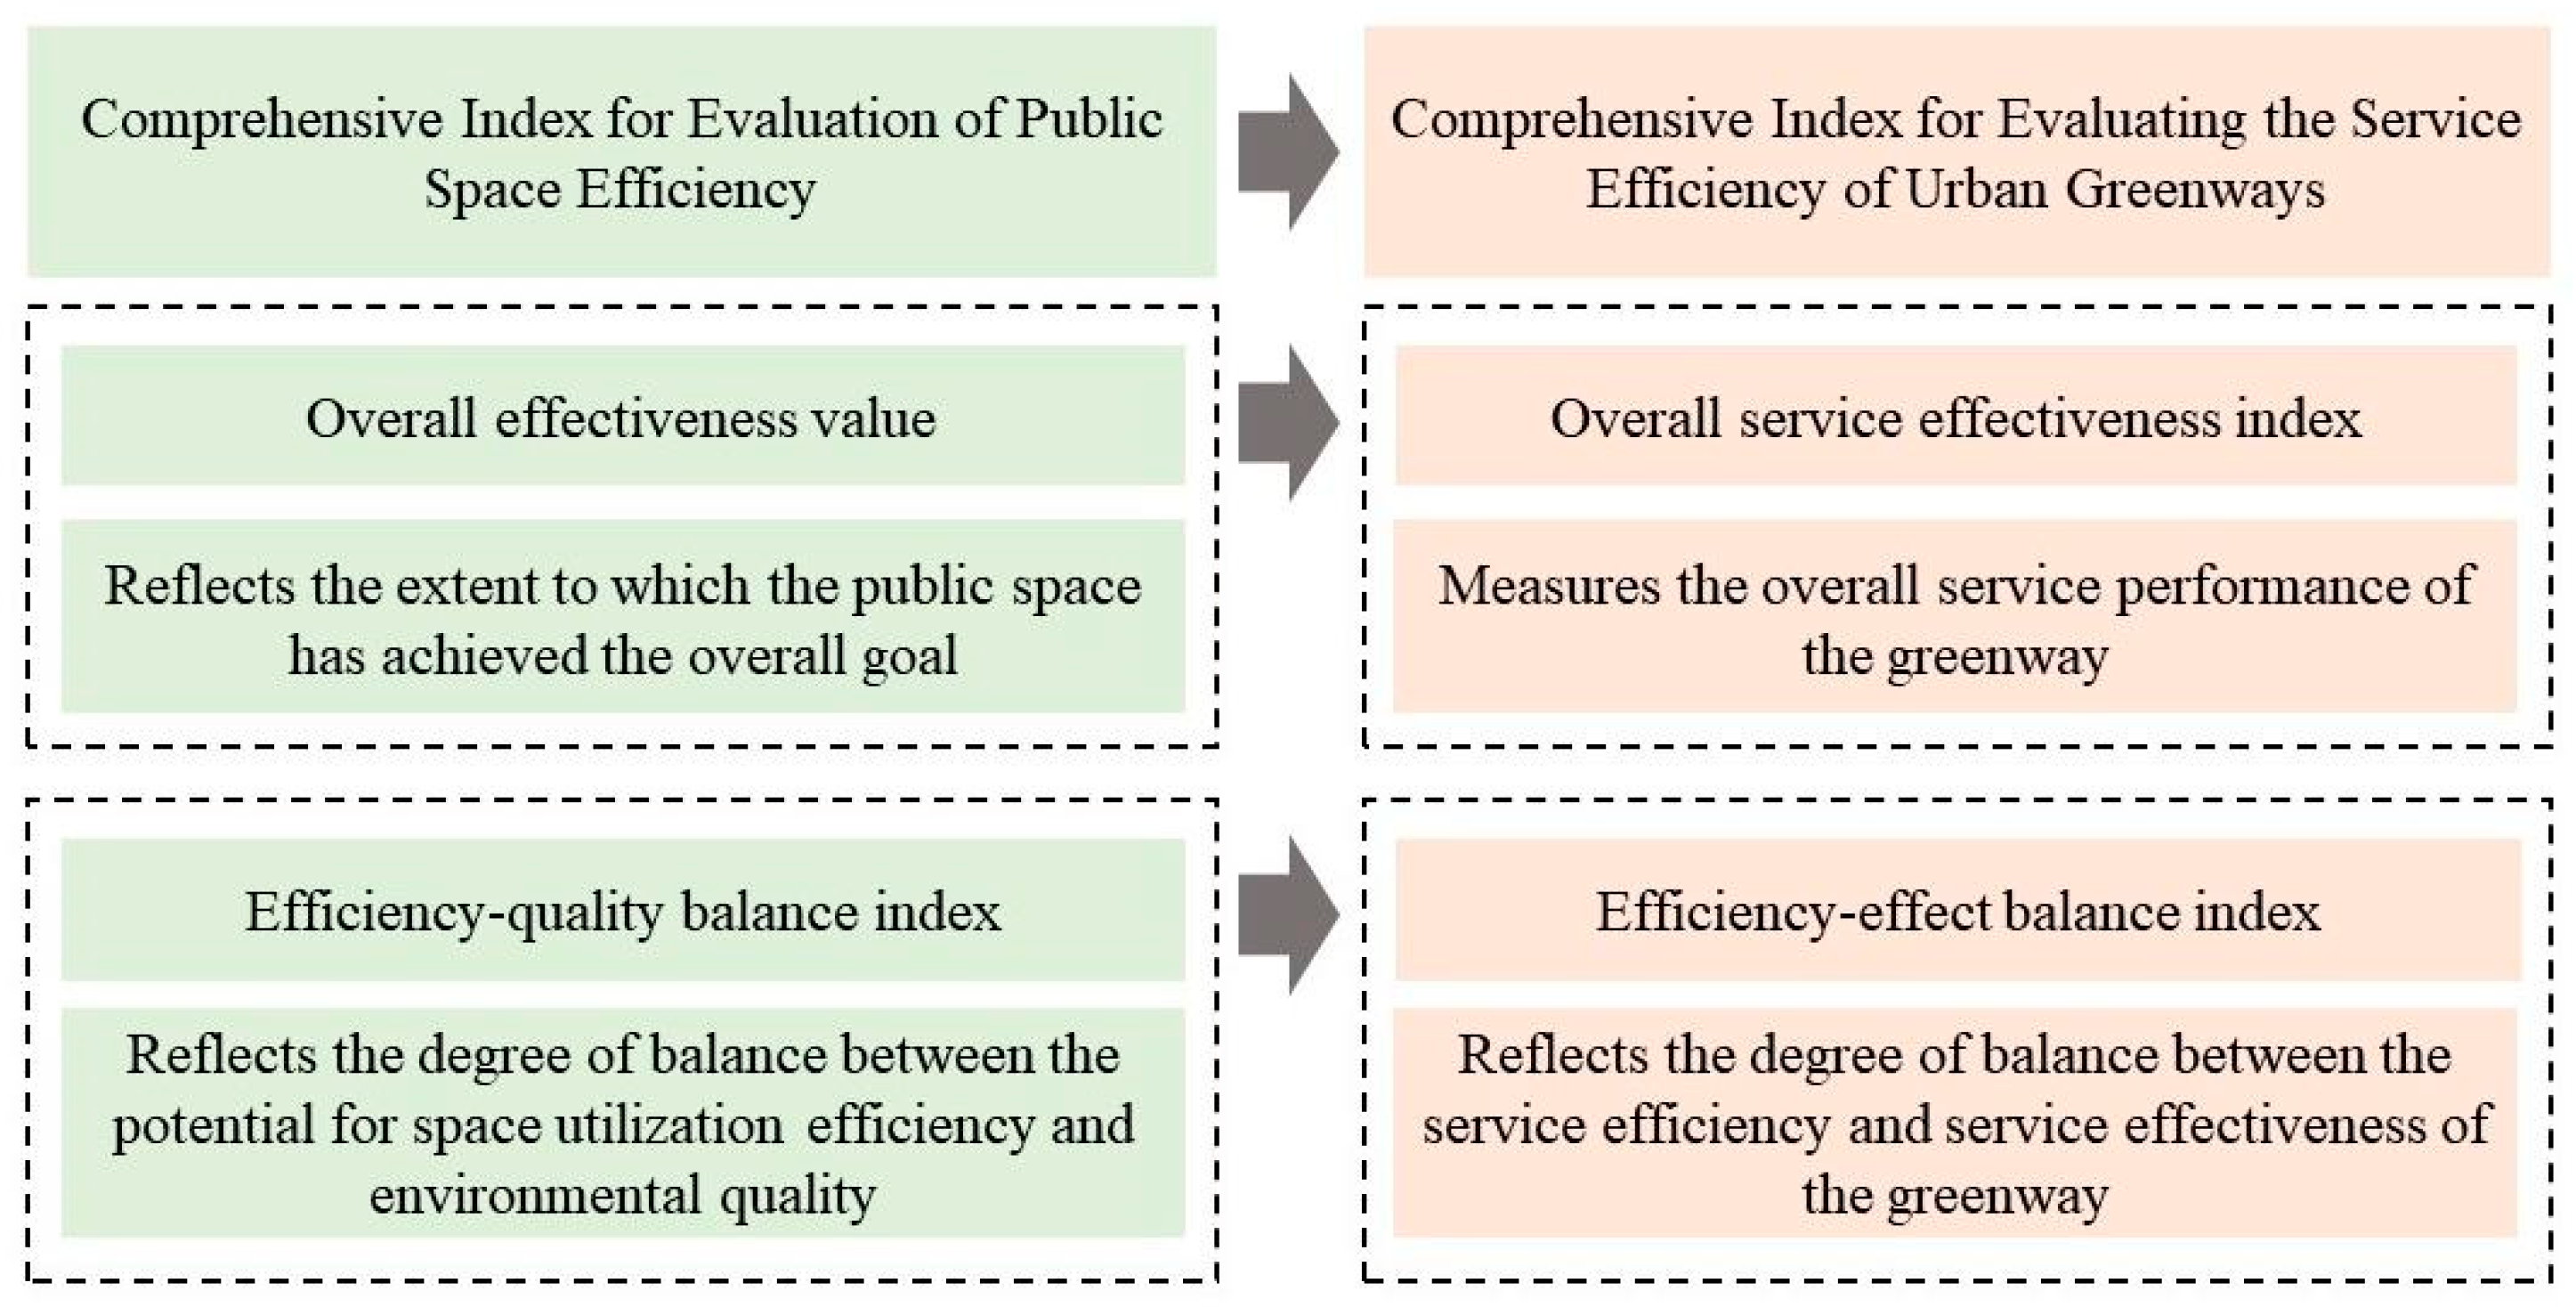
2.1. Theoretical Framework

The evaluation of public service effectiveness consists of four core dimensions: efficiency, effectiveness, responsiveness, and fairness [38]. Among them, the dimension of efficiency and benefit mainly depends on the quantitative index system of objective data, emphasizing the actual results after the implementation of services, and often using indicators, such as the service coverage rate and the target achievement rate, to judge the effectiveness of public services in social benefit output. Responsiveness and fairness indicators, mainly based on the results of public satisfaction surveys, focus on evaluating the feedback of service demand, supply matching, and the balance of resource allocation (Table 1).
Based on the above research on the evaluation system of public service effectiveness, a theoretical model for the evaluation of greenway service effectiveness was established (Figure 1), and the quantitative measurement of service efficiency and the systematic assessment of service effect were identified as the two core dimensions of greenway service effectiveness evaluation research.

2.2. Relevant Indicators of Urban Greenway Service Efficiency Evaluation

Service efficiency can judge the actual effectiveness of greenway services from a supply perspective. Connectivity is one of the most important characteristics and functions of greenways [3]. The connection efficiency index is selected to measure the ease with which users can access and use a greenway [12]. According to a green space accessibility study [32], the service scope and transportation connectivity are selected as the secondary indicators to measure connectivity efficiency. The service area represents the extent of the walking, cycling, and vehicular accessible area of a greenway space within 15 min; transportation connectivity indicates the connectivity of the greenway with urban public transportation. In order to objectively evaluate the service quality of a greenway space according to the actual situation. According to the research related to the spatial quality of streets [39], green visibility, enclosure, sky visibility, walking path space, and service facilities are selected as the secondary indicators for evaluating the spatial service quality of greenways. Green visibility represents the proportion of green landscape within the human visual range [40]; enclosure represents the proportion of streetscape images accounted for by the area of buildings, walls, columns, and fences; sky visibility represents the proportion of streetscape images accounted for by the area of the sky; walkway space represents the proportion of streetscape images accounted for by the area of sidewalks and the area of pedestrians; motor vehicle space includes the proportion of streetscape images accounted for by motor vehicle lanes, as well as by the area of vehicles; and service facilities represent the proportion of greenway facilities (service facilities, signage facilities, and lighting facilities) in street view images (Table 2).
Service effectiveness can reflect the degree of fit between greenway services and public demand, as well as the differences in access to public services by different groups and regions. In the effect evaluation system, the perceived indicators, as an important subjective evaluation dimension, can effectively capture the actual feelings of the public using a greenway through quantitative indicators, such as user satisfaction and usage experience. Based on perceived value, satisfaction, and behavioral intention studies [47,48], overall satisfaction and publicity impact are selected as secondary indicators. Overall satisfaction can reflect the overall satisfaction of users with the services provided by a greenway; publicity impact can measure the impact of greenway publicity on users’ travel. Greenways, as public infrastructure, play a key role in promoting social equity [49]. Social equity mainly refers to the fair and equitable management of all institutions serving the public, as well as the fair and equitable distribution of public services [50]. Diversity indicates the ecological characteristics at the community level, which involves the stability and productivity of the community. This study adopted the age diversity index as an evaluation index to assess the distribution balance of greenway user groups in the age dimension, which, in turn, reflects the equity of access to greenways by users of different ages. Since the services provided by greenways should meet the differentiated needs of user groups of different ages, the satisfaction difference indicator was selected in this study (Table 3).
Based on the research of public space effectiveness [11,12], this paper introduced the “overall service effectiveness index (O)” to reflect the degree to which the greenway space achieves the overall goal, which is used to measure the overall performance of the greenway. At the same time, drawing on the “efficiency–quality” balance index [11], the “efficiency–effect balance index (E)” is used to reflect the balance between greenway service efficiency and service effectiveness. The closer the index value is to 1, the stronger the efficiency–effectiveness balance of the greenway, and the more efficiently the greenway utilizes the resources and effectively meets the needs of the users, the more likely the greenway has reached an ideal balance (Figure 2).

3. Materials and Methods
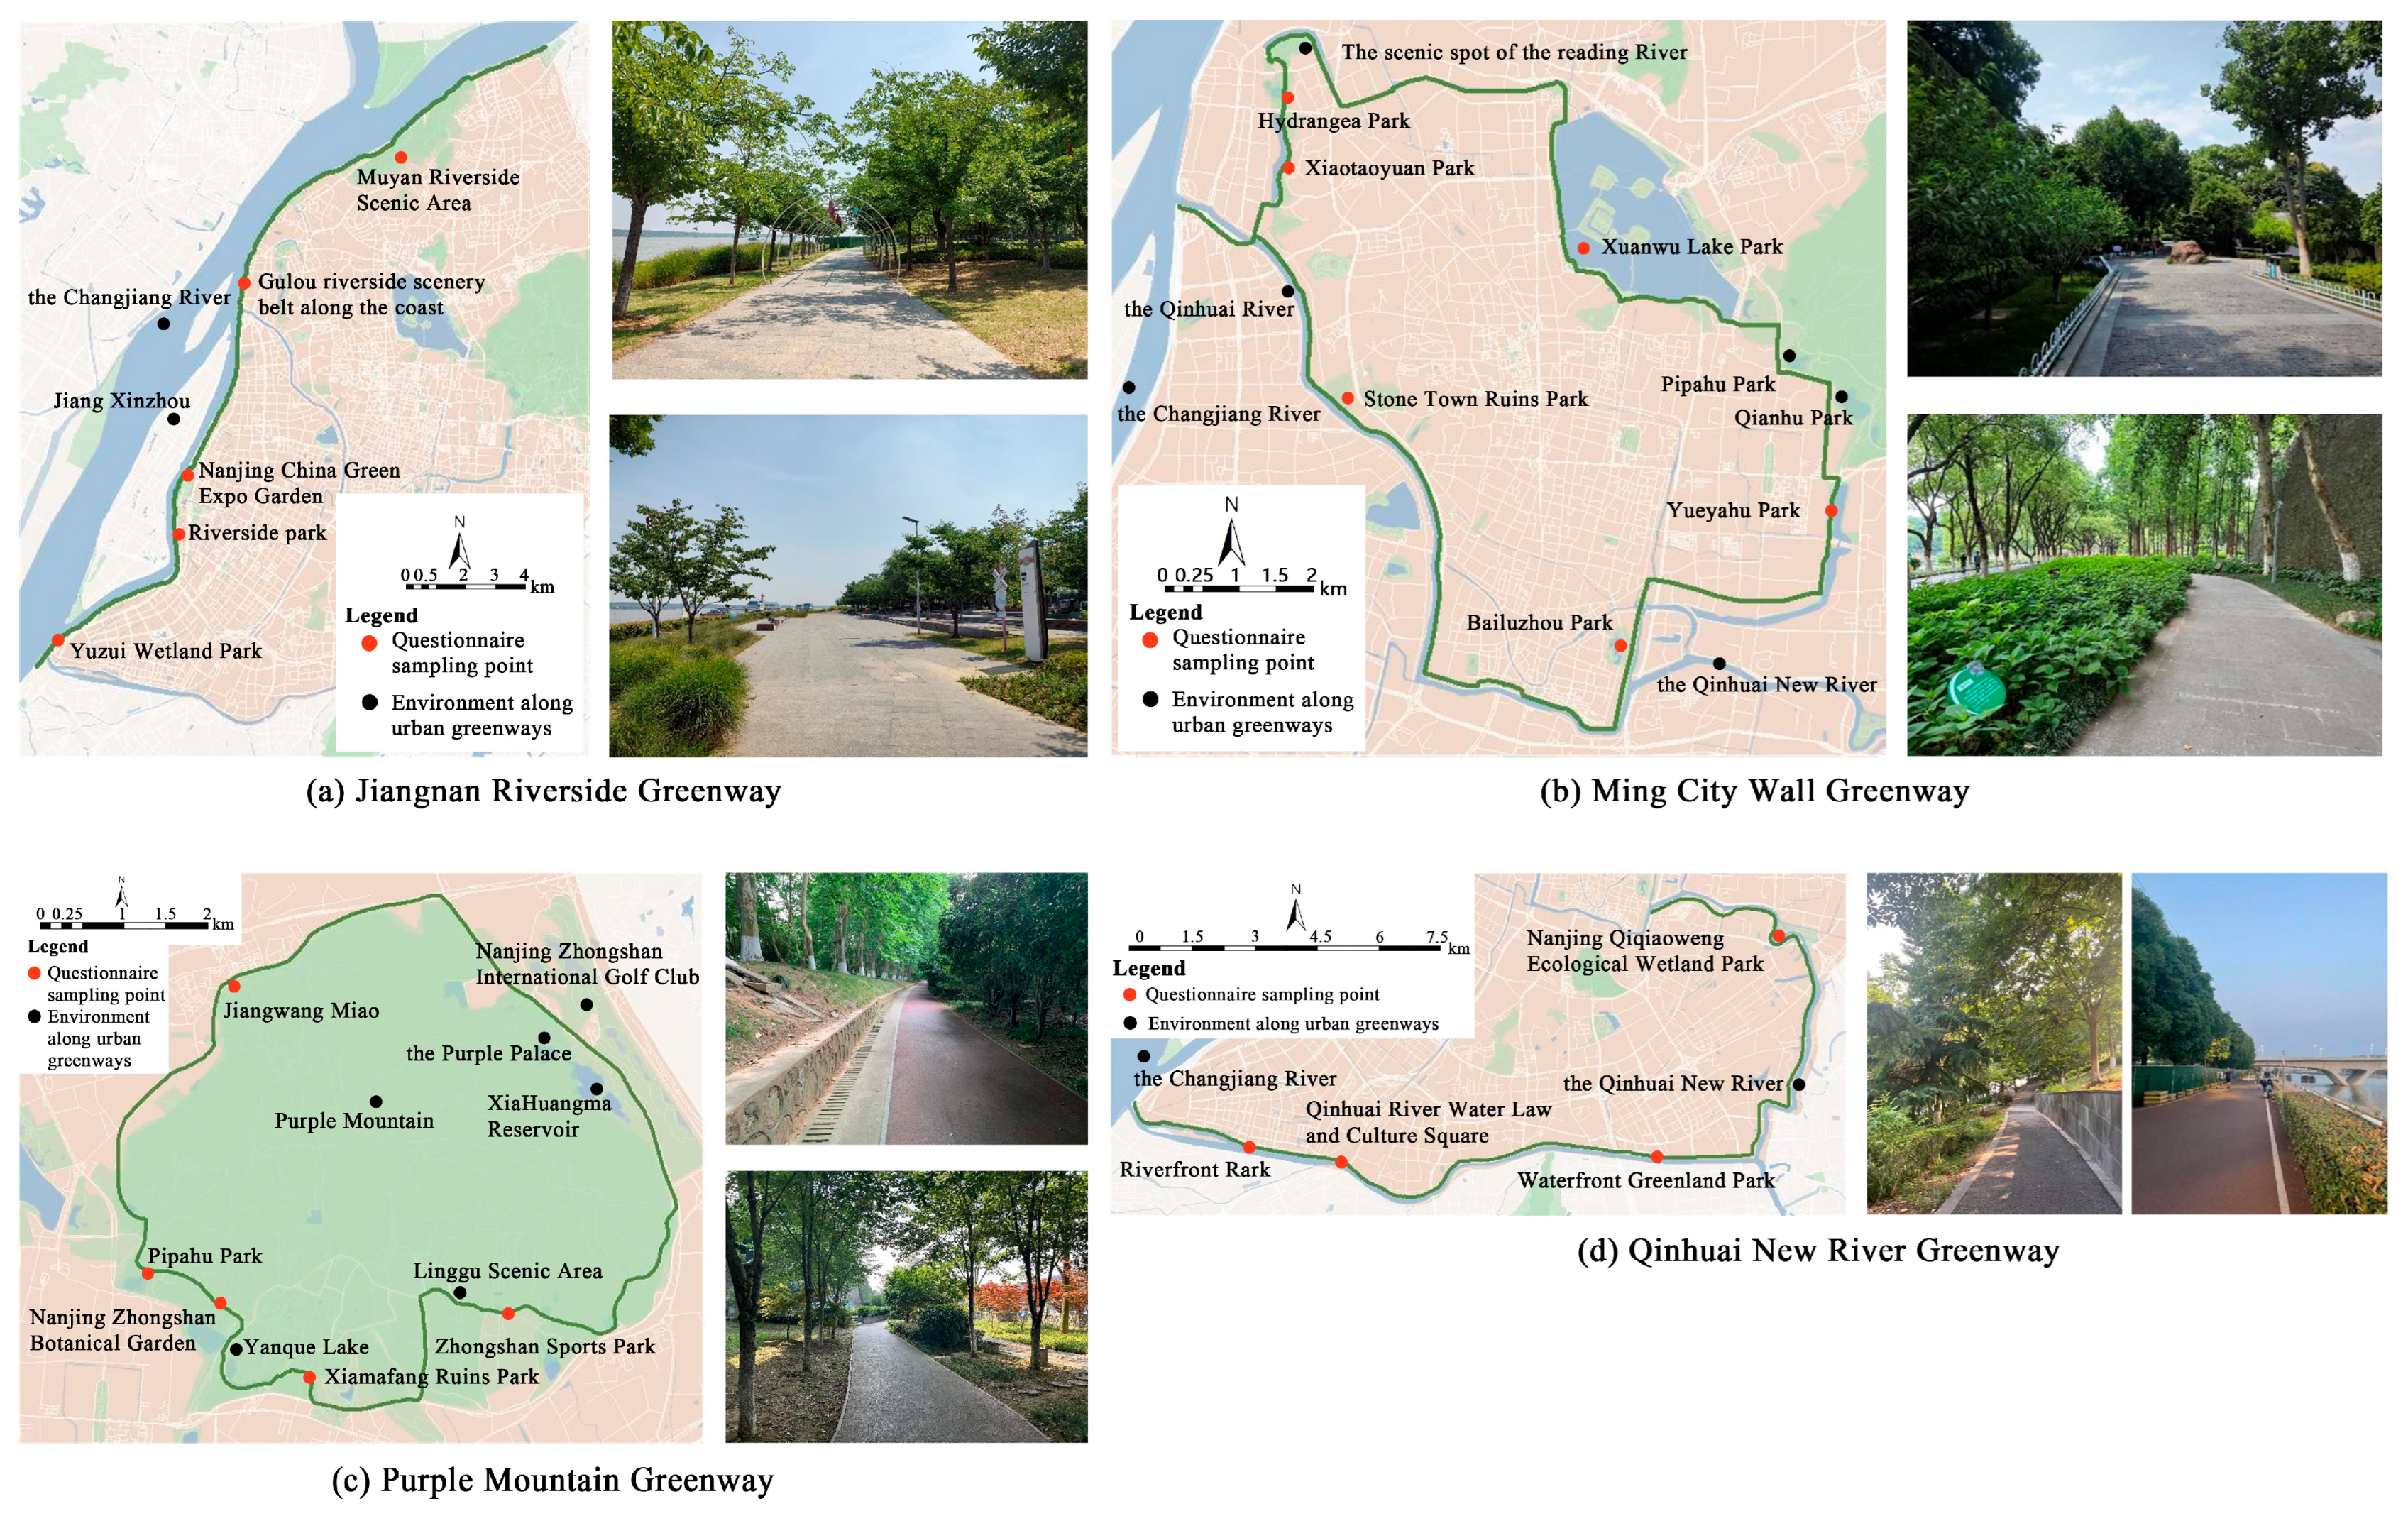
3.1. Study Area

Urban-type greenways often rely on the most central and high-quality natural and humanistic landscapes in urban areas, play a strategic role in the construction of urban greenway networks and cultural narratives, and are the windows that show the urban landscape and regional characteristics. The study of their service effectiveness can directly reflect the core issues of urban greenway systems. At the same time, the high standard of planning and construction of this kind of greenway and the strong social concern, coupled with the status quo of urban space constraints and dense flow of people, have led to a more complicated conflict scenario in terms of balancing function, spatial efficiency, and experience. It is typical and representative to take this kind of greenway as a research sample, which has both high construction standards and high development intensity challenges.
After years of careful planning and continuous construction, Nanjing, Jiangsu Province, China, has achieved fruitful results in the construction of greenways, with a rich variety of types. Nanjing has now constructed a network of more than 1000 km of greenways, forming a pattern that connects the southern and northern parts of the city with a chain of points. These greenways cleverly link natural landscapes, such as Xuanwu Lake and Purple Mountain, as well as humanistic monuments, such as the Ming City Wall and Confucius Temple, highlighting the city’s charm with its unique landscape, city, and forest style. Therefore, choosing municipal greenways in the main urban area of Nanjing as the research object can provide a comprehensive and representative sample for greenway research and practice. According to the hierarchical planning of the municipal greenway, the municipal greenway in the main urban area includes the Jiangnan Riverside Greenway, the Qinhuai New River Greenway, the Ming City Wall Greenway, and the Purple Mountain Greenway (Figure 3).

3.2. Data Resources

3.2.1. Geospatial Data

The road network data used in the study mainly came from the Open Street Map (OSM) map service platform, and the acquired road traffic data in the main urban area of Nanjing mainly included national highways, provincial highways, county highways, expressways, and pedestrian roads, which were imported into ArcGIS10.8 for data integration and analysis to calculate accessibility. At the same time, the number of bus stops and subway stations within the study area was captured by Python3.0 code to calculate the connectivity.
The greenway street view images were acquired from the Baidu Street View (BSV) map. The Python programming language was used to initiate a request to the Baidu map API interface to capture the data, and the generation interval of each sample point was set to 50 m. Each point acquired images in four directions, i.e., front, back, left, right, and left, and the pixels were set to 600 × 600. A total of 1668 points were captured in this study: 255 points were acquired for the Jiangnan Riverside Greenway, 428 points were acquired for the Qinhuai New River Greenway, 592 points were acquired for the Ming City Wall Greenway, and 393 points were acquired for the Purple Mountain Greenway. In total, 6672 pictures were obtained. The ADE_20K dataset was selected to pre-train the PSPNet semantic segmentation algorithm model. Then, combining the elements of street spatial quality and the urban greenway components specified in the Greenway Planning and Design Guidelines, the six categories of greenway spatial quality elements—green visibility, enclosure, sky visibility, pedestrian space, motorized space, and service facilities—were summarized, the spatial elements of the greenway were identified, and the pixel percentage of each element was calculated. The greenway spatial elements were recognized, and the pixel ratio of each element was calculated (Figure 4).

3.2.2. Network Text Data

Network text data mainly contain textual information, such as users’ reviews about the four municipal greenways in the main urban area of Nanjing. Therefore, China’s domestic mainstream third-party data platforms, with wide coverage, high audience, and high network attention, were selected as data sources. After searching, three websites with a large amount of online evaluation data, namely, Dianping, Weibo, and Ctrip, were selected as data collection platforms. Python 3.0 and Octopus Collector were used to obtain the evaluation text data from 1 April 2021 to 1 April 2024. High-frequency vocabulary analysis and sentiment analysis were performed by ROST-CM6 software to summarize the elements of users’ perceptions within the greenway space. This helped to carry out the determination of questionnaire dimensions, which were cross-validated with user satisfaction obtained from the questionnaire research assessment.

3.2.3. Questionnaire Survey Data

The data from the users of the four greenways were collected through the on-site distribution of questionnaires, which were used to calculate the indicators of the service effect dimension. According to the results of high-frequency vocabulary analysis of network text data, the perceived elements of tourists were extracted as geographic location, transportation mode, activity space, public facilities, plant landscape, activity type, and playing feeling. According to the user-perceived elements of the municipal greenway, combined with the literature study, landscape environment, greenway function, traffic condition, supporting facilities, and management and protection were set as the observation dimensions of the questionnaire, which facilitated the scientific and comprehensive capture of user needs and pain points. Based on multi-dimensional considerations, such as functional representativeness, spatial coverage, and differences in users, some parks where greenways pass were set as sample points, and user attributes and usage characteristics were recorded by the random sampling method (Figure 5). Regarding the specifics of the four greenways, the eastern section of the Purple Mountain Greenway was not included in the questionnaire survey because the eastern section of the greenway around Purple Mountain is mainly a hotel and villa area, making it difficult to obtain the required information. The survey was conducted on weekends and weekdays in June and September 2024, covering information on transportation modes, usage characteristics, and satisfaction. A total of 560 questionnaires were distributed, with 473 valid questionnaires and a validity rate of 84.46%. The number of valid questionnaires and the results of the reliability and validity tests for the four greenways are shown in Table 4.

3.3. Methods

3.3.1. Evaluation System Construction

Based on the connotation of service effectiveness assessment, this paper categorized the evaluation dimensions into service efficiency and service effectiveness and selected four first-level indicators and twelve second-level indicators to evaluate the effectiveness of greenway services. According to the data characteristics of the core indicators of public service effectiveness evaluation, the quantification of the indicators under the dimension of service efficiency was based on geospatial data, and the basis of measurement was obtained through ArcGIS network analysis, Image Semantic Segmentation, and other technological means. The index of the service effect dimension was calculated based on the survey data (Table 5).

3.3.2. Weight Determination and Calculation

In order to eliminate the order of magnitude differences between indicators and to adjust the data of each indicator to a range suitable for analysis, each data point was standardized, and the formula for Min-Max Scaling, the logarithmic function standardization method, was used as follows:
x = ( x x m i n ) / ( x m a x x m i n )
x = log 10 x / log 10 x m a x
where x denotes the normalized value, x is the original data, x m i n is the minimum value of the data, and x m a x is the maximum value of the data.
Considering the need to overcome the influence of subjective factors, this study adopted the AHP method and the EW method combined with the assignment to calculate the comprehensive weight value of each evaluation index in the evaluation system. In the hierarchical analysis method, 11 experts and scholars specialized in landscape architecture were invited to score the questionnaires, rank the importance of the indicators, and calculate the subjective weights of the indicators. Then, the entropy weight method was used to calculate the objective weights of the indicators. The subjective and objective weights obtained from the two calculation methods were combined and assigned to calculate the composite weights using linear weighting (Table 6). The formula is as follows:
w = β w 1 + 1 β w 2 ( 0 β 1 ,   0 < w 1 , w 2 , w < 1 )
where w is the composite weight,   w 1 is the subjective weight value calculated by the AHP method, w 2 is the objective weight value calculated by the EW method, and β represents the decision correlation coefficient, which takes the value of 0.5.
According to the obtained weights, service efficiency and service effectiveness were calculated as follows:
A = j = 1 n a j × A j
B = j = 1 n b j × B j
where a j is the weight of the jth service efficiency factor and A j is the normalized data for the jth factor. b j is the weight of the jth service efficiency factor, and B j is the normalized data for the jth factor.
The overall service effectiveness index, the efficiency–effect balance index was calculated using the following formula.
O = A + B
E = A B
where A represents the combined weight of service efficiency and B represents the combined weight of service effectiveness.
Using the standardized data and multiplying the weights to obtain the evaluation dimensions of the four greenways and the composite scores of each level of indicators, respectively, in order to facilitate the subsequent calculations and analysis, the obtained values were multiplied by 10 to obtain the final score.
Z j = 10 × j = 1 p c j x i j
where c j is the composite weight, x i j is the normalized data, and Z j is the composite score.

4. Results

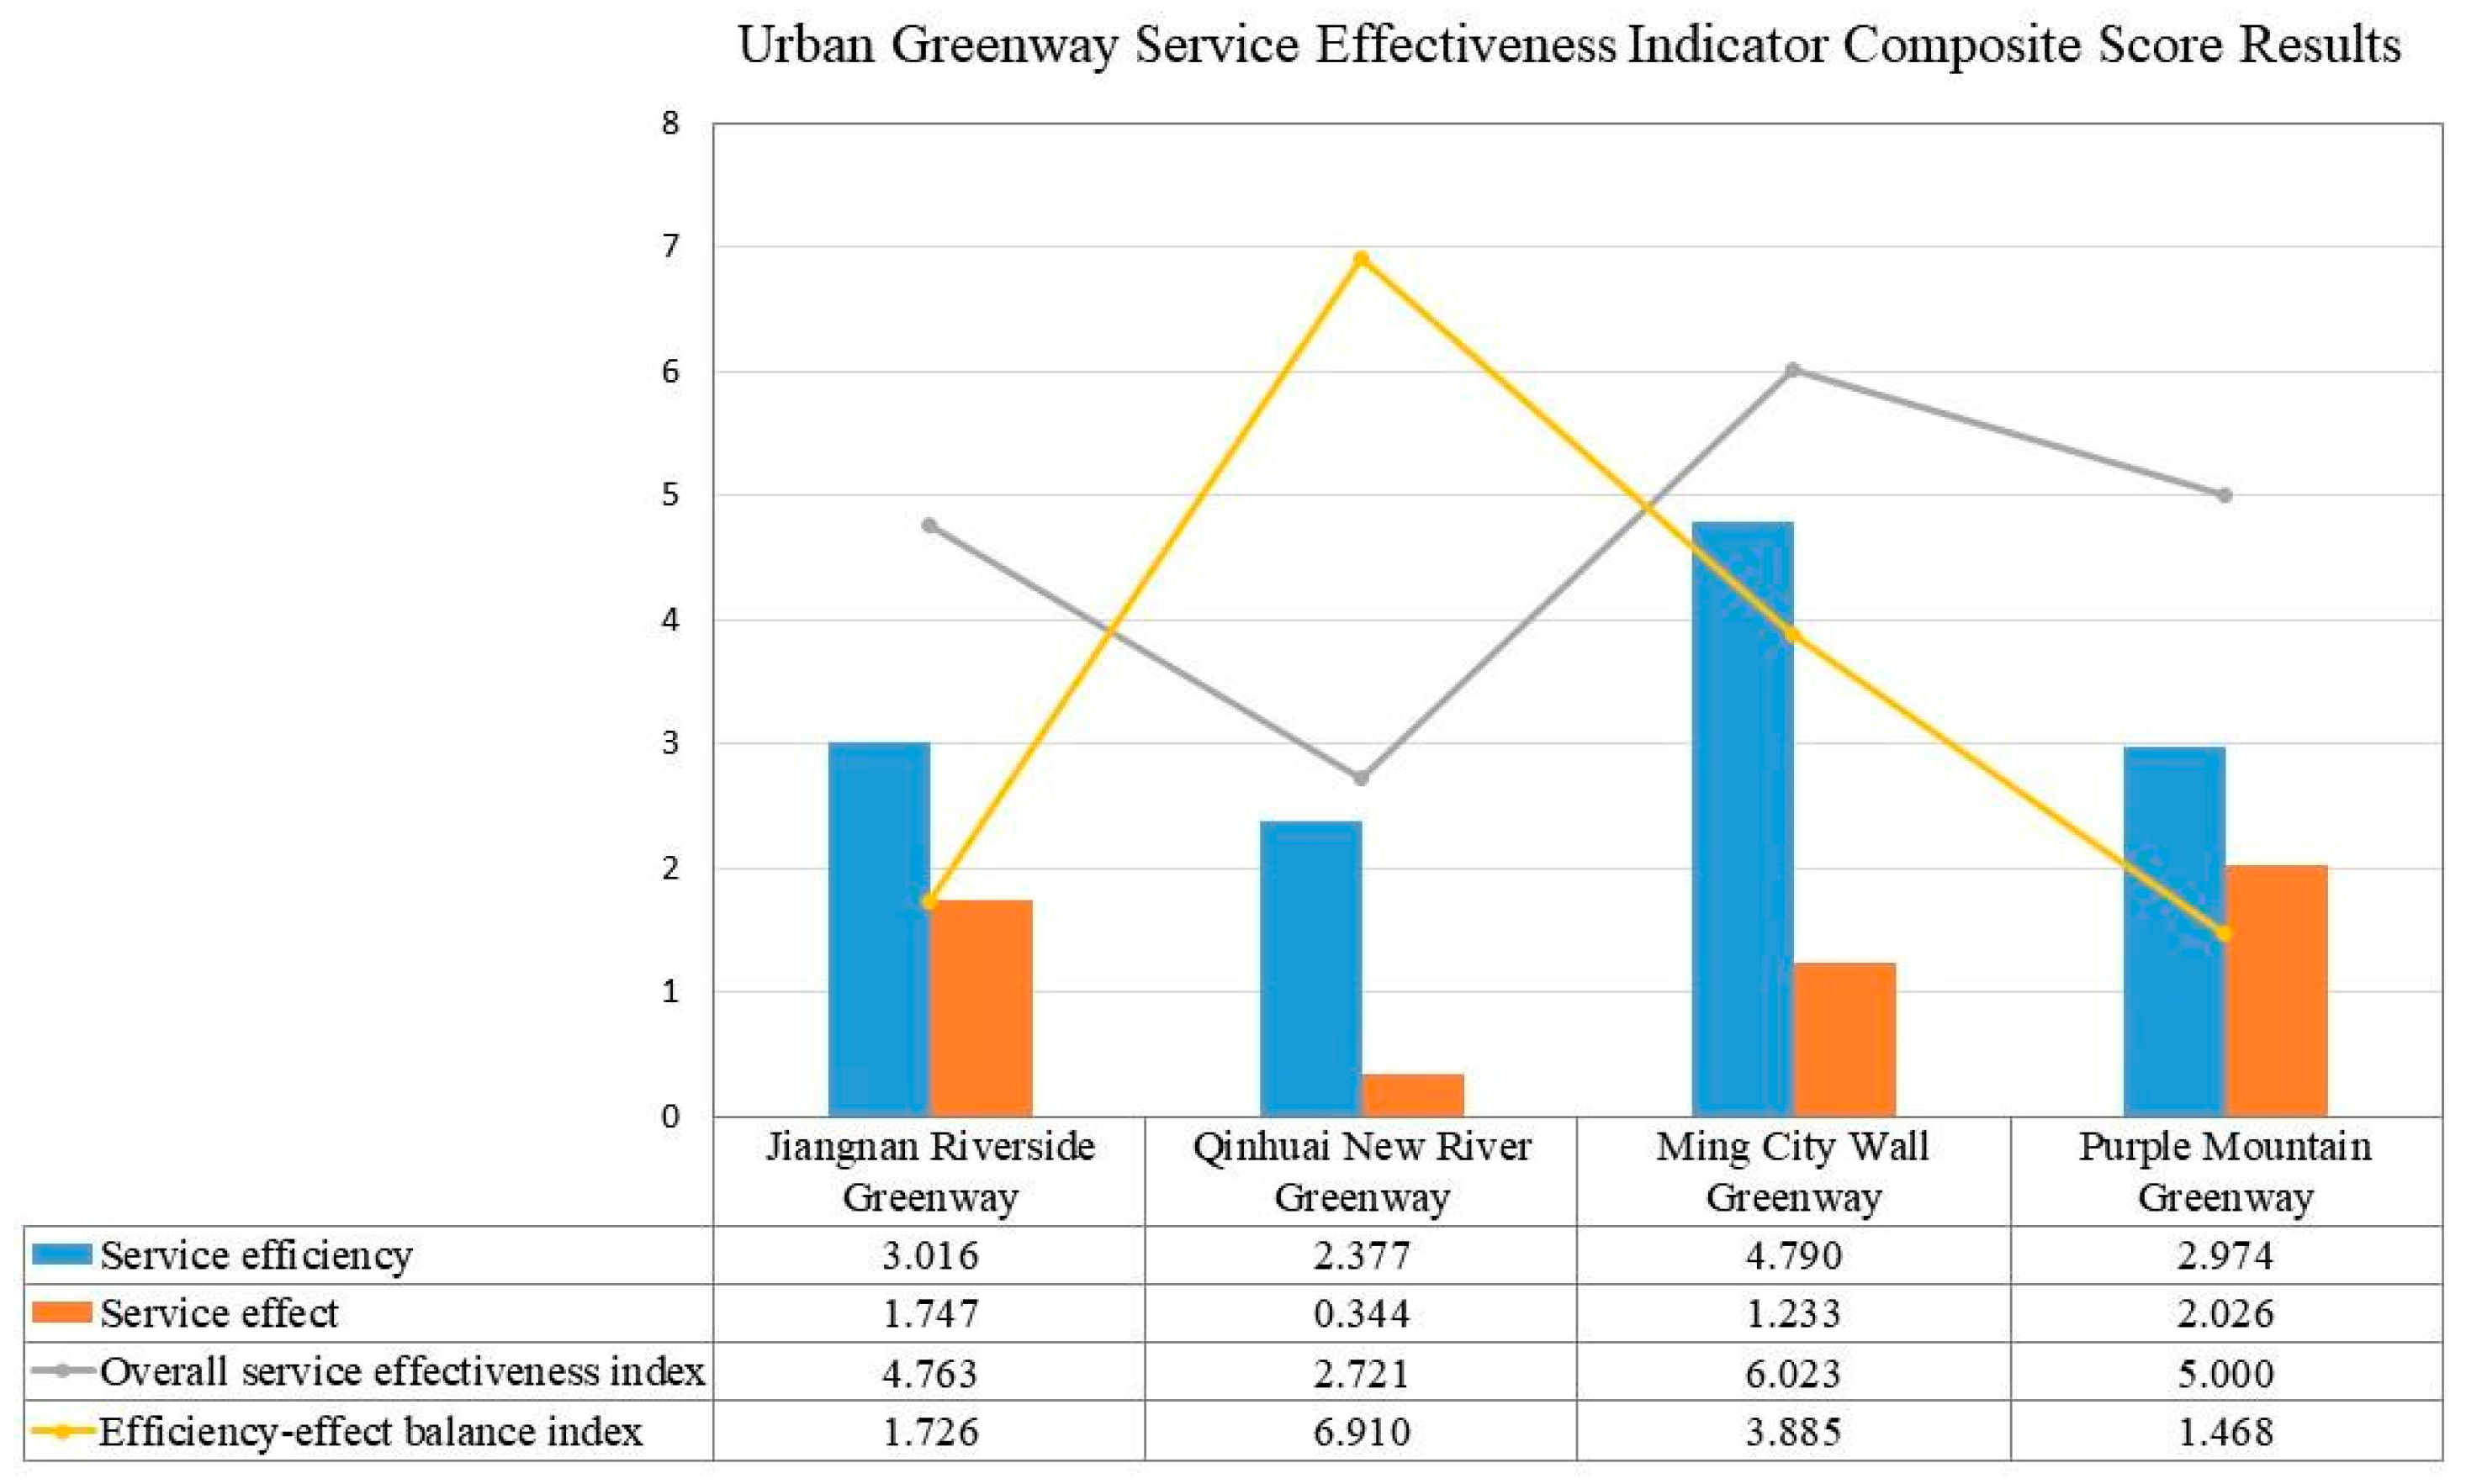
4.1. Calculation Result

The index scores and composite scores at all levels of the four greenways were obtained separately according to the calculation formula. The results are as follows (Table 7):
According to the calculation results (Figure 6), it can be found that the overall service effectiveness indices of the four greenways are, in descending order, as follows: Ming City Wall Greenway (6.023), Purple Mountain Greenway (5.000), Jiangnan Riverside Greenway (4.763), and Qinhuai New River Greenway (2.721). According to the principle that the closer the value of the efficiency–effect balance index is to 1, the better the ability to balance the efficiency and effect of the greenway service, the efficiency–effect balance ability of the four greenways is ranked from high to low, and the order is as follows: Purple Mountain Greenway (1.468), Jiangnan Riverside Greenway (1.726), Ming City Wall Greenway (3.885), and Qinhuai New River Greenway (6.910). The Ming City Wall Greenway has relatively high overall service effectiveness but poor efficiency–effectiveness capability. The Qinhuai New River Greenway has the lowest level of overall service effectiveness and the worst efficiency–effectiveness balance capacity.

4.2. Service Efficiency Features

The service efficiency of the Ming City Wall Greenway is the highest among the four greenways, while those of the Qinhuai New River Greenway and the Purple Mountain Greenway are on the low side, which may be related to the spatial location, functional positioning, and landscape environment.

4.2.1. Connectivity Efficiency

In general, people mainly rely on walking, biking, private cars, buses, and subways to reach the urban greenway. Based on the analysis conducted by ArcGIS10.8 (Figure 7, Figure 8 and Figure 9 and Table 8), it is found that the Ming City Wall Greenway has the widest service coverage in three different transportation modes, namely, walking, cycling, and driving, and has the highest public transportation connectivity. On the other hand, the Purple Mountain Greenway has the lowest accessibility and the lowest connectivity for all three modes of transportation. In terms of service coverage, the Jiangnan Riverside Greenway has the poorest walking accessibility, followed by the Purple Mountain Greenway. The Purple Mountain Greenway has the worst accessibility for both cycling and vehicular modes. This situation is likely related to the landscape characteristics of the riverfront and the Ring of Mountains, the urban transportation network, and other factors.

4.2.2. Space Quality

The trained PSPnet network model for greenway spatial quality measurement obtained the spatial quality elements’ percentage of the four greenways (Table 9). Influenced by the surrounding scenic resources, the green visibility of the Purple Mountain Greenway is significantly higher than the other three greenways. In addition, the spatial ratio of motorized vehicles in this greenway is also higher than in the other three greenways. The Ming City Wall Greenway is built along the Ming City Wall, and the enclosure and sky visibility are affected by the enclosure of the Ming City Wall. The measurement results show that the percentage of both elements of this greenway is lower than that of the other three greenways, which is consistent with the prediction. In addition, the Ming City Wall Greenway is better constructed in terms of services and walkway space, possibly influenced by the time of construction and the type of surrounding land. The Purple Mountain Greenway has the highest percentage of motorized vehicles, which may imply that the greenway has a stronger traffic function or that the greenway is more closely integrated with the city road, which may have some impact on the walking and cycling experience of users. The Jiangnan Riverside Greenway and the Ming City Wall Greenway have similar percentages of motorized vehicles, which suggests that these two greenways may have balanced the traffic function and landscape experience to some extent. The Qinhuai New River Greenway has the lowest percentage of motorized vehicles, suggesting that the greenway may be more focused on the walking and cycling experience, or that the design of the greenway is more oriented towards landscape and recreational functions.
Overall, these figures reflect the differences in the functional orientation and design of different greenways. The Purple Mountain Greenway may be more oriented towards transportation functions, while the Qinhuai New River Greenway focuses more on landscape and leisure experience. The Jiangnan Riverside Greenway and the Ming City Wall Greenway are in the middle, balancing transportation and landscape functions. These differences may be related to the location and environment of the greenway.

4.3. User Analysis

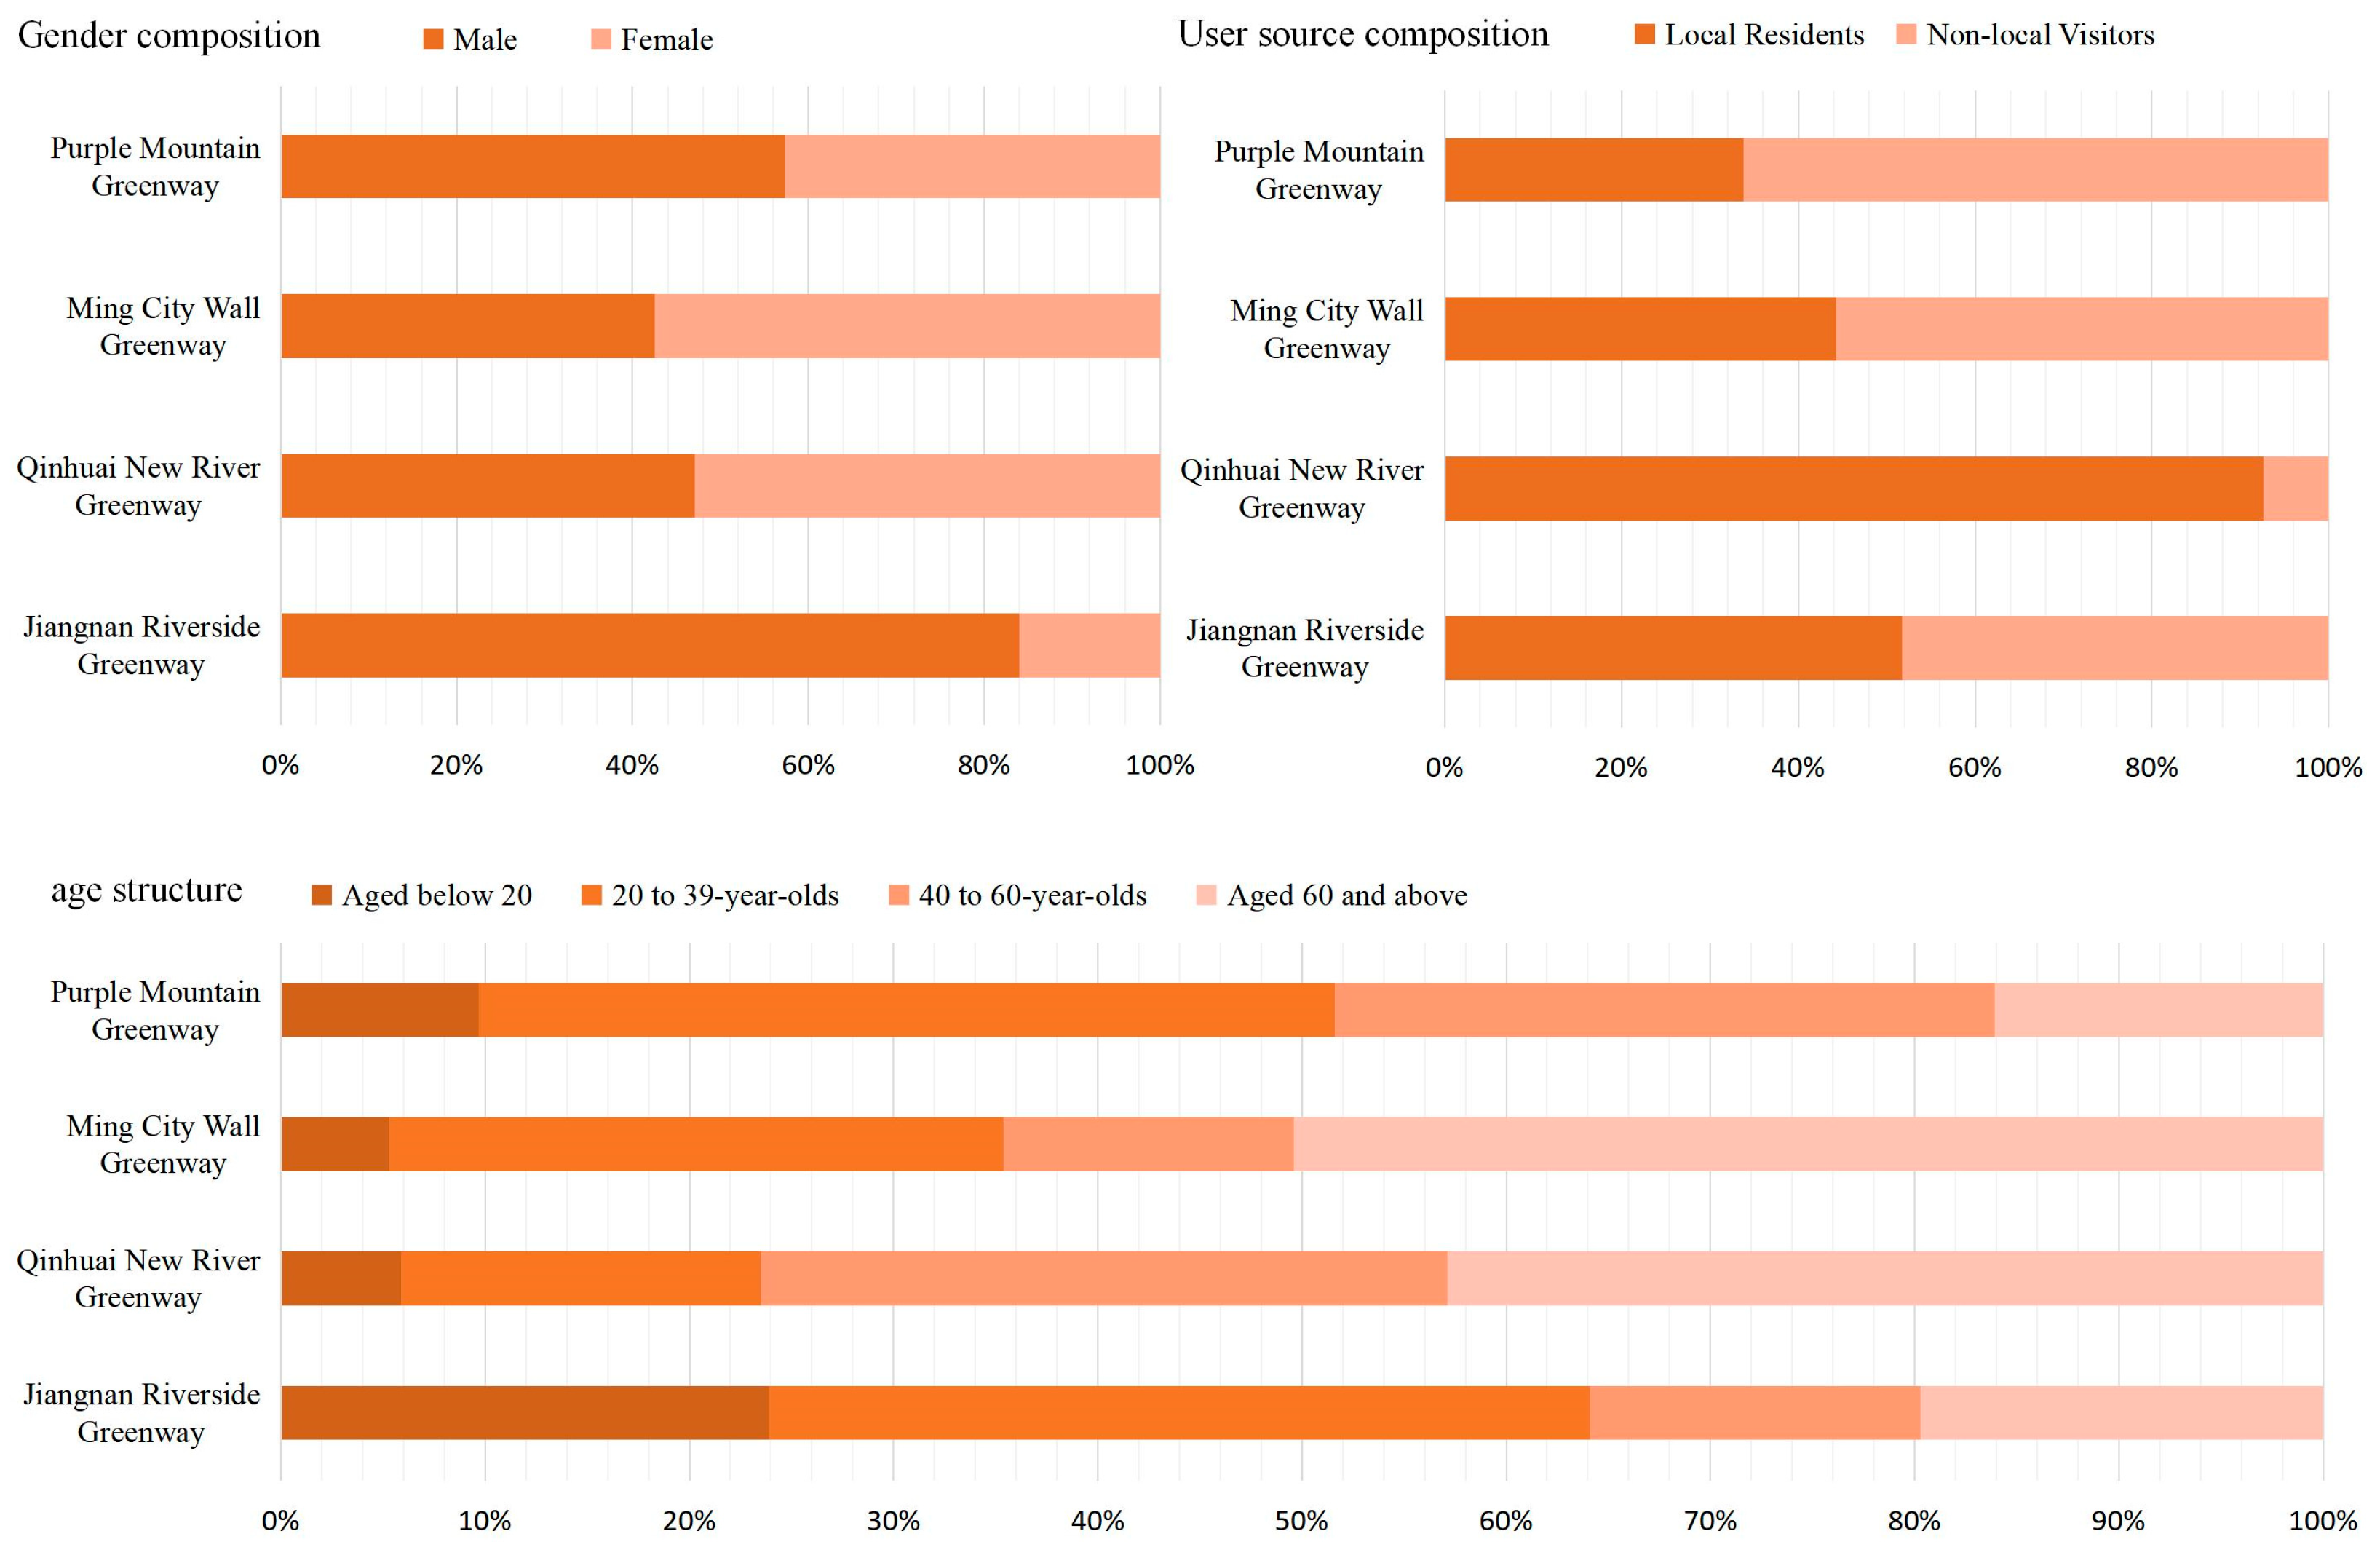
4.3.1. User Attributes

As far as the proportion of respondents is concerned (Figure 10), the proportion of male and female visitors using the Jiangnan Riverside Greenway and the Qinhuai New River Greenway is comparable. Slightly more females than males visited the Ming City Wall Greenway, and the proportion of males was higher than that of females among the visitors of the Purple Mountain Greenway. In terms of age structure, young people aged 20–39 (40.20%) dominated the visitors to the Jiangnan Riverside Greenway, followed by a higher number of children and teenagers under the age of 20 (23.90%). Visitors to the Qinhuai New River Greenway were mainly senior citizens (42.90%) and middle-aged people (33.60%), with the proportion of middle-aged people slightly lower than that of senior citizens. Visitors to the Ming City Wall Greenway were predominantly older than 60 years old (50.40%) and young people aged 20–39 (30.10%). The visitors to the Purple Mountain Greenway were mainly middle-aged and young people (41.90% and 32.30%) (Figure 10). In addition, the sources of users of the four greenways differed. The two user types of the Jiangnan Riverside Greenway had comparable proportions, while the Ming City Wall and the Purple Mountain Greenway had a higher proportion of tourists among their users. The Qinhuai New River Greenway had local residents as its main service target, and only 13.50% of the users were influenced by publicity to visit the greenway, while the vast majority of the users (86.50%) used the greenway as a daily recreational space due to the proximity of their residence.

4.3.2. Usage Requirements and Usage Characteristics

Overall, 44.40% of the respondents seldom used the Jiangnan Riverside Greenway, and the purpose of using the Riverside Greenway was mainly for photographing and strolling around. In total, 75.70% of the respondents used the Qinhuai New River Greenway several times a week for sports and recreational activities. The respondents who visited the Ming City Wall Greenway can be divided into two categories: tourists who visited the greenway for the first time, and neighborhood residents who visited the greenway frequently every week for leisure and recreational activities. Most of the users of the Purple Mountain Greenway conducted sightseeing and photography carding activities, and 41.90% of the respondents used the greenway for the first time. In addition, according to the descriptive statistics analysis, it is not difficult to find that the travel mode of the respondents who visited all four greenways was mainly based on public transportation and walking (Figure 11 and Table 10).
Through field observation and questionnaire research, it was found that there are differences in the time of use of the four greenways. The Jiangnan Riverside Greenway and the Ming City Wall Greenway were most used between 13:00 and 18:00 in the afternoon. The use of the Qinhuai New River Greenway was also unevenly distributed in terms of the time of day that the respondents used the greenway, with peak use after 18:00 in the evening and few users before 8:00. The Purple Mountain Greenway had a peak usage between 8:00 and 18:00 during the day (Table 10).

4.4. Correlation Analysis of Influencing Factors

In order to clarify the impact of greenway spatial quality on the service effectiveness of municipal greenways, spatial quality was correlated with the first-level indicators of municipal greenway service effectiveness (Table 11). This study determined the indicators for measuring spatial quality within greenways based on four attributes of public open space quality, including activities, environmental quality, amenities, and safety [51], as well as a statistical analysis of word frequency of greenway web review texts.
The acquired web texts were analyzed by word frequency statistics to extract the top 150 high-frequency words, mainly including nouns, adjectives, and verbs. The nouns mainly included park, scenery, sunset, city wall, riverfront, environment, attraction, children, location, weather, greenway, tulip, cherry blossom, hydrangea, parking lot, subway, convenience, surrounding, etc., which mainly reflect the content of spatial cognition, surrounding environment, plant landscape, attraction services, and other subjective descriptions of the greenway by visitors. The adjectives mainly included comfortable, beautiful, rich, pity, wonderful, happy, quiet, very good, cozy, etc., which mainly describe the visitors’ feelings and are the core reflection of the visitors’ satisfaction with the park. The verbs mainly included play, take photos, walk, exercise, clock, camp, hike, fit, etc., which mainly reflect the types of activities and sensory attitudes of tourists. The visitors’ perceptions of the spatial quality of the greenway included the main aspects of geographic location, transportation modes and conditions, activity space, public facilities, plantscapes, and activity types. Based on the above analysis, landscape environment, greenway function, traffic condition, supporting facilities, and management and protection were determined as the spatial quality measurement indexes for the sample parts.
From the results of the correlation analysis of spatial quality indicators and greenway service effectiveness indicators, it can be seen that there is a highly significant correlation between the landscape environment and perception, and the landscape environment also has a relatively strong influence on spatial quality. Greenway function has a certain correlation with user perception and equity, and it can be assumed that users of different ages may have different perceptions of and needs for greenway function. Traffic condition has a strong correlation with connection efficiency, indicating that the route setting and convenience of the greenway will strongly affect the connection efficiency. Supporting facilities influence spatial quality and perceptual factors by providing activities to users. In addition, there is also a correlation between the level of management and protection and the fairness of use, which is mainly reflected in the group differences in the needs of different age groups for greenway management and spatial safety and security. For example, the elderly tend to pay more attention to the safety of open space facilities and the degree of humanization of the management.

5. Discussion

5.1. Discussion of the Results

Studies have shown that the overall service effectiveness of urban greenways is mainly influenced by spatial quality factors. A greenway is a landscape system with spatial heterogeneity, not a homogeneous infrastructure [52]. The urban greenway landscape is monotonous, and the landscape layout and supporting facilities fail to meet the needs of different groups of people. This makes the greenway landscape lack uniqueness and cultural recognition, and it is difficult to further stimulate users’ interest and willingness to stay. For example, the Qinhuai New River Greenway has a high proportion of elderly users, but it lacks characteristic landscape and activity space, as well as aging facilities, such as elderly rehabilitation training facilities and barrier-free access, which makes it difficult for users to obtain services conveniently. At the same time, the greenway only focuses on a single function and has not been upgraded in line with the development of the times and the new needs of users. For example, although the Jiangnan Riverside Greenway has a certain degree of tourist attraction, it has not expanded the functions of cultural experience and ecological study, and it still has difficulties in meeting the diversified needs of tourists.
In terms of traffic conditions, the density of the surrounding public transport stations is insufficient. Thus, the greenway lags behind in its connection with the existing transport system, and it fails to reserve enough space for traffic expansion, which makes it difficult to carry out effective renovation in subsequent traffic optimization, thus limiting the traffic function and service effectiveness of the greenway. This situation will also reduce the attractiveness of urban greenways to users who are far away from them, and this view is supported by previous research [53]. In addition, sloppy operation and management and weak safety protection also negatively affect service effectiveness. Previous research has shown that positive social interactions (e.g., neighborhood exchanges, family and friends walking together) and a sense of safety are important factors in encouraging walking and greenway use [24,54]. The absence or damage of security facilities (such as lighting and monitoring) reduces users’ sense of security, especially the utilization rate at night. A good lighting system is effective in maintaining greenway usage and maintenance levels [16,55]. None of the four greenways has established a mechanism for collecting and processing user feedback, and they are slow to respond to the needs of tourists and residents for repairing damaged facilities and optimizing services, resulting in the persistence of some of the problems, which in turn affects the experience of using the greenways.
The contradiction between single-function positioning and diverse user needs is the main reason for the imbalance between efficiency and effectiveness of urban greenways. Taking the section of the Qinhuai New River Greenway Tiexinqiao Street–Nandu Avenue as an example, its poor service effect is mainly manifested in two aspects. Firstly, limited by the spatial layout and supporting facilities, the greenway has a single function, which leads to low user satisfaction; this is consistent with the results obtained from the sentiment analysis of the network text data conducted by ROST-CM6 software (Table 12). Secondly, there is a lack of publicity and insufficient public participation. In addition, the phenomenon of “high service capacity and low effectiveness” emerged in this study. This paradox of “high capacity and low effectiveness” is, to a large extent, related to the equity of the service. This kind of greenway is often dominated by a certain function. Although the related facilities are perfect, the function is too single to meet the activity needs of different groups of people, and the development of composite functions needs to be improved.

5.2. Innovation Point

At present, the construction of urban greenways is not closely connected with the overall planning of a city, and some greenways are out of line with the needs of urban development after completion [56,57,58,59]. Moreover, the evaluation system of completed greenways is not perfect, which makes it difficult to comprehensively and accurately measure the actual service effectiveness and sustainable development level of greenways. In this context, it is of great significance to construct a service effectiveness evaluation system to assess the social service effectiveness of urban greenways. At the academic level, this study innovatively introduces the theory of management, constructs an evaluation system from the dual dimensions of service efficiency and effectiveness, breaks through the disciplinary boundaries of greenway research, and provides a new research perspective for the academic community. The evaluation process mechanism emphasizes public demand feedback, which can guide designers and managers to actively meet the actual needs of residents in the process of greenway optimization [6,60], clarify planning and design priorities, and guide the formulation of management strategies, thus effectively improving the efficiency of greenway use and public satisfaction and, ultimately, promoting the high-quality and sustainable development of urban greenways.

5.3. Suggestions for Optimizing the Effectiveness of Urban Greenway Services

As one of the core elements of modern urban construction, the scientific planning and design and efficient management of greenways play a key role in improving public health, enhancing community vitality, and maintaining sustainable ecosystems. During the planning process of urban greenways, designers should take into account the characteristics of the land cover along the greenway, the visual richness and hierarchy of different landscape types of greenways [15,61,62], the combination of spatial elements, and the flexible application of the rules of design syntax. Through the integration and optimization of these factors, designers can form a detailed design scheme of a greenway that is both functional and ornamental [63]. For example, this can be accomplished by adjusting the height of plants, improving the enclosure and sky visibility, regulating the landscape line of sight, and optimizing the space limitation caused by the shielding of historical relics, buildings, or equipment houses, such as city walls. When combined with local cultural elements, a landscape can be designed with a sense of belonging and identity to enhance the emotional connection of the elderly.
Previous studies have shown that perfect amenities are the determining factor to enhance the attractiveness of greenways [54]. Based on the functional positioning of the greenway and user needs, the targeted configuration of basic service facilities and recreational facilities is essential to enhance the service effectiveness of the greenway. For greenways frequently used by young people, designers can design a series of themed punch-points for photographers and young tourists to enhance the attraction and interaction of the landscape. People who like sports tend to use greenways more frequently [25], so the configuration of recreational and fitness facilities should be emphasized. Differentiated facilities can be configured according to the population characteristics (age and occupational structure) around the greenway, such as aging fitness equipment in the elderly community, intelligent fitness equipment in the youth gathering area, and a noon fast track in the business district to help improve the efficiency of greenway use.
Regarding urban greenways in the construction maturity zone, the focus of optimization should be on the optimization of the public transportation network, function expansion, and refined operation management. It is possible to increase the number of public transportation stops around the greenway, add pedestrian and bicycle feeder channels, and improve the guiding signs to make the transportation system more convenient, so as to increase the frequency of use of the greenway [18]. In terms of function expansion, light commerce can be introduced in the node area to strengthen the service function and enhance the convenience and satisfaction of users. In terms of operation and management, greenway managers can establish a perfect maintenance mechanism and build an intelligent management system to facilitate the regular maintenance and management of plants and facilities. They can also consider adopting a dynamic adjustment mechanism, such as regularly transferring idle facilities, so as to ensure the cleanliness of the greenway environment and the normal use of facilities. Various thematic activities, such as monthly themed tournaments, can also be organized to encourage the public to contribute to the construction and management of the greenway, so as to enhance the vitality and attractiveness of the greenway and continuously improve its influence and service effectiveness.

5.4. Limitations of the Present Study

This paper constructs an evaluation system for the service effectiveness of urban greenways and proposes strategies to improve effectiveness. However, due to the limitations of objective conditions, such as the research scope, data samples, and time period, and in view of the dynamic characteristics of the construction and development of urban greenways, there is still room for further deepening and expanding this study. Firstly, this paper only evaluates the service effectiveness of each greenway as a whole, and it does not further compare the differences in the effectiveness of the various segments of the same greenway and the reasons for the formation of the same greenway. Secondly, the evaluation system is constructed based on the characteristics of urban-type greenways, and there are some limitations in the application of this system in the evaluation of the effectiveness of countryside-type greenways and liaison-type greenways. We will gradually make up for these shortcomings in our subsequent research and continue to develop and improve the evaluation of greenway service effectiveness, with an aim to provide guidance for an improvement in greenway quality.

6. Conclusions

Greenway construction is usually characterized by a long cycle and high evaluation labor and time costs, but the ecological, social, and economic effectiveness of a completed greenway is crucial to the sustainable development of a city. Studying the service effectiveness of urban greenways is of great significance for optimizing the planning and design of greenways, improving the management level of greenways, and meeting the diverse needs of residents. In this paper, an evaluation system is constructed from the two dimensions of service efficiency and effectiveness, and the service effectiveness of municipal greenways in the main urban area of Nanjing is quantitatively investigated by using techniques such as deep learning image semantic segmentation, network analysis, and combining the AHP and EW methods. The results show that the main factors affecting the service effectiveness of greenways include the landscape environment, greenway function, traffic condition, supporting facilities, management, and protection. In addition, greenways with high service effectiveness may not be able to balance the relationship between efficiency and effectiveness, which is due to the fact that the single function of greenways cannot meet the diverse needs of users. Based on the results, we propose corresponding optimization strategies, and these suggestions can provide designers and greenway management, planning, and construction personnel with goals and guidelines for greenway optimization and construction, which can help to better enhance the service capacity of greenways and bring a more comfortable experience to users. Although there are differences in the characteristics of different types and levels of greenways, this paper provides ideas for quantifying the service effectiveness of greenways, enriches the research on greenway evaluation, and helps to promote the sustainable development of urban greenways.

Author Contributions

Conceptualization, Y.P., B.Q. and F.Z.; methodology, Y.P. and B.Q.; software, Y.P. and F.Z.; validation, Y.P. and F.Z.; formal analysis, Y.P.; investigation, Y.P.; resources, Y.P. and F.Z.; data curation, Y.P.; writing—original draft preparation, Y.P.; writing—review and editing, B.Q. and F.Z.; visualization, Y.P.; supervision, F.Z. and B.Q.; project administration, F.Z. and B.Q.; funding acquisition, B.Q. and F.Z. All authors have read and agreed to the published version of the manuscript.

Funding

This research was funded by the Ministry of Education Planning Foundation on Humanities and Social Sciences (N0. 19YJAZH072); the Seventh Jiangsu 333 High-level Talent Programme Phase Third-tier Cultivation Candidates Project (2024); the General Program of the National Natural Science Foundation of China (No. 31971721); and the Priority Academic Program Development of Jiangsu Higher Education Institutions (PAPD).

Institutional Review Board Statement

This study was conducted in accordance with the Declaration of Helsinki, and the program was approved by the NJFU College of Landscape Architecture on 20 May 2024.

Informed Consent Statement

Informed consent was obtained from all subjects involved in this study.

Data Availability Statement

The data that support the findings of this study are available upon reasonable request from the authors.

Conflicts of Interest

The authors declare no conflicts of interest.

References

  1. Fábos, J.G. Greenway planning in the United States: Its origins and recent case studies. Landsc. Urban Plan. 2004, 68, 321–342. [Google Scholar] [CrossRef]
  2. President’s Commission on Americans Outdoors (U.S.). Americans Outdoors: The Legacy, the Challenge, with Case Studies: The Report of the President’s Commission; Island Press: Washington, DC, USA, 1987.
  3. Ahern, J.F. Greenways as Strategic Landscape Planning: Theory and Application. Ph.D. Thesis, Wageningen University, Wageningen, The Netherlands, 2002. ISBN: 978-90-5808-605-1. [Google Scholar]
  4. Yu, K.; Li, D.; Li, N. The Evolution of Greenways in China. Landsc. Urban Plan. 2006, 76, 223–239. [Google Scholar] [CrossRef]
  5. Searns, R.M. The Evolution of Greenways as an Adaptive Urban Landscape Form. Landsc. Urban Plan. 1995, 33, 65–80. [Google Scholar] [CrossRef]
  6. Lee, J.; Lee, H.-S.; Jeong, D.; Shafer, S.C.; Chon, J. The Relationship between User Perception and Preference of Greenway Trail Characteristics in Urban Areas. Sustainability 2019, 11, 4438. [Google Scholar] [CrossRef]
  7. Noh, Y. Does Converting Abandoned Railways to Greenways Impact Neighboring Housing Prices? Landsc. Urban Plan. 2019, 183, 157–166. [Google Scholar] [CrossRef]
  8. Cai, L. The Concept of Performance Evaluation of the Western Country and its Revelation. J. Tsinghua Univ. (Philos. Soc. Sci.) 2003, 1, 76–84. [Google Scholar]
  9. Jiang, X.; Guo, J. Research on Public Service Performance Evaluation System based on value orientation. Adm. Trib. 2013, 20, 8–13. [Google Scholar]
  10. Zhou, Z. Citizen Participation in Government Performance Measurement: A Historical Review and Assessment. Chin. Public Adm. 2008, 1, 111–118. [Google Scholar]
  11. Zhang, S.; Chen, T. Constructing Effectiveness Assessment and Decision Model of Urban Public Space in High-Density Context. Mod. Urban Res. 2020, 2, 81–89. [Google Scholar]
  12. Huang, J.; Wang, Y. Research on Social Service Effectiveness Evaluation for Urban Blue Spaces-A Case Study of the Huangpu River Core Section in Shanghai. Land 2023, 12, 1424. [Google Scholar] [CrossRef]
  13. Shan, W.; Xiu, C.; Meng, Y. How to Design Greenway on Urban Land Utilization: Linking Place Preference, Perceived Health Benefit, and Environmental Perception. Int. J. Environ. Res. Public Health 2022, 19, 13640. [Google Scholar] [CrossRef]
  14. Asakawa, S.; Yoshida, K.; Yabe, K. Perceptions of Urban Stream Corridors within the Greenway System of Sapporo, Japan. Landsc. Urban Plan. 2004, 68, 167–182. [Google Scholar] [CrossRef]
  15. Liu, W.; Hu, X.; Song, Z.; Yuan, X. Identifying the Integrated Visual Characteristics of Greenway Landscape: A Focus on Human Perception. Sustain. Cities Soc. 2023, 99, 104937. [Google Scholar] [CrossRef]
  16. Akpinar, A. Factors Influencing the Use of Urban Greenways: A Case Study of Aydın, Turkey. Urban For. Urban Green. 2016, 16, 123–131. [Google Scholar] [CrossRef]
  17. Paneerchelvam, P.T.; Maruthaveeran, S.; Maulan, S.; Shukor, S.F.A. The Use and Associated Constraints of Urban Greenway from a Socioecological Perspective: A Systematic Review. Urban For. Urban Green. 2020, 47, 126508. [Google Scholar] [CrossRef]
  18. Liu, X.; Zhu, Z.; Jin, L.; Wang, L.; Huang, C. Measuring Patterns and Mechanism of Greenway Use—A Case from Guangzhou, China. Urban For. Urban Green. 2018, 34, 55–63. [Google Scholar] [CrossRef]
  19. Dallat, M.A.T.; Soerjomataram, I.; Hunter, R.F.; Tully, M.A.; Cairns, K.J.; Kee, F. Urban Greenways Have the Potential to Increase Physical Activity Levels Cost-Effectively. Eur. J. Public Health 2014, 24, 190–195. [Google Scholar] [CrossRef]
  20. Frank, L.D.; Hong, A.; Ngo, V.D. Causal Evaluation of Urban Greenway Retrofit: A Longitudinal Study on Physical Activity and Sedentary Behavior. Prev. Med. 2019, 123, 109–116. [Google Scholar] [CrossRef]
  21. Hunter, R.F.; Adlakha, D.; Cardwell, C.; Cupples, M.E.; Donnelly, M.; Ellis, G.; Gough, A.; Hutchinson, G.; Kearney, T.; Longo, A.; et al. Investigating the Physical Activity, Health, Wellbeing, Social and Environmental Effects of a New Urban Greenway: A Natural Experiment (the PARC Study). Int. J. Behav. Nutr. Phys. Act. 2021, 18, 142. [Google Scholar] [CrossRef]
  22. Wang, R.; Browning, M.H.; Kee, F.; Hunter, R.F. Exploring Mechanistic Pathways Linking Urban Green and Blue Space to Mental Wellbeing before and after Urban Regeneration of a Greenway: Evidence from the Connswater Community Greenway, Belfast, UK. Landsc. Urban Plan. 2023, 235, 104739. [Google Scholar] [CrossRef]
  23. Xu, B.; Shi, Q.; Zhang, Y. Evaluation of the Health Promotion Capabilities of Greenway Trails: A Case Study in Hangzhou, China. Land 2022, 11, 547. [Google Scholar] [CrossRef]
  24. Keith, S.J.; Larson, L.R.; Shafer, C.S.; Hallo, J.C.; Fernandez, M. Greenway use and preferences in diverse urban communities: Implications for trail design and management. Landsc. Urban Plan. 2018, 172, 47–59. [Google Scholar] [CrossRef]
  25. Palardy, N.P.; Boley, B.B.; Johnson Gaither, C. Residents and urban greenways: Modeling support for the Atlanta BeltLine. Landsc. Urban Plan. 2018, 169, 250–259. [Google Scholar] [CrossRef]
  26. Huang, Y.; Lin, T.; Xue, X.; Zhang, G.; Liu, Y.; Zeng, Z.; Zhang, J.; Sui, J. Spatial patterns and inequity of urban green space supply in China. Ecol. Indic. 2021, 132, 108275. [Google Scholar] [CrossRef]
  27. Liu, H.; Remme, R.P.; Hamel, P.; Nong, H.; Ren, H. Supply and demand assessment of urban recreation service and its implication for greenspace planning-A case study on Guangzhou. Landsc. Urban Plan. 2020, 203, 103898. [Google Scholar] [CrossRef]
  28. Tang, Y.; Xie, Y.; Sun, B.; Hao, Z.; Pei, N. Greenway service supply and public demand in Guangzhou city, China. Urban For. Urban Green. 2022, 76, 127711. [Google Scholar] [CrossRef]
  29. Wang, Y.; Lu, X.; Chen, Z.; Sheng, S. Research on Layout Optimization of Urban Micro Green Space Based on the Matching of Space Ef ciency and Recreational Demand: A Case Study on the Main Urban Area of Shiyan City. Landsc. Archit. Acad. J. 2022, 39, 11–19. [Google Scholar]
  30. Moreno, C.; Allam, Z.; Chabaud, D.; Gall, C.; Pratlong, F. Introducing the “15-Minute City”: Sustainability, Resilience and Place Identity in Future Post-Pandemic Cities. Smart Cities 2021, 4, 93–111. [Google Scholar] [CrossRef]
  31. Liu, B.; Wang, G.; Zhu, J.; Lu, M.; Cao, J.; Zhang, H. Identification of Cycling Activity Circles and Analysis of Their Network Patterns Based on Shared-Bicycle Big Data. Urban Plan. Forum 2023, 4, 32–40. [Google Scholar] [CrossRef]
  32. Tang, Y.; Pei, N.; Shi, Z.; Luo, S.; Luo, Y.; Liu, X.; Xie, Y.; He, J.; Tang, P.; Yang, C.; et al. The connectivity and accessibility of Guangzhou greenway network and their response to ur-banization. Chin. J. Ecol. 2022, 41, 1804–1812. [Google Scholar] [CrossRef]
  33. Li, J.; Lin, Y.; Dong, J.; Fu, W. Landscape Evaluation on Urban Waterfront under Semantic Segmentation Technology—Taking Xihu Park and Zuohai Park in Fuzhou as Examples. Chin. Landsc. Archit. 2022, 38, 92–97. [Google Scholar]
  34. Cai, X.; Wang, J.; Dong, Y. Assessment of Pedestrian Accessibility to Urban Parks Within the 15 Minute City Circle: A Case Study of Yueya Lake Park in Nanjing. Landsc. Archit. Acad. J. 2024, 41, 81–91. [Google Scholar]
  35. Li, X.; Cai, Y.; Ratti, C. Using Street-Level Images and Deep Learning for Urban Landscape Studies. Landsc. Archit. Front. 2018, 6, 20–29. [Google Scholar] [CrossRef]
  36. Lu, F.; Yin, H.; Kong, F. The Using Characteristics and Satisfaction of Urban Greenway—A Case Study of the Purple Mountain Greenway in Nanjing. Chin. Landsc. Archit. 2015, 31, 50–54. [Google Scholar]
  37. Zhou, Y. The Research on Recreation Behavior and Satisfaction of Recreation Facility of Urban Greenway—Based on the Urban Section of Hangzhou Sanjiang River Greenway. Archit. Cult. 2017, 95–96. [Google Scholar]
  38. Zhu, D.; Wang, H. The Value Orientation, Evaluation Method and Evaluation Index of Performance Evaluation of Public Ser-vices. J. Shanghai Econ. Manag. Coll. 2013, 11, 1–10. [Google Scholar]
  39. Ye, Y.; Zhang, Z.; Zhang, X. Human-scale Quality on Streets: A Large-scale and Efficient Analytical Approach Based on Street View Images and New Urban Analytical Tools. Urban Plan. Int. 2019, 34, 18–27. [Google Scholar] [CrossRef]
  40. Xiao, X.; Wei, Y.; Li, M. The Method of Measurement and Applications of Visible Green Index in Japan. Urban Plan. Inter-Natl. 2018, 33, 98–103. [Google Scholar]
  41. Chen, L.; Duan, Y. Accessibility Study of Urban Parks in Baoji City Based on Network Analysis. J. Northwest For. Univ. 2021, 36, 250–256. [Google Scholar]
  42. Guo, S.; Fan, Z.; He, J.; Li, Z. On Park Accessibility in Xixiangtang District of Nanning Based on Network Analysis. Chin. Landsc. Archit. 2019, 35, 68–72. [Google Scholar]
  43. Yu, C.; Wu, P. Review of Urban Green Space Walkability Assessment Method. Chin. Landsc. Archit. 2018, 34, 18–23. [Google Scholar]
  44. Zhang, Y.; Pei, N.; Cai, M.; Li, L.; Huang, J.; Wen, Y. Study on the Distribution and Accessibility of Greenways in Haizhu District, Guangzhou City. Urban. Archit. 2024, 21, 62–65. [Google Scholar]
  45. Comber, A.; Brunsdon, C.; Green, E. Using a GIS-based network analysis to determine urban greenspace accessibility for different ethnic and religious groups. Landsc. Urban Plan. 2008, 86, 103–114. [Google Scholar] [CrossRef]
  46. Lu, Q.; Qian, Z.; Huang, D.; Zhou, X. The Characteristics of Spatial Pattern Evolution and the Trend of the 15-Minute Life Circle. Urban Plan. Forum 2020, 6, 94–101. [Google Scholar]
  47. Chen, L.; Tan, S.; Yang, C.; He, Q. Research on the Evaluation of Urban Greenway Environmental Recreation Satisfaction from the Perspective of Perceived Value: A Case Study of Jiulongpo Greenway in Chongqing. Chin. Landsc. Archit. 2022, 38, 76–81. [Google Scholar]
  48. Baker, D.A.; Crompton, J.L. Quality, satisfaction and behavioral intentions. Ann. Tour. Res. 2000, 27, 785–804. [Google Scholar] [CrossRef]
  49. Lu, Y.; Chen, R.; Chen, B.; Wu, J. Inclusive green environment for all? An investigation of spatial access equity of urban green space and associated socioeconomic drivers in China. Landsc. Urban Plan. 2024, 241, 104926. [Google Scholar] [CrossRef]
  50. Svara, J.H.; Brunet, J.R. Social Equity Is a Pillar of Public Administration. J. Public Aff. Educ. 2005, 11, 253–258. [Google Scholar] [CrossRef]
  51. Zhu, W.; Wang, J.; Qin, B. Quantity or quality? Exploring the association between public open space and mental health in urban China. Landsc. Urban Plan. 2021, 213, 104128. [Google Scholar] [CrossRef]
  52. Liu, Z.; Lin, Y.; De Meulder, B.; Wang, S. Heterogeneous landscapes of urban greenways in Shenzhen: Traffic impact, corridor width and land use. Urban For. Urban Green. 2020, 55, 126785. [Google Scholar] [CrossRef]
  53. Chen, Y.; Gu, W.; Liu, T.; Yuan, L.; Zeng, M. Increasing the Use of Urban Greenways in Developing Countries: A Case Study on Wutong Greenway in Shenzhen, China. Int. J. Environ. Res. Public Health 2017, 14, 554. [Google Scholar] [CrossRef] [PubMed]
  54. Audate, P.P.; Romaric Da, S.M.A.; Diallo, T. Understanding the barriers and facilitators of urban greenway use among older and disadvantaged adults: A mixed-methods study in Québec city. Health Place 2024, 89, 103340. [Google Scholar] [CrossRef] [PubMed]
  55. Tzoulas, K.; James, P. Peoples’ use of, and concerns about, green space networks: A case study of Birchwood, Warrington New Town, UK. Urban For. Urban Green. 2010, 9, 121–128. [Google Scholar] [CrossRef]
  56. Liu, Z.; Lin, Y.; De Meulder, B.; Wang, S. Can greenways perform as a new planning strategy in the Pearl River Delta, China? Landsc. Urban Plan. 2019, 187, 81–95. [Google Scholar] [CrossRef]
  57. Mu, W.; Wang, G. Connective Urban Greenway Route Planning: A Spatial Optimization Perspective. Land 2024, 13, 1833. [Google Scholar] [CrossRef]
  58. Vatanparast, E.; Shataee Joibari, S.; Salmanmahiny, A.; Hansen, R. Urban greenway planning: Identifying optimal locations for active travel corridors through individual mobility assessment. Urban For. Urban Green. 2024, 101, 128464. [Google Scholar] [CrossRef]
  59. Horte, O.S.; Eisenman, T.S. Urban Greenways: A Systematic Review and Typology. Land 2020, 9, 40. [Google Scholar] [CrossRef]
  60. Shafer, C.S.; Lee, B.K.; Turner, S. A tale of three greenway trails: User perceptions related to quality of life. Landsc. Urban Plan. 2000, 49, 163–178. [Google Scholar] [CrossRef]
  61. Li, X.; Wang, X.; Jiang, X.; Han, J.; Wang, Z.; Wu, D.; Lin, Q.; Li, L.; Zhang, S.; Dong, Y. Prediction of riverside greenway landscape aesthetic quality of urban canalized rivers using environmental modeling. J. Clean. Prod. 2022, 367, 133066. [Google Scholar] [CrossRef]
  62. Ozkan, U.Y. Assessment of visual landscape quality using IKONOS imagery. Environ. Monit. Assess. 2014, 186, 4067–4080. [Google Scholar] [CrossRef]
  63. Sharma, A. Urban greenways: Operationalizing design syntax and integrating mathematics and science in design. Front. Archit. Res. 2015, 4, 24–34. [Google Scholar] [CrossRef]
Figure 1. Theoretical framework for evaluating the service effectiveness of urban greenways.
Sustainability 17 05745 g001
Figure 2. Source of the composite index for the evaluation of greenway service effectiveness.
Sustainability 17 05745 g002
Figure 3. Geographic location of municipal greenways in the main urban area of Nanjing.
Sustainability 17 05745 g003
Figure 4. Semantic segmentation diagram of urban greenway images.
Sustainability 17 05745 g004
Figure 5. Greenway survey sample points and the surrounding environment.
Sustainability 17 05745 g005
Figure 6. Urban greenway service effectiveness indicator composite score results.
Sustainability 17 05745 g006
Figure 7. Walking accessibility of each greenway within 15 min.
Sustainability 17 05745 g007
Figure 8. Cycling accessibility of each greenway within 15 min.
Sustainability 17 05745 g008
Figure 9. Vehicular accessibility of each greenway within 15 min.
Sustainability 17 05745 g009
Figure 10. Urban greenway user attributes.
Sustainability 17 05745 g010
Figure 11. The activities of urban greenway users.
Sustainability 17 05745 g011
Table 1. Dimensions and core indicators of public service performance evaluation.
Evaluation Dimensions Dimension ConnotationsCore IndicatorsData Characteristics
Efficiency and BenefitActual results after the implementation of the service. Judge the effectiveness of public services in the output of social benefits.Service coverage
Target achievement rate
Objective data
quantization
ResponsivenessAssess the degree of adaptation between public services and public needs.Public satisfaction survey demand response timeSubjective perception evaluation
FairnessCompare the differences in access to public services among different groups and regions.Balance degree of resource allocation
Difference rate of group benefit
Table 2. Research on the correlation among service efficiency dimension indicators.
Relevant StudiesIndicator CategoriesEvaluation IndicatorsIndicator Description
Study on the accessibility of parks and greenways [32,41,42,43,44].
GIS-based network analysis [45].
Study on the 15-min city concept [30].
Study on the 15-min life circle concept [31,46].
Connectivity
efficiency
Service scope Within 15 min, you can reach the walking, cycling, and vehicle range of the greenway space.
Transportation
connectivity
Connectivity between greenways and urban public transport.
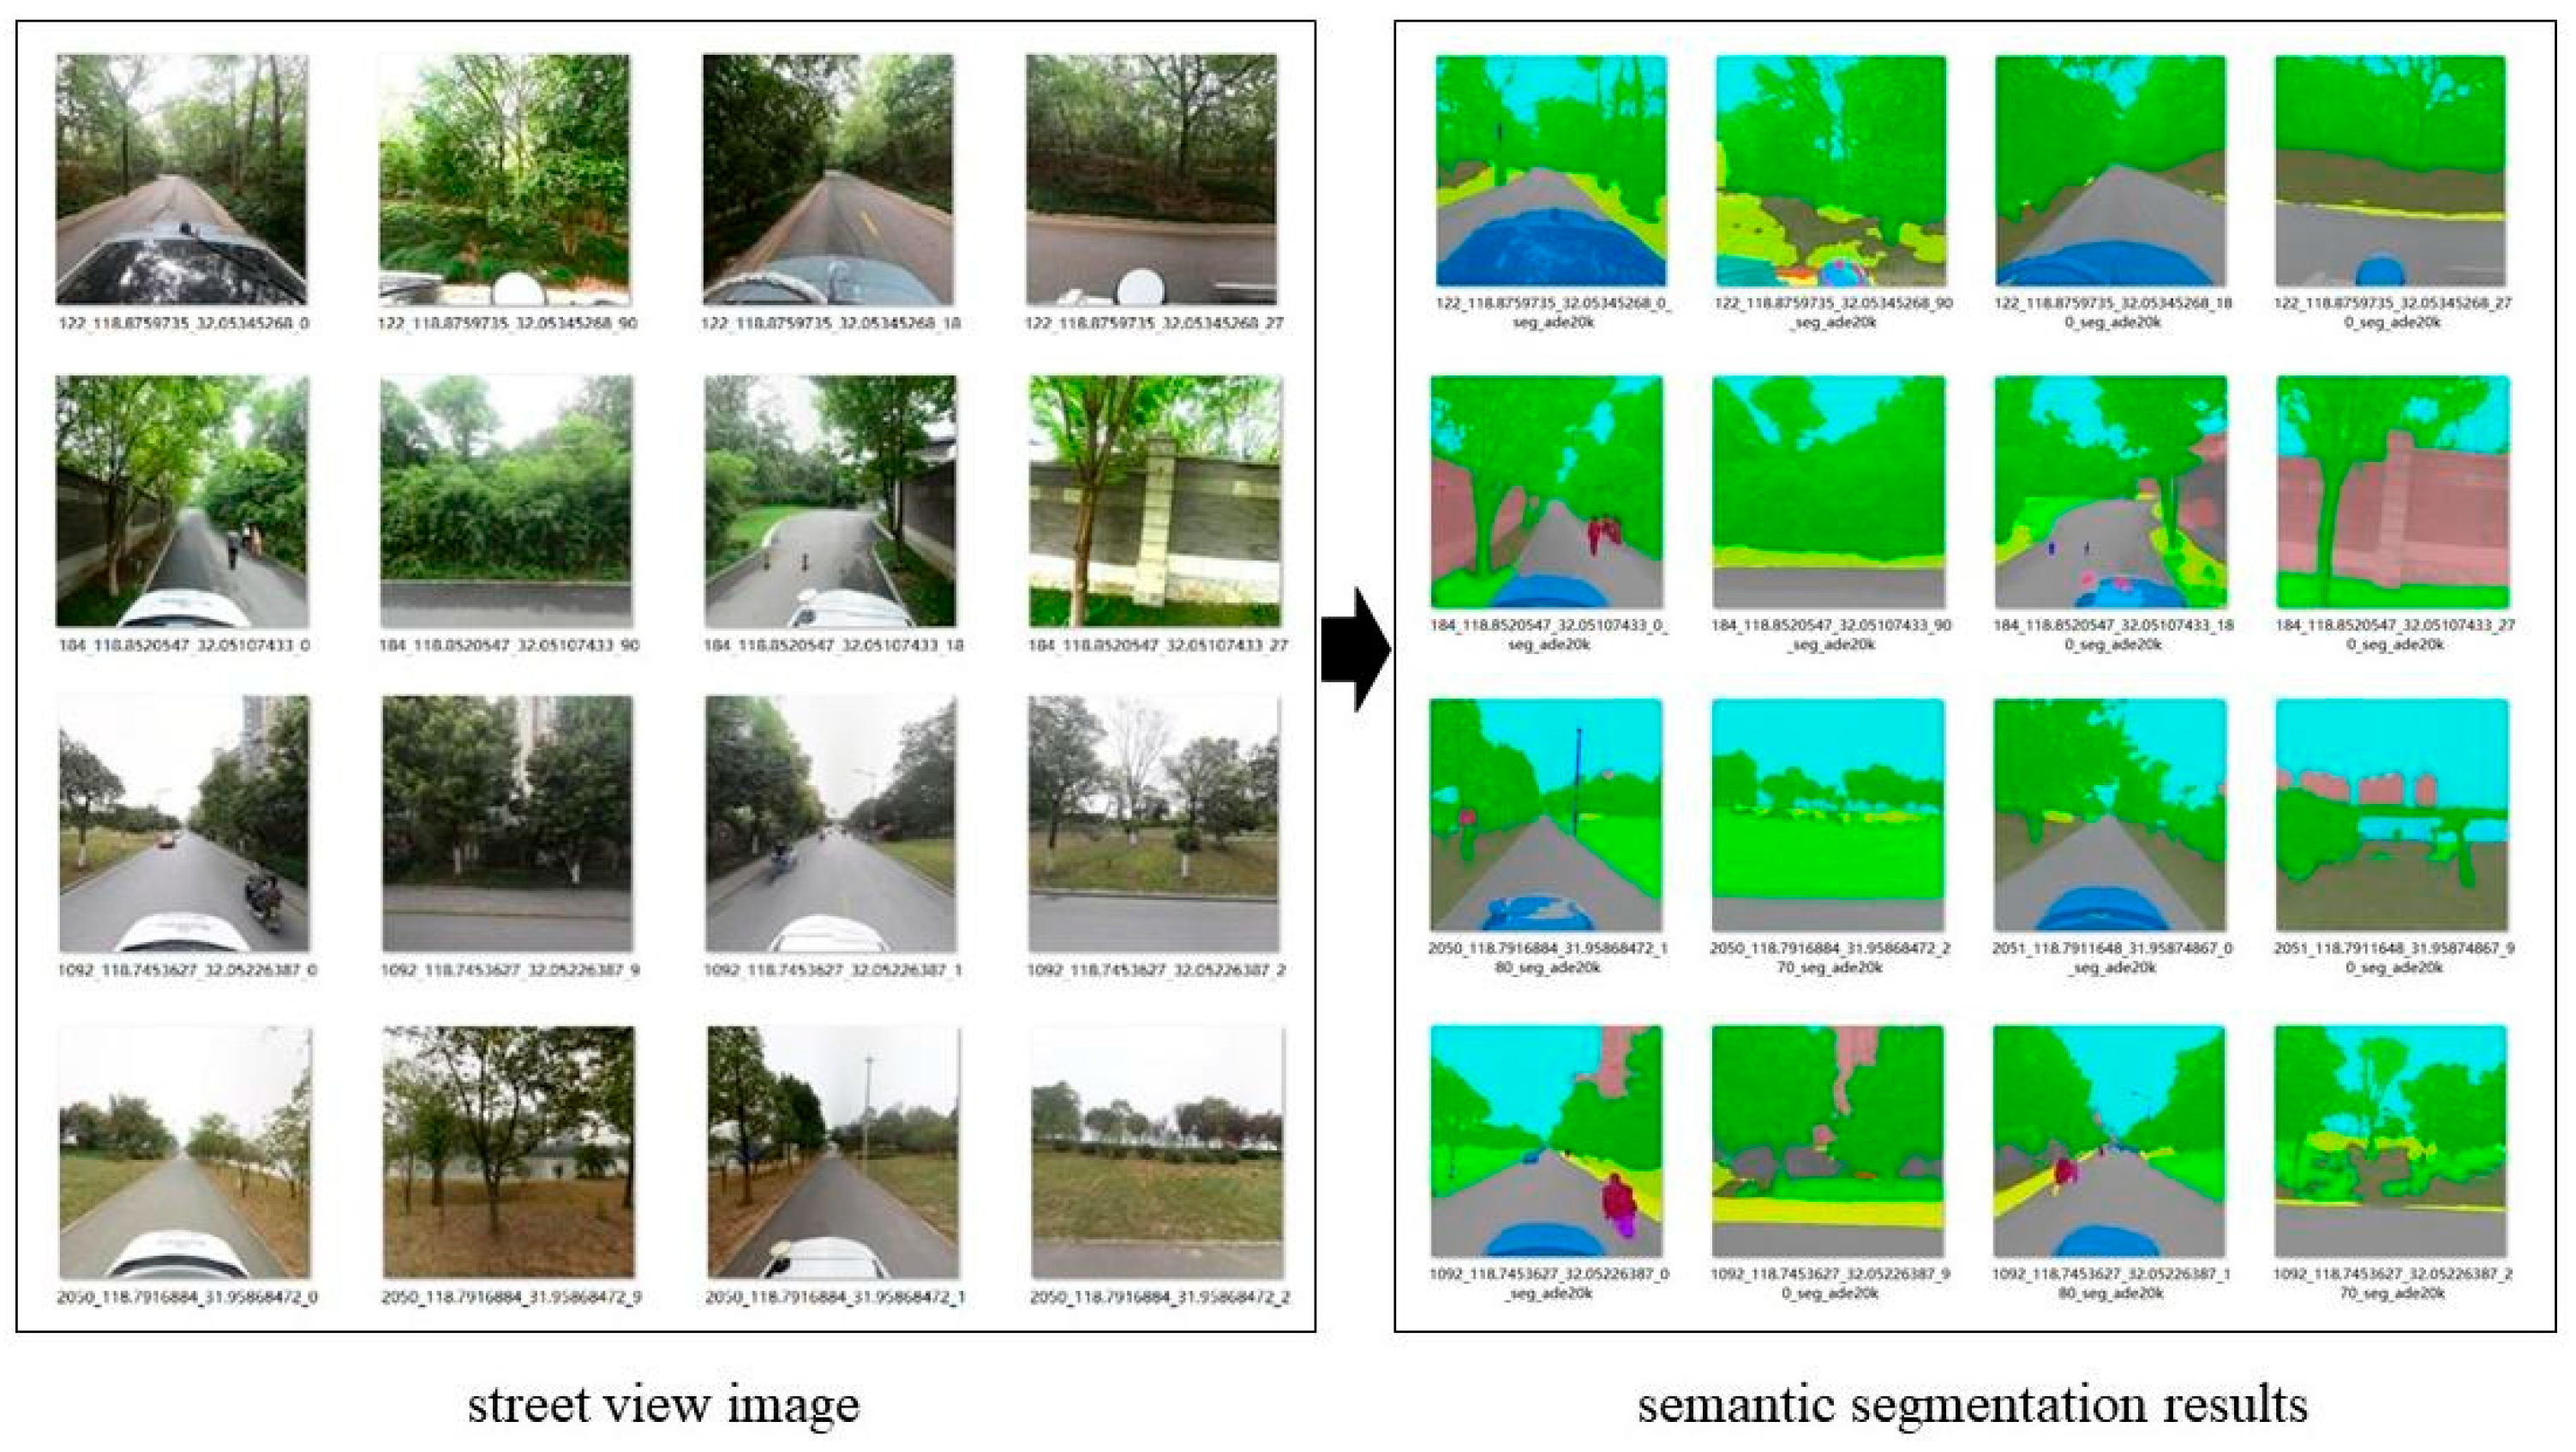
Study on the evaluation of urban waterfront green space beauty based on semantic segmentation technology [33].
Evaluation of park-related indicators based on image semantic segmentation technology [34].
Street images and deep learning [35].
Measurement of street space quality [39].
Calculation of green visibility [40].
Greenway planning and design guidelines.
Spatial
quality
Green visibilityThe proportion of green landscape in the human visual range.
Enclosure degreeThe proportion of buildings, walls, columns and fences in street view images.
Sky visibilityThe proportion of sky area to street view image.
Walkway spaceThe proportion of sidewalk area and pedestrian area to street view image.
Motor vehicle spaceThe proportion of motor vehicle lanes and vehicle area in street view images.
Service facilityThe proportion of greenway facilities (service facilities, signage facilities, and lighting facilities) in street view images.
Table 3. Research on the correlation among service effect dimension indicators.
Relevant StudiesIndicator CategoriesEvaluation IndicatorsIndicator Description
Characteristics of greenway use and perceived preferences [13,24].
A study on the use characteristics and satisfaction of urban greenways [36].
Satisfaction evaluation of urban greenway environmental recreation [47].
PerceptualOverall satisfactionReflects the overall satisfaction of users with the services provided by the greenway.
Advocacy impactUser demand response.
Evaluation of the service effectiveness of urban blue spaces [12].
Spatial equity in urban green spaces [49].
Social equity [50].
FairnessAge diversityReflects the equity of access to greenways by users of different ages.
Difference in satisfactionReflects the differentiated demands of users from different age groups.
Table 4. Results of questionnaire reliability and validity tests.
Greenway NameJiangnan
Riverside Greenway
Qinhuai
New River Greenway
Ming City Wall GreenwayPurple
Mountain Greenway
Number of valid questionnaires (copies)117119113124
Cronbach’s α0.8130.8350.7910.819
KMO0.8110.8020.7810.771
Table 5. Evaluation indicators and calculation methods.
Assessment DimensionsLevel 1
Indicators
Level 2
Indicators
Calculation Method
Service
efficiency
(A)
Connectivity efficiency (A1)Service scope (A11) S = i = 1 3 S i
S i indicates vehicular, biking, and walking accessibility of greenways within 15 min of each other.
Transportation connectivity
(A12)
Number of metro stations + number of bus stops
(within 15 min walk)
Spatial
quality
(A2)
Green visibility (A21) p i = j = 1 4 x x
i denotes the type of greenway spatial elements, j denotes the number of greenway streetscape images captured, x denotes the number of pixels, and x denotes the total number of image pixels.
Enclosure degree (A22)
Sky visibility
(A23)
Walkway space (A24)
Motor vehicle space
(A25)
Service facility (A26)
Service
effect
(B)
Perceptual
(B1)
Overall
satisfaction
(B11)
Z = 1 n i = 1 n Z i
n denotes the number of questionnaires at the sampling point and Z i denotes the satisfaction score in the ith questionnaire.
Advocacy
impact
(B12)
Q = 1 n i = 1 n Q i
n denotes the number of questionnaires at the sampling point and Q i denotes the satisfaction score in the ith questionnaire.
Fairness
(B2)
Age diversity
(B21)
H = i = 1 S P i ln P i
i denotes different age groups, categorized into four age groups ac-cording to age: under 20, 20–39, 40–60, and over 60; P i denotes the total number of active people in the age group as a proportion of the total number in the sample.
Difference in
satisfaction (B22)
S = i = 1 n ( x i x ¯ ) 2 n 1
x i denotes each value in the sample, x ¯ denotes the sample mean, and n denotes the number of values in the sample.
Table 6. Composite weighting table for evaluation indicators.
Objective LevelWeightsCriteria LayerWeightsIndicator LayerWeights
Service
efficiency
(A)
0.7075Connectivity efficiency (A1)0.2769Service scope (A11)0.1344
Transportation connectivity (A12)0.1425
Spatial quality (A2)0.4306Green visibility (A21)0.0804
Enclosure degree (A22)0.0480
Sky visibility (A23)0.0607
Walkway space (A24)0.0767
Motor vehicle space (A25)0.0399
Service facility (A26)0.1249
Service
effectiveness
(B)
0.2923Perceptual (B1)0.1083Overall satisfaction (B11)0.0701
Advocacy impact (B12)0.0382
Fairness (B2)0.1840Age diversity (B21)0.1008
Difference in satisfaction (B22)0.0832
Table 7. Score results of urban greenway service effectiveness evaluation indicators.
Evaluation IndicatorsJiangnan
Riverside Greenway
Qinhuai
New River Greenway
Ming City Wall GreenwayPurple
Mountain Greenway
Service scope 1.2661.2711.3451.215
Transportation connectivity0.0710.2641.4260.000
Connectivity efficiency1.3371.535 2.7711.215
Green visibility0.000 0.3160.2590.804
Enclosure degree0.1320.2640.480 0.000
Sky visibility0.7140.102 0.000 0.046
Walkway space0.6370.2580.9570.433
Motor vehicle space0.1960.0000.1710.400
Service facility0.000 0.0920.1520.076
Spatial quality1.6791.032 2.0191.759
Overall satisfaction0.0690.000 0.2920.205
Advocacy impact0.3250.000 0.2270.382
Perceptual0.3940.000 0.5190.587
Age diversity1.0090.3440.0000.606
Difference in satisfaction0.3440.0000.714 0.833
Fairness1.3530.3440.7141.439
Table 8. Public transportation stops within 15 min walking distance.
Public
Transportation
Stations
Jiangnan
Riverside
Greenway
Qinhuai New River GreenwayMing City Wall
Greenway
Purple
Mountain Greenway
Bus Stations579835643
Subway Stations1016417
Table 9. Percentage of greenway spatial quality elements.
ElementJiangnan
Riverside Greenway
Qinhuai New River GreenwayMing City Wall GreenwayPurple
Mountain Greenway
Green visibility0.2220.2750.2360.367
Enclosure degree0.0710.0790.1560.039
Sky visibility0.3350.3210.1870.198
Walkway space0.0490.0760.112 0.054
Motor vehicle space0.279 0.2250.2720.335
Service facility0.0030.0190.027 0.002
Table 10. Statistics on the demand for and characteristics of greenway use.
Features of UseOptionsJiangnan Riverside Greenway
(Proportions)
Qinhuai New River Greenway
(Proportions)
Ming City Wall Greenway
(Proportions)
Purple Mountain Greenway
(Proportions)
TransportationPublic transportation14.50%3.40%10.60%26.60%
Subway52.10%0.00%13.30%38.70%
Walking19.70%86.60%64.60%10.50%
Biking1.70%7.60%6.20%9.70%
Taxi6.00%2.50%0.90%13.70%
Private Car6.00%0.00%4.40%0.80%
Usage timeBefore 8:007.70%8.40%22.10%6.50%
8:00–13:0017.90%14.30%17.70%44.40%
13:00–18:0055.60%18.50%45.10%41.10%
After 18:0018.80%58.80%15.10%8.10%
Frequency of useFirst time here23.10%6.70%20.40%41.90%
Rarely come44.40%17.60%18.60%29.80%
1–3 times per week13.70%28.60%18.60%18.50%
More than four times per week18.80%47.10%42.50%9.70%
Table 11. Correlation analysis of factors influencing the service effectiveness of urban greenways.
Pearson Correlation Analysis
Connectivity
Efficiency
Spatial
Quality
PerceptualFairness
Landscape Environment0.2250.867 *0.913 **0.376
Greenway Function0.3220.2460.670 *0.561 *
Transportation0.774 **−0.1740.004−0.723
Facilities0.3290.754 *0.625 *0.152
Management and Protection−0.4820.4520.5120.667 *
* indicates that the correlation is significant at a confidence level (two-test) of 0.05. ** indicates that the correlation is significant at a confidence level (two-test) of 0.01.
Table 12. Emotional disposition statistics.
Emotional
Tendencies
Jiangnan
Riverside Greenway
Qinhuai
New River Greenway
Ming City Wall GreenwayPurple
Mountain Greenway
Positive mood83.40%81.99%85.10%84.39%
Neutral mood2.79%4.04%3.88%3.72%
Negative emotions13.81%13.97%11.02%11.90%
Disclaimer/Publisher’s Note: The statements, opinions and data contained in all publications are solely those of the individual author(s) and contributor(s) and not of MDPI and/or the editor(s). MDPI and/or the editor(s) disclaim responsibility for any injury to people or property resulting from any ideas, methods, instructions or products referred to in the content.

