Article

Assessing Walkability in Riyadh’s Commercial Streets: Public Perceptions and Prioritization

1
Riyadh Region Municipality, P.O. Box 2770, Riyadh 11146, Saudi Arabia
2
City 4.0 Lab, School of Architecture and Built Environment, Queensland University of Technology, 2 George Street, Brisbane, QLD 4000, Australia
3
School of Architecture and Built Environment, Queensland University of Technology, George Street, Brisbane, QLD 4000, Australia
*
Author to whom correspondence should be addressed.
Sustainability 2025, 17(13), 5748; https://doi.org/10.3390/su17135748
Submission received: 7 May 2025 / Revised: 5 June 2025 / Accepted: 11 June 2025 / Published: 23 June 2025
(This article belongs to the Section Sustainable Urban and Rural Development)

Abstract

:
Urban sustainability is closely linked to walkability, as it impacts social interaction, public health, and economic development. In megacities like Riyadh, where automobiles dominate mobility, the development of pedestrian infrastructure remains inadequate. An online survey was conducted through public sampling to evaluate walking conditions in central Riyadh’s commercial districts. The 302 participants evaluated 49 critical walkability indicators to determine their significance and satisfaction with the current conditions. Gap analysis and a displeasure measurement framework identified pedestrian challenges. Participants acknowledged the importance of walkability aspects but expressed strong dissatisfaction with existing conditions. Key barriers to pedestrian comfort included inadequate facilities, environmental discomfort, weak safety measures, and cultural driving preferences. The study highlighted crucial walkability issues requiring improvement, such as public toilets, shaded pathways, air quality, and pedestrian-friendly infrastructure. The findings emphasize the need for targeted policy interventions in Riyadh’s commercial districts to enhance pedestrian accessibility and comfort, to promote urban sustainability through improved walkability. This study offers a methodological advancement by combining Relative Importance Index, gap analysis, and a novel disgruntlement measurement framework to assess walkability. The use of 49 Delphi-derived indicators contextualized within a GCC megacity adds a unique perspective to urban sustainability research. The findings inform both local policy and global urban studies by demonstrating how culturally and climatically adaptive walkability metrics can guide equitable, data-driven interventions.

1. Introduction

Walkability is the main focus in urban planning and development in a new era to make cities more liveable, sustainable, and environmentally friendly. A city with walking facilities promotes physical activity, which improves health conditions, reduces carbon, and increases economic sustainability and social engagement [1,2]. Existing research highlights that pedestrian-friendly infrastructure contributes to increased pedestrian traffic, increased property values, and enhanced social cohesion [3,4]. However, in the presence of automobiles and other vehicles, it is always a challenge to implement walkability factors in the Gulf Cooperation Council (GCC) region. In the GCC, urban development has historically focused on vehicle transportation [5].
Riyadh, the capital of Saudi Arabia, is rapidly expanding, and the city’s traffic is also rapidly increasing. This city’s growth has been recorded as a low-density urban extension with an extensive road network designed primarily for vehicular mobility [6]. This situation leads to insufficient pedestrian infrastructure in Riyadh, limited accessibility, safety concerns, environmental discomfort, and cultural preferences for driving, all of which result in a lack of walkable spaces [7]. Past research about walkability in Riyadh documented several problems, including harsh climate, inconsistent pedestrian infrastructure, and minimal public transit coordination [8]. Multiple discouraging factors reduce walking as a primary transportation method, restricting the mobility of people who do not own cars.
Under Vision 2030, Saudi Arabia has increased its awareness about improving walkability in Riyadh because it understands that this initiative directly relates to enhancing urban standards and sustainable transportation systems [9]. Riyadh has implemented essential projects like Riyadh Metro and King Salman Park to add pedestrians to its urban planning framework [10]. Public opinion about walkability in Riyadh has limited scientific documentation despite needing extensive pedestrian traffic in commercial areas.
This research addresses this knowledge gap by investigating the public understanding of walkability standards in Riyadh’s vital commercial district. The research investigated 49 walkability indicators originating from previous Delphi research and organized these indicators into safety functionality, environmental quality, comfort aesthetics, and cultural relevance. A public opinion survey spanned eight weeks to determine resident opinions about indicator priority and satisfaction levels. The research included 302 participants who contributed significant findings about walking obstacles and priorities in Riyadh’s commercial areas.
The research uses gap analysis and dissatisfaction measurement as survey analysis tools to detect differences between perceived importance and satisfaction perceptions [11]. The assessment method defines essential areas where action needs to be taken based on their significance. Research participants show significant unhappiness toward the current walkability standards because public toilets and shaded areas are inadequate, and they experience poor air quality, insufficient pedestrian crossings, and poor sidewalk maintenance. Most survey participants showed concern about the substandard walkability infrastructure, inadequate pedestrian safety features, and severe environmental conditions, even though lighting and security rated higher in satisfaction.
This research narrows down weaknesses in urban walkability to help expand knowledge about pedestrian-friendly policies in the GCC region. These research results present recommendations that guide policy leaders, urban planners, and transportation officials who aim to improve their pedestrian zones within Riyadh’s commercial districts. As Saudi Arabia experiences fast urban expansion and works toward sustainability targets, improving pedestrian convenience becomes necessary for building an accessible metropolitan environment. The study provides essential quantitative evidence for upcoming pedestrian-friendly solutions that follow international guidelines while respecting Saudi Arabian cultural contexts. Enhancing walkability contributes directly to the UN Sustainable Development Goals (SDGs), particularly SDG 11: Sustainable Cities and Communities [12]. It supports environmental sustainability by lowering emissions, enhances health through active mobility, and fosters inclusive access to urban services. Therefore, this study aims to
  • Assess public perceptions of walkability indicators in Riyadh’s commercial streets;
  • Identify key walkability gaps based on importance and satisfaction measures;
  • Propose evidence-based, context-specific urban design improvements.
The central research question guiding this study is as follows:
“How do residents of Riyadh perceive walkability in commercial streets, and which indicators represent the greatest gap between importance and satisfaction in a car-oriented urban environment?”

2. Background

Walkability is an important feature in modern urban development because urban sustainability remains the primary issue of modern urban planning. Walkability represents the overall safety, accessibility, and welcoming character of urban spaces for pedestrians. Many advantages are connected to this principle, starting with public health improvements and decreased carbon emissions, which result in better social ties [13,14,15,16]. The research suggests that a pedestrian-friendly environment motivates people to walk, which leads to decreased obesity levels and related health problems, thus boosting community health [17,18]. Property values increase when the atmosphere supports pedestrian access because the planning that helps walking attracts more businesses and residents [16].
Previous studies in Melbourne [19] and Abu Dhabi [20] have demonstrated that incorporating shaded walkways, pedestrian signage, and improved street furniture significantly boosts walkability scores and public satisfaction. These studies underline the importance of comfort and accessibility as core pillars of urban mobility. Walkable infrastructure remains a challenge as many megacities struggle to adopt it because they belong to cultures where driving remains the most important form of transportation. Rapid urban development and Saudi Arabian cultural preferences for automobile usage have resulted in deficient walkable spaces throughout Riyadh, the capital of Saudi Arabia [21,22]. Megacity planning supports car traffic, which leads to environments that do not work well for pedestrians or bicyclists [22]. Cities worldwide, including Riyadh, have implemented vehicle-based policies that create new transportation-related problems, including more congestion, air pollution, and greenhouse gas emissions [23,24]. Urban planners work for sustainable transportation modes and walkable designs of cities because of multiple emerging challenges [14,19].
The “15-Minute City” concept has intensified its status as an urban sustainability model because it aims for access to essential services within a 15 min movement radius [25,26]. Through this approach, the community obtains both better walking capabilities and greater social connections and community involvement, which builds social unity [25,26]. The improvement in walkability results in substantial environmental advantages through decreased carbon emissions and better air quality [27,28]. The mitigation of urban sprawl alongside car dependency becomes possible through city investments in pedestrian infrastructure together with primary transport promotion by walking [21,29].
Walkability includes a diverse set of elements that combine the physical framework and safety mechanisms along with comfort features and environmental standards [30]. Scientific investigations demonstrate that accessible cities allow people to remain active while decreasing driving habits and supporting social bonding [31,32]. The rapid urbanization in Middle Eastern cities reveals pedestrian infrastructure gaps that act as key sustainability obstacles [20,33]. Due to its desert climate and large development scale and driving culture, Riyadh shares common obstacles with other cities in the coastal region.
In cities where automobile usage increases, it usually becomes unfriendly for pedestrians because walking conditions become both unsafe and unpleasant. Research indicates that walkability faces barriers due to insufficient sidewalks, limited connectivity and insufficient safety measures in addition to a lack of proper shading [34,35]. High traffic speeds together with insufficient crossing facilities function as safety obstacles that discourage people from walking [36]. The factors creating barriers to walkability in Riyadh are due to intense temperatures, poor air quality, and a cultural tradition of using personal vehicles [37,38]. The inadequate understanding among the public about walkability benefits stands as an obstacle preventing the promotion of pedestrian-friendly urban planning [39,40].
A complete evaluation of walkability depends on the analysis of objective data together with subjective indicators. Gap analysis and displeasure frameworks serve as established tools to examine differences between walkability factor significance and user satisfaction [41,42]. The approaches help pinpoint fundamental spots that require intervention, including facilities for walking pedestrians and standards of comfort along with safety measures [43]. The assessment of walkability needs to consider cultural and climate-specific elements for regions facing Middle Eastern conditions [44].
Walkability improvement strategies that enhance accessibility in automobile-oriented cities receive valuable feedback from various case studies. Melbourne and Barcelona serve as examples where pedestrian-friendly decisions led to successful results through the creation of shaded pathways, together with better air quality initiatives as well as enhanced public amenities [45,46]. The necessary reforms for addressing walkability challenges in Riyadh include infrastructure development alongside public education initiatives and legislative alterations that meet Vision 2030 standards for sustainable development [47]. The literature highlights the need for the assessment of Riyadh commercial districts’ walkability alongside the detailed identification of necessary improvements. The literature also summarizes the walkability requirements and current developments in this area. The next section will discuss the methodology. This study applies an integrated conceptual approach drawing from gap theory [48], commonly used in service quality research. By adapting it for urban walkability, we assess both the importance of pedestrian infrastructure and satisfaction with its performance. Few studies in the GCC context have operationalized this model in combination with Delphi-derived indicators.

3. Methodology

An examination of the literature revealed various interpretations of walkability and multiple definitions of what constitutes a walkable environment. A survey was conducted over eight weeks to gain deeper insight into public perceptions of walkability within Riyadh’s central area. Building upon the Delphi study’s identification of 49 essential walkability indicators with high consensus and significance scores, the survey aimed to evaluate basic responses toward all indicators and gauge public opinion on walking experiences in central Riyadh’s commercial districts. The data collected through this methodology enabled researchers to better understand the importance of different walkability aspects to residents and their satisfaction levels with these components.

3.1. Participants

Participants were recruited using a combination of random sampling with respondent-driven sampling (RDS) methods, which employed social-based recruitment strategies to achieve a diverse representation of Riyadh’s population. Invitations were extended to 745 male and female residents of Riyadh, resulting in 302 completed surveys and a 40.5% response rate. Data collection took place from 13 July to 8 September 2021. A total of 53 participants were excluded from the analysis due to their inability to recognize any of the 12 selected streets in central Riyadh. These excluded responses were considered incomplete and not accounted for in the response rate calculation. The public surveys obtained public sentiment measurements by conducting the survey. While respondent-driven and snowball sampling techniques were suitable for reaching a wide demographic during the COVID-19 period, they may have introduced selection biases that limited the generalizability of findings. Participants with limited internet access or unfamiliarity with digital tools may have been underrepresented. To counter this, initial participants were stratified by gender and location, and efforts were made to reach underrepresented groups.
Due to limited public accessibility and pandemic-related constraints, a combination of respondent-driven sampling (RDS) and snowball techniques was employed. While this approach enabled demographic diversity, it may have excluded residents without reliable internet access or digital literacy. This limitation should be considered when interpreting the generalizability of the findings.

3.2. Data Collection Procedure for Questionnaire

This study adopted a snowball sampling technique, an effective method for recruiting participants through social networks [49]. The process began by inviting twelve participants, split evenly between six males and six females, to ensure a balanced representation of both sexes. On 13 July 2021, researchers initiated the data collection process by distributing the questionnaire to these initial participants via email. To broaden the survey’s reach and engage additional individuals familiar with Riyadh’s central district, participants were encouraged to share the questionnaire link with their acquaintances and friends through accessible channels, such as QR code scanning, email, and WhatsApp.

3.3. Data Analysis Procedures

The collected data were analysed using both quantitative and qualitative methods to assess public perceptions of walkability in Riyadh’s commercial areas.
The 49 walkability indicators were derived from a previous Delphi study involving 20 urban planning and mobility experts. Conducted in two iterative rounds, this process ensured indicators reflected cultural, climatic, and functional relevance specific to Riyadh. Consensus was defined as 80% or higher agreement. Indicators were categorized under five domains: cultural, functional, safety, comfort, and aesthetic dimensions.
Quantitative analysis employed the Relative Importance Index (RII) to determine the priority of 49 walkability indicators [50,51]. Each indicator was rated on a five-point Likert scale, and the RII was computed using the formula
RII = W A × N
where
  • W is the weight given to each indicator by respondents (ranging from 1 to 5);
  • A is the highest possible weight (i.e., 5);
  • N is the total number of respondents.
This index ranks indicators from highest to lowest importance based on public perception.
To identify dissatisfaction, a gap analysis was conducted by comparing the importance scores with the corresponding satisfaction scores. Respondents rated their satisfaction on a five-point Likert scale ranging from “Very Dissatisfied” to “Very Satisfied”. Indicators that were rated as important but had low satisfaction scores were flagged as critical areas requiring attention.
A disgruntlement index was also calculated by isolating responses where participants rated an indicator as “Important” or “Very Important” but also as “Dissatisfied” or “Very Dissatisfied.” This binary dissatisfaction filter helped highlight walkability features with the greatest mismatch between expectation and experience.
For qualitative insights, open-ended responses were thematically analysed using NVivo (Release 1.5.2). Thematic coding was applied to identify recurring patterns related to functional barriers, environmental discomfort, and cultural walkability preferences. These themes complemented quantitative findings by providing contextual depth.
All statistical processing was conducted using SPSS (version 27), and NVivo was used for qualitative coding.

4. Analysis

Data obtained from participant ratings of streets in Riyadh’s central area were utilized to evaluate walkability characteristics. The Key Survey (REF) platform facilitated the creation of a survey with a side-by-side matrix structure, enabling the assessment of importance and satisfaction ratings for the study’s 49 variables derived from the Delphi study. A gap analysis was conducted between satisfaction ratings and identified the importance levels to identify areas requiring improvement. The satisfaction model, which incorporated important assessment techniques, proved valuable in identifying shortcomings within the walking environment [50].
SPSS software (version 27) was employed to process the data and conduct descriptive analysis, including demographic questionnaire entries (International Business Machines, Armonk, NY, USA, 2021). Qualitative analysis was employed to gain insights into the participants’ perceptions and experiences related to walkability in central Riyadh. The public survey results began with an examination of participant demographics, followed by an analysis of their travel behaviour through multiple questionnaire inquiries. From the survey we then compared walking perceptions in Riyadh in contrast with non-GCC metropolitan areas to provide a broader context. Walkability indicators were then assessed in terms of their importance level and satisfaction ratings using three analytical methods: Relative Importance Index, gap analysis, and disgruntlement measurement. As a final step, the analysis results were used to identify crucial walkability elements that warrant further attention and improvement to enhance the overall walking experience in the region.

4.1. Quantitative Findings

Results from the survey suggest that residents in Riyadh have a clear understanding of walkability aspects. The participants ranked the walkability indicators with Relative Importance Index (RII) values that spanned from 0.772 to 0.887. Akadiri [52] explained that RII values demonstrate varying degrees of importance from high to low. All Relative Importance Index values in this research exceed 0.6, which demonstrates that Riyadh residents view all walkability indicators as fundamental elements in the study. This high level of importance in Table 1 confirms that the identification of essential indicators in the first study phase was accurate.
Table 2 shows the relative importance of each of the walkability indicators. The indicators in each category were ranked according to the RII value from highest to lowest. In addition, the table shows the importance level of these indicators.

4.2. Gap/Disgruntlement Analysis

In this study, “disgruntlement” refers to indicators rated as both highly important and highly dissatisfactory by respondents. This construct is adapted from the gap theory in service quality research (e.g., the SERVQUAL model) [53], where mismatches between expectation and perception signal performance failure. Here, we extend this logic to spatial planning by identifying walkability features with the highest user frustration potential.
Disgruntlement was calculated by identifying users who assigned high importance (4 or 5 on a Likert scale) but low satisfaction (1 or 2) to an indicator. This binary classification highlights areas of high expectation but poor performance, consistent with established dissatisfaction measurement techniques in service quality and urban perception research. A revised gap analysis was conducted through disgruntlement measurement, which determined ratings for walkability indicator importance and satisfaction. This method served to discover which walkability indicators need the highest level of improvement for Riyadh’s central commercial urban areas. The research implemented the methodology structure developed by Stradling [54]. An analysis based on expert responses from the Delphi exercise and street user surveys established the local walkability elements of most significance. Subsequently, professional assessments evaluated each element’s significance together with implementation-level performance. During the third assessment phase, the researchers established importance and satisfaction evaluations for the 49 walkability indicators. The evaluation of these indicators proceeded through the analysis of different response patterns across demographic groups including gender age groups, social status, and occupational classifications. A ranking of the 49 walkability indicators demonstrates their importance levels based on Table 3. Most walkability indicators received importance from more than 70% of participants, but slopes received ratings from 67% of participants.
Researchers evaluated the extent to which participants were content with various walkability indicators. Table 4 shows the performance statistics of the 49 satisfaction indicators ranked in order from most to least satisfactory measures. Data show that only five indicators scored satisfaction rates above 50%, including areas with adequate lighting, easily accessible mosques and prayer rooms, and street visibility during movement. Additionally, a variety of activities and clear signage received good marks from respondents. One of the most subjective indicators received a satisfaction rate of only 28% when students evaluated distinct pleasant smells. Students proved to be the most content group as they were satisfied with 50% of the indicators, and retirees, alongside seniors, displayed the lowest level of satisfaction. For improved clarity, the study displays indicators that received more than 50% satisfaction.
The next step in the disgruntlement approach involved calculating disgruntlement against importance for the 49 walkability indicators. This was performed by cross-tabulating each indicator’s satisfaction rating with its importance rating. Disgruntled respondents were identified as those who were strongly dissatisfied or dissatisfied while also rating the indicator as important or very important. Table 5 provides an example of this calculation for the “provision of lighting” indicator. Approximately 15% of respondents (0.33% + 10.26% + 0.66% + 3.64%) indicated that this factor was important to them, yet they were not satisfied with its presence in Riyadh’s central area.
Analysis through cross-tabulations of all 49 indicators resulted in the calculation of “disgruntled user” percentages as presented in Table 6. The cross-tabulations arranged the disgruntlement statistics beginning with the highest rates. The study revealed public toilets as the most disliked facility, creating dissatisfaction in 49% of participants, whereas mosques and prayer rooms had the lowest level of dissatisfaction with 13%. Senior citizens and retired individuals manifested the strongest discontentment regarding public toilets since their dissatisfaction reached 67%. The elderly and retired respondents demonstrated the least dissatisfaction, at 2%, regarding the many activities available. The results demonstrate that individuals of senior and retirement age primarily seek comfort indicators, including public toilets and benches with shelters and canopies instead of the activity variety. Results showed senior and retired participants to be the most negative group, while student respondents displayed the least dissatisfaction toward walkability indicators.
The research identifies the main barriers to walking in Riyadh’s downtown commercial areas between poor pedestrian facilities and unfavorable climate conditions alongside popular car culture. Residents show appreciation for walkability, but 80% of them remain dissatisfied because of severe heat along with air pollutants and insufficient walking-friendly infrastructure and security risks and non-existent walking promotion rules. The majority of pedestrians in Riyadh choose walking to reach their places of employment, eat out, or meet relatives, while showing tentative interest in additional distances for shopping and recreation purposes.
The study established that comfort-related factors including public toilets, benches, and shelters represented the foremost points of dissatisfaction, and seniors and retirees demonstrated the highest level of discontentment. Participants who experienced high levels of dissatisfaction mainly expressed their displeasure towards environmental factors, including noise levels, air pollution, and uncomfortable thermal temperatures. The satisfaction ratings for lighting provision and accessibility to mosques, along with street signage, variety of activities, and street crossing visibility, were found to be high among participants.
Thirty important indicators were found through the gap analysis that require immediate attention, with public toilets, thermal comfort, pedestrian crossings, landscaping, and access to public transportation being the most pressing concerns.
The research results highlight an immediate requirement for strategic urban planning because it will advance pedestrian infrastructure throughout Riyadh. The improvement in pedestrian infrastructure in Riyadh demands the creation of shaded areas combined with better street furniture and accessible areas, as well as the development of walkability-focused regulations. The resolution of these concerns will develop a more welcoming walking environment, thus supporting sustainable urban transportation along with enhancing the general life quality in the city. These findings enable local authorities as well as officials and executives in shaping Riyadh’s upcoming walkability and transportation strategies.

5. Results

The discussion of these findings provides valuable insights into the unique challenges and opportunities for promoting walkability in Riyadh and informs potential strategies for urban planning and policy development. NVivo software (Release 1.5.2) (QSR International, Melbourne, Australia, 2021) was utilized to process and analyse qualitative data derived from the respondent inputs. This thematic approach offered valuable insights into the various aspects of walkability that were most relevant to the participants, complementing the quantitative findings and contributing to a comprehensive understanding of walkability in Riyadh’s central area.

5.1. Individual Characteristics

The participant demographics in Table 7 reveal that male participants made up 52% of the sample, while females accounted for 48%. The most represented age group ranged from 24 to 34 years old (28%). More than half of the participants (56%) identified as married with children. In terms of employment status, (50%) of respondents were employees and (25%) were students. Regarding educational attainment, 51% of respondents held a bachelor’s degree (51%), while 13% had obtained a master’s degree. Geographically, 36% of the respondents resided in northern Riyadh, followed by 26% in eastern Riyadh and 15% in central Riyadh. Nearly half of the participants (46%) rated their walking ability as excellent, while 32% described it as very good. Car availability was high, with 70% always having access to a vehicle, 26% having occasional access, and 4% not having access to a car. The majority of respondents were Saudi nationals (95%). In terms of monthly income, the largest group (22%) reported earnings between SAR 8001 and 12,000, falling within the middle-income bracket, while 19% reported a high income exceeding SAR 20,000.

5.2. Travel Behaviour

This section examines respondents’ travel behaviours and preferences, including their familiarity with central Riyadh’s commercial streets and their evaluation of walkability quality in the Ad-Dirah district and the Ad-Dirah district. Furthermore, the study investigated the frequency and modes of transportation used by respondents, their motivations for walking in the central area, acceptable walking distances, and any alterations in area visits due to the COVID-19 pandemic.

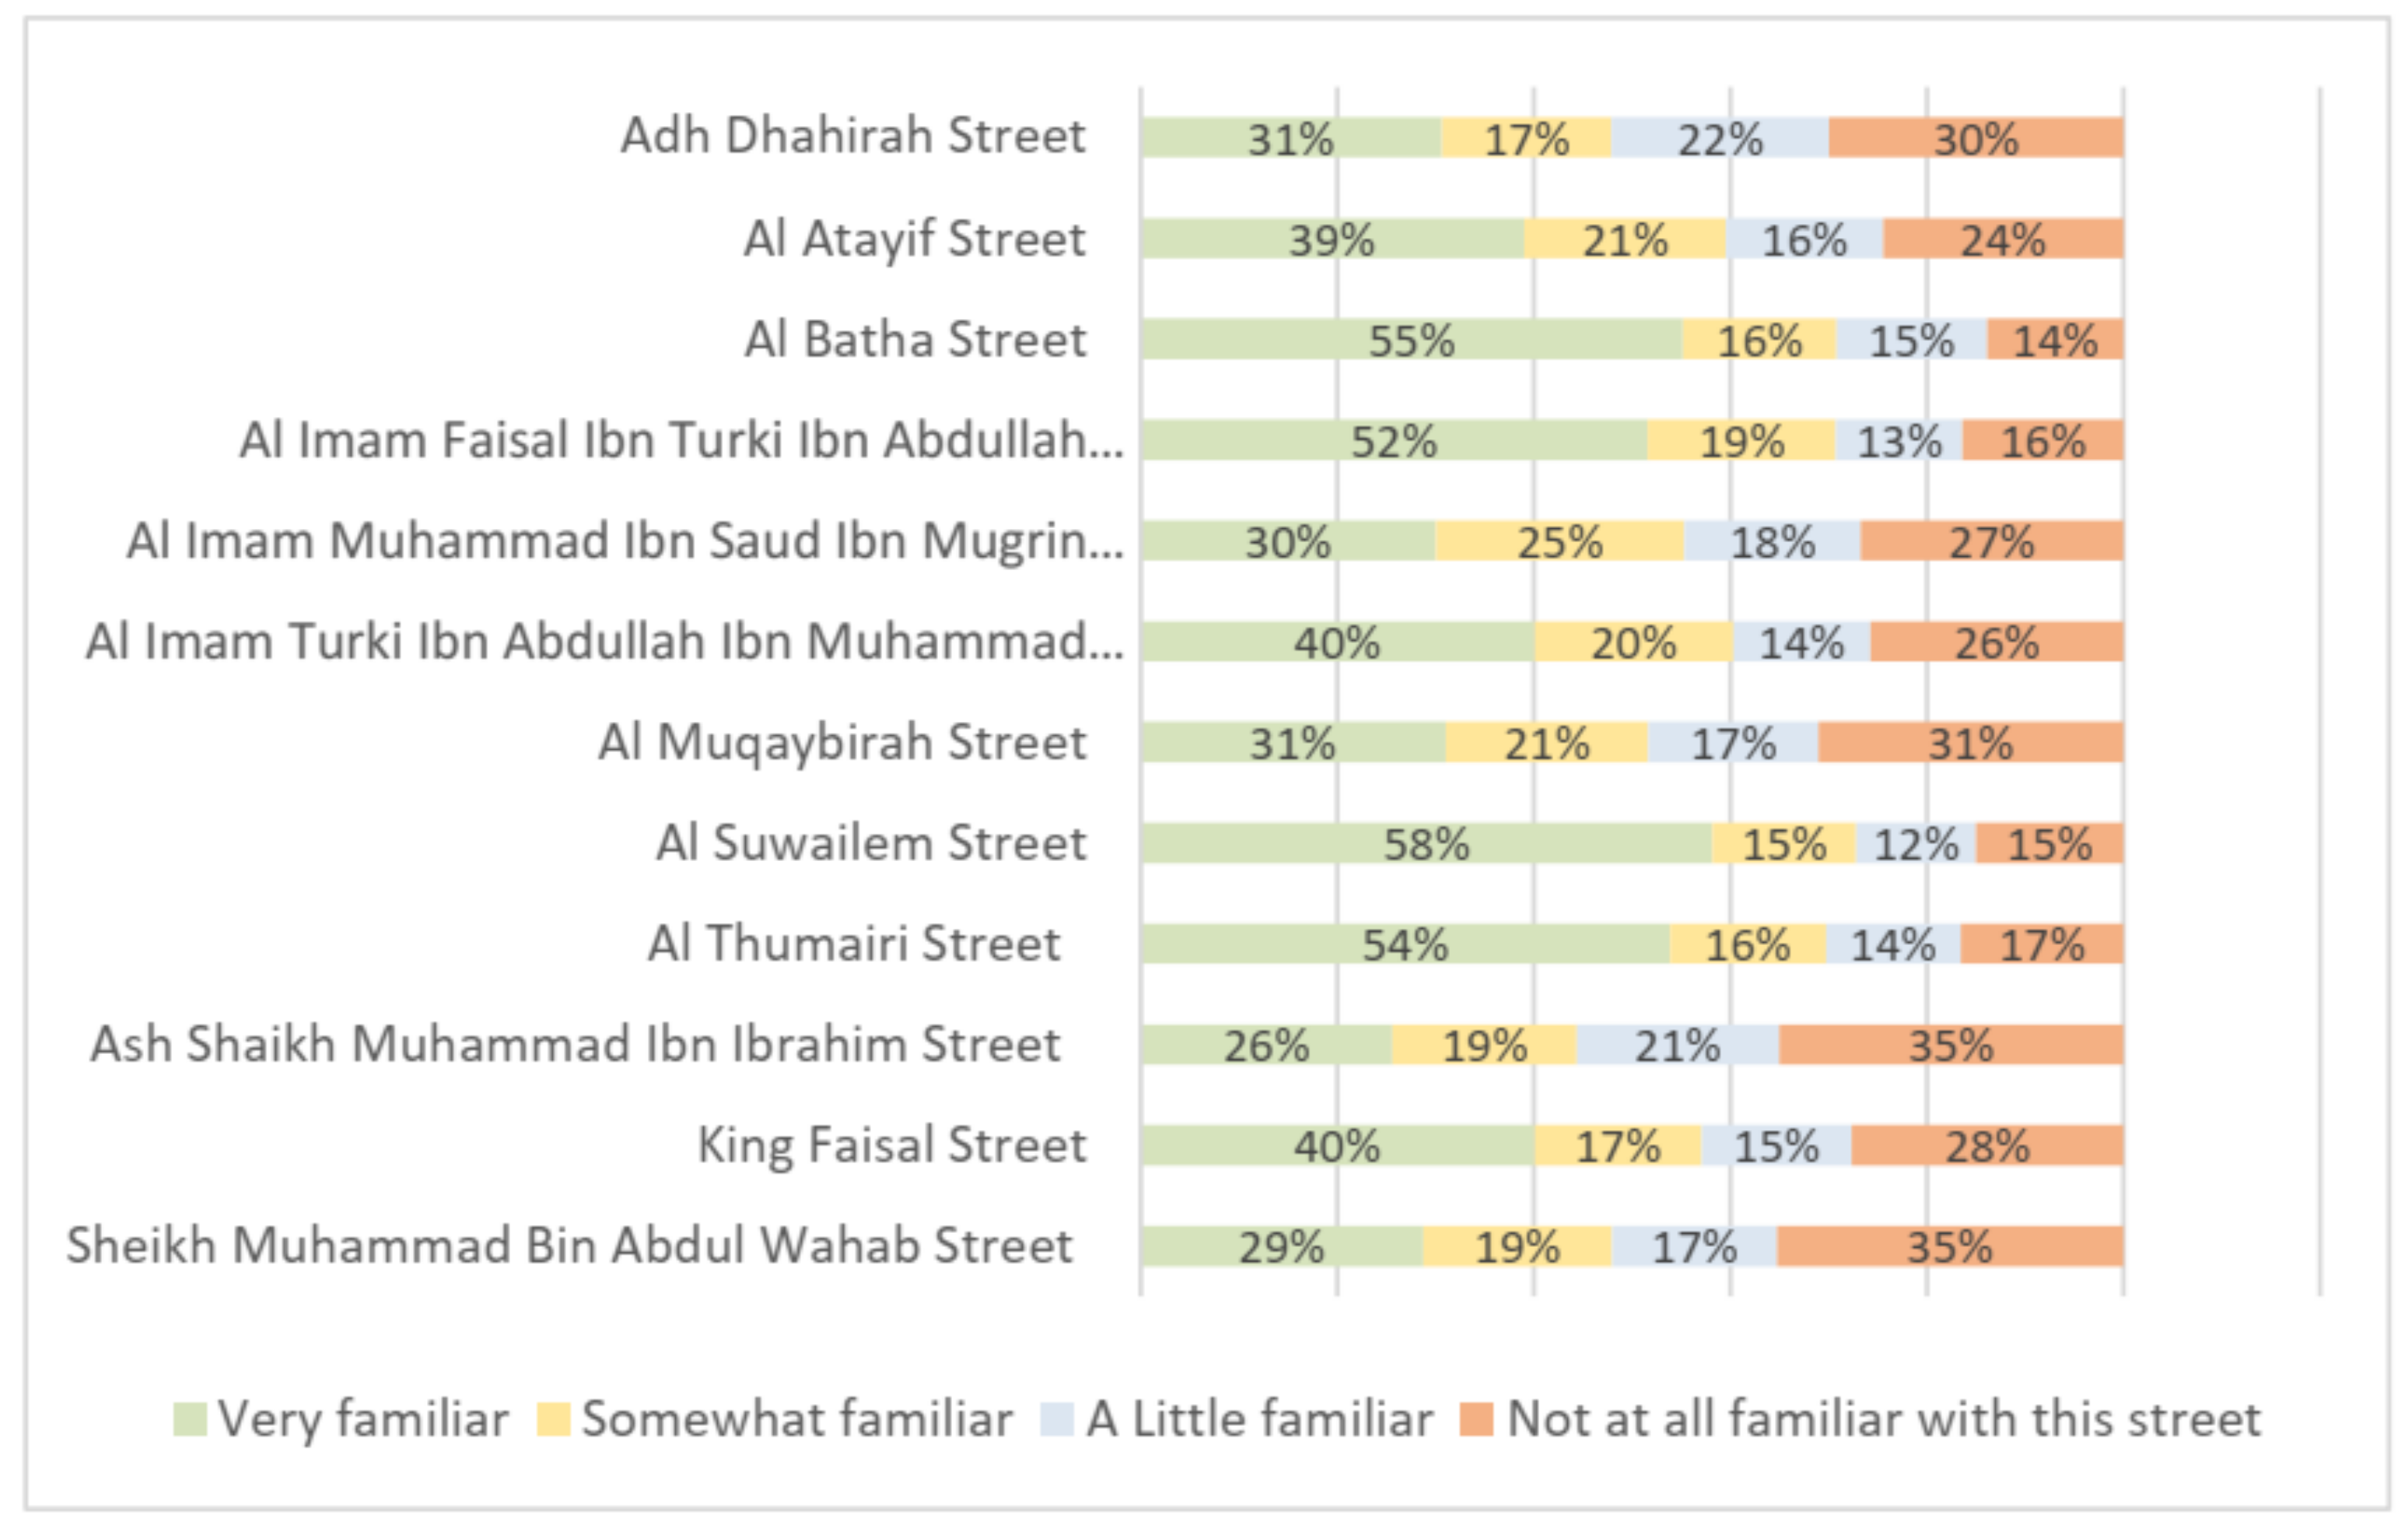
5.2.1. Familiarity with Commercial Streets in Riyadh’s Central Area

The survey assessed respondents’ familiarity with 12 commercial streets located in the Ad-Dirah district of central Riyadh. Among the 12 streets studied in the survey, participants recognized Adh-Dhahirah Street, Al Atayif Street, Al Batha Street, Al Imam Faisal Ibn Turki Ibn Abdullah Street (Alkhazaan), Al-Imam Muhammad Ibn Saud Ibn Mugrin Street, Al Imam Turki Ibn Abdullah Ibn Muhammad Street, Al Muqaybirah Street, Al Thumairi Street, Al Suwailem Street, Ash-Shaikh Muham- mad Ibn Ibrahim Street, King Faisal Street, and Sheikh Muhammad Bin Abdul Wahab Street the most. The data in Figure 1 highlights five prominent streets that stood out in terms of recognition by respondents: Al Suwailem Street (58%), Al Batha Street (55%), Al Thumairi Street (54%), Imam Faisal bin Turki bin Abdullah Street (52%), and Tahlia Street. Al Suwailem Street, renowned as “Perfume and Toys Street” due to its numerous perfume outlets and toy stores, received the highest recognition among respondents. Al Batha Street, the second most recognized location, is known for its historical significance as Riyadh’s oldest extended commercial district. Al Thumairi Street, in the third position, attracts many foreign visitors with its antique shops, heritage stores, and souvenir boutiques. The fourth most recognizable street, Imam Faisal bin Turki bin Abdullah Street, also known as “Alkhazaan Street,” is well known for its female clothing establishments. Tahlia Street, a vibrant commercial thoroughfare in northern Riyadh, is another noteworthy location recognized by respondents.
Five streets stood out as the most recognized streets by respondents according to the data depicted in Figure 1.

5.2.2. Perceptions of Walkability in the Ad-Dirah District

After excluding streets that were not familiar based on respondents’ feedback, they were asked about the walkability of the selected streets. Among those familiar with Al Thumairi Street, 38% considered it walkable. Al Suwailem Street was perceived as somewhat walkable by 36% of respondents familiar with it. Similarly, 35% of respondents acquainted with Imam Faisal bin Turki Street (Alkhazaan Street) perceived it as somewhat walkable. However, 42% of respondents familiar with Al Batha Street stated that it was not considered walkable, as shown in Figure 2.

5.2.3. Frequency of Use of Transportation Modes

Respondents were instructed to base their answers on their typical behaviour before the COVID-19 pandemic. They were asked about the frequency of using various transportation modes when traveling within central Riyadh. The majority (39%) reported driving their vehicles daily in the area, while 22% stated that they commuted by walking. Most respondents did not use alternative transportation methods such as buses, motorcycles, or bicycles. Figure 3 presents the frequency of different transportation modes used in central Riyadh.

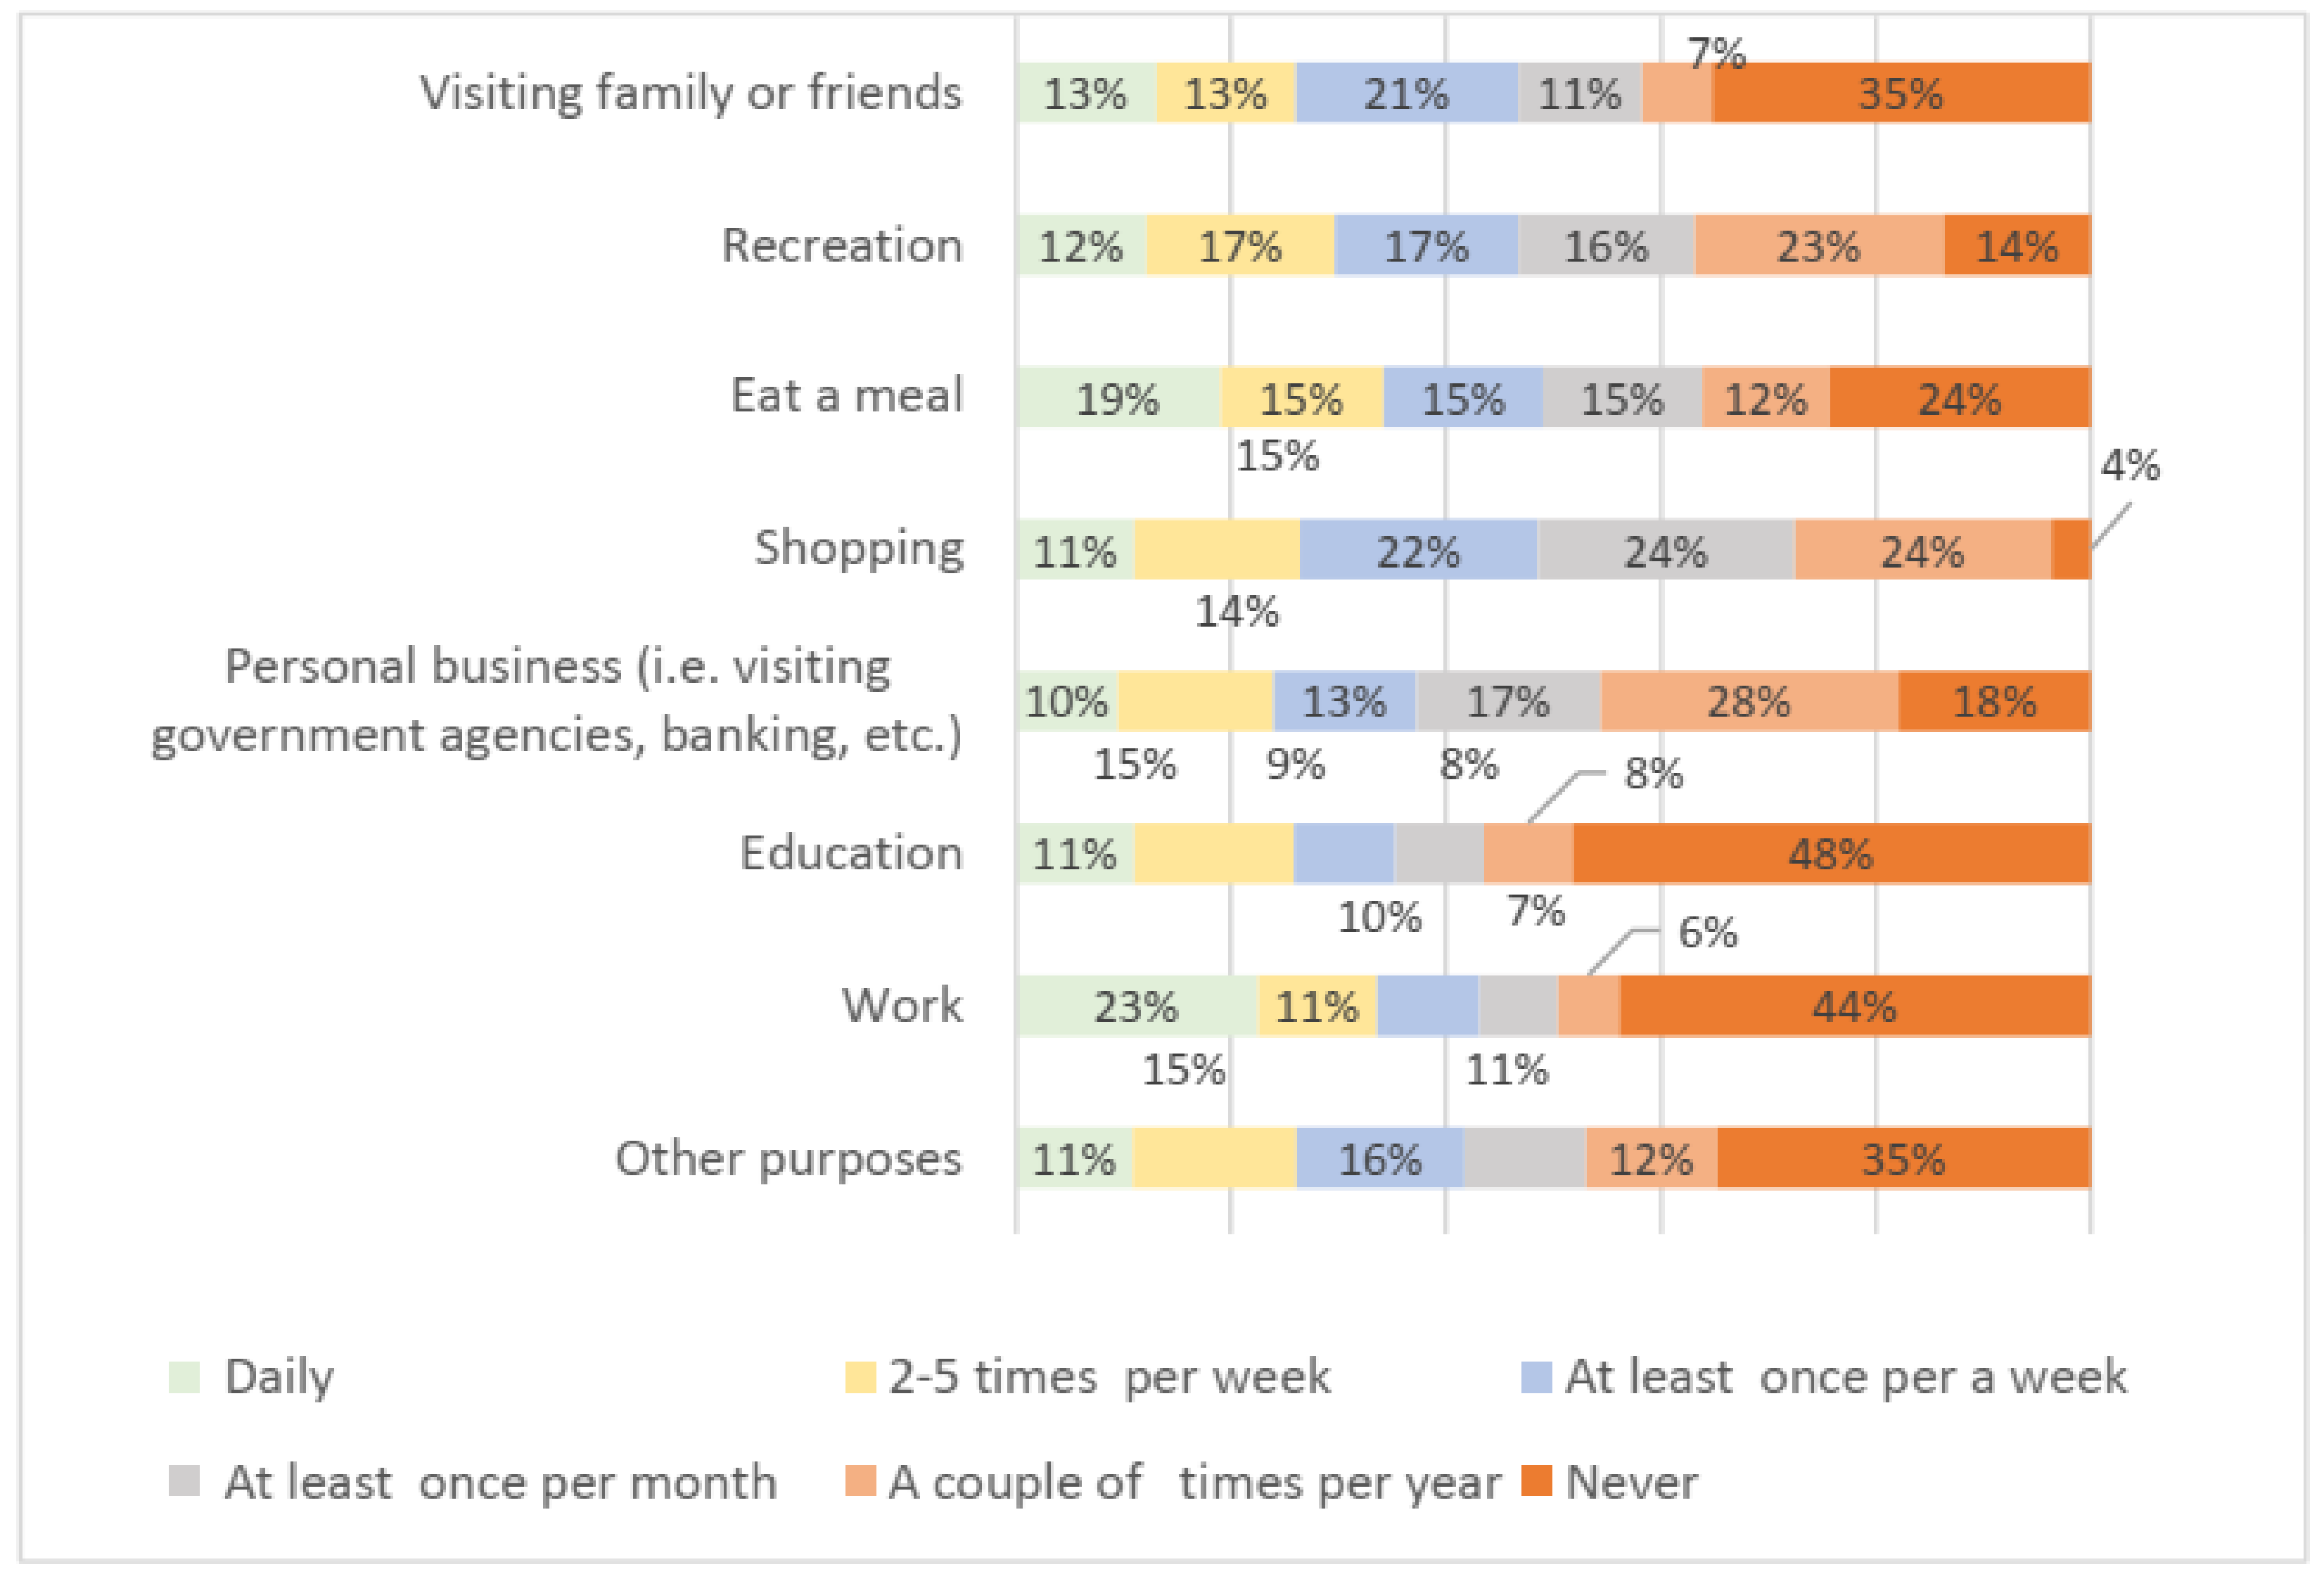
5.2.4. Potential Purposes for Walking in Riyadh’s Central Area

The research removed participants who had no experience walking in the central area but continued with the remaining 280 respondents to gather their motivations for doing so. Twenty-three per cent of respondents submitted they performed daily walks to travel to their jobs, and another 19% used walking to reach restaurants daily. Half of those interviewed walked for shopping no more than once per month and only occasionally throughout the year, yet 22% made weekly trips to shops. Respondents conducted personal business in central Riyadh sporadically throughout the year, which accounted for 28% of all respondents. The results presented in Figure 4 indicate that most individuals from the central district do not walk for employment, academic needs, recreational visits to mosques, or medical facilities.

5.2.5. Acceptable Walking Distances

Respondents were asked to specify the walking distances they considered acceptable for different purposes. As shown in Figure 5, a significant proportion preferred shorter walking distances of less than 400 m (up to a 5-minute walk) for activities such as commuting to work (31%), dining out (37%), and visiting family or friends (32%). However, the majority were willing to walk longer distances of 1000–1600 m (12–17 min) for recreational activities (25%) and shopping (24%).

5.2.6. Impact of COVID-19

When questioned about the impacts of COVID-19 on their visits to the central part of Riyadh, respondents provided varied responses. Half of the participants reported no change in their visit patterns. However, the remaining respondents indicated that the pandemic had a positive influence on their visits.
Fifty-three per cent of respondents offered supplemental information about how COVID-19 transformed their travel patterns to the region. The participants’ rated responses led to categorization into 19 specific concerns, which fell under two primary subject areas. Research subjects who participated in the study reported that their visits to the area were negatively impacted by the pandemic. The respondents identified government-enforced lockdowns, the crowded conditions, and COVID-19 transmission risks as major factors that led to visit changes. The density of small shops and labourers at the site appeared to be a major reason for which two respondents cut down on their area visits. The study participants shared that their trips now focused only on essential needs because they visited the market less often.
According to survey responses, 37.8% of participants reported no changes in their visits to the market. Three respondents stated their workplaces and dwelling locations were in the central zone, thus forcing them to maintain their visits. A respondent explained that they conducted regular visits to their family living within this area. Preventive measures allowed these individuals to keep visiting safely without reservation. A total of 8 % of respondents reported no change in their area visits since they were rare visitors before the pandemic.

5.3. Perceptions of Walking in Riyadh Compared to Non-GCC Cities

Research participants evaluated their experiences of walking in Riyadh, while expressing their difficulty with walking, in comparison to walking in other urban areas. The collected data consisted of 176 responses that fell under three main categories (see Table 8). An overwhelming majority of 79.6% reported that their experience of walking in Riyadh was challenging. Walking in the city was associated with positive elements, which a total of 16.4% of respondents acknowledged. Among the respondents the 4% who walked only within Riyadh did not express any preference regarding walking conditions.
The participants who found walking in Riyadh difficult submitted 140 comments that included multiple issues. The 232 coded inputs extracted from the thematic coding methodology included all crucial elements mentioned by participants, as shown in Table 9. Analysis of responses contained multiple challenges by participants who faced walking in Riyadh, so researchers developed seven main categories, including functional considerations, safety considerations, environmental considerations, comfort considerations, regulatory and legal considerations, cultural considerations, and aesthetic quality considerations, to manage the diverse feedback.
To further illustrate the emotional and cultural nuances behind these themes, direct participant voices were included. For instance, one participant remarked, “Walking here feels unsafe not just because of cars, but the heat. There’s nowhere to rest, nowhere to hide from the sun.” Another added, “I avoid walking because the street furniture is dirty and broken. Even simple benches are missing.” These narratives reflect the lived experiences of pedestrians in Riyadh, enriching the quantitative findings with context-specific perceptions of discomfort and neglect. Compared to Abu Dhabi or Doha, Riyadh exhibits similar challenges such as extreme temperatures and vehicle dependency, but it lags in investment in pedestrian-centric designs like shaded arcades and integrated public transit. Recent studies in Abu Dhabi show improved satisfaction levels following their Urban Street Design Manual (2021), suggesting actionable benchmarks for Riyadh.

5.4. Levels of Importance and Satisfaction

The research asked Riyadh residents to rate both the significance and happiness levels regarding multiple walkability indicators. The assessment of these elements in the business district incorporated rating-scale questions. The research collected data through matrix questions with normal and menu-based formats to maximize efficiency. Surveys rely on matrix questions because these questions provide efficiency and minimize completion duration [55].
Subject participants rated the importance and satisfaction of 49 walkability indicators using a 5-point Likert rating scale. Respondents used “Not at all Important” and “Very Important” as the endpoints for the importance scale and rated their satisfaction with items spanning from “Very Dissatisfied” to “Very Satisfied.” The public survey included a sample matrix question.

5.4.1. Cultural Features

Survey participants evaluated five cultural walkability indicators, which consisted of accessible prayer rooms and mosques, together with wheelchair access to mosques, heat-absorbent pavement, weather-proof street furniture, and markets in open spaces. Most participants found these cultural walkability indicators valuable because they rated them as important. Figure 6 showed that 72% to 79% of participants found them important. The research results showed that mosque accessibility emerged as the key essential factor because 79% of respondents recognized its importance, along with wheelchair accessibility to mosques, which received a 76% importance rating.
A majority of 61% of respondents indicated their satisfaction with mosque and prayer room accessibility in the commercial streets of central Riyadh. Participants showed lower satisfaction rates toward open space markets and galleries because only 46% of respondents indicated contentment with these cultural indicators. Participants showed a higher dissatisfaction with weather-resistant outdoor furniture compared to other street elements, as 36% of the respondents were unhappy, while 33% of the respondents were unhappy with heat-resistant pavement in the central paths, as shown in Figure 6

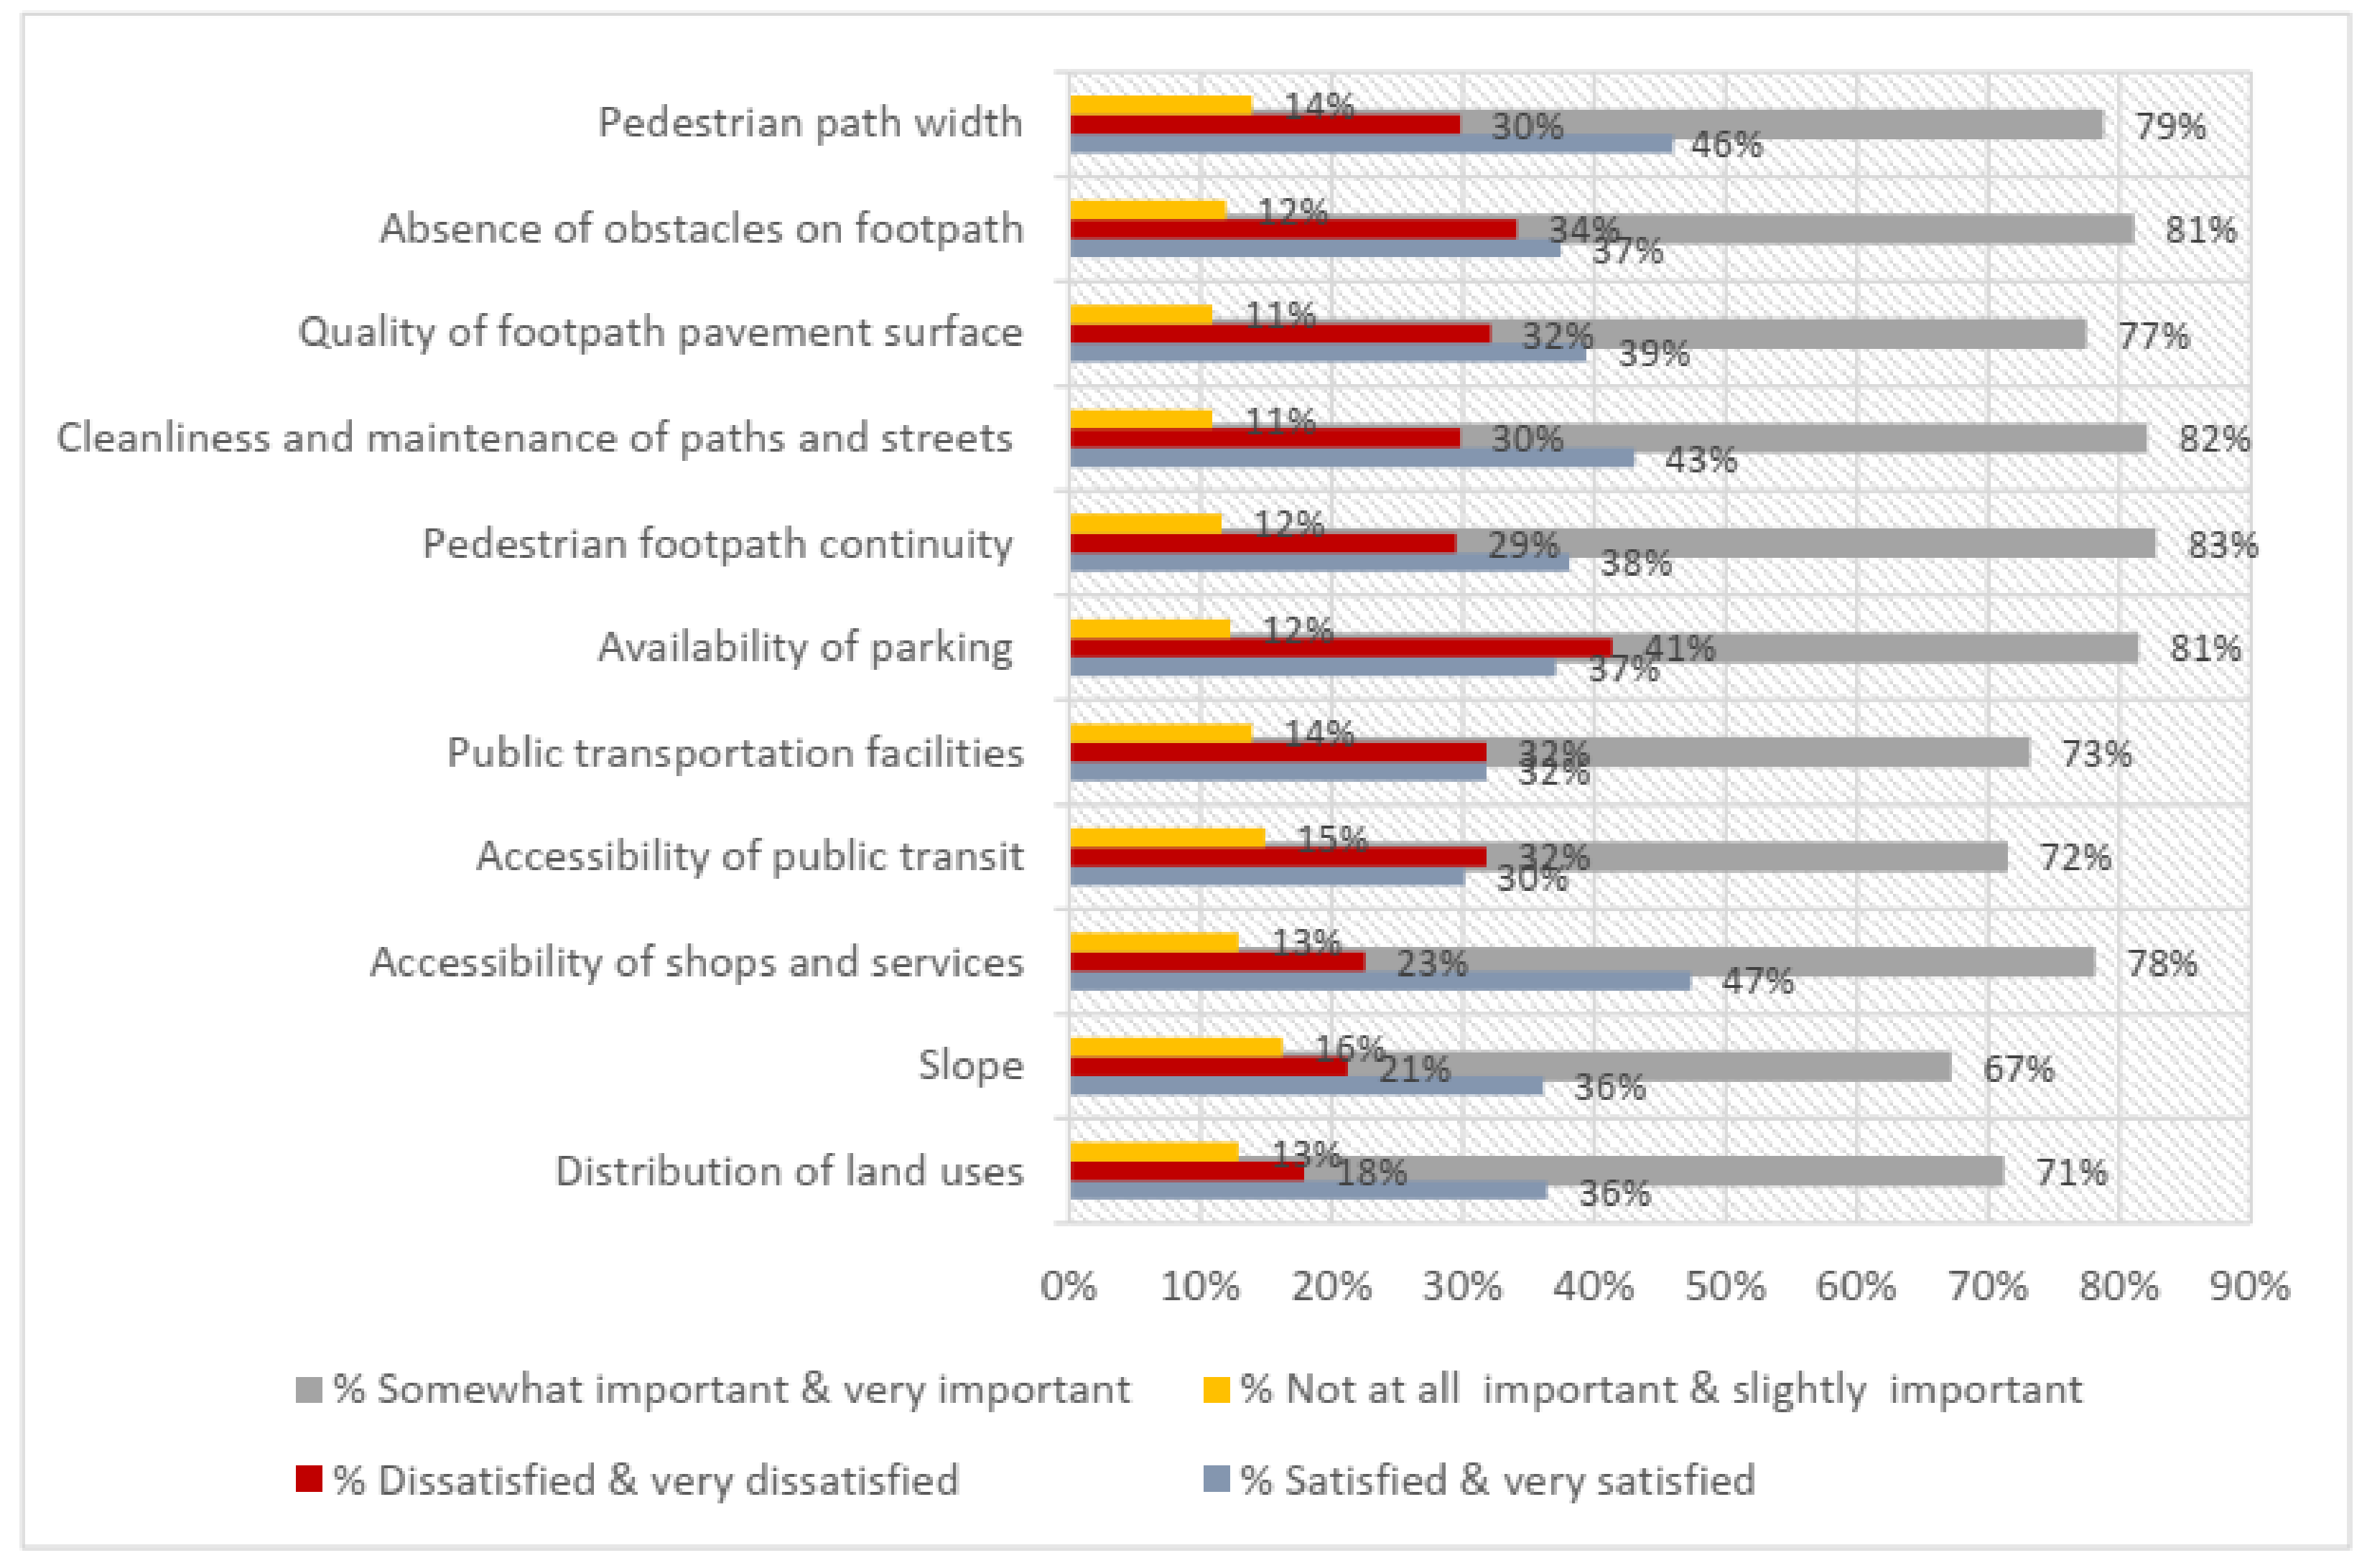
5.4.2. Functional Features

The public survey respondents identified eleven important functional walkability indicators. These features included both pedestrian path width and absence of obstacles on footpaths, along with the quality of pavement surfaces and cleanliness. It included the maintenance of paths and streets, continuity of pedestrian pathways, availability of parking and public transportation facilities, accessibility of public transit, accessibility of shops and services, footpath slopes, and distribution of land uses. The assessments of participants showed that footpath slopes received 67% importance, while pedestrian path continuity earned an 83% importance rating among surveyed individuals (see Figure 7). The research established that participants recognized path and street cleanliness, along with parking availability and obstacle-free footpaths, as significant walking environment factors because these received approval from over 80% of respondents.
The assessment of shop and service access in commercial streets of central Riyadh produced satisfaction levels that reached only 47% according to research respondents. Most participants living in the area expressed dissatisfaction with their ability to access public transportation in the region, since only 30% declared satisfaction. Functional indicators reached their worst level of dissatisfaction regarding parking availability, since 41% of respondents noted the scarcity of parking spaces in the central area.

5.4.3. Safety Features

Figure 8 demonstrates that more than 74% of respondents declared all 16 safety-based indicators highly critical to their opinions. These indicators include the availability of a variety of activities, provision of lighting, visibility while crossing streets, presence of security cameras (CCTV), absence of abandoned buildings, level of pedestrian protection from traffic accidents, service hours of activities, pedestrian crossings along streets, buffers between streets and footpaths, street signage, traffic speed, traffic volume, pedestrian wayfinding signage, traffic-calming measures, pedestrian volume, and pedestrian signals. Research participants identified factors linked to walking safety as the most crucial components among all studied variables. The survey participants identified lighting provision as an essential factor at 84%, while visibility while crossing streets received 83% of agreement from respondents regarding its importance.
Sixty-two per cent of the survey participants rated the street lighting in central Riyadh’s commercial areas positively, and similar numbers found pedestrian visibility sufficient when crossing streets. Survey participants demonstrated dissatisfaction with pedestrian crossings across streets together with pedestrian wayfinding signage and pedestrian signals at a rate of 32%.

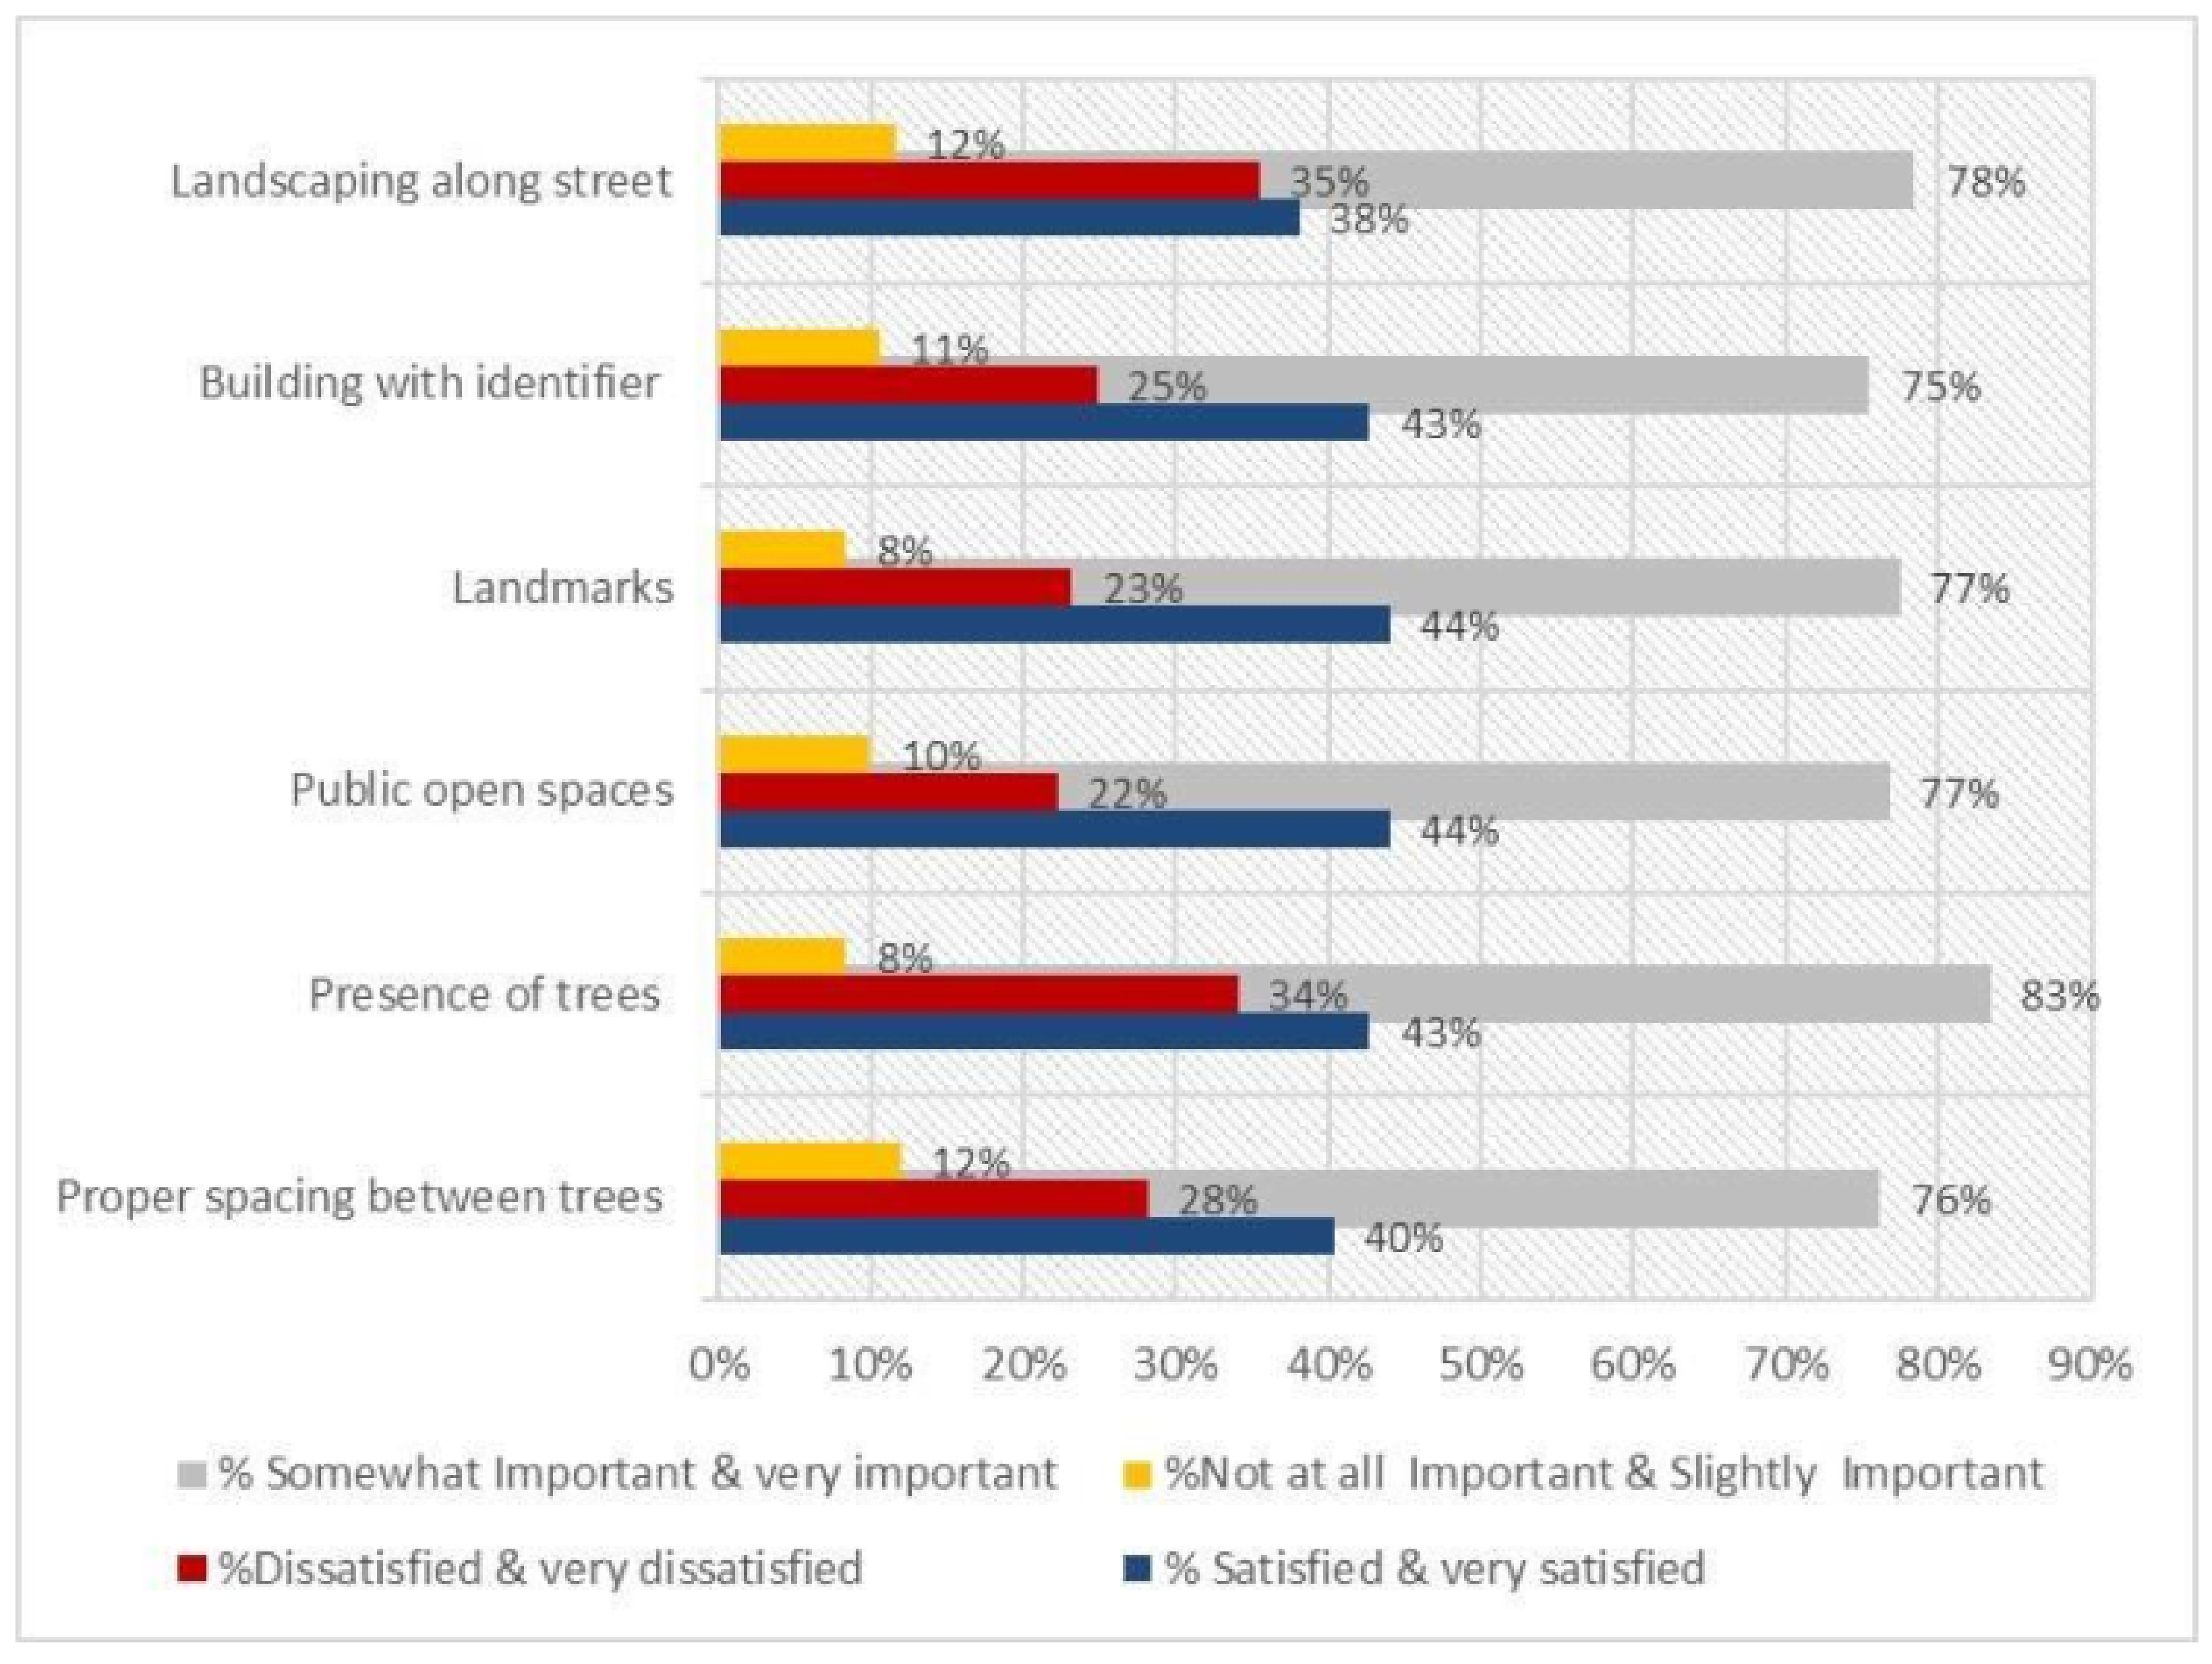
5.4.4. Aesthetic Qualities

Street landscaping and building identifiers, together with landmarks, public open spaces, and tree arrangement with proper distance between them, served as indicators for aesthetic qualities. Figure 9 illustrate public opinion regarding the significance of these six indicators, where respondents showed consensus with rates of agreement between 75% and 83%, while trees received the highest approval.
Respondents who evaluated shopping streets in central Riyadh demonstrated satisfaction with 44% regarding landmarks in addition to public open spaces. Research revealed landscaping and greenery issues because 35% of respondents reported dissatisfaction with Riyadh central street landscaping, while another 34% were not satisfied with tree presence along commercial streets in the central region. The research demonstrates that urban design improvements could improve the combined aesthetic quality and walkable elements of the city.

5.4.5. Comfort Features

The research evaluated comfort through 11 indicators, which included canopies and shelters, together with benches and public toilets, followed by kerb ramps, along with tactile pavements for those who need vision assistance, and the presence of commercial zones’ business activities and children’s playgrounds. It also evaluated noise levels, outdoor temperature comfort, air pollution levels, and distinct pleasurable smells. A significant percentage of 75% to 84% from the study participants acknowledged the importance of comfort indicators (Figure 10). Riyadh residents selected public toilets as their top-priority comfort indicator, since 84% of them considered them important. Participants identified benches as crucial features, since 83% of them considered them important.
A survey of convenience zone and business activity satisfaction at commercial streets inside Riyadh reveals that almost half of the respondents demonstrated positive opinions. Over half of the participants (52%) reported dissatisfaction regarding public toilets in the area, while 43% expressed similar dissatisfaction toward benches in the area. The research points to an urgent need to improve comfort amenities throughout central commercial walkable streets in Riyadh.

5.5. Limitations

The development status of Saudi Arabia creates difficulties in recruiting survey participants through reliable sampling frameworks, which hinders pedestrian sampling in Riyadh. Responses during the COVID-19 pandemic might have been affected by changing public health issues [56]. The study adopted a social-based recruitment chain because of sampled population hurdles.
Beyond its practical relevance, this study offers a methodological and conceptual contribution to the walkability literature in the context of rapidly urbanizing, car-dominated environments. By integrating the Relative Importance Index (RII), gap analysis, and a disgruntlement measurement model with 49 culturally relevant indicators drawn from a prior Delphi study, this research presents a replicable framework for prioritizing walkability interventions. The study further contributes to regional urban sustainability discourse by capturing public perceptions across socio-demographic groups, offering evidence-based insight into how urban design affects livability in Gulf Cooperation Council (GCC) cities. The inclusion of thematic NVivo analysis deepens the interpretation by revealing socio-cultural constraints not commonly explored in quantitative studies, making this work both methodologically rigorous and contextually nuanced.

6. Conclusions

A structured survey was used to evaluate 49 specific indicators, which assessed walkability perceptions in Riyadh’s main commercial areas across cultural, functional, safety, aesthetic, and comfort aspects. To measure this gap between participants’ perceptions, the study used gap analysis and disgruntlement measurement applied to these walkability indicators. The Relative Importance Index (RII) was used to determine which walkability factors received the highest priority, and statistical cross-tabulation tools helped reveal how demographic groups, such as the elderly, men, and workers, differed in their perceptions.
The evaluation demonstrates that Riyadh lacks essential elements that contribute to pedestrian-friendly environments. Most respondents understood the significance of accessible infrastructure but showed intense dissatisfaction toward comfort-related features, such as public toilets, seating options, and protective shelters. A significant 80 per cent of respondents voiced their environmental concerns about excessive heat alongside air pollution and high noise levels. Senior citizens along with retirees showed the highest dissatisfaction levels, according to study results, as they lacked necessary pedestrian amenities. The data confirms that motor vehicle usage remains dominant in Riyadh, although the city has undergone swift urban growth, since 96% of respondents owned private vehicles along with their limited use of other modes of transport.
The performed gap analysis revealed thirty essential indicators that demanded accelerated attention, mainly consisting of heat-proof pavement alongside pedestrian crossings, guidance signs, protective measures, and transportation access. The most unsatisfied citizens rated comfort-related measures, since these aspects determine pedestrian behaviours and their desire to walk. Demographic analysis between male and female participants demonstrated equivalent walkability perception standards, yet age groups systematically prioritized walking accessibility measures above other elements.
The technical analysis shows that effective city management requires specific planning solutions involving environmentally responsive building methods and better walking infrastructure and walkability-based regulations. Walkability in Riyadh’s central commercial streets can be improved through the implementation of shaded walkways, together with better public transportation services and the enforcement of pedestrian-friendly policies. Real-time pedestrian data collection and adaptive infrastructure design through smart urban technologies could lead to more productive enhancements of walkability.
We recommend that Riyadh adopt a minimum 30% shaded pathway requirement in commercial zones, integrate pedestrian corridors with bus and metro stations, and implement community-based participatory planning in alignment with Vision 2030. Clear zoning incentives for pedestrian infrastructure should be part of future urban policies.

Author Contributions

Conceptualization, B.F.A.; Methodology, B.F.A.; Validation, T.W., M.L. and D.C.; Formal analysis, B.F.A.; Investigation, B.F.A.; Writing—original draft, B.F.A.; Writing—review & editing, B.F.A., T.W., M.L. and D.C.; Visualization, B.F.A.; Supervision, T.W., M.L. and D.C.; Project administration, B.F.A. All authors have read and agreed to the published version of the manuscript.

Funding

This research received no external funding.

Institutional Review Board Statement

The study was conducted according to the guidelines of the Declaration of Helsinki, and approved by the Queensland University of Technology (protocol code 2000000903 and date of approval 23 November 2020–23 November 2025). Confirming approval for the research project conducted during the first author’s PhD study.

Informed Consent Statement

Written informed consent was obtained from all participants before conducting the interviews during the two rounds of the Delphi study.

Data Availability Statement

All the relevant data will be made available when required.

Conflicts of Interest

No conflicts of interest to declare.

References

  1. Frank, L.; Sallis, J.; Conway, T.; Chapman, J.; Saelens, B.; Bachman, W. Many pathways from land use to health: Associations between neighborhood walkability and active transportation, body mass index, and air quality. J. Am. Plan. Assoc. 2006, 72, 75–87. [Google Scholar] [CrossRef]
  2. Forsyth, A. What is a walkable place? The walkability debate in urban design. Urban Des. Int. 2015, 20, 274–292. [Google Scholar] [CrossRef]
  3. Gehl, J. Cities for People; Island Press: Washington, DC, USA, 2013. [Google Scholar]
  4. Ewing, R.; Cervero, R. Travel and the built environment: A meta-analysis. J. Am. Plan. Assoc. 2010, 76, 265–294. [Google Scholar] [CrossRef]
  5. Sharifi, A.; Yamagata, Y. Principles and criteria for assessing urban energy resilience: A literature review. Renew. Sustain. Energy Rev. 2016, 60, 1654–1677. [Google Scholar] [CrossRef]
  6. Sultan, B.; Katar, I.; Al-Atroush, M. Towards sustainable pedestrian mobility in Riyadh city, Saudi Arabia: A case study. Sustain. Cities Soc. 2021, 69, 102831. [Google Scholar] [CrossRef]
  7. Almahdy, O. Making a Hot, Arid, Desert Arab City More Livable: Investigating the Role of Street Design in Enhancing Walkability in Riyadh, Saudi Arabia. Ph.D. Thesis, Illinois Institute of Technology, Chicago, IL, USA, 2020. [Google Scholar]
  8. Alawadi, K.; Hernandez Striedinger, V.; Maghelal, P.; Khanal, A. Assessing walkability in hot arid regions: The case of downtown Abu Dhabi. Urban Des. Int. 2021, 27, 211–231. [Google Scholar] [CrossRef]
  9. Khan, M. Saudi Arabia’s vision 2030. Def. J. 2016, 19, 36. [Google Scholar]
  10. Alyami, S. Opportunities and challenges of embracing green city principles in saudi arabia future cities. IEEE Access 2019, 7, 178584–178595. [Google Scholar] [CrossRef]
  11. Raad, N.; Burke, M. What are the most important factors for pedestrian level-of-service estimation? A systematic review of the literature. Transp. Res. Rec. 2018, 2672, 101–117. [Google Scholar] [CrossRef]
  12. Hara, K.; Newman, P.; Takao, Y. Sustainable development goals: How can Japanese local governments help. In Proceedings of the 4th World Sustainability Forum, Virtual Event, 1–30 November 2014; pp. 1–30. [Google Scholar]
  13. Homoud, M.; Jarrar, O. Walkability in Riyadh: A comprehensive assessment and implications for sustainable community—Al-Falah case study. Sustainability 2024, 16, 8073. [Google Scholar] [CrossRef]
  14. Khabiri, S.; Pourjafar, M.; Izadi, M. A case study of walkability and neighborhood attachment. Glob. J. Hum.-Soc. Sci. 2020, 20, 57–70. [Google Scholar] [CrossRef]
  15. Moayedi, F.; Zakaria, R.; Bigah, Y.; Mustafar, M.; Puan, O.; Zin, I.; Klufallah, M. Conceptualising the indicators of walkability for sustainable transportation. J. Teknol. 2013, 65, 2180–3722. [Google Scholar] [CrossRef]
  16. Li, W.; Joh, K.; Lee, C.; Kim, J.; Park, H.; Woo, A. Assessing benefits of neighborhood walkability to single-family property values: A spatial hedonic study in Austin, Texas. J. Plan. Educ. Res. 2015, 35, 471–488. [Google Scholar] [CrossRef]
  17. James, P.; Hart, J.; Laden, F. Neighborhood walkability and particulate air pollution in a nationwide cohort of women. Environ. Res. 2015, 142, 703–711. [Google Scholar] [CrossRef]
  18. Hankey, S.; Marshall, J.; Brauer, M. Health impacts of the built environment: Within-urban variability in physical inactivity, air pollution, and ischemic heart disease mortality. Environ. Health Perspect. 2012, 120, 247–253. [Google Scholar] [CrossRef]
  19. Moreno, C. “The 15-Minute City”: Redesigning urban life with proximity to services. Barc. Soc. J. Soc. Knowl. Anal. 2024, 30, hal-04648637. [Google Scholar]
  20. Atef Elhamy Kamel, M. Encouraging walkability in GCC cities: Smart urban solutions. Smart Sustain. Built Environ. 2013, 2, 288–310. [Google Scholar] [CrossRef]
  21. Chen, W.; Wu, X.; Xiao, Z. Impact of Built Environment on Carbon Emissions from Cross-District Mobility: A Social Network Analysis Based on Private Vehicle Trajectory Big Data. Sustainability 2023, 15, 10930. [Google Scholar] [CrossRef]
  22. Jarrar, O.; Al-Homoud, M. Sustainable urban development in Riyadh: A projected model for walkability. Int. J. Urban Sustain. Dev. 2024, 16, 398–421. [Google Scholar] [CrossRef]
  23. Gössling, S.; Meyer-Habighorst, C.; Humpe, A. A global review of marine air pollution policies, their scope and effectiveness. Ocean. Coast. Manag. 2021, 212, 105824. [Google Scholar] [CrossRef]
  24. Gössling, S. Why cities need to take road space from cars-and how this could be done. J. Urban Des. 2020, 25, 443–448. [Google Scholar] [CrossRef]
  25. Moreno, C.; Allam, Z.; Chabaud, D.; Gall, C.; Pratlong, F. Introducing the “15-Minute City”: Sustainability, resilience and place identity in future post-pandemic cities. Smart Cities 2021, 4, 93–111. [Google Scholar] [CrossRef]
  26. Hasselwander, M.; Weiss, D.; Werland, S. Local super apps in the 15-minute city: A new model for sustainable smart cities? Front. Sustain. Cities 2024, 6, 1404105. [Google Scholar] [CrossRef]
  27. Creutzig, F.; Mühlhoff, R.; Römer, J. Decarbonizing urban transport in European cities: Four cases show possibly high co-benefits. Environ. Res. Lett. 2012, 7, 044042. [Google Scholar] [CrossRef]
  28. Heinonen, S. Neo-growth in future post-carbon cities. J. Futur. Stud. 2013, 18, 13–40. [Google Scholar]
  29. Georgescu, M.; Morefield, P.; Bierwagen, B.; Weaver, C. Urban adaptation can roll back warming of emerging megapolitan regions. Proc. Natl. Acad. Sci. USA 2014, 111, 2909–2914. [Google Scholar] [CrossRef]
  30. Southworth, M. Designing the walkable city. J. Urban Plan. Dev. 2005, 131, 246–257. [Google Scholar] [CrossRef]
  31. Kim, E.; Kim, J.; Kim, H. Neighborhood walkability and active transportation: A correlation study in leisure and shopping purposes. Int. J. Environ. Res. Public Health 2020, 17, 2178. [Google Scholar] [CrossRef]
  32. Ewing, R.; Cervero, R. “Does compact development make people drive less?” The answer is yes. J. Am. Plan. Assoc. 2017, 83, 19–25. [Google Scholar] [CrossRef]
  33. Al-hagla, K. Sustainable urban development in historical areas using the tourist trail approach: A case study of the Cultural Heritage and Urban Development (CHUD) project in Saida, Lebanon. Cities 2010, 27, 234–248. [Google Scholar] [CrossRef]
  34. Litman, T. Evaluating Transportation Equity; Victoria Transport Policy Institute: Victoria, BC, Canada, 2017. [Google Scholar]
  35. Jafari, M.; Scholz, W. Towards sustainable urban development: Challenges and chances of climate-sensitive urban design in Muscat/Oman. Sustain. Gulf 2017, 103–122. [Google Scholar]
  36. Ewing, R.; Dumbaugh, E. The built environment and traffic safety: A review of empirical evidence. J. Plan. Lit. 2009, 23, 347–367. [Google Scholar] [CrossRef]
  37. Aljoufie, M.; Zuidgeest, M.; Brussel, M.; Maarseveen, M. Spatial–temporal analysis of urban growth and transportation in Jeddah City, Saudi Arabia. Cities 2013, 31, 57–68. [Google Scholar] [CrossRef]
  38. Almatar, K.; Almulhim, A. The Issue of Urban Transport Planning in Saudi Arabia: Concepts and Future Challenges. Int. J. Sustain. Dev. Plan. 2021, 16. [Google Scholar] [CrossRef]
  39. Bin Sulaiman, F. Striding towards sustainable urban livability: Evaluating walkability efficiency vis-a-vis population dynamics in Saudi Arabia cities. Cogent Soc. Sci. 2024, 10, 2340428. [Google Scholar] [CrossRef]
  40. Aloshan, M.; Gharieb, M.; Heba, K.; Khalil, R.; Alhumaid, M.; Ezz, M. Promoting Urban Corridors in Saudi City Center to Enhance Walkability Using Multi-Criteria Decision-Analysis Methods. Sustainability 2024, 16, 9255. [Google Scholar] [CrossRef]
  41. Williams, K.; Golub, A. Evaluating the Distributional Effects of Regional Transportation Plans and Projects; Portland State University, National Institute for Transportation: Portland, OR, USA, 2017. [Google Scholar]
  42. Golub, A.; Martens, K. Using principles of justice to assess the modal equity of regional transportation plans. J. Transp. Geogr. 2014, 41, 10–20. [Google Scholar] [CrossRef]
  43. Ewing, R.; Handy, S. Measuring the unmeasurable: Urban design qualities related to walkability. J. Urban Des. 2009, 14, 65–84. [Google Scholar] [CrossRef]
  44. Alkrides, B. Promoting Sustainable Urban Walkability: A Modified Delphi Study on Key Indicators for Urban Walkability in Gulf Cooperation Council Urban Streets. Sustainability 2025, 17, 1179. [Google Scholar] [CrossRef]
  45. Gehl, J. Life Between Buildings; Danish Architectural Press: Copenhagen, Denmark, 2011. [Google Scholar]
  46. Speck, J. Walkable City Rules: 101 Steps to Making Better Places; Island Press: Washington, DC, USA, 2018. [Google Scholar]
  47. Alharbi, H. Urban Development in Riyadh: Aligning with Saudi Vision 2030 for Enhanced Quality of Life. J. Geogr. Environ. Earth Sci. Int. 2024, 28, 53–66. [Google Scholar] [CrossRef]
  48. Parasuraman, A.; Zeithaml, V.; Berry, L. A conceptual model of service quality and its implication for service quality research. J. Mark. 1985, 49, 44. [Google Scholar] [CrossRef]
  49. Browne, K. Snowball sampling: Using social networks to research non-heterosexual women. Int. J. Soc. Res. Methodol. 2005, 8, 47–60. [Google Scholar] [CrossRef]
  50. Abdalmajeed, M. Pedestrian Level of Service (PLOS) Measurement for Footpaths in Commercial Streets. Ph.D. Thesis, Griffith University, Nathan, Australia, 2020. [Google Scholar]
  51. Shash, A. Factors considered in tendering decisions by top UK contractors. Constr. Manag. Econ. 1993, 11, 111–118. [Google Scholar] [CrossRef]
  52. Akadiri, O. Development of a Multi-Criteria Approach for the Selection of Sustainable Materials for Building Projects. Ph.D. Thesis, University of Wolverhampton, Wolverhampton, UK, 2011. [Google Scholar]
  53. Siami, S.; Gorji, M. The measurement of service quality by using SERVQUAL and quality gap model. Indian J. Sci. Technol. 2012, 5, 1956–1960. [Google Scholar] [CrossRef]
  54. Stradling, S.; Anable, J.; Carreno, M. Performance, importance and user disgruntlement: A six-step method for measuring satisfaction with travel modes. Transp. Res. Part Policy Pract. 2007, 41, 98–106. [Google Scholar] [CrossRef]
  55. Liu, M. Web survey experiments on matrix questions. Comput. Hum. Behav. 2017, 67, 61–72. [Google Scholar] [CrossRef]
  56. Clay, R. Conducting research during the COVID-19 pandemic. Am. Psychol. Assoc. 2020, 44, 151287. [Google Scholar]
Figure 1. Familiarity with Ad-Dirah district commercial streets.
Sustainability 17 05748 g001
Figure 2. Perceptions of walkability in commercial streets.
Sustainability 17 05748 g002
Figure 3. Frequency of use of transportation modes in Riyadh’s central area.
Sustainability 17 05748 g003
Figure 4. Purposes for walking in Riyadh’s central area.
Sustainability 17 05748 g004
Figure 5. The acceptable walking distance for different purposes.
Sustainability 17 05748 g005
Figure 6. Importance ratings of key cultural walkability indicators.
Sustainability 17 05748 g006
Figure 7. Importance ratings of key functional walkability indicators.
Sustainability 17 05748 g007
Figure 8. Importance ratings of key safety-based walkability indicators.
Sustainability 17 05748 g008
Figure 9. Importance ratings of key aesthetic walkability indicators.
Sustainability 17 05748 g009
Figure 10. Importance ratings of key comfort-based walkability indicators.
Sustainability 17 05748 g010
Table 1. Importance level of RII values.
RII ValueImportance Level
( 0.8 R I I 1 )High (H)
( 0.6 R I I 0.8 )High-medium (H-M)
( 0.4 R I I 0.6 )Medium (M)
( 0.2 R I I 0.4 )Medium-low (M-L)
( 0 R I I 0.2 )low (L)
Table 2. RII for each walkability indicator.
CategoryWalkability IndicatorsWN A × N RIIImportance LevelRank
Cultural IndicatorsAccessibility of mosques/prayer rooms128530215100.851H1
Wheelchair accessibility to mosques126530215100.838H2
Heat-resistant pavement124330215100.823H3
Weather-resistant street furniture120730215100.799H-M4
Open space markets/galleries119330215100.790H-M5
Functional
Indicators
Cleanliness and maintenance of paths and streets130830215100.866H1
Availability of parking129330215100.856H2
Pedestrian footpath continuity129330215100.856H3
Absence of obstacles on footpath128930215100.854H4
Quality of footpath pavement surface127930215100.847H5
Accessibility of shops and services126330215100.836H6
Pedestrian path width125330215100.830H7
Public transportation facilities122130215100.809H8
Accessibility of public transit122030215100.808H9
Distribution of land uses121130215100.802H10
Slope116530215100.772H-M11
Safety IndicatorsVisibility while crossing street132330215100.876H1
Provision of lighting132230215100.875H2
Pedestrian protection from traffic accident risks130330215100.863H3
Presence of security cameras (CCTV)129430215100.857H4
Variety of activities128630215100.852H5
Street signage128730215100.852H6
Pedestrian crossings along streets128530215100.851H7
Pedestrian signals127130215100.842H8
Traffic speed127130215100.842H9
Traffic volume127030215100.841H10
Pedestrian wayfinding signage126030215100.834H11
Absence of abandoned buildings125530215100.831H12
Buffers between streets and footpaths125030215100.828H13
Service hours of activities124630215100.825H14
Pedestrian volume124430215100.824H15
Traffic-calming measures123630215100.819H16
Indicators of
Aesthetic Qualities
Presence of trees131430215100.870H1
Landscaping along streets127530215100.844H2
Public open spaces126630215100.838H3
Landmarks126130215100.835H4
Proper spacing between trees125130215100.828H5
Buildings with identifiers124230215100.823H6
Comfort IndicatorsPublic toilets133930215100.887H1
Kerb ramp132330215100.876H2
Benches131930215100.874H3
Tactile pavement for visually impaired130230215100.862H4
Air pollution level129330215100.856H5
Distinct, pleasant smells129130215100.855H6
Canopies and shelters128830215100.853H7
Presence of commercial zones/business activities128130215100.848H8
Proper outdoor thermal comfort127830215100.846H9
Level of noise126330215100.836H10
Presence of children’s playground124430215100.824H11
Table 3. Importance ratings for the 49 walkability indicators.
Importance of Indicators (Important and Very Important %)Entire SampleMaleFemale(18–44) YearsOver 44 YearsSingleMarriedEmployedStudentSenior/ Retired
Provision of lighting84%84%84%65%95%81%84%84%79%94%
Public toilets84%85%84%82%90%84%84%83%79%94%
Pedestrian footpath continuity83%84%82%81%87%85%81%81%81%88%
Visibility while crossing street83%85%82%80%91%81%83%83%77%94%
Presence of trees83%83%84%81%90%80%85%86%73%88%
Benches83%83%82%80%90%82%83%81%79%94%
Cleanliness and maintenance of paths and streets82%83%81%80%89%85%80%80%83%91%
Kerb ramp82%81%84%79%91%81%83%81%77%91%
Absence of obstacles on footpath81%85%77%78%90%83%80%81%81%94%
Availability of parking81%83%79%80%86%85%79%80%85%88%
Variety of activities81%81%80%61%95%78%82%81%75%91%
Air pollution level81%81%80%78%89%80%81%83%69%91%
Presence of commercial zones/business activities80%80%81%78%86%79%81%82%71%85%
Distinct, pleasant smells80%78%82%77%89%82%79%78%71%91%
Accessibility of mosques/prayer rooms79%83%75%78%84%84%77%76%87%91%
Pedestrian path width79%83%74%75%90%82%78%78%75%94%
Pedestrian protection from traffic accident risks79%79%79%76%87%78%80%78%71%91%
Pedestrian crossings along streets79%78%82%77%87%79%79%80%75%85%
Street signage79%79%79%76%89%80%78%77%77%94%
Pedestrian signals79%77%81%76%87%78%78%77%75%88%
Canopies and shelters79%79%79%76%87%78%79%77%73%94%
Tactile pavement for visually impaired79%78%80%75%89%78%79%78%75%85%
Accessibility of shops and services78%77%79%75%86%79%77%78%75%85%
Presence of security cameras (CCTV)78%78%79%76%85%77%79%77%77%88%
Traffic volume78%77%79%76%82%77%78%78%71%82%
Landscaping along streets78%77%80%76%85%77%79%80%71%82%
Proper outdoor thermal comfort78%80%76%74%89%78%78%81%69%85%
Quality of footpath pavement surface77%79%76%74%87%79%76%75%77%91%
Landmarks77%79%76%75%84%76%78%80%75%82%
Public open spaces77%76%77%74%86%73%78%79%71%85%
Wheelchair accessibility to mosques76%78%75%74%82%82%74%74%83%85%
Absence of abandoned buildings76%73%80%74%84%72%78%74%71%91%
Traffic speed76%75%78%74%85%74%76%75%71%88%
Pedestrian wayfinding signage76%76%77%73%86%76%77%74%71%88%
Pedestrian volume76%73%79%73%84%77%75%74%73%82%
Proper spacing between trees76%76%76%73%86%71%78%78%67%85%
Heat-resistant pavement75%76%74%73%81%77%73%74%73%82%
Service hours of activities75%73%77%72%84%74%74%74%69%79%
Buffers between streets and footpaths75%71%79%73%80%76%73%72%75%82%
Buildings with identifiers75%71%80%73%84%74%76%75%73%79%
Presence of children’s playground75%72%78%73%81%77%74%72%73%79%
Level of noise75%75%75%71%85%81%72%74%69%88%
Traffic-calming measures74%74%75%72%81%74%73%73%69%79%
Public transportation facilities73%74%73%71%80%78%70%70%77%76%
Weather-resistant street furniture72%73%70%70%76%72%71%71%69%79%
Open space markets/galleries72%74%71%70%78%71%72%72%67%85%
Accessibility of public transit72%71%73%68%81%74%69%68%77%79%
Distribution of land uses71%66%77%70%73%69%71%67%75%76%
Slope67%66%68%65%75%67%67%66%71%73%
Table 4. Performance ratings for the 49 walkability indicators.
Performance of Indicators (Satisfied and Very Satisfied %)Entire SampleMaleFemale(18–44) YearsOver 44 YearsSingleMarriedEmployedStudentSenior/ Retired
Provision of lighting62%63%62%62%63%64%62%60%62%70%
Accessibility of mosques/prayer rooms61%63%58%64%51%70%56%59%77%42%
Visibility while crossing street60%66%55%61%61%59%62%59%62%67%
Variety of activities57%62%53%56%62%61%57%57%63%61%
Street signage53%56%50%53%53%57%52%49%65%52%
Traffic speed48%52%45%52%39%55%47%46%62%42%
Accessibility of shops and services47%47%49%47%49%49%46%48%46%52%
Presence of commercial zones/business activities47%51%43%50%39%53%44%48%50%33%
Pedestrian path width46%41%52%48%42%51%44%40%60%45%
Open space markets/galleries46%49%42%46%44%52%44%46%54%30%
Service hours of activities46%48%44%48%42%51%45%43%50%42%
Landmarks44%41%48%48%33%54%40%43%52%21%
Public open spaces44%42%47%47%37%54%40%44%54%30%
Pedestrian volume44%45%43%45%41%44%46%43%50%39%
Cleanliness and maintenance of paths and streets43%47%40%43%43%46%43%44%48%39%
Wheelchair accessibility to mosques43%40%47%46%37%49%41%39%54%30%
Buildings with identifiers43%37%50%46%34%54%39%40%56%21%
Presence of trees43%39%47%45%38%45%42%43%40%33%
Traffic volume42%40%46%45%35%47%41%41%48%27%
Presence of security cameras (CCTV)40%40%42%42%37%45%40%38%50%27%
Proper spacing between trees40%40%41%43%33%45%40%43%38%21%
Pedestrian crossings along streets40%37%44%42%37%45%39%37%54%27%
Traffic-calming measures40%35%46%42%35%43%39%35%44%33%
Quality of footpath pavement surface39%35%45%44%27%54%33%35%54%24%
Pedestrian protection from traffic accident risks39%40%38%40%35%48%37%36%48%30%
Landscaping along streets38%33%44%41%32%43%37%37%38%21%
Pedestrian footpath continuity38%35%42%41%32%40%38%36%44%24%
Pedestrian signals38%36%41%42%28%43%36%38%42%18%
Absence of obstacles on footpath37%32%44%41%28%49%33%33%58%21%
Availability of parking37%35%40%39%34%43%36%33%52%33%
Buffers between streets and footpaths37%36%38%40%28%46%34%31%56%24%
Pedestrian wayfinding signage37%32%42%41%27%40%36%33%40%27%
Presence of children’s playground37%31%43%42%23%50%31%32%50%24%
Distribution of land uses36%32%42%40%27%44%34%34%46%24%
Slope36%39%34%40%27%36%37%41%37%18%
Benches35%33%37%41%19%48%29%32%54%12%
Kerb ramp34%33%36%38%25%40%33%35%40%15%
Absence of abandoned buildings34%32%37%39%22%44%32%31%48%15%
Heat-resistant pavement34%29%38%38%22%43%29%32%46%9%
Public transportation facilities32%26%38%34%27%38%30%28%44%15%
Canopies and shelters32%28%36%36%22%44%27%28%46%18%
Tactile pavement for visually impaired32%29%36%38%16%44%27%29%44%12%
Level of noise31%32%32%35%23%38%30%32%37%15%
Air pollution level30%26%36%36%15%39%27%28%38%18%
Accessibility of public transit30%23%38%34%22%38%27%25%44%15%
Weather-resistant street furniture29%27%32%33%20%37%26%26%46%15%
Public toilets29%27%33%35%15%38%26%27%42%15%
Proper outdoor thermal comfort29%27%32%35%14%36%27%29%37%12%
Distinct pleasant smells28%23%34%35%10%36%26%27%33%6%
Table 5. Cross-tabulation of importance and satisfaction for provision of lighting.
Importance Level (%)Total (%)
Not at All ImportantSlightly ImportantNeutralImportantVery Important
Dissatisfied1 (0.33%)1 (0.33%)1 (0.33%)1 (0.33%)31 (10.26%)35 (11.59%)
Very dissatisfied1 (0.33%)1 (0.33%)-2 (0.66%)11 (3.64%)15 (4.97%)
Satisfaction level (%)Neutral3 (0.99%)10 (3.31%)10 (3.31%)8 (2.65%)33 (10.93%)64 (21.19%)
Satisfied2 (0.66%)10 (3.31%)3 (0.99%)31 (10.26%)74 (24.50%)120 (39.74%)
Very satisfied3 (0.99%)1 (0.33%)2 (0.66%)5 (1.66%)57 (18.87%)68 (22.52%)
Table 6. Disgruntlement measures for walkability indicators.
Disgruntlement of Indicators (%)Entire SampleMaleFemale(18–44) YearsOver 44 YearsSingleMarriedEmployedStudentSenior/ Retired
Public toilets49%53%43%43%64%43%51%52%35%67%
Benches41%44%35%34%56%30%45%46%18%58%
Canopies and shelters39%49%28%35%51%27%46%48%21%53%
Availability of parking38%42%34%35%46%31%40%42%26%55%
Proper outdoor thermal comfort37%38%34%30%52%29%39%39%26%53%
Air pollution level37%43%29%31%49%31%39%40%29%41%
Kerb ramp34%40%28%30%45%25%39%37%31%44%
Level of noise34%35%32%31%41%31%34%36%30%34%
Distinct, pleasant smells33%35%31%29%44%27%35%33%28%50%
Weather-resistant street furniture33%41%25%29%44%27%36%38%20%49%
Landscaping along streets33%36%28%30%38%26%36%37%28%36%
Tactile pavement for visually impaired32%34%30%31%37%29%34%34%33%29%
Absence of obstacles on footpath31%39%22%27%40%25%34%35%22%45%
Heat-resistant pavement30%37%24%27%42%22%35%36%19%46%
Presence of trees30%36%23%27%37%22%34%33%27%38%
Pedestrian crossings along streets29%35%23%28%33%28%30%36%23%28%
Quality of footpath pavement surface28%33%23%25%37%22%32%32%15%41%
Pedestrian signals28%30%25%26%33%27%28%27%33%35%
Public transportation facilities27%37%17%23%40%20%31%36%15%32%
Absence of abandoned buildings27%30%23%23%37%18%30%28%21%41%
Cleanliness and maintenance of paths and streets27%27%27%28%25%28%28%27%31%25%
Accessibility of public transit27%33%19%21%43%19%30%33%12%40%
Pedestrian protection from traffic accident risks27%33%21%28%23%25%28%30%25%23%
Presence of security cameras (CCTV)27%30%22%24%34%17%31%30%18%39%
Pedestrian wayfinding signage27%34%18%24%34%19%31%32%26%25%
Pedestrian footpath continuity27%32%20%23%34%16%31%32%10%30%
Pedestrian path width26%31%20%24%30%19%29%30%17%29%
Traffic volume25%31%19%26%24%25%27%29%25%17%
Wheelchair accessibility to mosques25%29%19%24%25%26%24%30%25%20%
Presence of children’s playground25%28%22%21%37%17%29%28%19%32%
Buffers between streets and footpaths23%27%17%19%30%16%25%26%13%32%
Proper spacing between trees23%25%18%21%23%21%22%21%27%21%
Buildings with identifiers21%24%17%18%29%13%24%24%9%29%
Landmarks20%24%15%17%27%11%24%25%12%24%
Traffic speed20%20%19%17%27%15%21%19%16%24%
Public open spaces19%20%18%17%25%11%23%22%14%12%
Accessibility of shops and services19%18%18%18%19%18%19%21%17%17%
Traffic-calming measures19%26%10%16%24%15%20%22%21%18%
Slope18%17%17%17%19%17%17%16%21%11%
Street signage17%16%19%17%18%12%20%19%13%22%
Open space markets/galleries16%21%9%13%22%12%17%17%7%30%
Service hours of activities15%17%13%13%21%11%17%17%13%13%
Pedestrian volume15%15%14%14%15%10%16%16%9%14%
Distribution of land uses15%11%18%14%17%9%17%15%9%18%
Provision of lighting15%13%16%15%13%18%13%14%21%4%
Presence of commercial zones/business activities15%13%15%13%18%12%15%15%15%20%
Visibility while crossing street14%15%12%13%16%11%15%14%8%13%
Variety of activities14%12%15%15%10%15%13%13%12%2%
Accessibility of mosques/prayer rooms13%13%13%11%19%11%14%16%4%20%
Table 7. Demographic profile of public survey participants.
FrequencyPercentage FrequencyPercentage
Gender Intra-City distribution
Male15652%Central of Riyadh4615%
Female14648%North of Riyadh10836%
Age group East of Riyadh7826%
18–24 years6221%West of Riyadh3211%
25–34 years8628%South of Riyadh3311%
35–44 years7525%Walking capability
45–54 years4515%Excellent13946%
55–64 years258%Very good9832%
65–7493%Good5017%
Over 75 years00%Fair134%
Marital status Poor21%
Single9431%Car availability
Married with children16956%Yes, always21270%
Married and no children3010%Yes, sometimes7926%
Widowed21%No114%
Divorced72%Nationality
Employment status Saudi28895%
Employed16755%Non-Saudi145%
Senior/retired3311%Household income
Student7725%SAR 4000 or less3712%
Unemployed258%SAR 4001–80005318%
Level of education SAR 8001–12,0006622%
Primary31%SAR 12,001–16,0005318%
Intermediate52%SAR 16,001–20,0003411%
High school5819%SAR > 20,0005819%
Certificate/diploma (2 yrs)3411%
Bachelor’s degree15451%
Master’s degree3913%
PhD93%
Table 8. Thematic commonalities for the comments from the public on walking in Riyadh.
Commentsn%
Walking in Riyadh is a challenge14079.6
Walking in Riyadh is positive2916.4
No experience, I have only visited GCC countries74.0
Table 9. Thematic commonalities for the comments from the public who considered walking in Riyadh a challenge.
Commentsn%
Functional considerations4921.1
Safety considerations4318.5
Environmental considerations3916.8
Comfort considerations3314.2
Regulation and legal considerations2611.2
Cultural considerations2410.3
Considerations of aesthetic qualities187.8
Disclaimer/Publisher’s Note: The statements, opinions and data contained in all publications are solely those of the individual author(s) and contributor(s) and not of MDPI and/or the editor(s). MDPI and/or the editor(s) disclaim responsibility for any injury to people or property resulting from any ideas, methods, instructions or products referred to in the content.

