Abstract
This paper presents field experiments of mineral deposition on steel, induced by cathodic polarization in natural seawater, as a sustainable strategy for the life extension of marine steel structures. Although this approach is quite well known, the ability of the mineral deposit to both protect steel from corrosion in the absence of a cathodic current, thus operating as an inorganic coating, and provide an effective substrate for colonization by microorganisms still needs to be fully explained. To this end, two identical steel structure prototypes were installed at a depth of 20 m: one was submitted to cathodic polarization, while the other was left under free corrosion for comparison. After 6 months, the current supplied to the electrified structure was interrupted. A multidisciplinary approach was used to analyze the deposits on steel round bars installed in the prototypes over time, in the presence and in the absence of a cathodic current. Different investigation techniques were employed to provide the following information on the deposit: the composition in terms of elements, compounds and macro-biofouling; the morphology; the thickness and the degree of protection estimated by electrochemical impedance spectroscopy (EIS). The results showed that under cathodic polarization, the thickness of the deposit increased to 2.5 mm and then remained almost constant after the current was interrupted. Conversely, the surface impedance decreased from 3 kΩ cm2 to about 1.5 kΩ cm2 at the same time, and the aragonite–brucite ratio also decreased. This indicates a deterioration in the protection performance and soundness of the deposit, respectively. Considering the trends in thickness and impedance together, it can be concluded that the preformed mineral deposit does not undergo generalized deterioration after current interruption, which would result in a reduction in thickness, but rather localized degradation. This phenomenon was attributed to the burrowing action of marine organisms, which created porosities and/or capillary pathways through the deposit. Therefore, the corrosion protection offered by the mineral deposit without a cathodic current is insufficient because it loses its protective properties. However, the necessary current can be quite limited in the presence of the deposit, which in any case provides a suitable substrate for sustaining the colonization and growth of sessile marine organisms, thus promoting biodiversity.
1. Introduction
In the seas and oceans, the concept of sustainability—especially at the European level—has recently declined in the philosophy of “blue growth”, which represents a long-term strategy supporting the marine and maritime sectors to minimize ecological impacts as much as possible. This strategy encourages every company to frame decisions in terms of their environmental and social impact. It is now clear how the further growth of ocean industries implies increasing pressures on ocean resources and demand for ocean space. The offshore sector of oil and gas is expected to be most affected by this strategy, in response to perceived public discontent over the long-term damage caused by the focus on short-term profits. Furthermore, the development of new offshore activities and infrastructures, such as wave and tidal energy extraction, marine aquaculture, and offshore wind farms, requires specific technologies to address ecological conservation challenges. Given these premises, the concept of “blue energy”, and in general of the “blue economy”, aimed at the sustainable utilization of ocean and sea resources, is of paramount importance [1,2].
The potential ecological value of offshore platforms raises the question of the existence of alternatives to the standard decommissioning process based on the complete removal of these infrastructures, potentially leading to significant positive ecological outcomes, as recently highlighted in decommissioning assessments [3,4,5,6]. A key historical initiative in this context has been the launch of several strategies and technologies to mitigate or compensate for damage to marine life due to offshore platform removal [7]. Some authors have promoted the recycling of obsolete oil platforms as artificial reefs by creating a resource for fishery development [8,9]. However, to date, only a few countries in the world have successfully implemented Rigs-to-Reefs programs [10,11].
New concepts and approaches are needed for the sustainable management of marine ecosystems which can undergo substantial changes or alterations due to human activities, including those related to the decommissioning of offshore infrastructures [1,10,12,13]. A schematic synthesis of decommissioning options is reported in Figure 1. An offshore platform at the end of its productive phase (Figure 1A) could be subjected to reefing in situ solutions, i.e., partial decommissioning/leave in place/mild topping (Figure 1B), topping (Figure 1C), or horizontal reefing (Figure 1D). Alternatively, complete removal can be carried out, both for recycling/recovery/landfill diversion (Figure 1E) and reefing elsewhere as a submerged coastal defense (Figure 1F). Finally, the last option refers to platform conversion for multiple eco-sustainable uses (Figure 1G). In this case, technologies and solutions include (i) integrated aquaculture solutions, (ii) integrated offshore renewable energy generation, and (iii) innovative supporting systems for ecotourism activities. For the reuse of offshore platforms and to enhance the value of their natural capital, a life-extension strategy is required.
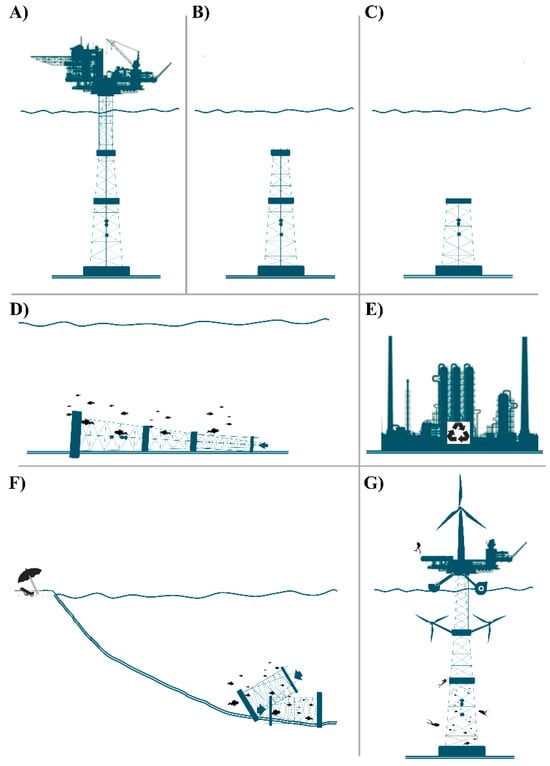
Figure 1.
Schematic illustration of decommissioning options for an existing platform: (A) the original structure as is; (B) submerged structure left in place; (C) topping; (D) horizontal reefing in situ; (E) complete removal; (F) non-in situ reefing; and (G) platform conversion for multiple eco-sustainable uses.
Some of the present authors have highlighted that one option to extend the life cycle of offshore platforms is through the formation of mineral deposits, consisting mainly of calcium carbonate and magnesium hydroxide, on steel underwater structures induced by cathodic polarization [14,15]. Mineral-induced deposition by cathodic polarization can protect steel structures from corrosion and can represent a suitable substrate for the colonization and growth of sessile organisms. This is a well-known phenomenon commonly occurring in the cathodic protection of steel structures against marine corrosion [16,17] and used for restoring damaged/degraded biological assemblages (e.g., coral reefs, oyster/mussel beds) [18,19,20,21]. More specifically, the electrochemical reduction of oxygen and water that occurs at the cathodes results in an increase in the pH at their surface, which determines the shift of the equilibrium towards the carbonates (CO32−) and then to the precipitation of CaCO3 [22,23,24]. CaCO3 can form two different polymorphs under typical seawater conditions: aragonite and calcite. Preliminary experiments have shown that increasing the current above a certain level promotes an increasing amount of magnesium hydroxide (Mg(OH)2, brucite) together with CaCO3, as aragonite [15,17]. Aragonite is a compact material with high hardness, whereas brucite is a brittle material with low hardness [23]. Aragonite is found in metamorphic rocks, formed at high pressure and low temperature [25]. In seawater, the important presence of Mg2+ ions favors this allotropic form [17].
Although different aspects of mineral deposition induced by cathodic polarization have previously been investigated [15], information on the capacity of the deposit to protect steel from corrosion and its effects on biofouling colonization dynamics, once the electric field is interrupted, must be elucidated. Therefore, this work was primarily aimed at supplying this information thanks to a multidisciplinary collaboration in the framework of the Place project [26].
Considering that the induced mineral deposit has the dual function of working as a coating for the corrosion protection of the steel structures and supporting biofouling colonization for the restoration of marine ecosystems, different investigation techniques were used in this work to characterize the deposit. An in-depth chemical–physical analysis of the deposit was conducted by means of thickness measurements, the determination of surface impedance by electrochemical impedance spectroscopy (EIS), X-Ray Diffraction (XRD), Fourier Transform Infrared spectroscopy (FTIR), and Scanning Electron Microscopy together with Energy-Dispersive X-ray spectroscopy (SEM-EDX). In addition, macro-biofouling composition analysis of the microorganisms colonizing the mineral deposit was conducted through optical microscopy and SEM.
Characterizations of the mineral deposit were performed over time in the presence and in the absence (current interruption) of cathodic polarization to provide fundamental indications of the degree of corrosion protection of steel given only by the mineral coating. This information represents the reply to the question of the necessity of supplying a cathodic current once the induced mineral deposition has occurred and the deposit can work alone as a corrosion protection coating for steel structures.
Finally, the parameters playing an important role in the examined deposition technology (current density, seawater temperature, oxygen concentration, and conductivity) were analyzed as well.
2. Materials and Methods
2.1. Site of the Mineral Deposition and Experimental Setup
The field experiment was carried out at ca. 20 m depth within the Marine Protected Area of Isola di Bergeggi (Ligurian Sea, Northwestern Mediterranean Sea) by installing two twin prototype steel structures (hereafter referred to as A and B) built for assessing mineral deposition processes and biofouling dynamics. The island of Bergeggi, located about 250 m from the coast, rises between Bergeggi and Spotorno (Liguria, northern Italy) and hosts a remarkably diversified environment of great naturalistic value, both from a geological and biological point of view, which makes it a true natural laboratory.
These steel structure prototypes consisted of 8 steel cathodes in the shape of cylindrical bars, with a diameter of 3.34 cm and a length of 90 cm. Prototype A was not electrified, and the bars were left in free-corrosion conditions and operated as a control in the experiment, whereas prototype B was electrified for the cathodic polarization of the bars by means of a constant potential difference of 2.5 V. Polarization was performed using an anode, placed in the center of a suitable electrochemical cell, consisting of a titanium mesh wrapped around a PVC cylinder, with a diameter of 15 cm and a length of 90 cm. The software package for the acquisition and control of the applied voltage values was developed in C language, with an acquisition frequency set to 1 sample per minute. Parameters such as the potential difference, primarily to verify that it remained constant at 2.5 V, as well as the current passing through the circuit, were recorded. A schematic overview of the field experiment is shown in Figure 2. Additional details can be found elsewhere [15]. Besides the steel prototypes, a multiparameter probe (C in Figure 2) for the detection of seawater conductivity (salinity), temperature, and dissolved oxygen concentration was also deployed. Environmental variables were monitored with an acquisition time of 5 min.
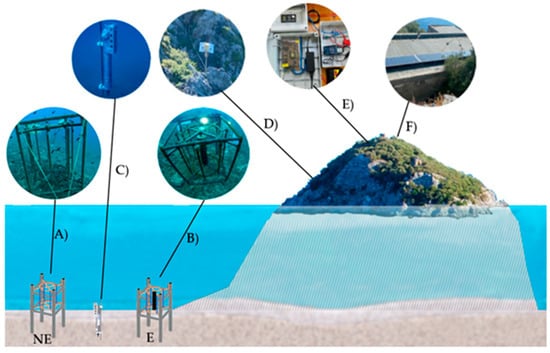
Figure 2.
Schematic representation of the twin prototypes and instrumentation: (A) non-electrified (NE) samples; (B) electrified (E) samples; (C) multiparameter probe; (D) power system; (E) control and acquisition equipment; and (F) solar panels.
The various phases of bar recovery included both electrified and non-electrified structure prototypes. Before being brought to the surface, the bars were placed in two specially designed watertight tubes filled with water and quickly transported to shore. After being left to dry in the sun for approximately two hours, the bars were cut and divided into sections according to the analyses outlined in this article. The deposits were collected from each section of the bars (both electrified and non-electrified) to account for the material’s heterogeneity. The extracted samples were then stored in sterile test tubes and sent to the laboratory for the various analyses conducted.
2.2. Chemical–Physical Characterization of Mineral and/or Rust Deposits
The bars were withdrawn from the Bergeggi mineral deposition site on the dates reported in Table 1 and correspondingly labelled with “Time n” (n = 1 to 6). Samples of the bars were obtained and submitted to the following chemical–physical analyses.

Table 1.
The dates when the samples were collected for the different analyses and the corresponding labels.
They were divided into electrified samples (E, coming from structure B in Figure 2), which were subjected to cathodic polarization, and non-electrified samples (NE, coming from structure A in Figure 2), i.e., left in free-corrosion conditions in seawater. With more detail, measurements of deposit thickness (Section 2.2.1) and electrochemical characterization (Section 2.2.2) were performed on both types of samples. On the other hand, chemical analyses (Section 2.2.3, Section 2.2.4 and Section 2.2.5) were carried out only on E samples, focusing the study presented in this paper on the composition, morphology, and then on the progress of the induced mineral deposits during the whole experiment.
The power supply to the electrified structure was activated on 17 July 2020 and interrupted on 18 January 2021, and therefore, the E bars collected at Times 5 and 6 (Table 1), with the mineral deposit previously formed on their surface, were left under free exposure to study the deposit’s ability to protect the steel against corrosion, in the absence of cathodic polarization, and the possibility of being dissolved in seawater over time.
2.2.1. Determination of the Deposit Thickness
To assess the progress of mineral and/or red rust (with fouling) deposition, as a function of time, for E and NE samples, respectively, the thickness was indirectly calculated by measuring the bar diameter through a digital caliper, with a resolution of 0.01 mm, taking 50 values along the bars’ lateral surface. These measurements were randomly performed due to a significant surface inhomogeneity found in the different deposits. The same procedure was applied to bare steel bars without any deposits or rust/fouling, thus obtaining the deposit thickness by calculating the half-difference of the average diameters.
2.2.2. Measurement of the Electrochemical Surface Impedance of the Deposits
Electrochemical tests were carried out on one sample of E and one sample of NE steel bars collected at Time 1, Time 3, Time 5, and Time 6 by means of EIS. For such analysis, pieces of steel bars were suitably covered with epoxy resin to obtain a surface that was as homogeneous and geometrically defined as possible (Figure 3). The single samples of both bar types were chosen by using two criteria: (i) the presence of a sound deposit after cutting; (ii) to have a sufficient extension of the deposit in the sample to be representative of that present in the whole bar, so as to obtain an average value of its surface impedance.
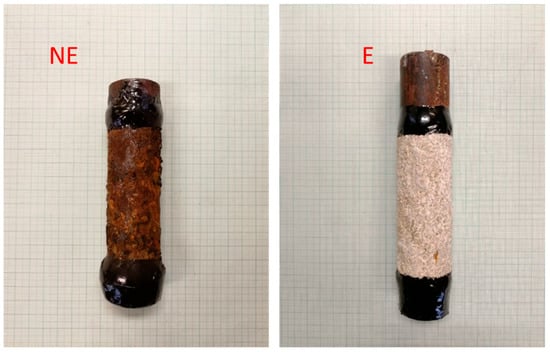
Figure 3.
Example of samples prepared for EIS measurements. They were obtained by cutting the bars collected from the submarine structures (the dark borders visible on each sample are the cured epoxy resin used to define the surface under investigation).
The same EIS analysis on the samples collected at Time 2 and Time 4 was practically impossible because the preparation of the samples was invalidated by the damage of the fragile mineral deposit on E samples. Therefore, the corresponding NE samples, used for comparison, were also not submitted to EIS analysis.
A typical three-electrode configuration electrochemical cell was used: the prepared samples (Figure 3) were the working electrodes; the reference electrode was a saturated calomel electrode (SCE, +0.241 V vs. SHE); and the counter electrode was an activated titanium wire. The test solution was NaCl 3.5 wt%. A Gamry Reference 600 potentiostat (Gamry instruments, Warminster, PA, USA) was used to conduct EIS measurements, setting a frequency range of 100 kHz–0.01 Hz and a potential amplitude of 10 mV. Each measurement session was performed after 1 h of immersion of the samples in the electrolytic solution.
The values of the impedance modulus at the lowest frequency were taken to determine the surface impedance of the samples to quantify the “relative degree of protection” offered by the mineral and rust deposits for the E and NE samples, respectively.
The calculated area of each sample exposed to the electrolyte solution is reported in Table 2. The values are not equal among them because it was practically impossible to select pieces of bars with the same length, given the inhomogeneity of the deposits. Therefore, the most representative pieces of each bar were selected to conduct EIS measurements.
Table 2.
Sample areas in cm2 exposed to 3.5 wt% NaCl electrolyte solution for EIS measurements.
2.2.3. X-Ray Diffraction Analysis
The chemical composition of the deposit on E samples was determined by powder XRD analyses. Sample fragments, suitably ground in a mortar, were analyzed using a Rigaku SmartLab diffractometer equipped with a 9 kW rotating anode and operating at the Kα line of copper (wavelength λ = 1.54 Å). Conventional Bragg–Brentano reflection geometry was used to perform 2θ angle scans from 15° to 90°. The mineral fractions in the samples were quantified using a structureless whole powder pattern fitting analysis (Rigaku PDXL 2 software).
2.2.4. Fourier Transform Infrared Spectroscopy Analysis
Deposits were further characterized using FTIR. The analysis was conducted in transmission mode using fragments of mineral deposits obtained from E steel bars. Samples were prepared using a hydraulic pellet press: they were mixed with KBr in a ratio of 1:100 by weight (1 mg of sample and 100 mg of ground KBr), and they were pressed in a die, forming a pellet on which the analysis was performed (10 tons of pressure and a time of 1 min).
All infrared spectra were recorded on a Perkin Elmer Spectrum GX1 spectrometer, equipped with a DTGS detector. The spectral range was 4000–400 cm−1, with a spectral resolution of 4 cm−1; each spectrum was the result of 32 scans. Three IR spectra were acquired for each sample. Before each sample acquisition, the background was calculated using a pellet of only KBr. Raw IR spectra were converted in absorbance mode, baseline-corrected, and vector-normalized (Spectrum 10.4.0 software, Perkin-Elmer, Waltham, MA, USA).
2.2.5. Morphology Observations and Elemental Analysis by Means of SEM-EDX
The sample morphology and elemental composition of the materials deposited on E bars were investigated by SEM-EDX. For these purposes, a TESCAN VEGA3 LMU scanning electron microscope equipped with an EDAX-element EDX detector was used (TESCAN GROUP, a.s., Brno—Kohoutovice, Czech Republic).
For observations and analysis, the deposited material was detached from the steel substrate and attached by carbon tape to an SEM stub. A thin carbon film was deposited on the sample to make it conductive. The electron gun of the microscope was set to 30 kV to match good contrast in the images acquired by both secondary electrons, more sensitive to the morphology, and backscattered electrons, more sensitive to the atomic number of the elements composing the samples. The same electron gun voltage was used for the EDX analysis to have a reasonable statistic for the compound’s reliable detection.
2.3. Macro-Biofouling Assemblage Composition
For the analysis of macro-biofouling, sections (length = 25 cm) of NE and E steel bars were gently washed with sterile seawater to remove any sand particles. The bars were then photographed and covered with a plastic mesh (mesh size = 1 cm × 1 cm) to divide the surface of the samples equally. The macro-biofouling organisms were identified using a stereomicroscope (Leica EZ4, Leica Microsystems, Wetzlar, Germany), and, when needed, a light microscope (Leica DM3000, Leica Microsystems, Wetzlar, Germany) was used to analyze the organisms in more detail. The identification of specimens was carried out at the phylum level and, when possible, at the lowest taxonomic level. The Covering Index of each taxon was evaluated using a modified Braun-Blanquet scale of the abundance–dominance coefficient [27]. Then, to investigate the presence of boring organisms (e.g., polychaetes, sponges, endolithic algae), mineral deposits were gently pried from the E bars, and all the fragments were collected in Petri dishes. These were then prepared as described above for the SEM analysis (Section 2.2.5).
3. Results and Discussion
Clear macroscopic differences between E and NE steel bars were found by visual observations. Indeed, E bars were characterized by the presence of a whitish material, whereas NE bars showed the presence of red rust on the surface. On both types of bars, biofouling settlements were observed, responsible for some modifications to the color and morphology of the deposit surfaces.
In the following sections, all the results of the chemical–physical characterizations of the deposits and the macro-biofouling analysis will be illustrated, discussing each experimental investigation and cross-referencing the observations that were made progressively.
3.1. Current Density and Environmental Data Acquired from the Mineral Deposition Working Station
The environmental chemical–physical data along with current density values acquired during cathodic polarization are displayed in Figure 4. At the early stages of cathodic polarization, when mineral deposits are not yet formed on the steel bars, the current density (Figure 4A) is mainly dependent on the diffusion process of oxygen, which in turn depends on different variables, like the concentration of oxygen in seawater, temperature, and conductivity (Figure 4B). Furthermore, the electrical current is influenced by the velocity of marine currents. An increase in temperature, oxygen concentration, and marine current velocity increases the cathodic current density [16,17].
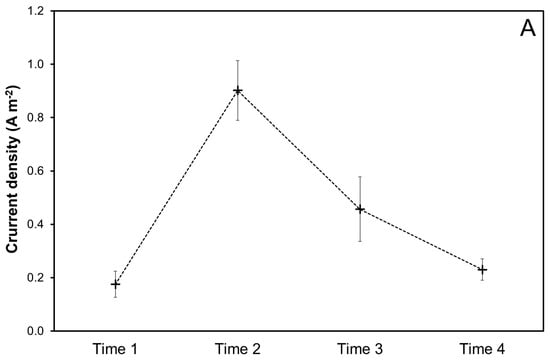
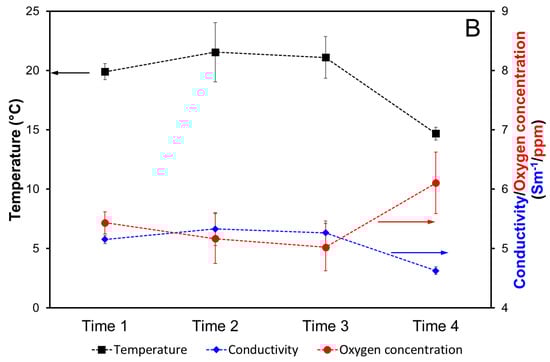
Figure 4.
Current density (A), temperature, conductivity, and oxygen concentration (B), as mean and standard deviations, during the cathodic polarization at different Time n (n = 1–4, Table 1). The values of conductivity and oxygen concentration have a comparable order of magnitude; thus, a single right Y-axis is used for them.
During summer and autumn periods (Times 1, 2, and 3), the oxygen concentration and temperature remained almost constant, around 5 mg L−1 and 21 °C, respectively. In the winter (Time 4), a decrease in temperature from 21 to about 15 °C was observed. As expected, this resulted in an increase in the concentration of oxygen to about 6 mg L−1. Conductivity (i.e., salinity) followed a similar temporal trend to temperature (Figure 4B).
From Time 1 to Time 2, a significant increase in the current density was observed (from 0.175 to 0.902 A m−2 in Figure 4A). Such an increase is limitedly determined by the slight increase in temperature and correspondingly the increase in conductivity, which promotes the current flow with a power supply constantly kept at 2.5 V. Thus, other environmental factors appear to be responsible for the increase in the cathodic current density, which is responsible for the initiation and progress of mineral deposition, such as the water current velocity.
From Time 2 to Time 3 and Time 4, the current density decreased significantly in countertendency to a significant oxygen concentration increase at Time 4 (Figure 4B), suggesting that the formed mineral deposit determined a limitation of the oxygen diffusion with a consequent reduction in the observed cathodic current density [16] in Figure 4A after Time 2.
3.2. Deposit Thicknesses and Surface Impedances
Due to the presence of the mineral deposit induced by cathodic polarization, the E bars showed significant differences, in terms of thickness and surface impedance, compared to NE bars left in free-corrosion conditions. In particular, the formation of biofouling had a great influence on the thickness of the NE bar deposits because the marine organisms settling and colonizing their surface belong to a variety of taxa with different morphological characteristics (Section 3.6) and were progressively unevenly distributed along the surface (Figure 5) as the immersion time increased. The nonhomogeneous (patch) distribution and morphology of these deposits on NE bars were responsible for the high variability in the thickness values, as revealed by the high standard deviations, in particular at longer immersion times (Time 5 and Time 6), for biofouling colonization and growth (Figure 6).
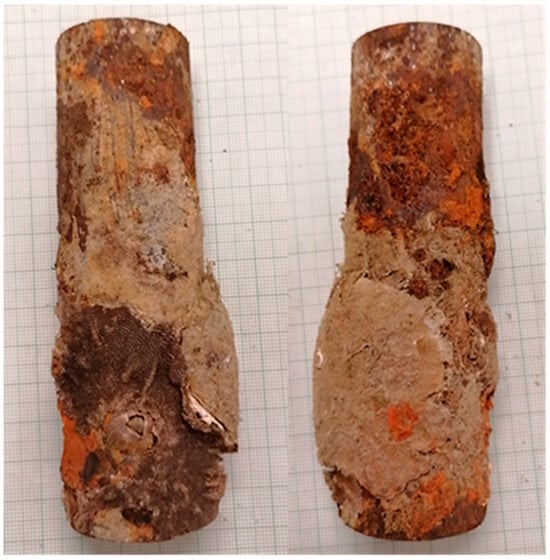
Figure 5.
Images of two samples obtained from the NE bar at Time 6, showing relevant biofouling colonization on the underlying steel substrate.
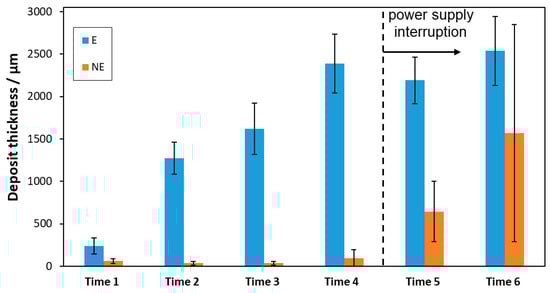
Figure 6.
Thicknesses of the deposits taken from the Bergeggi mineral deposition station.
The thicknesses of the mineral deposits increased to about 2.5 mm over time from Time 1 to Time 4 under cathodic polarization on E bars, thus indicating an effective progress of mineral deposition induced by the supplied cathodic current. Such an increase was not observed for the NE bars, in the same time interval, due to the lack of cathodic polarization.
After the current supply was interrupted, the thickness of the mineral deposit on E bars remained almost constant. These results indicate that the mineral deposit did not undergo a generalized dissolution in the absence of cathodic polarization; thus, it was potentially able to maintain its corrosion protection characteristics, at least during the timeframe investigated.
The degree of protection against corrosion of the deposits on E and NE steel bars was assessed through the EIS technique [28,29]: a high surface impedance (taken at low frequency) corresponds to a high degree of corrosion protection given by the deposit.
Figure 7 shows the results of the surface impendence values of the samples at Time 1, Time 3, Time 5, and Time 6.
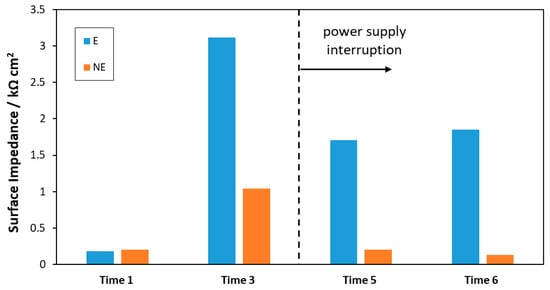
Figure 7.
Surface impedances obtained after 1 h immersion in 3.5 wt% NaCl of the bars taken from the Bergeggi deposition station.
The values of the surface impedances of E and NE samples at Time 1 were very low (0.18 and 0.20 kΩ cm2, respectively) because they were measured only 14 days from the in situ installation of the steel prototypes. Furthermore, these values were similar since the induced mineral deposit on E bars was so thin (corresponding to a low current density at Time 1, Figure 4A) that its protective effect was indistinguishable from the rust layer naturally formed on NE bars. A significant difference between the surface impedance of the E and NE bars was observed at Time 3 (3.12 vs. 1.04 kΩ cm2), when the induced mineral deposition had progressed in terms of deposit thickness. Therefore, it can be stated that an increase in the mineral deposit thickness corresponds to an improvement in the degree of corrosion protection of the steel substrate.
After the interruption of the current (i.e., Times 5 and 6), the surface impedance decreased for both bar types. It is worth noting that the surface impedance decreased in E bars despite the thickness of the mineral deposit remaining almost constant (Figure 6). These results suggest that the mineral deposit was not subjected to generalized deterioration but to localized deterioration during the time it remained in seawater without cathodic polarization. As a consequence, a porous material with the formation of capillary pathways was produced, where the electrolyte can penetrate and reach the steel substrate. This hypothesis is corroborated by two fundamental considerations: EIS is sensitive to the access of the electrolyte to the steel substrate through porosities and capillary pathways present in the deposit and then to the loss of its protection characteristics; contrarily, thickness measurements taken with a caliper only take into account the external surface of the deposit, without detecting the formation and the progress of the porosities determined by the localized coating deterioration. Such micro-scale deterioration of the mineral deposit could also be promoted/accelerated by the action of borers, as will be discussed later (Section 3.6), in the absence of the current.
In conclusion, the mineral deposit cannot maintain the completely effective corrosion protection of the steel substrate when the cathodic polarization is interrupted.
3.3. XRD Diffractograms of Mineral Deposits
XRD analysis provided information on the mineral composition of the deposits present on the surface of E steel bars over time. A representative diffractogram, corresponding to Time 5, is shown in Figure 8: the peak sequence reveals the presence of comparable amounts of aragonite and brucite, with traces of other compounds (essentially quartz).
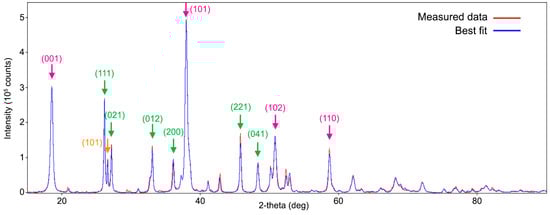
Figure 8.
A background-subtracted powder diffraction profile showing the characteristic peaks and crystalline nature of the Time 5 sample: experimental data (red curve) and corresponding best fit (blue curve). Arrows indicate the main diffraction peaks of aragonite (green), brucite (magenta), and quartz (orange) together with the corresponding Miller indices.
Although the measured fraction values are affected by uncertainties, fitting the whole powder pattern provided a quantitative estimation of the composition of each sample, as summarized in Figure 9A: apart from the thin deposit collected after 14 days (Time 1), which consisted almost exclusively of aragonite, all other samples contained more aragonite than brucite, considering that the mass ratio of aragonite–brucite was higher than 1 (Figure 9B). The mass ratio increased from Time 2 to Time 4, and after the interruption of the power supply in correspondence with Time 5 and Time 6, it decreased to a value of around 1. In the absence of power supply, even a decrease in the amount of CaCO3 can be noticed in Figure 9A, while the amount of brucite remained almost the same.
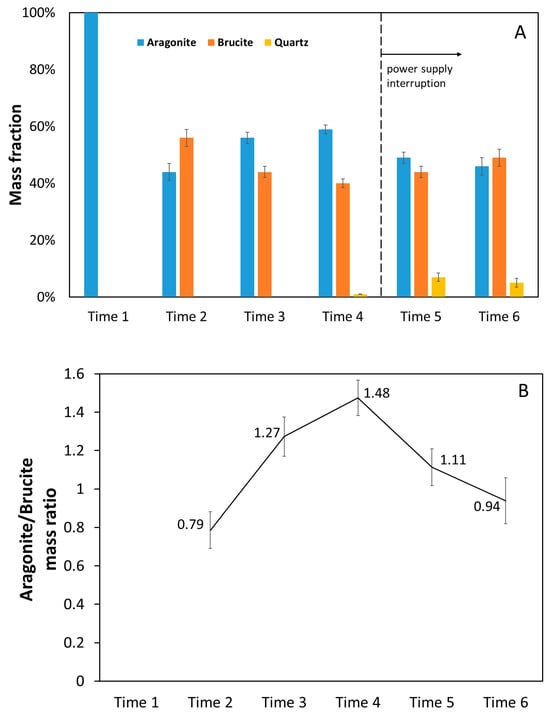
Figure 9.
Chemical compound amounts (wt%) present in the mineral deposit on E bars collected in the six sampling periods (A) and aragonite/brucite mass ratio (B).
It is important to define the proper conditions that favor the growth of aragonite and limit that of brucite because the two compounds have very different mechanical properties, with the former being stronger and less flaky [19,23]. Therefore, a high aragonite content in the mineral coating on the cathode surface is preferable and can progressively lead to a more compact deposit with a potentially greater capacity to protect the underlying substrate from corrosion.
At the same time, this CaCO3 coating on the cathode surface can provide a suitable substrate for the colonization and growth of various marine organisms (Section 3.6), performing the same function as natural limestone rocks [30]. For this reason, the mineral deposits formed on the surface of steel bars could be useful not only to protect the underlying metal from corrosion but also to support biodiversity.
During the cathodic polarization in the present experiment, aragonite was produced along with brucite, which, although present in smaller amounts, cannot guarantee the highest mechanical properties of the mineral deposit. These amounts of brucite are most likely determined by too high cathodic polarization [16,19] considering the constant potential difference of 2.5 V of the power supply system (Section 3.1). The consequence of this setup is the production of current densities that cannot be suitably controlled and are strongly dependent on environmental conditions. For example, at Time 2, the current density was very high (Figure 4A), likely promoting brucite deposition.
The slight decrease in aragonite after power supply interruption (Figure 9A) could be related to the previously hypothesized localized dissolution/deterioration of the mineral deposit, as discussed in Section 3.2.
3.4. FTIR Spectra of Mineral Deposits
Steel bars from the Bergeggi deposition station were analyzed using FTIR to perform a molecular characterization of E samples and to make a qualitative comparison with the data obtained from XRD analyses.
The average spectra, representative of each sample of mineral deposit on E bars, collected at different times, are shown in Figure 10. The Time 1 sample presented typical aragonite bands at 1446, 1080, 852, 709, and 696 cm−1, in addition to bands at 3347 and 1637 cm−1, which could result from water if the Time 1 sample was not completely dried before being tested [31].
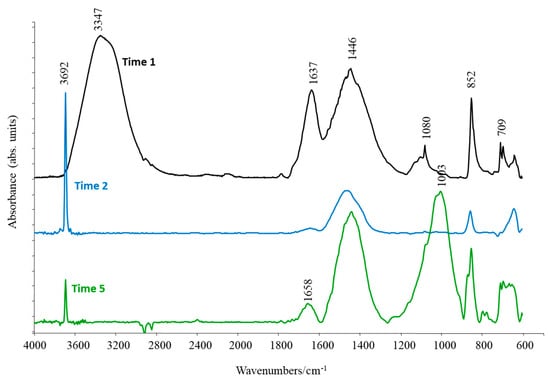
Figure 10.
Average absorbance spectra of Time 1, 2, and 5 samples, in the range 4000–600 cm−1.
In addition to these bands, the FTIR spectra of all the other samples (Times 2, 3, 4, 5, and 6) showed a narrow band at 3692 cm−1, representative of brucite (Mg(OH)2) in the deposit [32]. To better evaluate the different compositions of the mineral deposits collected at Time 2-Time 6, in terms of the relative aragonite and brucite amounts, a qualitative comparison of band areas at 852 cm−1 and 3692 cm−1 (representative of aragonite and brucite peaks, respectively) can be conducted. The observation of these bands in Figure 10 highlights the prevalence of aragonite in all samples except for the sample at Time 2, in which a greater amount of brucite was observed, in accordance with what was observed by the XRD analyses (Figure 9). Furthermore, the Time 5 and Time 6 samples reported a broad band at 1003 cm−1, characteristic of quartz, confirming again what was observed by XRD.
Lastly, the band at 1658 cm−1, observed at Time 5, could have been caused by colonization by marine organisms after the power supply necessary for cathodic protection was interrupted [33].
3.5. SEM-EDX Observations
SEM observations were performed on samples of the mineral deposits present on the E steel bars. The surface of each examined sample was characterized by a high roughness regardless of its composition and deposition time.
Figure 11 shows a typical SEM image acquired via secondary electrons, representing the samples’ general morphology. Some cracks, a few hundred microns in width, were observed.
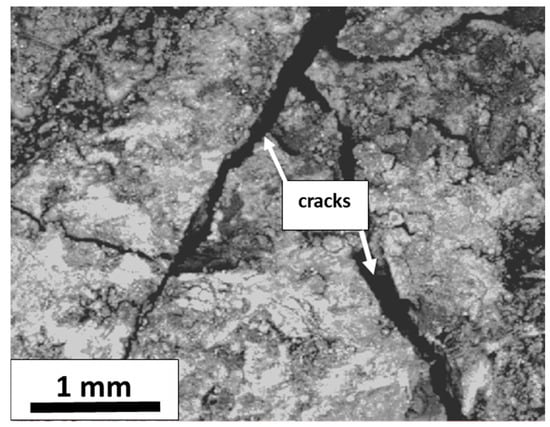
Figure 11.
Typical SEM image acquired by secondary electrons showing the surface morphology of a representative sample of the mineral deposit.
Figure 12 displays the SEM images of two representative areas of the deposits obtained at Time 5, acquired by backscattered electrons, which show a contrast connected to the average atomic number of the material: brighter for Ca and darker for Mg.
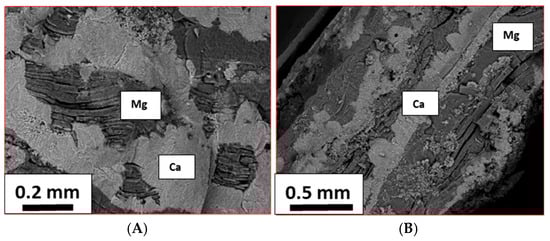
Figure 12.
SEM images of E samples acquired in two different areas (A,B) with backscattered electrons, showing the distribution of Ca (bright part of the images) and Mg (dark part of the images) at Time 5.
The corresponding EDX analyses of the deposits are reported in Table 3. Assuming that Ca and Mg correspond to CaCO3 and Mg(OH)2, respectively, as suggested by the XRD results, the normalized mass fractions of these two compounds and their mass ratios were calculated and are reported in the same table.
Table 3.
Results of EDX analyses, with calculated mass fractions of CaCO3 and Mg(OH)2 of deposit obtained at Time 5 (Figure 12). Determination of the mass ratio of these compounds.
The calculated mass ratios are different in the two regions: the first ( corresponding to Figure 12A) is in good agreement with the results of the XRD analysis at Time 5, confirming that the amount of aragonite is higher than that of brucite (Figure 9B), even if the obtained ratio is higher (1.4 vs. 1.1); in the second case (relative to Figure 12B), a lower amount of aragonite has been found in comparison to brucite; thus, the ratio is lower than that found by XRD and under 1.0 (0.57 vs. 1.1).
If an average value of the ratios is considered, a value of around 1.0 is obtained, which is in good agreement with the results found by XRD. Considering that XRD data are obtained analyzing only the crystalline part of the sample, while EDX results refer to the crystalline and amorphous parts of the sample, it is possible to deduce that the deposit is highly crystallized.
3.6. Composition of Macro-Biofouling
The macro-biofouling covered over 90% of the surface of both NE and E steel bars at all the sampling times considered, except for Time 1 (14 days of immersion), at which a clear difference between the macro-biofouling coverage of the NE bar and E bar was observed (38.6% and 99%, respectively; Figure 13).
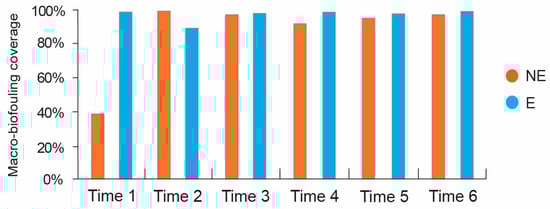
Figure 13.
Macro-biofouling coverage percentage of NE and E steel bars at each sampling time.
The initial phase of macro-biofouling colonization (Time 1) was characterized by a limited number of taxa on both bars, mainly represented by Hydrozoa and the eggs of unidentified organisms (Figure 14A). On the NE bar, signs of colonization by organisms belonging to the phyla Thoracica and Polychaeta were also present. These patterns were like those previously reported for other artificial substrates in the Mediterranean Sea [34,35].
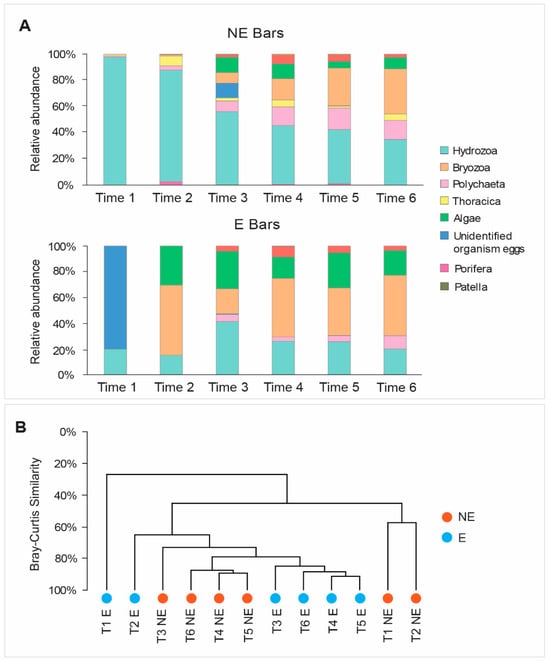
Figure 14.
(A) Macrofouling composition on NE and E steel bars at different sampling times (Time 1–Time 6); (B) Bray–Curtis analysis showing the similarity among macro-biofouling compositions at different sampling time intervals (Time 1–Time 6, abbreviated as T1–T6).
During the polarization phase, the macro-biofouling on both the NE and E bars was characterized by an increase in the number of taxa over time, reaching eight taxa on the NE bar and six taxa on the E bar at Time 4. When the polarization was interrupted, the number of taxa on the previously polarized bars further increased to seven at Time 6. This suggests that the applied electric field could slightly inhibit colonization by a few macro-biofouling taxa [19,24].
The macro-biofouling compositions on the E and NE bars changed over time. On the NE bar, the contribution of Hydrozoa decreased from 94% (Time 1) to 45% (Time 4), whereas Polychaeta (from 1% at Time 1 to 14% at Time 4) as well as Thoracica (1% to 5%), Bryozoa (from 0% to 16%), and Bivalvia (from 0% to 7%; Figure 14A) increased.
On the E bars, the contribution of the macro-biofouling taxa did not show a clear temporal pattern. For example, the contribution of Hydrozoa increased from Time 2 to Time 3 and then decreased at Time 4, whereas an opposite pattern was observed for Bryozoa. In addition, on the E bar, a larger contribution of algae was observed, along with a minor contribution of barnacles (Thoracica) compared to the NE bar.
Despite such differences, the cluster analysis based on the Bray–Curtis similarity showed that after Time 3 the macro-biofouling composition on the two bars was very similar (73%; Figure 14B). In particular, the macrofouling composition on the E bar became even more like that on the NE bar, especially after the polarization interruption (Time 5 and Time 6).
Morphological SEM analyses revealed signs of the perforation (diameter 950 μm; Figure 15B) of the mineral deposit during the polarization (Time 3 and Time 4; Figure 15C), which may be attributable to juvenile polychaetes or barnacles, given the compatible dimensions between these organisms and the circular structures observed [36,37] (Figure 15A,F). Other smaller perforations (diameter 5–50 μm; Figure 15C,F) in the mineral deposit were possibly due to other burrowing organisms such as endolithic sponges, cyanobacteria, and algae [38]. Similar perforations of the calcareous deposit were also found after the polarization phase (Figure 15D–F), suggesting a slight but continuous burrowing process by marine organisms (Figure 15D,E).
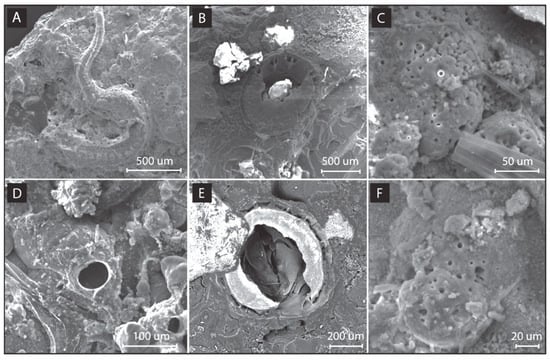
Figure 15.
SEM images of burrowing organisms and burrowing traces in mineral deposits on E bars: (A) Serpulid polychaete growing on mineral deposit; (B) cross-section of perforation (diameter 950 μm) found in mineral deposit; (C) small perforations (diameter 5–15 μm) found in some parts of the mineral deposit; (D) perforation of 50 μm diameter in mineral deposit probably produced by a polychaete; (E) cross-section of perforation (diameter 650 μm) in mineral deposit with an internal ultrastructure attributable to a juvenile stage of a barnacle; and (F) other small perforations (diameter 5–15 μm). Images A-C were taken at Times 3 and 5 (during polarization), whereas (D–F) were taken at Time 5 (after polarization).
The results obtained corroborate the hypothesis reported in Section 3.2 about the role of biofouling acting on a micro-scale which may contribute to the reduction in impedance observed at Time 5 and Time 6 without any clear variation in deposit thickness. No evident signs of metal deterioration imputable to biofouling were detected.
Overall, it can be concluded that artificial mineral substrates can sustain macro-biofouling assemblages in the Mediterranean Sea, even after polarization is interrupted. At the same time, these substrates could be partially deteriorated by the burrowing action of marine organisms, especially if left in situ over the long term.
4. Conclusions
Field experiments of induced mineral deposition on steel by cathodic polarization in natural seawater are presented in this research paper, as a sustainable strategy for the reuse of marine steel structures at the end of their life. Experimentation was carried out at a depth of 20 m, inducing deposition on a steel structure prototype (electrified, E) using a power supply set at 2.5 V. Another identical steel structure prototype was placed at the same site and left under free corrosion (not electrified, NE), for comparison. Different round steel tubes/bars were installed in both prototypes and removed at fixed times to observe the growth of mineral (E) or rust (NE) deposits together with biofouling. After six months, the power supply to structure E was interrupted to investigate the capacity of the preformed deposit to protect the steel from corrosion (acting as an inorganic coating) and its effects on biofouling colonization dynamics. This specific investigation represents the novelty of this work in comparison to those previously published, and it was conducted through a multidisciplinary approach performing different analyses: the element, compound, and macro-biofouling compositions; morphology; thickness; and degree of protection of the mineral deposit.
The following conclusions can be drawn from the obtained results.
Whitish mineral deposits were observed on the E steel bars during 6 months of cathodic polarization, whereas red rust deposits were present on the NE steel bars. Biofouling settlements were found on both bar types. Under cathodic polarization, the thickness of the mineral deposit on the E bars increased to 2.5 mm. After the current was interrupted, the thickness remained approximately constant (actually, a slight increase was observed and attributed to biofouling settlements). On the NE bars, the deposit was highly irregular and consisted of a mixture of rust and biofouling: the thickness reached about 1.5 mm after 9 months of experimentation.
The surface impedance (and thus the degree of protection) of the mineral deposit formed on the E bars increased over time to 3 kΩ cm2, in line with an increase in thickness and a corresponding decrease in the cathodic current density, from 0.9 A m−2 to 0.2–0.4 A m−2. Conversely, after the cathodic polarization was interrupted, the impedance decreased to around 1.5 kΩ cm2. This suggests that natural seawater does not cause the generalized dissolution/degradation of the mineral deposit, which would reduce its thickness, but rather localized dissolution/degradation. This phenomenon was attributed to the formation of new porosities and/or capillary pathways in the mineral deposit due to the burrowing action of marine organisms, which colonize better in the absence of an electric field (polarization). These porosities and/or capillary pathways allow the electrolyte to reach the steel substrate and explain the decrease in the surface impedance of the deposit and thus its protective performance.
XRD and FTIR analyses and, indirectly, SEM-EDX observations showed that the mineral deposit mainly consists of a higher amount of aragonite than brucite during cathodic polarization: the aragonite–brucite mass ratio was 1.48 just before the interruption of the current and then decreased to 1 in the absence of polarization. These values demonstrate that the amount of aragonite decreased following the interruption of the current, which corresponded to a deterioration in the physical and mechanical properties of the mineral deposits, as well as their corrosion protection performance.
These findings clearly show that it is not possible to consider the reuse of marine steel structures without a sufficient cathodic current supply, even in the presence of a preformed mineral deposit acting as a protection coating. From a functional point of view, the continuous presence of a current supplied to the steel structures guarantees their cathodic protection and the replacement of the possibly deteriorated mineral deposit with a newly regenerated one. From an economic point of view, once the deposit is of a suitable amount and soundness, it acts as a coating and then allows a reduction in the current required to prevent the deterioration of steel structures (see the aforementioned decrease in current density). However, further investigations are necessary to make the deposition process induced by cathodic polarization more selective to increase the aragonite–brucite ratio and then produce a stronger and a more protective coating. In any case, the examined coating material and technology for reusing marine steel structures represent a sustainable strategy for avoiding expensive and less eco-friendly decommissioning options. Finally, mineral deposits, mimicking natural hard substrates, can provide an ideal substrate for the colonization and growth of benthic macrofauna organisms, thereby promoting biodiversity.
Author Contributions
T.B.: conceptualization, data curation, formal analysis, methodology, supervision, and writing—original draft. G.C.: investigation, methodology, data curation, and writing—original draft. P.C.: conceptualization, methodology, and writing—original draft. P.F., S.R., G.B., F.C., O.F., L.M., M.P., S.S. and F.V.: investigation, data curation, methodology, and writing—review and editing. N.S.: investigation, data curation, methodology, and writing—original draft. C.C.: conceptualization, formal Analysis, methodology, supervision, and writing—review and editing. D.V.: conceptualization, methodology, project administration, supervision, and writing—review and editing. A.D.: conceptualization, formal analysis, methodology, project administration, supervision, and writing—review and editing. All authors have read and agreed to the published version of the manuscript.
Funding
This study was carried out in the framework of the National Operational Programme for “Research and Innovation” 2014–2020—project PON ARS01_00891 titled PLaCE, co-funded by the European Union.
Institutional Review Board Statement
Not applicable.
Informed Consent Statement
Not applicable.
Data Availability Statement
Data are contained within the article.
Acknowledgments
The authors gratefully acknowledge the Italian Ministry of University and Research (MUR) for supporting this innovative research.
Conflicts of Interest
The authors declare no conflict of interest.
References
- Sedlar, D.K.; Vulin, D.; Krajačić, G.; Jukić, L. Offshore Gas Production Infrastructure Reutilisation for Blue Energy Production. Renew. Sustain. Energy Rev. 2019, 108, 159–174. [Google Scholar] [CrossRef]
- Auad, G.; Fath, B.D. Towards a Flourishing Blue Economy: Identifying Obstacles and Pathways for Its Sustainable Development. Curr. Res. Environ. Sustain. 2022, 4, 100193. [Google Scholar] [CrossRef]
- Zanuttigh, B.; Dallavalle, E.; Zagonari, F. A Novel Framework for Sustainable Decision-Making on Reusing Oil & Gas Offshore Platforms with Application to the Adriatic Sea. Renew. Sustain. Energy Rev. 2025, 211, 115252. [Google Scholar] [CrossRef]
- Fowler, A.M.; Macreadie, P.I.; Jones, D.O.B.; Booth, D.J. A Multi-Criteria Decision Approach to Decommissioning of Offshore Oil and Gas Infrastructure. Ocean Coast. Manag. 2014, 87, 20–29. [Google Scholar] [CrossRef]
- Henrion, M.; Bernstein, B.; Swamy, S. A Multi-Attribute Decision Analysis for Decommissioning Offshore Oil and Gas Platforms. Integr. Environ. Assess. Manag. 2015, 11, 594–609. [Google Scholar] [CrossRef]
- Sommer, B.; Fowler, A.M.; Macreadie, P.I.; Palandro, D.A.; Aziz, A.C.; Booth, D.J. Decommissioning of Offshore Oil and Gas Structures—Environmental Opportunities and Challenges. Sci. Total Environ. 2019, 658, 973–981. [Google Scholar] [CrossRef]
- Sheehy, D.J.; Vik, S.F. Artificial Reefs-A Second Life for Offshore Platforms? Petro. Eng. Int. 1982, 54, 40–52. [Google Scholar]
- Kaiser, M.J. The Louisiana Artificial Reef Program. Mar. Policy 2006, 30, 605–623. [Google Scholar] [CrossRef]
- Seaman, W., Jr. (Ed.) Artificial Habitats for Marine and Freshwater Fisheries; Academic Press: Cambridge, MA, USA, 2013. [Google Scholar]
- van Elden, S.; Meeuwig, J.J.; Hobbs, R.J.; Hemmi, J.M. Offshore Oil and Gas Platforms as Novel Ecosystems: A Global Perspective. Front. Mar. Sci. 2019, 6, 548. [Google Scholar] [CrossRef]
- Bull, A.S.; Love, M.S. Worldwide Oil and Gas Platform Decommissioning: A Review of Practices and Reefing Options. Ocean Coast. Manag. 2019, 168, 274–306. [Google Scholar] [CrossRef]
- Hobbs, R.J.; Arico, S.; Aronson, J.; Baron, J.S.; Bridgewater, P.; Cramer, V.A.; Epstein, P.R.; Ewel, J.J.; Klink, C.A.; Lugo, A.E.; et al. Novel Ecosystems: Theoretical and Management Aspects of the New Ecological World Order. Glob. Ecol. Biogeogr. 2006, 15, 1–7. [Google Scholar] [CrossRef]
- Hobbs, R.J.; Higgs, E.; Hall, C.M.; Bridgewater, P.; Chapin, F.S.; Ellis, E.C.; Ewel, J.J.; Hallett, L.M.; Harris, J.; Hulvey, K.B.; et al. Managing the Whole Landscape: Historical, Hybrid, and Novel Ecosystems. Front. Ecol. Environ. 2014, 12, 557–564. [Google Scholar] [CrossRef]
- Margheritini, L.; Colaleo, G.; Contestabile, P.; Bjørgård, T.L.; Simonsen, M.E.; Lanfredi, C.; Dell’Anno, A.; Vicinanza, D. Development of an Eco-Sustainable Solution for the Second Life of Decommissioned Oil and Gas Platforms: The Mineral Accretion Technology. Sustainability 2020, 12, 3742. [Google Scholar] [CrossRef]
- Colaleo, G.; Contestabile, P.; Bellezze, T.; Margheritini, L.; Dell’Anno, A.; Vicinanza, D. Prototype Experiments of the Low Voltage Mineral Deposition Technology as Eco-Friendly Solution for Improving the Sustainability of Offshore Platforms at the End of Their Production Life. Environ. Technol. Innov. 2022, 27, 102412. [Google Scholar] [CrossRef]
- Lazzari, L.; Pedeferri, P. Cathodic Protection; Polipress: Milano, Italy, 2006. [Google Scholar]
- Carré, C.; Zanibellato, A.; Jeannin, M.; Sabot, R.; Gunkel-Grillon, P.; Serres, A. Electrochemical Calcareous Deposition in Seawater. A Review. Environ. Chem. Lett. 2020, 18, 1193–1208. [Google Scholar] [CrossRef]
- Goreau, T.J. Electrical Stimulation Greatly Increases Settlement, Growth, Survival, and Stress Resistance of Marine Organisms. Nat. Resour. 2014, 5, 527–537. [Google Scholar] [CrossRef]
- Innovative Methods of Marine Ecosystem Restoration; Goreau, T.J., Trench, R.K., Eds.; CRC Press: Boca Raton, FL, USA, 2012; p. 12. ISBN 9781466557741. [Google Scholar]
- Goreau, T.J.F. Coral Reef Electrotherapy: Field Observations. Front. Mar. Sci. 2022, 9, 805113. [Google Scholar] [CrossRef]
- Lees, E.W.; Tournassat, C.; Weber, A.Z.; Gilbert, P.U.P.A. ECoral: How Electrolysis Could Restore Seawater Conditions Ideal for Coral Reefs. J. Phys. Chem. Lett. 2024, 15, 12206–12211. [Google Scholar] [CrossRef]
- Rousseau, C. Étude Du Dépôt Calco-Magnésien Formé Sous Protection Cathodique: Influence Des Sédiments Marins En Eau de Mer Naturelle, Influence Des Argiles En Eau de Mer Artificielle, Impact Environnemental de l’utilisation d’anodes Sacrificielles. Ph.D. Thesis, Université de Caen, Caen, France, 2008. [Google Scholar]
- Robinson, A.J.; Ryan, E.A.; Wang, Q.; Greene, D.; Subban, C.V. Pulse Electrodeposition for Carbonate-Rich Deposits from Seawater. Sustainainability 2024, 16, 10776. [Google Scholar] [CrossRef]
- Colin, B.; Vincent, J.; Koziorowszki, L.; Frein, A.; Lanneluc, I.; Sabot, R.; Refait, P.; Sablé, S.; Jeannin, M. Calcareous Deposit Formation under Cathodic Polarization and Marine Biocalcifying Bacterial Activity. Bioelectrochemistry 2022, 148, 108271. [Google Scholar] [CrossRef]
- Krauss, C. Couches Polycristallines Orientées d’aragonite Biomimétique, Synthétisées Par Voie Électrochimique. Ph.D. Thesis, Université de Caen, Caen, France, 2009. [Google Scholar]
- PlaCe Project. Available online: https://bluegrowth-place.eu/ (accessed on 19 June 2025).
- Boudouresque, C. Méthodes d’étude Qualitative et Quantitative Du Benthos (En Particulier Du Phytobenthos). Tethys 1971, 3, 79–104. [Google Scholar]
- Orazem, M.E.; Tribollet, B. Electrochemical Impedance Spectroscopy; John Wiley and Sons: Hoboken, NJ, USA, 2017; ISBN 9781118527399. [Google Scholar]
- Orozco-Cruz, R.; Bohórquez-Rico, J.; Marin, D.; Almeraya-Calderón, F.; Espinoza-Vázquez, A.; Carmona-Hernández, A.; Galván-Martínez, R. Effect of Seawater PH Variation on the Growth of Calcareous Deposits and Its Effect on an Impressed Current Cathodic Protection System. J. Solid. State Electrochem. 2023, 27, 3003–3016. [Google Scholar] [CrossRef]
- Schuhmacher, H.; Schillak, L. Integrated Electrochemical and Biogenic Deposition of Hard Material—A Nature-like Colonization Substrate. Bull. Mar. Sci. 1994, 55, 672–679. [Google Scholar]
- Singh, K.S.; Sawant, S.G. Identification of CaCO3 Polymorphs of Shellfish by FTIR Spectroscopy and Evaluation of Metals Adsorption by Powdered Exoskeleton Shell. Indian. J. Geo-Mar. Sci. 2022, 51, 304–309. [Google Scholar] [CrossRef]
- Zhu, X.; Guo, X.; Smyth, J.R.; Ye, Y.; Wang, X.; Liu, D. High-Temperature Vibrational Spectra Between Mg (OH)2 and Mg (OD)2: Anharmonic Contribution to Thermodynamics and D/H Fractionation for Brucite. J. Geophys. Res. Solid. Earth 2019, 124, 8267–8280. [Google Scholar] [CrossRef]
- Scarsini, M.; Thurotte, A.; Veidl, B.; Amiard, F.; Niepceron, F.; Badawi, M.; Lagarde, F.; Schoefs, B.; Marchand, J. Metabolite Quantification by Fourier Transform Infrared Spectroscopy in Diatoms: Proof of Concept on Phaeodactylum Tricornutum. Front. Plant Sci. 2021, 12, 756421. [Google Scholar] [CrossRef]
- Relini, G.; Montanari, M.; Moschella, P.; Siccardi, A. Macrofouling of an Oceanographic Buoy in the Ligurian Sea (Western Mediterranean). In Proceedings of the 10th International Congress on Marine Corrosion and Fouling-Additional Papers, Melbourne, Australia, 1 February 1999. [Google Scholar]
- Enrichetti, F.; Bavestrello, G.; Betti, F.; Rindi, F.; Tregrosso, A.; Bo, M. Fate of Lost Fishing Gears: Experimental Evidence of Biofouling Colonization Patterns from the Northwestern Mediterranean Sea. Environ. Pollut. 2021, 268, 115746. [Google Scholar] [CrossRef]
- Pulido Mantas, T.; Pola, L.; Cerrano, C.; Gambi, M.C.; Calcinai, B. Bioerosion Features of Boring Polydorid Polychaetes in the North Adriatic Sea. Hydrobiologia 2022, 849, 1969–1980. [Google Scholar] [CrossRef]
- Essock-Burns, T.; Gohad, N.V.; Orihuela, B.; Mount, A.S.; Spillmann, C.M.; Wahl, K.J.; Rittschof, D. Barnacle Biology before, during and after Settlement and Metamorphosis: A Study of the Interface. J. Exp. Biol. 2017, 220, 194–207. [Google Scholar] [CrossRef]
- Pica, D.; Tribollet, A.; Golubic, S.; Bo, M.; Di Camillo, C.G.; Bavestrello, G.; Puce, S. Microboring Organisms in Living Stylasterid Corals (Cnidaria, Hydrozoa). Mar. Biol. Res. 2016, 12, 573–582. [Google Scholar] [CrossRef]
Disclaimer/Publisher’s Note: The statements, opinions and data contained in all publications are solely those of the individual author(s) and contributor(s) and not of MDPI and/or the editor(s). MDPI and/or the editor(s) disclaim responsibility for any injury to people or property resulting from any ideas, methods, instructions or products referred to in the content. |
© 2025 by the authors. Licensee MDPI, Basel, Switzerland. This article is an open access article distributed under the terms and conditions of the Creative Commons Attribution (CC BY) license (https://creativecommons.org/licenses/by/4.0/).