
Vision and Reality: An Assessment of Saudi Arabia’s In-Country Capacity to Deliver on Its Solar Ambitions


Abstract
1. Introduction
- (i)
- To install 40 GW of PV capacity by 2030;
- (ii)
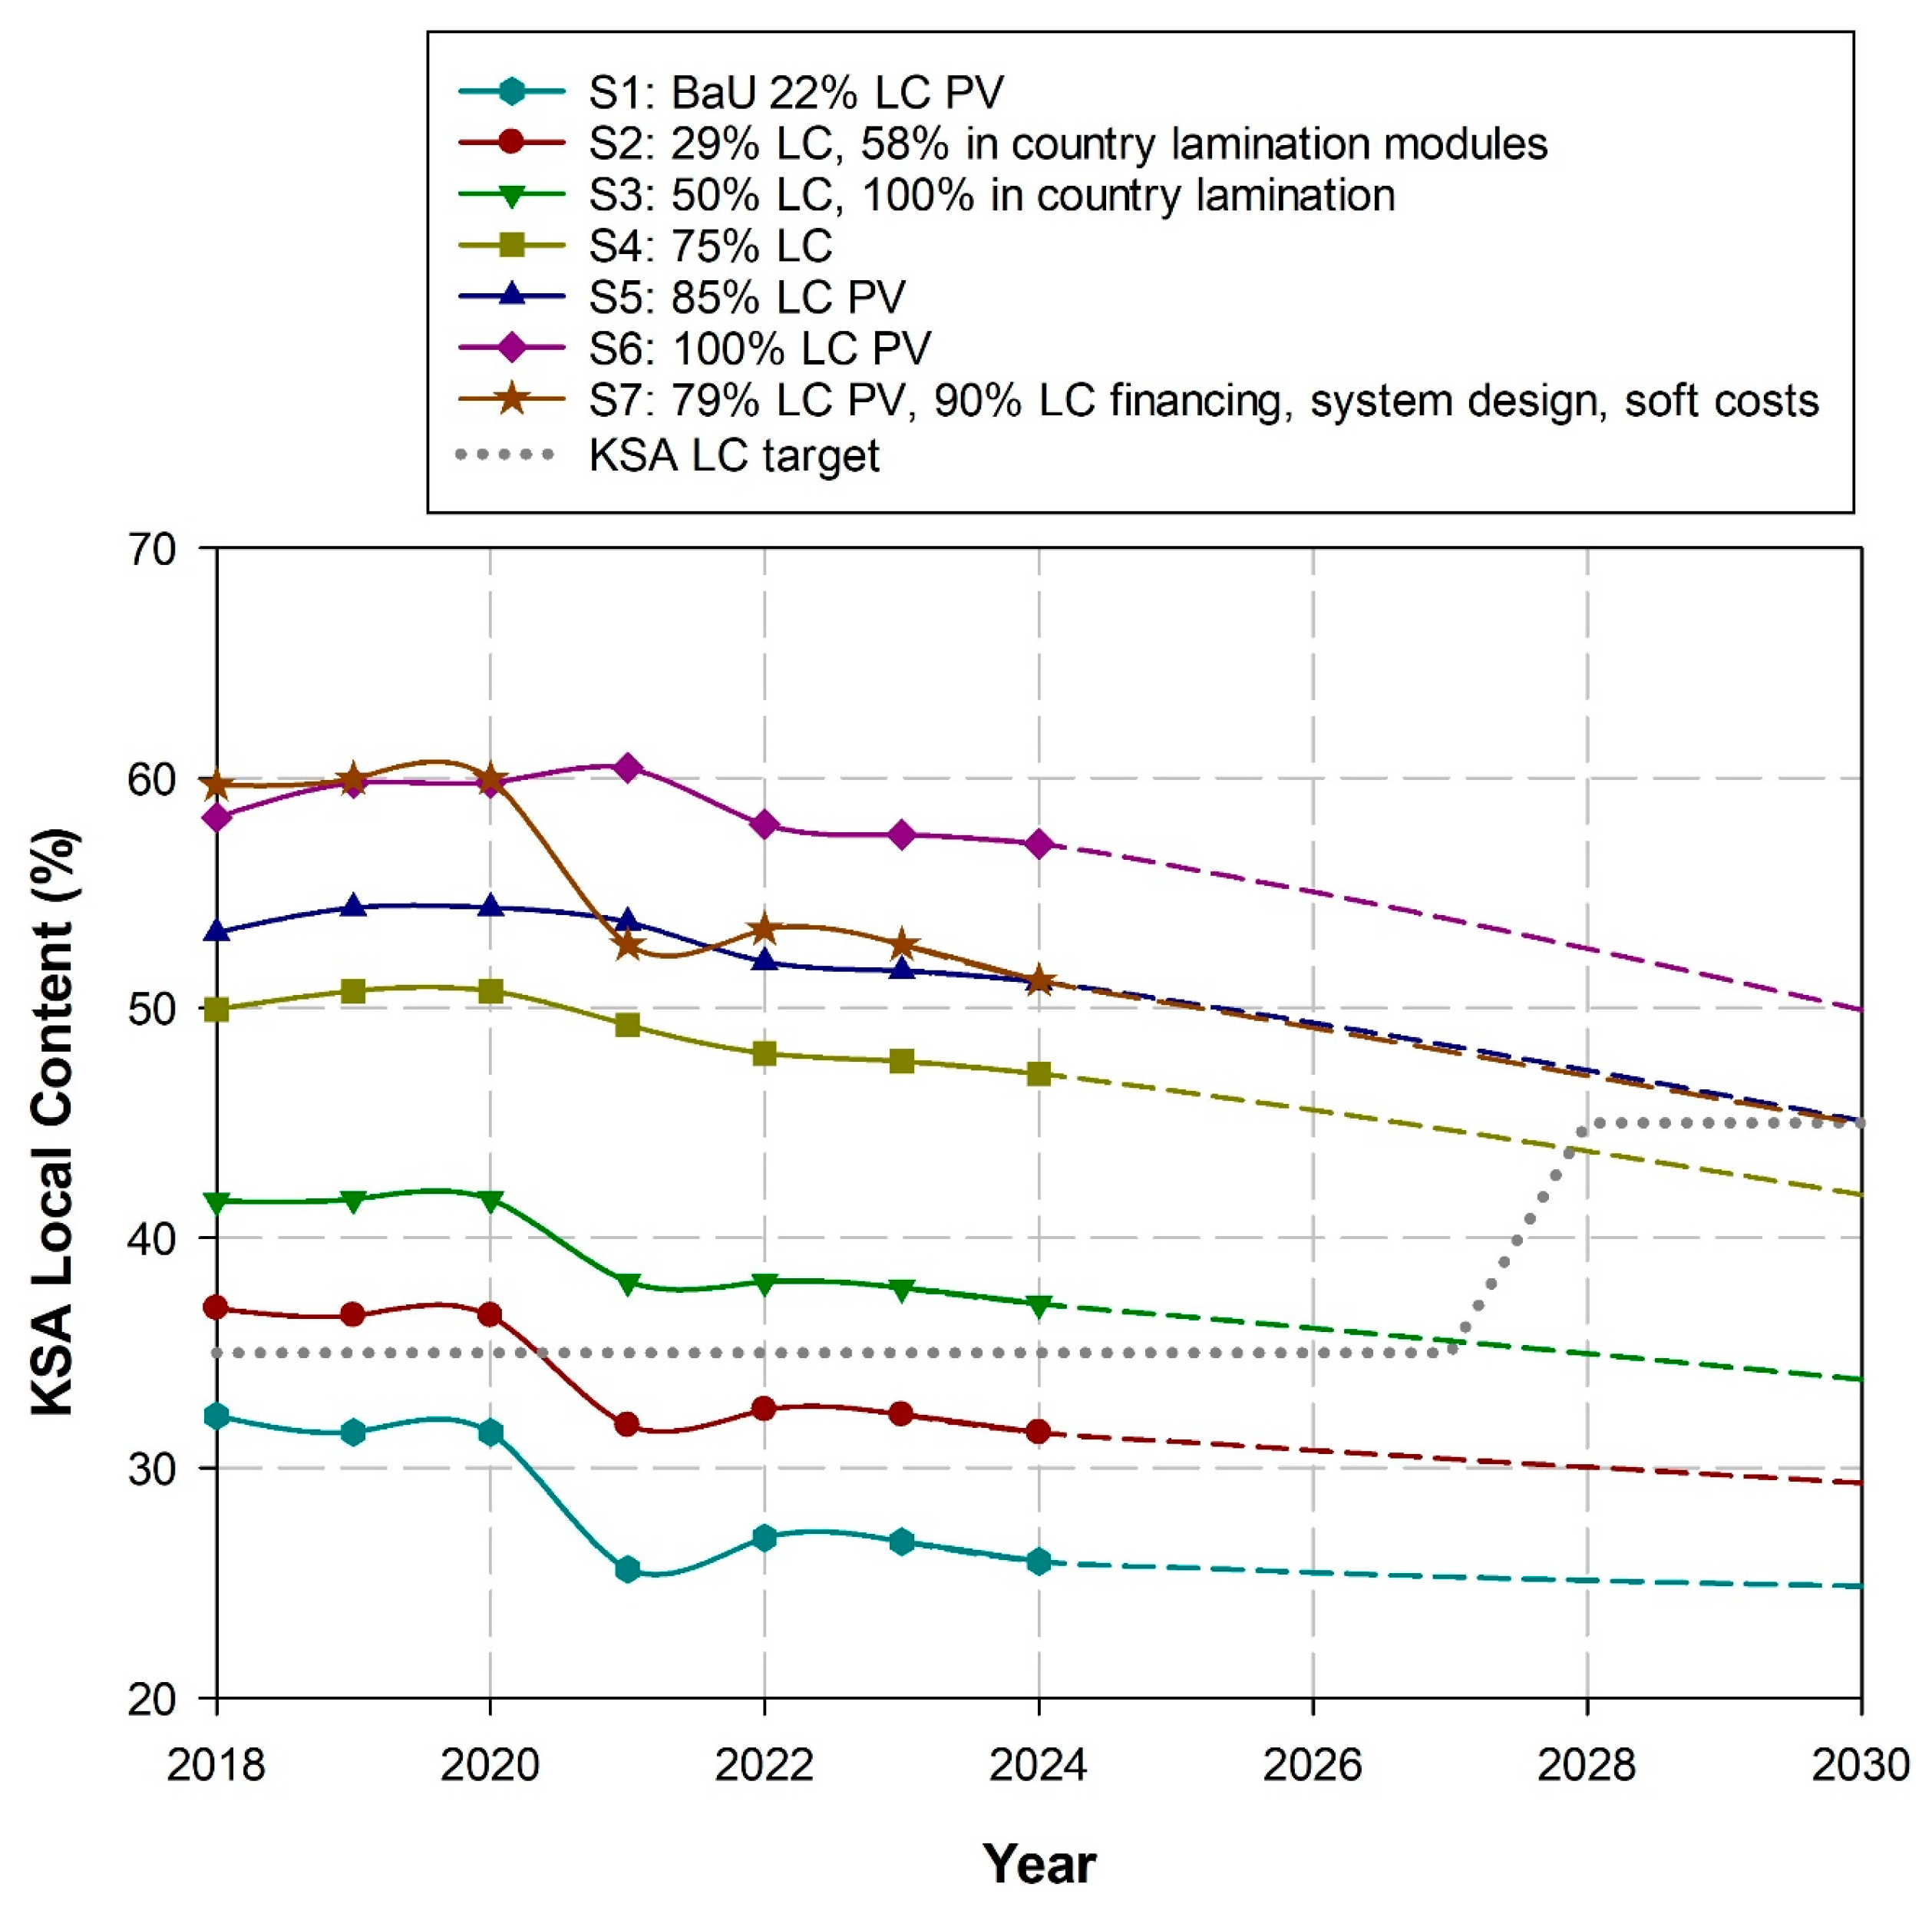
- To install PV systems with a minimum local content level of 45% post 2028 [9].
2. Materials and Methods
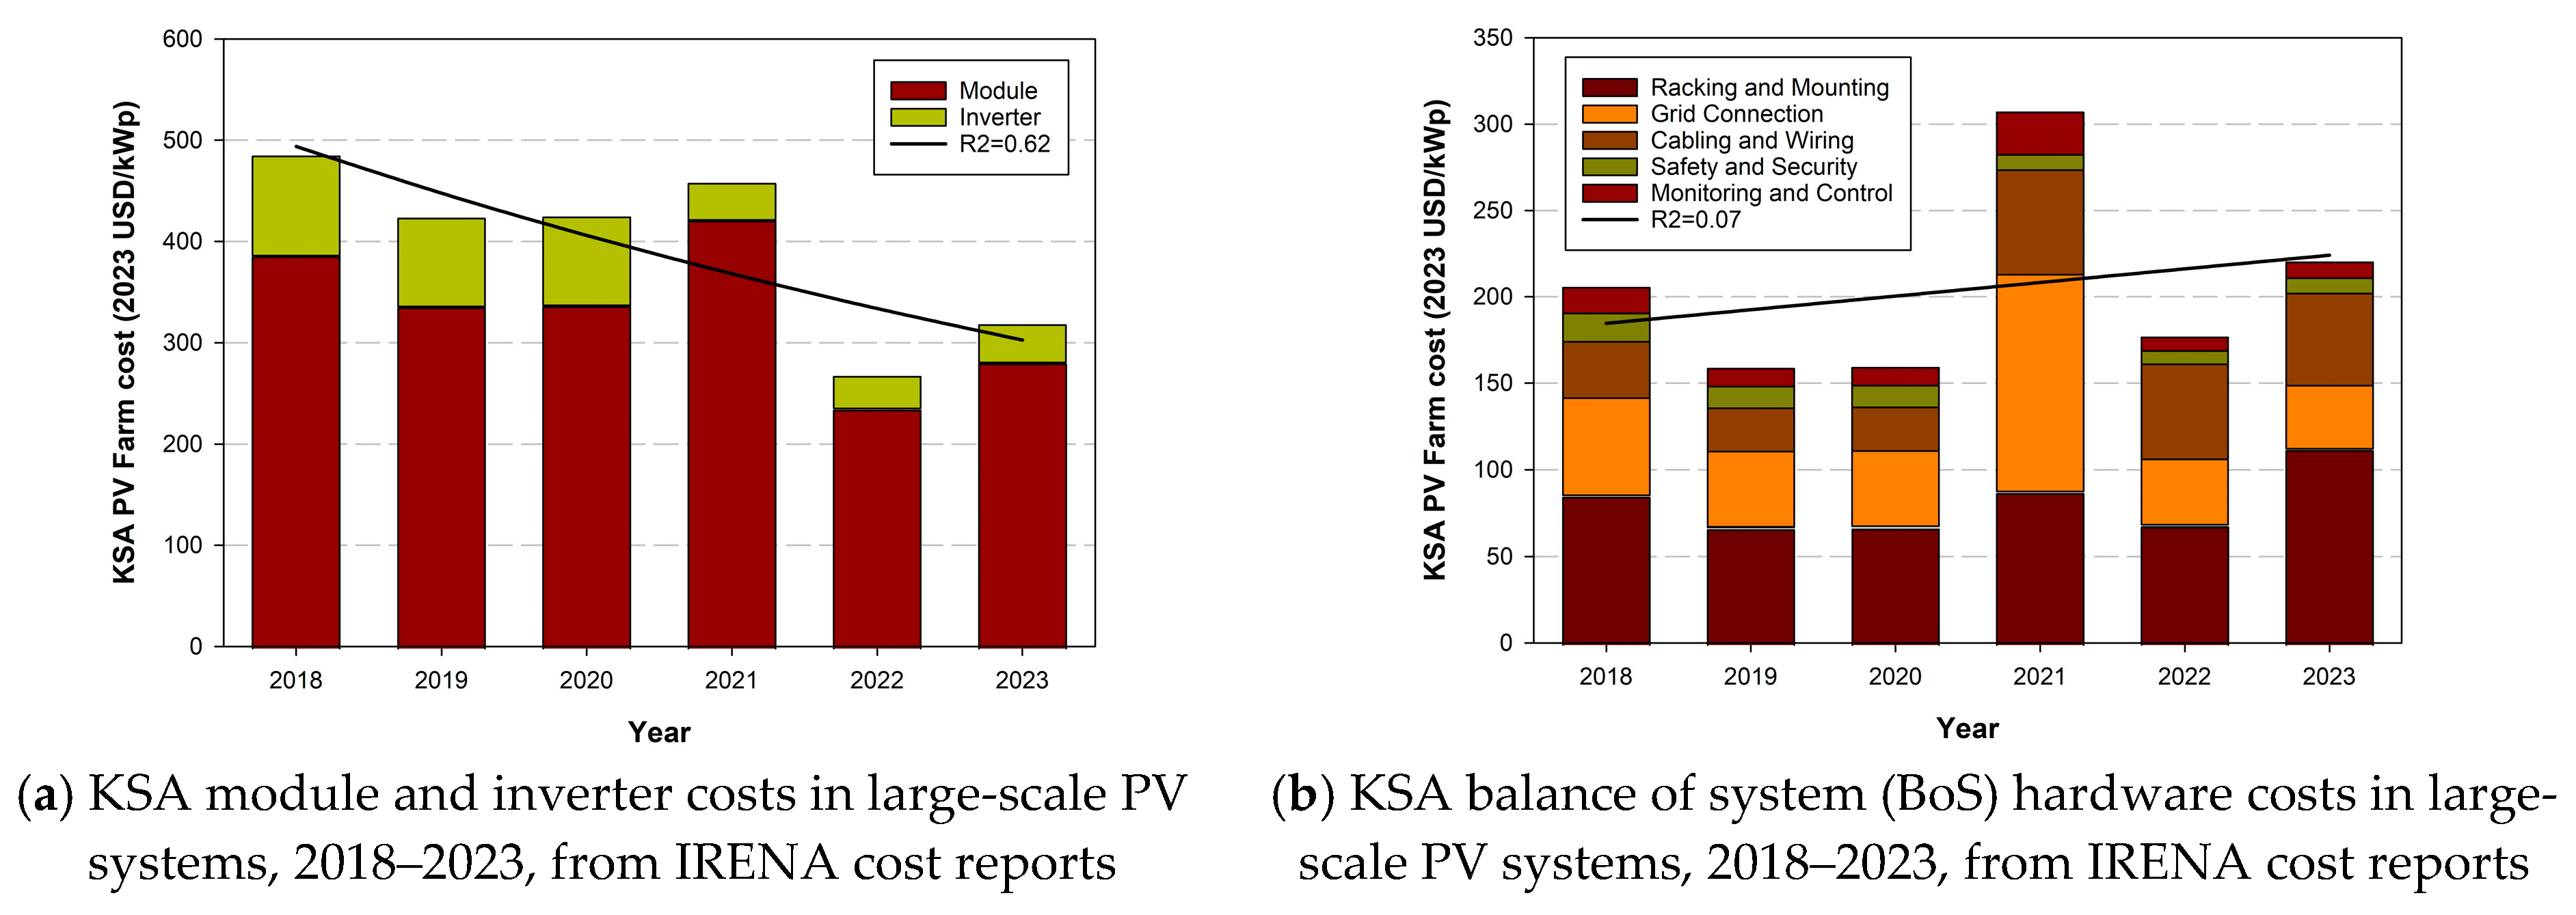
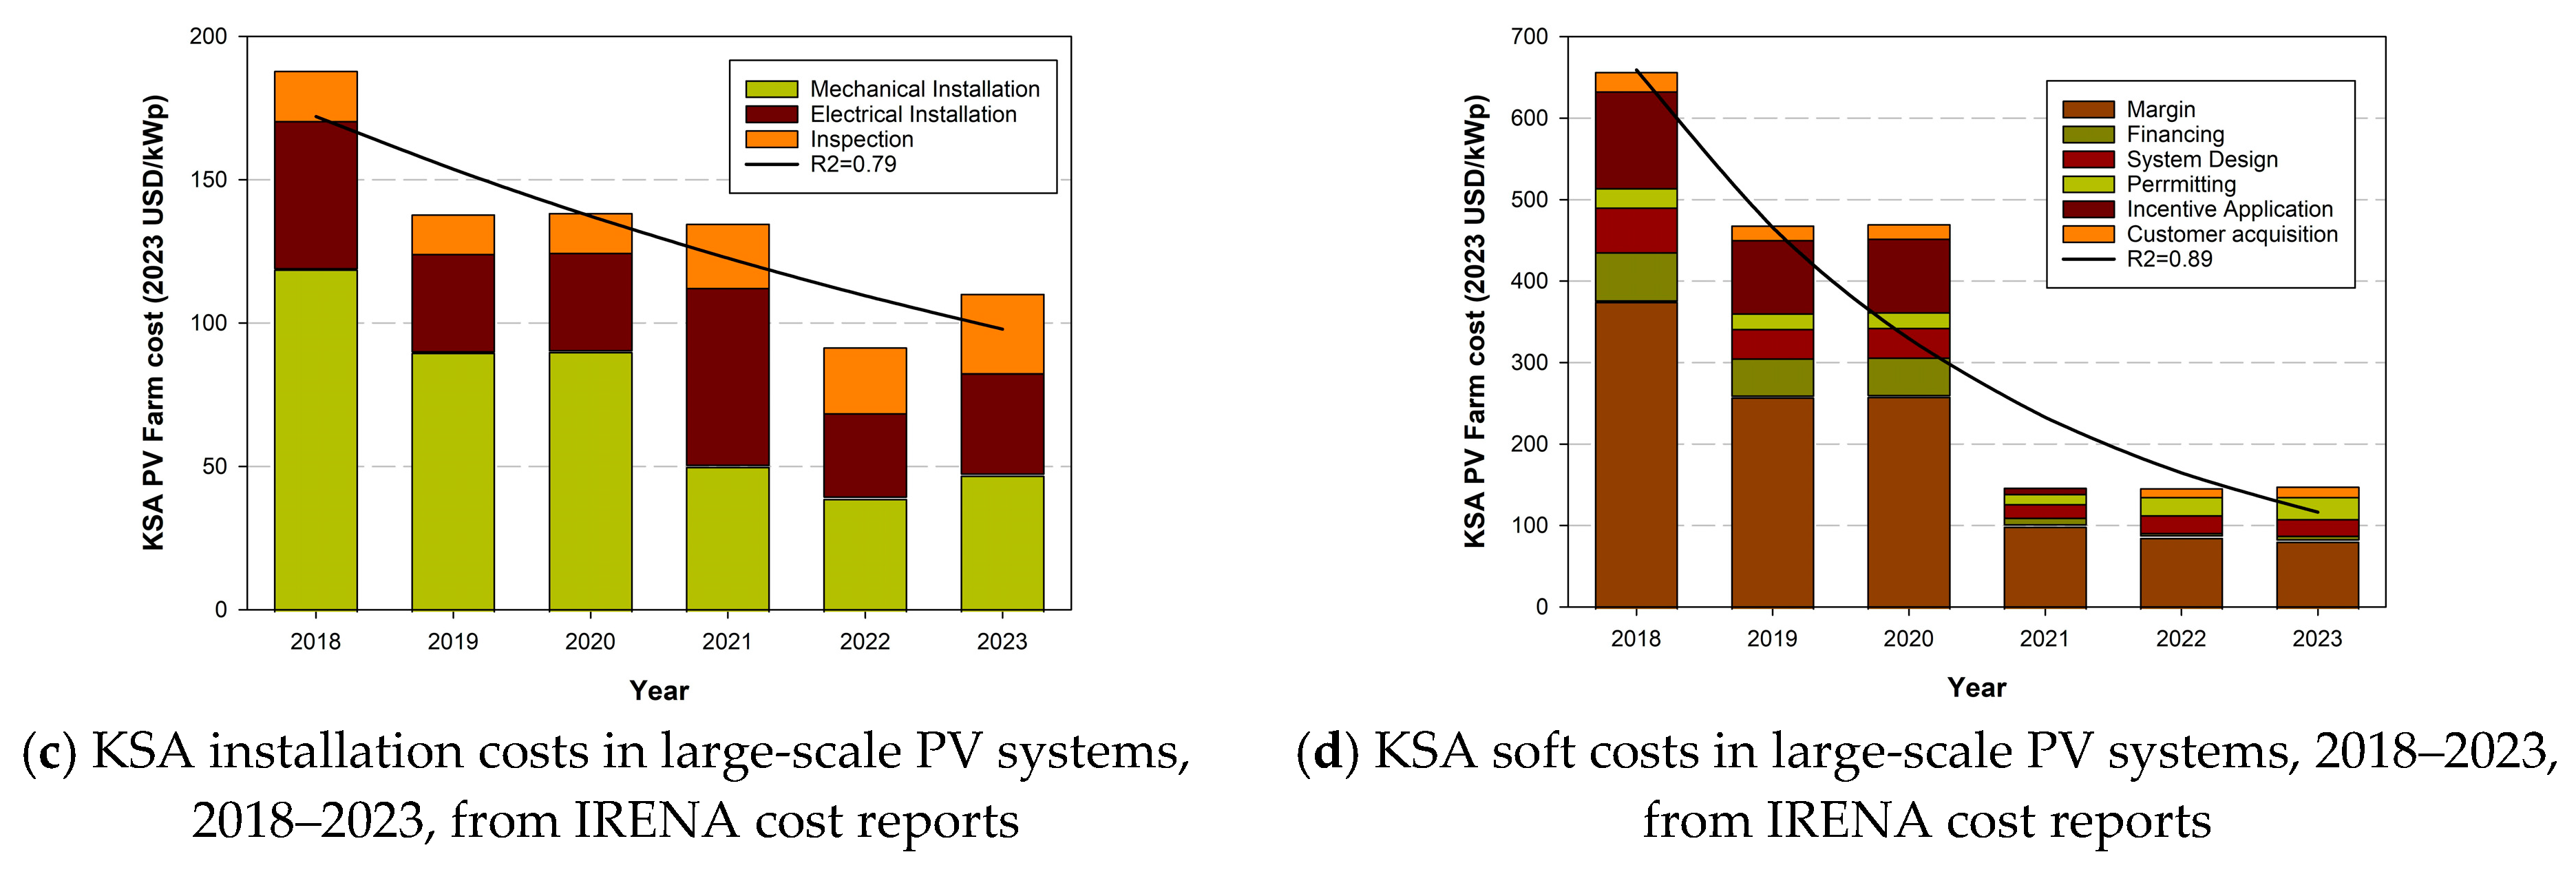
2.1. PV System Component Cost Projections
- modules and inverters: (1) module (2) inverter.
- BoS hardware: (3) racking and mounting, (4) grid connection, (5) cabling and wiring, (6) safety and security, (7) monitoring and control.
- installation: (8) mechanical installation, (9) electrical installation, (10) inspection.
- soft costs: (11) margin, (12) financing costs, (13) system design, (14) permitting, (15) incentive application, (16) customer acquisition.
2.2. Local Content Assessment
2.3. Domestic Capacity to Supply PV System Components
3. Results
- (i)
- The presence of strong government support to encourage acceleration of investment in the country in PV at a point in market development where it was less consolidated;
- (ii)
- The possibility that the tapering of incentives did not keep pace with the global reduction in the cost of PV during this period;
- (iii)
- The initialization of localization of the KSA PV supply chain reducing costs.
- S1: BaU assuming PV modules and inverters at 22% LC level from LCGPA.
- S2: 58% in-country lamination capacity, 2 new plants, equivalent to 29% LC level.
- S3: 100% in-country lamination capacity, equivalent to 50% LC level.
- S4: 75% local content for PV modules (cell manufacture and module lamination).
- S5: 85% local content for PV modules (cell manufacture and module lamination).
- S6: 100% local content for PV modules (cell manufacture and module lamination).
- S7: 79% local content for PV modules (cell manufacture and module lamination), 90% LC for financing, system design, soft costs.
4. Discussion
5. Conclusions
Author Contributions
Funding
Institutional Review Board Statement
Informed Consent Statement
Data Availability Statement
Conflicts of Interest
Abbreviations
| BoS | Balance of System |
| GDP | Gross Domestic Product |
| IRENA | International Renewable Energy Agency |
| KSA | Kingdom Saudi Arabia |
| LC | Local Content |
| LCGPA | Local Content and Government Procurement Authority |
| LCOE | Levelized Cost of Energy |
| NIDLP | National Industrial Development and Logistics Program |
| NTLS | National Transport and Logistics Strategy |
| PIF | Public Investment Fund |
References
- IEA. Saudi Arabia Electricity. Available online: https://www.iea.org/countries/saudi-arabia/electricity (accessed on 7 May 2025).
- Alshehri, A.; James, P.; Bahaj, A. Pathways to the Large-Scale Adoption of Residential Photovoltaics in Saudi Arabia. Energies 2024, 17, 3180. [Google Scholar] [CrossRef]
- Country Analysis Brief: Saudi Arabia, October 2024, US Energy Information Administration. Available online: https://www.eia.gov/international/content/analysis/countries_long/Saudi_Arabia/pdf/Saudi-Arabia.pdf (accessed on 12 June 2025).
- Bahaj, A.S.; Mahdy, M.; Alghamdi, A.S.; Richards, D.J. New approach to determine the Importance Index for developing offshore wind energy potential sites: Supported by UK and Arabian Peninsula case studies. Renew. Energy 2020, 152, 441–457. [Google Scholar] [CrossRef]
- Yip, C.M.A.; Gunturu, U.B.G.; Stenchikov, G.L. Wind resource characterization in the Arabian Peninsula. Appl. Energy 2016, 164, 826–836. [Google Scholar] [CrossRef]
- Imam, A.A.; Abusorrah, A.; Marzband, M. Potentials and opportunities of solar PV and wind energy sources in Saudi Arabia: Land suitability, techno-socio-economic feasibility, and future variability. Results Eng. 2024, 21, 101785. [Google Scholar] [CrossRef]
- Global Solar Atlas, Saudi Arabia. Available online: https://globalsolaratlas.info/download/saudi-arabia (accessed on 7 May 2025).
- Statista, Share of GDP Attributed to Oil and Gas Production in Select Countries Worldwide in 2023. Available online: https://www.statista.com/statistics/1451878/share-gdp-oil-and-gas-production-select-countries-globally (accessed on 7 May 2025).
- Renewable Energy Project Development Office REPDO, 2020, Saudi Arabia National Renewable Energy Program. Available online: https://www.ief.org/_resources/files/events/1st-ief-irena-seminar-on-renewable-and-clean-energy-technology-outlooks/faisal-al-yemni.pdf (accessed on 23 May 2025).
- SolarPower Europe (2025): Global Market Outlook for Solar Power 2025–2029. Available online: https://api.solarpowereurope.org/uploads/Global_Market_Outlook_2025_v1_aaebd9698b.pdf?updated_at=2025-05-05T08:46:30.243Z (accessed on 12 June 2025).
- Alghamdi, N.; Bahaj, A.S.; James, P. Supply Chain Readiness for Solar PV Expansion in Saudi Arabia. Energies 2022, 15, 7479. [Google Scholar] [CrossRef]
- Ali, A. Transforming Saudi Arabia’s Energy Landscape towards a Sustainable Future: Progress of Solar Photovoltaic Energy Deployment. Sustainability 2023, 15, 8420. [Google Scholar] [CrossRef]
- International Energy Agency, 2025, Renewable Energy Statistics 2025. Available online: https://www.irena.org/-/media/Files/IRENA/Agency/Publication/2025/Mar/IRENA_DAT_RE_Capacity_Statistics_2025.pdf (accessed on 23 May 2025).
- AR Raas 2 Solar PV Independent Power Plant, 2025, ACWA POWER|AR RAAS 2 SOLAR PV INDEPENDENT POWER PLANT. Available online: https://acwapower.com/en/projects/ar-rass-pv-ipp/ (accessed on 23 May 2025).
- Al Sadawi. Masdar. 2025. Available online: https://masdar.ae/en/renewables/our-projects/al-sadawi (accessed on 23 May 2025).
- Blackridge Research Consulting. Saudi Arabia Announces Multi-Billion Dollar Greenfield Solar Projects. 2025. Available online: https://www.blackridgeresearch.com/blog/latest-list-top-upcoming-solar-photovoltaic-pv-power-projects-plants-farms-saudi-arabia-ksa-middle-east-gcc (accessed on 23 May 2025).
- PIF. Public Investment Fund of Saudi Arabia. Available online: https://www.pif.gov.sa/en/ (accessed on 7 May 2025).
- IRENA. Renewable Power Generation Costs in 2023; International Renewable Energy Agency: Abu Dhabi, United Arab Emirates, 2024; Available online: https://www.irena.org/Publications/2024/Sep/Renewable-Power-Generation-Costs-in-2023 (accessed on 23 May 2025).
- Statista, Distribution of Solar Photovoltaic Module Production Worldwide in 2023, by Country. Available online: https://www.statista.com/statistics/668749/regional-distribution-of-solar-pv-module-manufacturing/ (accessed on 12 June 2025).
- World Bank, Saudi Arabia. Available online: https://data.worldbank.org/country/saudi-arabia (accessed on 7 May 2025).
- General Authority of Statistics, Gross Domestic Product Fourth Quarter of 2024. Available online: https://www.stats.gov.sa/documents/20117/2066979/GDP+FQ42024E_0+%281%29.pdf/b767f333-85d1-a16a-e5a4-6aac503a2666?t=1738212700643%20target=_blank%20rel=noopener (accessed on 12 June 2025).
- Hayat, M.A.; Hasan, S.; Elshurafa, A. Strategic Priorities and Cost Considerations for Decarbonizing Electricity Generation Using CCS and Nuclear Energy, KAPSARC, August 2024. Available online: https://www.kapsarc.org/wp-content/uploads/2024/08/KS-2024-DP27-Strategic-Priorities-and-Cost-Considerations-for-Decarbonizing-Electricity-Generation-Using-CCS-and-Nuclear-Energy-2.pdf (accessed on 12 June 2025).
- Saudi Arabia Signs $9.3 bn of Power Deals. 2024. Available online: https://www.meed.com/saudi-arabia-signs-93bn-power-deals (accessed on 12 June 2025).
- IRENA, 2016, The Power to Change: Solar and Wind Cost Reduction Potential to 2025. Available online: https://www.actu-environnement.com/media/pdf/news-26996-irena-cout.pdf (accessed on 23 May 2025).
- Local Content and Governmental Procurement Authority LCGPA, 2024, Local Content Score Template. Available online: https://lcgpa.gov.sa/en/LocalContent/Documents/Local%20Content%20Score%20Template%20(Baseline)_V7%20HS%20-%2021%20Mar.xlsx (accessed on 23 May 2025).
- Statista, Solar Energy, Saudi Arabia. Available online: https://www.statista.com/outlook/io/energy/renewable-energy/solar-energy/saudi-arabia?currency=USD (accessed on 7 May 2025).
- Photovoltaic Geographical Information System, PV-GIS. Available online: https://re.jrc.ec.europa.eu/pvg_tools/en/ (accessed on 7 May 2025).
- Soummane, S.; Ghersi, F. Projecting Saudi Sectoral Electricity Demand in 2030, King Abdullah Petroleum Studies and Research Center (“KAPSARC”). 2021. Available online: https://www.kapsarc.org/wp-content/uploads/2021/09/KS-2021-DP12-Projecting-Saudi-Sectoral-Electricity-Demand-in-2030-Using-a-Computable-General-Equilibrium-Model.pdf (accessed on 7 May 2025).
- IRENA. Renewable Power Generation Costs in 2018; International Renewable Energy Agency: Abu Dhabi, United Arab Emirates, 2019; Available online: https://www.irena.org/publications/2019/May/Renewable-power-generation-costs-in-2018 (accessed on 7 May 2025).
- IRENA. Renewable Power Generation Costs in 2019; International Renewable Energy Agency: Abu Dhabi, United Arab Emirates, 2020; Available online: https://www.irena.org/publications/2020/Jun/Renewable-Power-Costs-in-2019 (accessed on 7 May 2025).
- IRENA. Renewable Power Generation Costs in 2020; International Renewable Energy Agency: Abu Dhabi, United Arab Emirates, 2021; Available online: https://www.irena.org/publications/2021/Jun/Renewable-Power-Costs-in-2020 (accessed on 7 May 2025).
- IRENA. Renewable Power Generation Costs in 2021; International Renewable Energy Agency: Abu Dhabi, United Arab Emirates, 2022. [Google Scholar]
- IRENA. Renewable Power Generation Costs in 2022; International Renewable Energy Agency: Abu Dhabi, United Arab Emirates, 2023. [Google Scholar]
- Dehghanimadvar, M.; Egan, R.; Chang, N.L. Economic assessment of local solar module assembly in a global market. Cell Rep. Phys. Sci. 2022, 3, 100747. [Google Scholar] [CrossRef]
- IRENA. Renewable Energy Benefits: Leveraging Local Capacity for Solar PV Executive Summary. 2017. Available online: https://cisp.cachefly.net/assets/articles/attachments/69589_irena_leveraging_for_solar_pv_2017_summary.pdf (accessed on 23 May 2025).
- IEA. Solar PV Global Supply Chains. Available online: https://www.iea.org/reports/solar-pv-global-supply-chains/executive-summary (accessed on 7 May 2025).
- Glass International (2018) Raw Materials MENA’s Raw Materials Supply—Glass International, MENA’s Raw Materials Supply. Available online: https://www.glass-international.com/content-images/news/raw_materials.pdf (accessed on 12 September 2023).
- Statista, Production of Crude Steel in Saudi Arabia from 2014 to 2022. Available online: https://www.statista.com/statistics/718271/saudi-arabia-crude-steel-production/ (accessed on 23 May 2025).
- Statista, Cement Production in Saudi Arabia from 2013 to 2021. Available online: https://www.statista.com/statistics/507219/saudi-arabia-production-of-cement/ (accessed on 23 May 2025).
- Marshalls, How to Mix Cement to Make Cement Mortar or Concrete. Available online: https://www.marshalls.co.uk/gardens-and-driveways/blog/how-to-mix-cement-to-make-mortar-or-concrete#:~:text=In%20terms%20of%20the%20ratio,parts%20aggregates%20can%20be%20used. (accessed on 23 May 2025).
- Statista. Annual Production Volume of Aluminum in Saudi Arabia from 2013 to 2020. Available online: https://www.statista.com/statistics/1037396/saudi-arabia-aluminum-production/ (accessed on 23 May 2025).
- Statista. Annual Production Volume of Silica Sand in Saudi Arabia from 2010 to 2018. Available online: https://www.statista.com/statistics/760196/saudi-arabia-silica-sand-production/ (accessed on 23 May 2025).
- Nash, J.A.; Alyahyai, A.A.; Koyame-Marsh, R.O. Silicon in Saudi Arabia and its potential impact on the Saudi economy. Int. J. Min. Miner. Eng. 2017, 8, 144–155. [Google Scholar] [CrossRef]
- Statista. Annual Copper Production in Saudi Arabia from 2011 to 2020. Available online: https://www.statista.com/statistics/709543/saudi-arabia-annual-copper-production/ (accessed on 23 May 2025).
- NEOP. Saudi Arabia is the Eighth in the World in Plastic Production; NEOP: Bhandup, Mumbai, 2020. [Google Scholar]
- Mississippi Silicon. Our Process. Available online: https://www.missilicon.com/process (accessed on 23 May 2025).
- NIDLP. National Industrial Development and Logistics Program Delivery Plan 2021–2025. 2021. Available online: https://www.vision2030.gov.sa/media/bsan2azp/2021-2025-national-industrial-development-and-logistics-program-delivery-plan-en.pdf (accessed on 11 June 2025).
- SIDF. Integrated Growth: Industry, Energy, Mining & Logistic. 2023. Available online: https://www.thebci.org/news/strengthening-supply-chain-resilience-in-saudi-arabia-strategies-for-a-sustainable-future.html (accessed on 11 June 2025).
- Alnemeiri, K.A.; Gómez, G.I.; DeLlano-Paz, F. Measuring the impacts of Saudi Arabia’s energy diversification strategy: A review. Energy Strategy Rev. 2025, 59, 101731. [Google Scholar] [CrossRef]
- Wiser, R.; Bolinger, M.; Seel, J. Benchmarking Utility-Scale PV Operational Expenses and Project Lifetimes: Results from a Survey of U.S. Solar Industry Professionals; LBL Publications: Berkeley, CA, USA, 2020. Available online: https://www.osti.gov/servlets/purl/1631678/ (accessed on 11 June 2025).
- Deline, C.; Jordan, D.; Sekulic, B.; Parker, J.; McDanold, B.; Anderberg, A. PV Lifetime Project—2024 NREL Annual Report, 2024, Golden Colorado: National Renewable Energy Laboratory, NREL/TP-5K00-90651. Available online: https://www.nrel.gov/docs/fy24osti/90651.pdf (accessed on 11 June 2025).
- Mirletz, H.; Ovaitt, S.; Sridhar, S.; Barnes, T.M. Circular economy priorities for photovoltaics in the energy transition. PLoS ONE 2022, 17, e0274351. [Google Scholar] [CrossRef] [PubMed]
- Islam, M.T.; Ali, A.; Qadir, S.A.; Shahid, M.; AlZahrani, A. Reverse logistics network design for waste solar PV panels in Saudi Arabia. Transp. Res. Procedia 2025, 84, 315–322. [Google Scholar] [CrossRef]
- Solangi, Y.A.; Alyamani, R.; Almakhles, D. Evaluating challenges and policy innovations for renewable energy development in a circular economy: A path to environmental resilience in Saudi Arabia. J. Environ. Manag. 2025, 375, 124124. [Google Scholar] [CrossRef] [PubMed]
- Alyousif, M.; Belaid, F.; Almubarak, N.; Almulhim, T. Mapping Saudi Arabia’s low emissions transition path by 2060: An input-output analysis. Technol. Forecast. Soc. Change 2025, 211, 123920. [Google Scholar] [CrossRef]
- Islam, M.T.; Ali, A. Sustainable green energy transition in Saudi Arabia: Characterizing policy framework, interrelations and future research directions. Next Energy 2024, 5, 100161. [Google Scholar] [CrossRef]
- Apeaning, R.; Kamboj, P.; Hejazi, M.; Qiu, Y.; Kyle, P.; Iyer, G. Assessing the Impact of Energy Transition Initiatives on the Policy Cost of Saudi Arabia’s Net-Zero Ambition. Energy Clim. Change 2025, 6, 100184. [Google Scholar] [CrossRef]
- Giga-Projects, PIF. Available online: https://www.pif.gov.sa/en/our-investments/giga-projects/?gad_source=1&gad_campaignid=20449223941&gbraid=0AAAAABozKaQ6XvUQ3OWDtmgq5Shm4QDsL&gclid=Cj0KCQjw5ubABhDIARIsAHMighZj7tz2i0WdxpwOXmMz2JRFxTGDdN0i2i1YyzAXGGGdTR_3QvyB31MaArk0EALw_wcB (accessed on 23 May 2025).
- Bloomberg UK. Saudis Scale Back Ambition for $1.5 Trillion Desert Project. Available online: https://www.bloomberg.com/news/articles/2024-04-05/saudis-scale-back-ambition-for-1-5-trillion-desert-project-neom (accessed on 23 May 2025).


| Sector | Description | Local Content (%) |
|---|---|---|
| Labor | Saudi employees | 100 |
| costs | Foreign employees | 37 |
| Services | KSA industrial services (testing, certification …) | 30 |
| KSA local professional services (engineering consulting, accountancy) | 50 | |
| KSA local representative of foreign professional provider | 20 | |
| KSA construction, specialized construction activities for buildings and civil engineering works | 35 | |
| KSA finance and insurance | 75 | |
| KSA transport and logistics | 40 | |
| KSA cement and gypsum, locally produced cement, concrete and gypsum | 50 | |
| KSA steel rebar manufacturing | 60 | |
| KSA other manufacturing (includes PV modules and inverters) | 22 |
| Manufacturer | 2019 | 2022 | 2023 | 2024 | 2025 | Unspecified (S3 to S6) |
|---|---|---|---|---|---|---|
| Solar PV cell and module manufacturing plant (cells and modules) | 100 | 100 | 100 | 100 | 100 | |
| Masdar Solar Panel Factory “Masdar Solar” (module assembly) | 150 | 450 | 1200 | 1200 | ||
| Desert Technologies Industries (module assembly) | 110 | 100 | 300 | 300 | 3000 | |
| RELC, Jinko Solar and Vision Industries (cells and modules) | 10,000 | |||||
| RELC, LUMTECH holding and Vision Industries (ingot and wafers) | 20,000 | |||||
| Total | 210 | 350 | 850 | 1600 | 4300 | 30,000 |
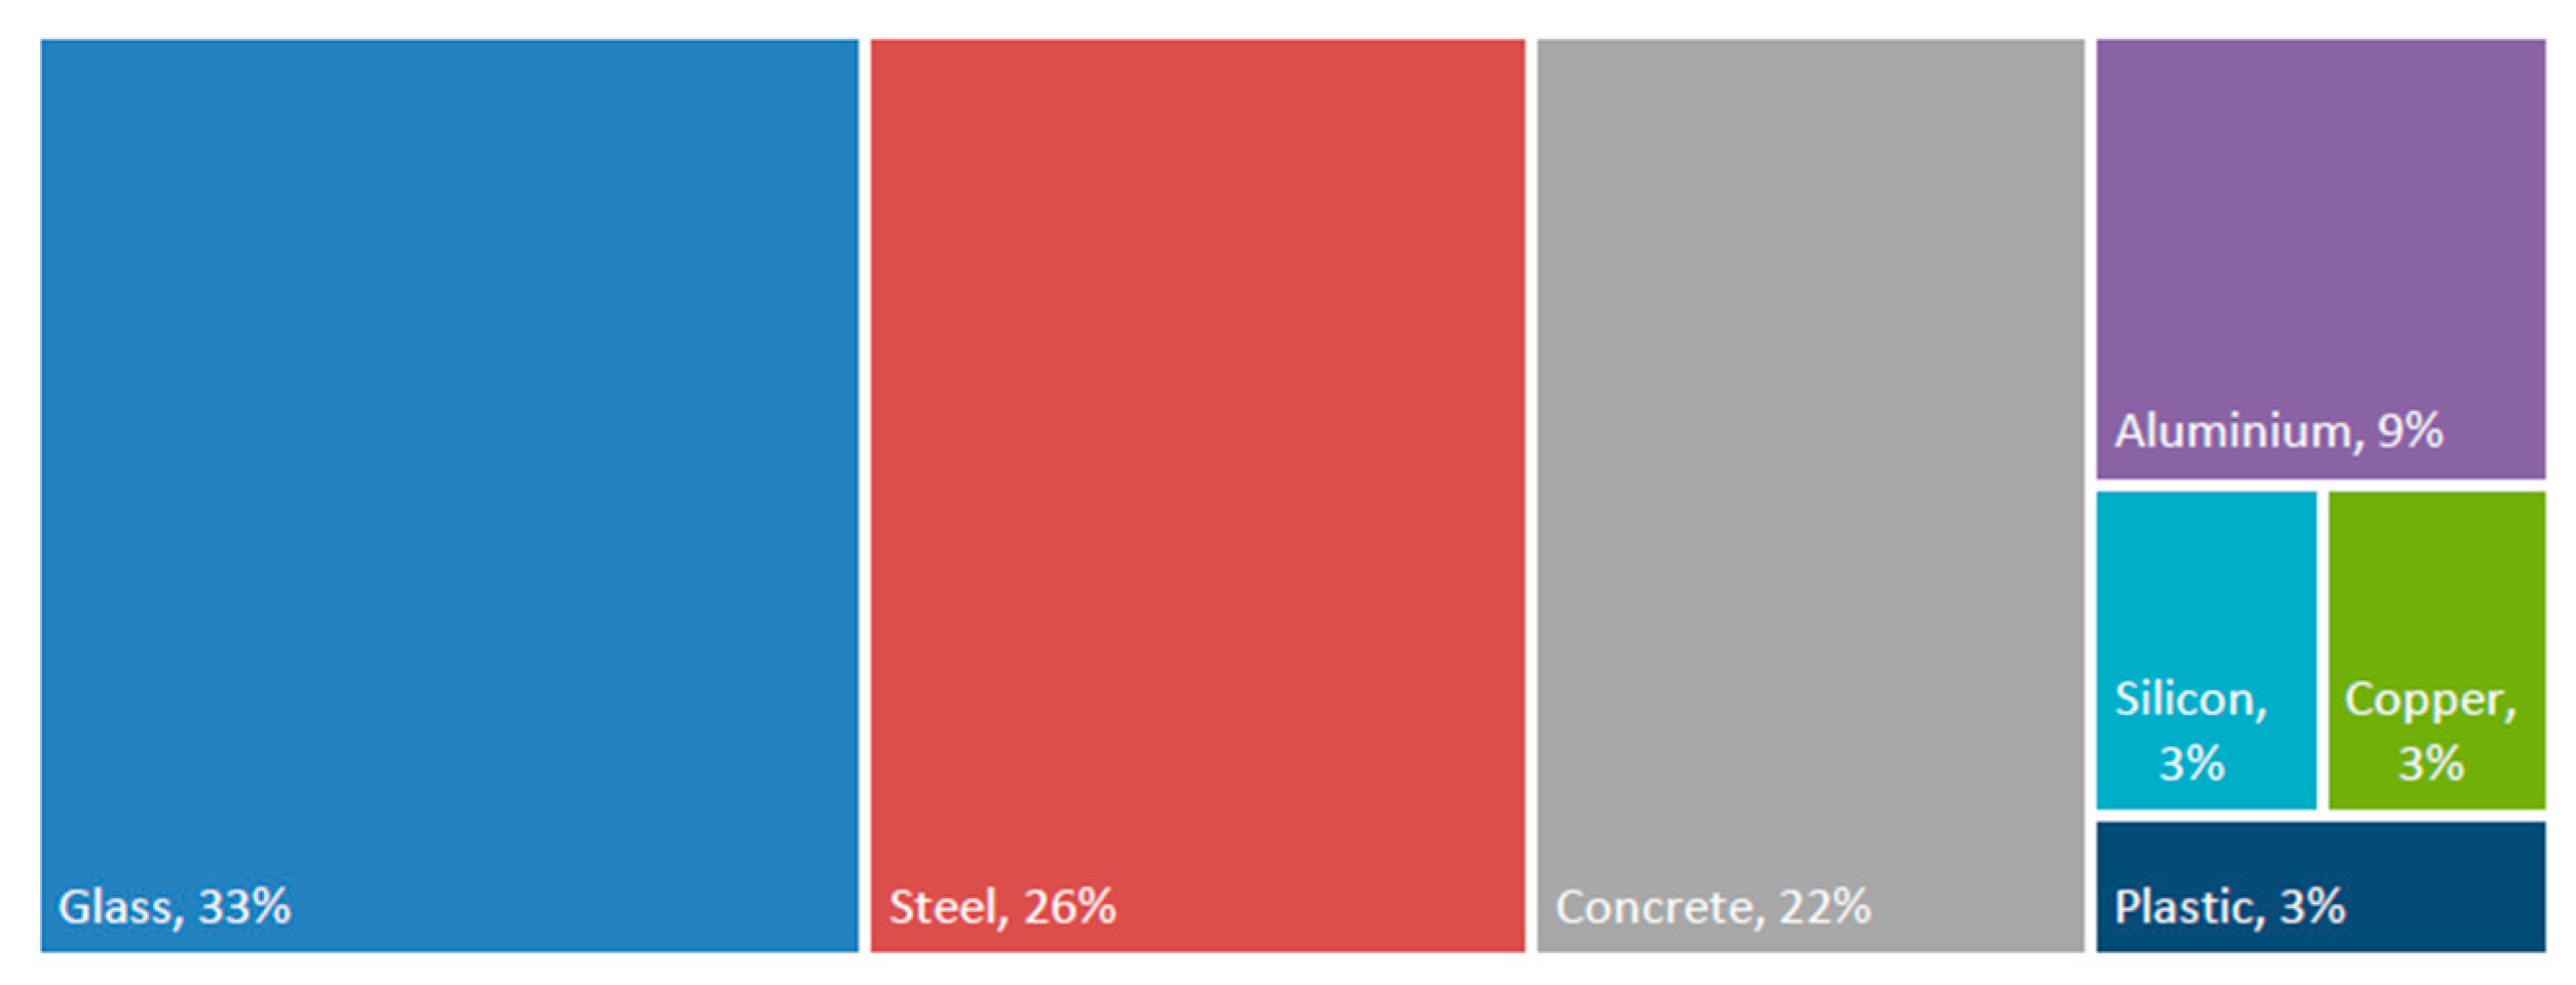
| Material | Percentage by Weight (%) | Weight for 40 GW PV (tonnes) | Yearly Demand (tonnes) | KSA in-Country Yearly Production (tonnes) | Production Year Data | % of Yearly Production |
|---|---|---|---|---|---|---|
| Glass | 33 | 2,800,000 | 467,000 | 803,000 | 2018 | 58 |
| Steel | 26 | 2,240,000 | 373,000 | 8,700,000 | 2021 | 4 |
| Concrete | 22 | 1,880,000 | 313,000 | 550,000 | 2021 | 57 |
| Aluminum | 9 | 760,000 | 127,000 | 999,000 | 2020 | 13 |
| Silicon | 3 | 280,000 | 47,000 | 593,000 | 2018 | 8 |
| Copper | 3 | 280,000 | 47,000 | 75,000 | 2020 | 62 |
| Plastic | 3 | 240,000 | 40,000 | 13,550,000 | 2016 | 0.3 |
| Total | 100 | 8,480,000 | 1,413,000 | 26,077,000 |
Disclaimer/Publisher’s Note: The statements, opinions and data contained in all publications are solely those of the individual author(s) and contributor(s) and not of MDPI and/or the editor(s). MDPI and/or the editor(s) disclaim responsibility for any injury to people or property resulting from any ideas, methods, instructions or products referred to in the content. |
© 2025 by the authors. Licensee MDPI, Basel, Switzerland. This article is an open access article distributed under the terms and conditions of the Creative Commons Attribution (CC BY) license (https://creativecommons.org/licenses/by/4.0/).
Share and Cite
Alghamdi, N.; James, P.; Bahaj, A. Vision and Reality: An Assessment of Saudi Arabia’s In-Country Capacity to Deliver on Its Solar Ambitions. Sustainability 2025, 17, 5721. https://doi.org/10.3390/su17135721
Alghamdi N, James P, Bahaj A. Vision and Reality: An Assessment of Saudi Arabia’s In-Country Capacity to Deliver on Its Solar Ambitions. Sustainability. 2025; 17(13):5721. https://doi.org/10.3390/su17135721
Chicago/Turabian StyleAlghamdi, Nasser, Patrick James, and AbuBakr Bahaj. 2025. "Vision and Reality: An Assessment of Saudi Arabia’s In-Country Capacity to Deliver on Its Solar Ambitions" Sustainability 17, no. 13: 5721. https://doi.org/10.3390/su17135721
APA StyleAlghamdi, N., James, P., & Bahaj, A. (2025). Vision and Reality: An Assessment of Saudi Arabia’s In-Country Capacity to Deliver on Its Solar Ambitions. Sustainability, 17(13), 5721. https://doi.org/10.3390/su17135721