1. Introduction
In global socio-economic activities, the construction industry represents the largest share of resource consumption and environmental burden [
1,
2]. According to the Global Status Report on Buildings and Construction (2022) [
3] issued by the Global Architecture Alliance, buildings accounted for 37% of global CO
2 emissions in 2021. In the context of the “two-carbon” strategy, energy conservation and carbon reduction in the building industry has become a critical strategic priority. Green building provides a solution to the challenge by promoting energy, water, land, and material conservation while enhancing environmental quality and human well-being [
4,
5,
6,
7]. As a subset of green building, green housing (GH) minimizes environmental impact and improves residential comfort, health, and sustainability [
8,
9,
10].
Despite policy attention and technological advance, the market penetration of GH remains limited [
11,
12,
13]. It is not only caused by technical problems or limited funding, but also by a deeper issue: the goals of governments, developers, and consumers are not well aligned. Governments aim to promote green housing to achieve both environmental and social benefits [
14]. However, developers hesitate due to the higher initial costs, uncertain profits, and potential involvement with stringent regulations [
15] Meanwhile, although many consumers express interest in environmentally friendly residences, their willingness to adopt GH may be constrained by higher purchase prices and a lack of awareness of the long-term benefits [
16]. They may prefer cheaper traditional residences over the green ones, even though the latter can save on long-term energy and resources.
Due to the differing objectives of governments, developers, and consumers, the green housing market frequently underperforms. While policies such as financial subsidies (FS), carbon taxes (CT), and carbon emissions trading (CET) have been implemented, their impacts are not evident. One reason for this is that policymakers lack a comprehensive understanding of how each stakeholder group will respond to the proposed policy. Despite the lack of direct interactions between developers and consumers, their decisions still exert a mutual influence on one another. For instance, government subsidies can influence developers’ decisions regarding the construction of GH, potentially leading to price fluctuations that affect consumer purchasing decisions. These indirect effects are neglected in traditional research and policy formulation.
Existing literature on the GHM mainly focuses on the green building design and construction technology, energy efficiency and energy-saving innovation, policy and regulatory systems, market acceptance, economic feasibility analysis and cost-benefit assessment, market performance and asset value, environmental benefits, and social impact assessment [
10,
17,
18,
19,
20,
21]. Although these studies have provided important theoretical foundations and practical guidance for the industry’s development, there are still significant research gaps. Firstly, most existing literature adopts a static analysis framework, failing to fully capture the complex strategic interaction relationships among various stakeholders (i.e., government, developers, and consumers) in the GHM [
22]. Secondly, there is a lack of dynamic tracking of market stakeholders’ decision-making behavior evolution process, mainly ignoring the adaptive learning mechanism of strategy adjustment of each participant under the influence of exogenous variables such as changes in the policy environment, technological progress, and the improvement of market maturity. Evolutionary game theory provides a new analytical perspective to address these research gaps [
23]. It emphasizes that participants optimize their strategy choices through ongoing information exchange and experience learning [
24]. This dynamic analysis framework is particularly suitable for depicting the long-term evolutionary characteristics of multi-agent participation in the GHM.
Compared with previous studies that primarily use static models or focus on two-party interactions, this study introduces a tripartite evolutionary game model. This approach allows us to model how stakeholder behaviors evolve across different market stages under various low-carbon policy tools. It provides a dynamic framework for analyzing the development process of the GHM. The remainder of this study is organized as follows:
Section 2 is the literature review.
Section 3 describes the research methodology and constructs the evolutionary game model.
Section 4 shows the simulation results for various stages.
Section 5 discusses the results, and this study is summarized in
Section 6.
2. Literature Review
The GHM has been studied from various academic perspectives, focusing on technological, economic, behavioral, and policy dimensions. These studies offer valuable insights into how GH can contribute to sustainable urban development. However, several research gaps remain unaddressed.
Technological innovation and energy efficiency have received substantial attention. Zhang et al. (2018) reviewed technical pathways for green building adoption in China [
11], while Guo et al. (2022) analyzed the environmental benefits of using recycled materials across the building life cycle [
23]. These studies highlight the significance of low-carbon construction techniques and material innovations in the GHM.
Scholars have explored the economic performance and pricing mechanisms of GH. Deng et al. (2012) showed that energy-efficient housing in Singapore yields measurable economic returns [
17]. Oyedokun (2017) has shown that green-labeled buildings yield higher sales and rental returns, a phenomenon referred to as the “green premium,” which may drive investment but remains less established in developing countries [
25]. However, the price premium reveals a mismatch between demand and limited supply, necessitating policy intervention to correct market failures.
Research on stakeholders’ behavior has emphasized various roles in GHM. The government plays a regulatory role by enforcing green building standards and promoting public awareness of the environmental benefits of GH [
23]. Developers adjust strategies in response to market demand and consumer preferences. Moreover, consumer preferences not only influence purchasing decisions but can also exert indirect pressure on developers and real estate agents to adopt green practices [
26].
Despite increasing public awareness, the development of the GHM remains hindered by multiple barriers. For developers, the construction cost of GH is higher than that of ordinary housing [
27]. For consumers, the transaction price of GH is higher than that of traditional commercial or residential properties [
4,
28]. These challenges make significant barriers to the large-scale promotion and adoption of GH [
29]. Empirical studies offer further insight into this disconnect between preference and behavior. Portnov et al. (2018) found that Israeli consumers are more likely to pay a premium for GH when environmental knowledge and awareness are high [
5]. In the Chinese context, Zhao et al. (2023) used system dynamics to demonstrate that while consumers are interested in GH, higher transaction costs hinder purchases [
13]. It illustrates that strong consumer preferences do not translate into proportional market outcomes without good policy mechanisms.
To address these challenges, the government has adopted a series of policy tools, including FS, CT, and CET [
30,
31]. He and Chen (2021) found that the incentive effect of subsidizing consumers is better than that of subsidizing developers [
8]. Ma et al. (2022) pointed out that consumer subsidies enhance developer profitability, while developer subsidies yield greater carbon reduction [
32]. However, Park (2015) proposed that FSs would make enterprises dependent, which is not conducive to the sustainable development of enterprises [
33]. Gao et al. (2022) believed that the gradual elimination of subsidy policies can help the development of green buildings [
31]. With growing emphasis on carbon reduction and the limitations of subsidy-based incentives, researchers have paid their attention to CT and CET [
34]. Du et al. (2021) and Yao et al. (2022) argued that combining dynamic subsidies with static carbon pricing yields optimal policy effects [
35,
36]. By internalizing environmental externalities, CET offer developers more flexible low-carbon paths [
12].
However, there are two critical research gaps. One the one hand, most studies employ static frameworks that fail to reflect how key stakeholders interact under evolving market and policy conditions [
37]. Real-world GHM development involves repeated feedback, learning, and adaptation. Second, few studies consider how stakeholder behavior evolves across different phases of market development.
Recent research has increasingly adopted evolutionary game theory to analyze the dynamic interactions among multiple stakeholders [
2,
38].
Table 1 summarizes representative studies using it in the context of green building development. These studies typically explore two- or three-player strategic relationships, such as government and developers [
39], developers and consumers [
36], developers and developers [
12], and government, developers, and consumers [
40]. A three-party evolutionary game model is particularly suitable for exploring the strategic evolution among governments, developers, and consumers responding to various policy tools.
Existing studies mainly explore the development of the GHM from the perspective of FS, CT, and CET, which provides the research basis for this study [
1,
43]. However, the existing research focuses on analyzing FS policy, FS and CT policies, and FS and CET policies, and it remains silent in the research about low-carbon policies. In addition, scholars mainly study the initial stage of GH, ignoring the dynamic changes of industrial development. The product life cycle theory emphasizes that as time goes by, the cumulative number or proportion of innovation adopters increases slowly at the beginning, then rapidly, and finally flattens out with the emergence of saturation and maturity [
42,
44]. Therefore, it is necessary to supplement the research on the development of the green building market in different stages.
In summary, previous studies have provided a solid foundation for understanding how different stakeholders interact in the GHM. However, they keep silent on the dynamic perspective of how these interactions change, especially when multiple policy tools are involved, such as financial subsidies, carbon taxes, and carbon trading. This study introduces a new evolutionary game model based on the product life cycle of the green housing market. It offers new perspectives on how policy effects vary at different stages of market development.
3. Methodology
3.1. Problem Raising
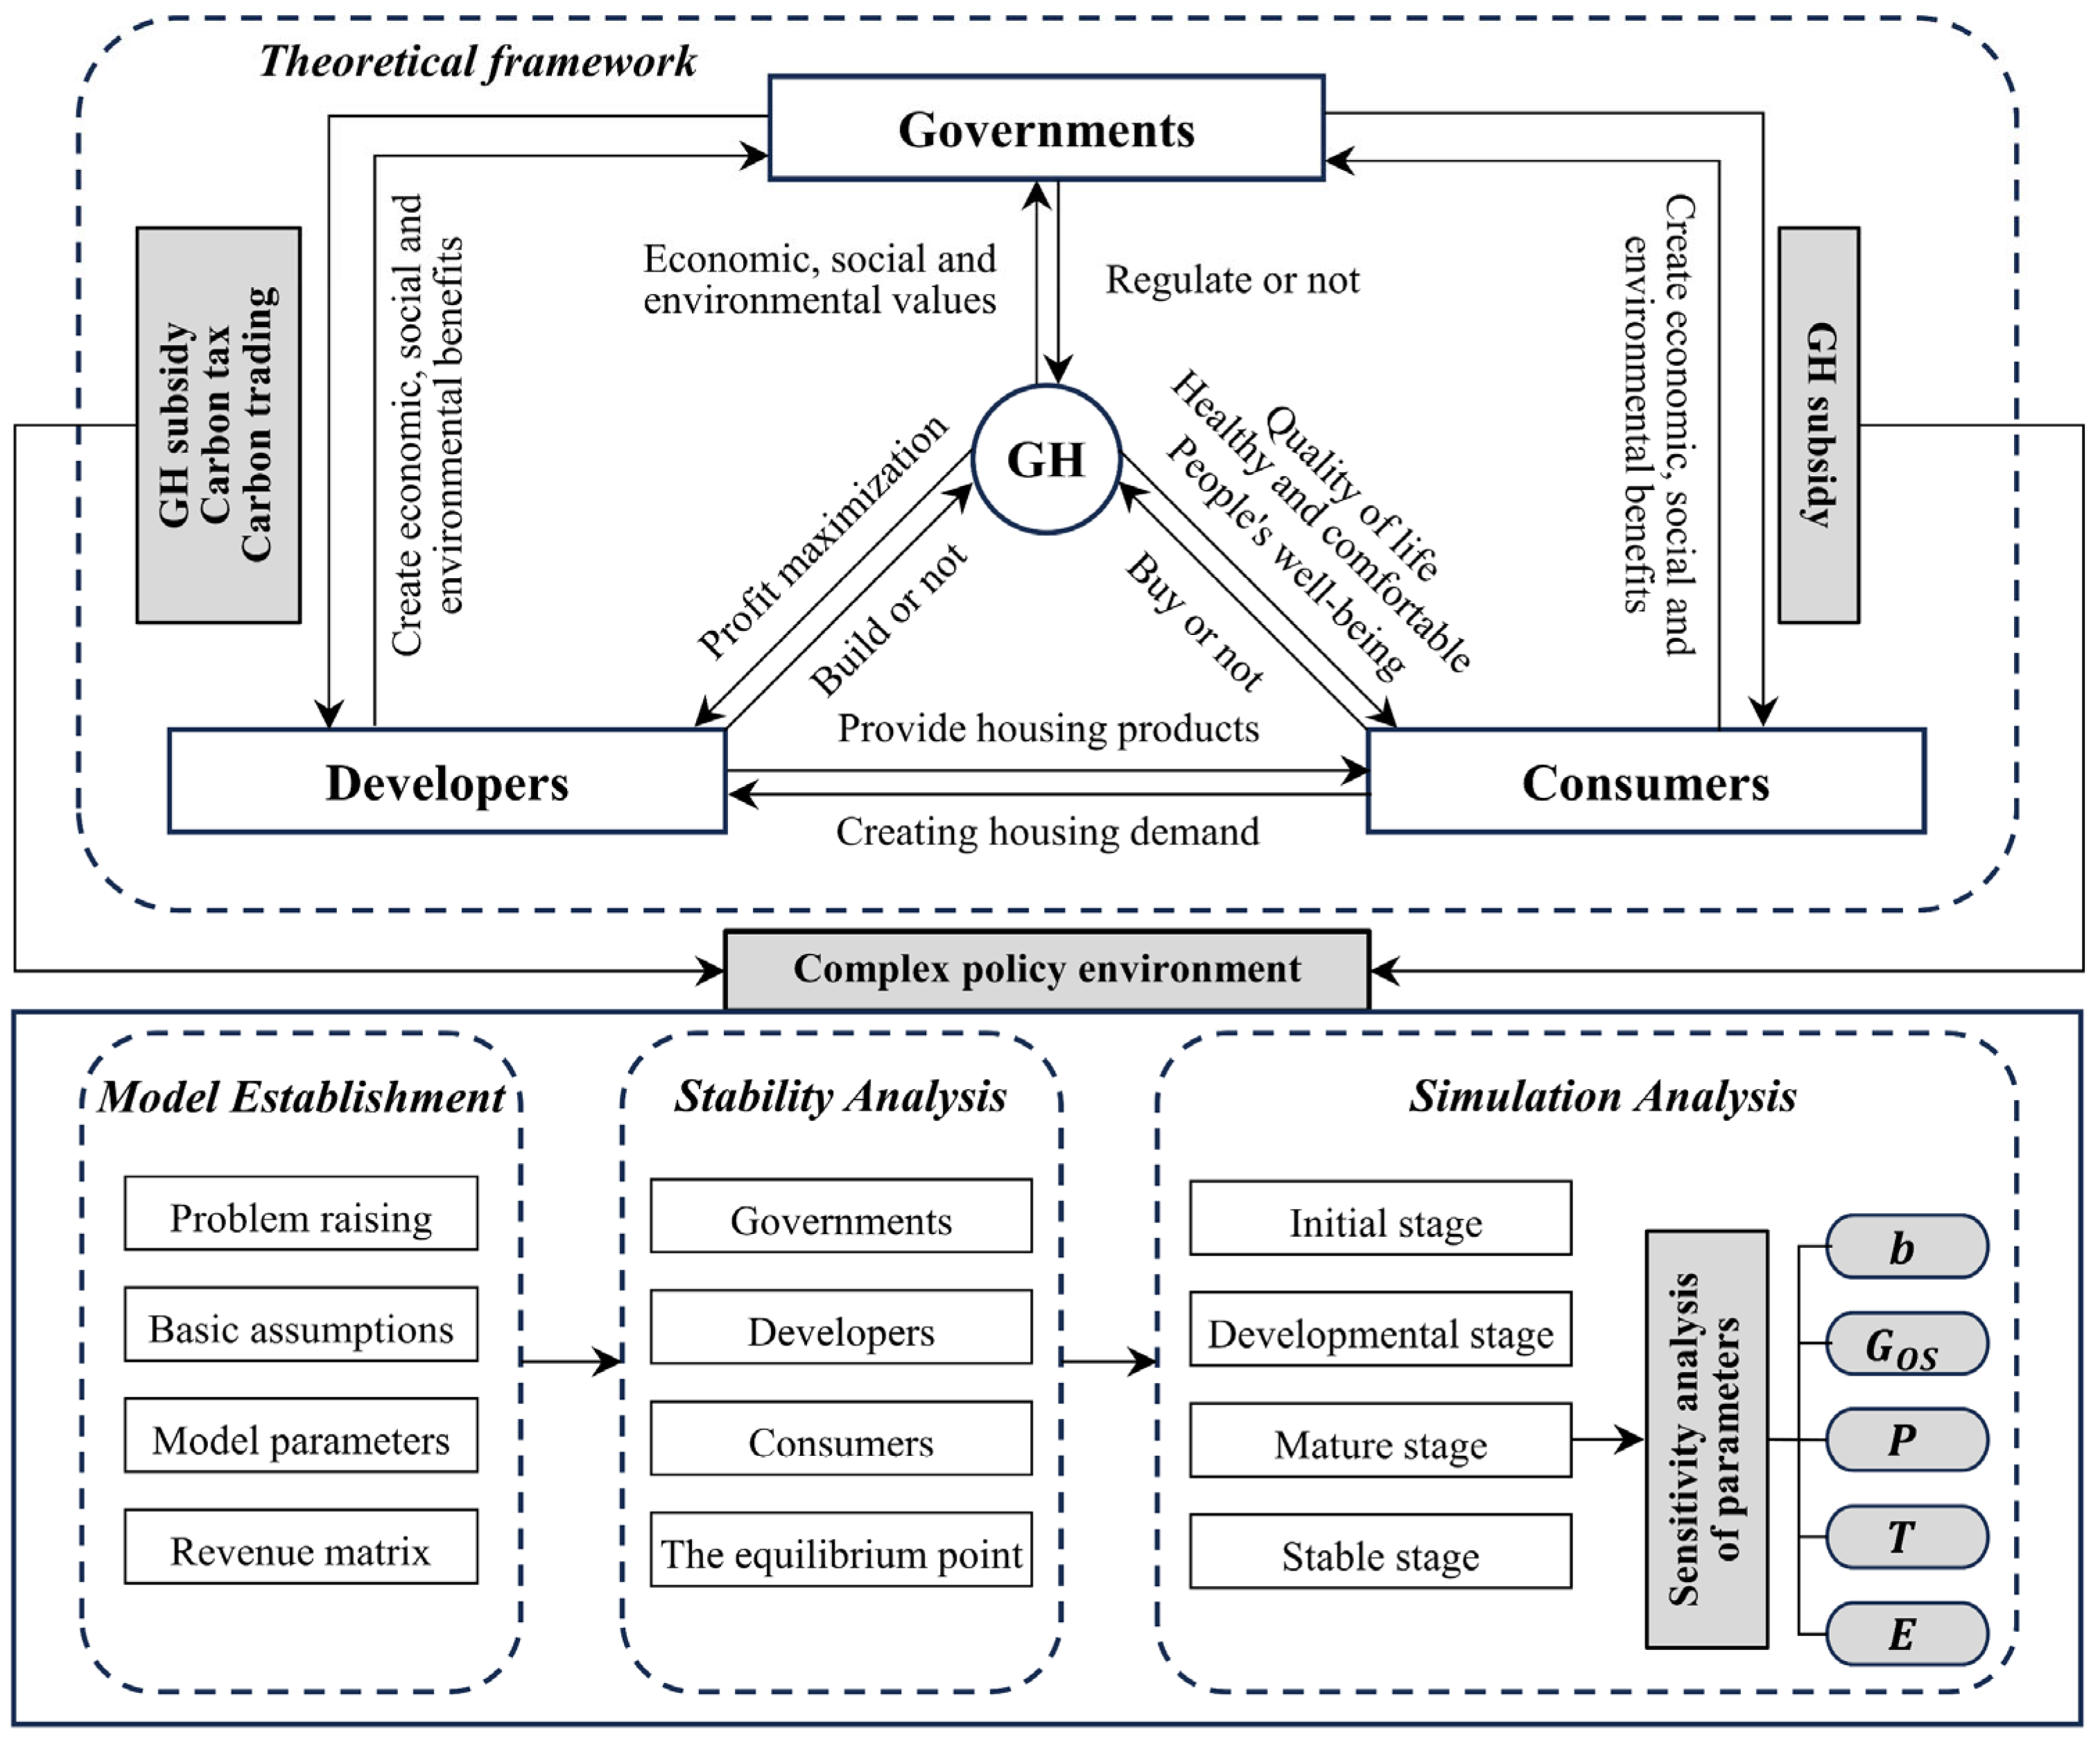
The reason for modeling government, developers, and consumers together is that their decisions are closely linked. Although they do not interact directly, their choices affect each other through market signals and policy changes. For example, a government subsidy lowers the costs for developers, which can affect housing prices and influence consumer purchasing decisions. In turn, consumer demand shapes future government policies and developer plans.
GH exhibits positive externalities (i.e., environmental benefits) and negative ones (i.e., information asymmetry), requiring targeted incentives and robust regulation to guide development. The authors conclude that the primary governmental measures supporting the GHM encompass financial subsidies for both developers and consumers, carbon taxation mechanisms, and carbon emission trading policies. Consequently, this study integrates these measures into an evolutionary game model to investigate their impacts on the development of the GHM. The framework of this study is illustrated in
Figure 1.
This study employs stakeholder theory and evolutionary game theory as the primary frameworks. A tripartite evolutionary game model is developed to simulate the dynamic strategies of governments, developers, and consumers under the influence of financial subsidies, carbon taxes, and carbon emissions trading. While these policy tools differ in nature, they are used in combination to address different leverage points in carbon mitigation. In this study, each tool is incorporated into the model through separate payoff paths, reflecting specific economic roles. FS reduces effective costs for stakeholders. CT imposes a penalty per unit of excess emissions. CET creates an opportunity for developers to trade emission rights depending on carbon intensity relative to government quotas. The modeling strategy facilitates us to identify the interaction effects of diverse policy tools on stakeholder behavior within a unified framework.
Secondly, the dynamic evolution of stakeholder strategies is analyzed across four stages of market development: initial, development, mature, and stable. Specifically, the model tracks how governments decide whether to implement regulatory interventions, how developers choose between constructing green and traditional housing, and how consumers decide whether to purchase GH. These strategy choices evolve as stakeholders respond to shifting policy environments and market conditions.
Finally, this study explores how changes in key parameters influence the behavior of stakeholders over time in the mature stage. The findings enhance the application of stakeholder theory and evolutionary game theory in the context of GH. They also offer practical guidance for governments, developers, and consumers, supporting the sustainable and high-quality growth of the GHM.
3.2. Basic Assumptions
To construct the game model, and analyze the stability of the strategies and equilibrium points of each party and the influence relationship of each factor, the following assumptions are made:
Assumption 1. The government is player 1, the developer is player 2, and the consumer is player 3. The three parties are participants with bounded rationality, and their decisions are based on the maximization of interests. The three parties continue to learn from each other, and their strategy selection gradually evolves and becomes stable to the optimal strategy over time [12]. Assumption 2. The government’s strategy space α = (α1, α2) = (regulate, do not regulate), and chooses α1 with probability x and α2 with probability (1 − x), x ∈ [0, 1]; the strategy space of developers is β = (β1, β2) = (build GH, build OH), and the probability of choosing β1 is y, and the probability of choosing β2 is (1 − y), y ∈ [0, 1]. The consumer’s strategy space γ = (γ1, γ2) = (buy housing, do not buy housing) and chooses γ1 with probability z and γ2 with probability (1 − z), z ∈ [0, 1].
3.3. Model Parameters
This study only considers the carbon quota trading within residential developers but does not consider the carbon quota trading of other industries and building types. The carbon emissions of developers when they build ordinary houses are E
O, and the carbon emissions when they build GH are E
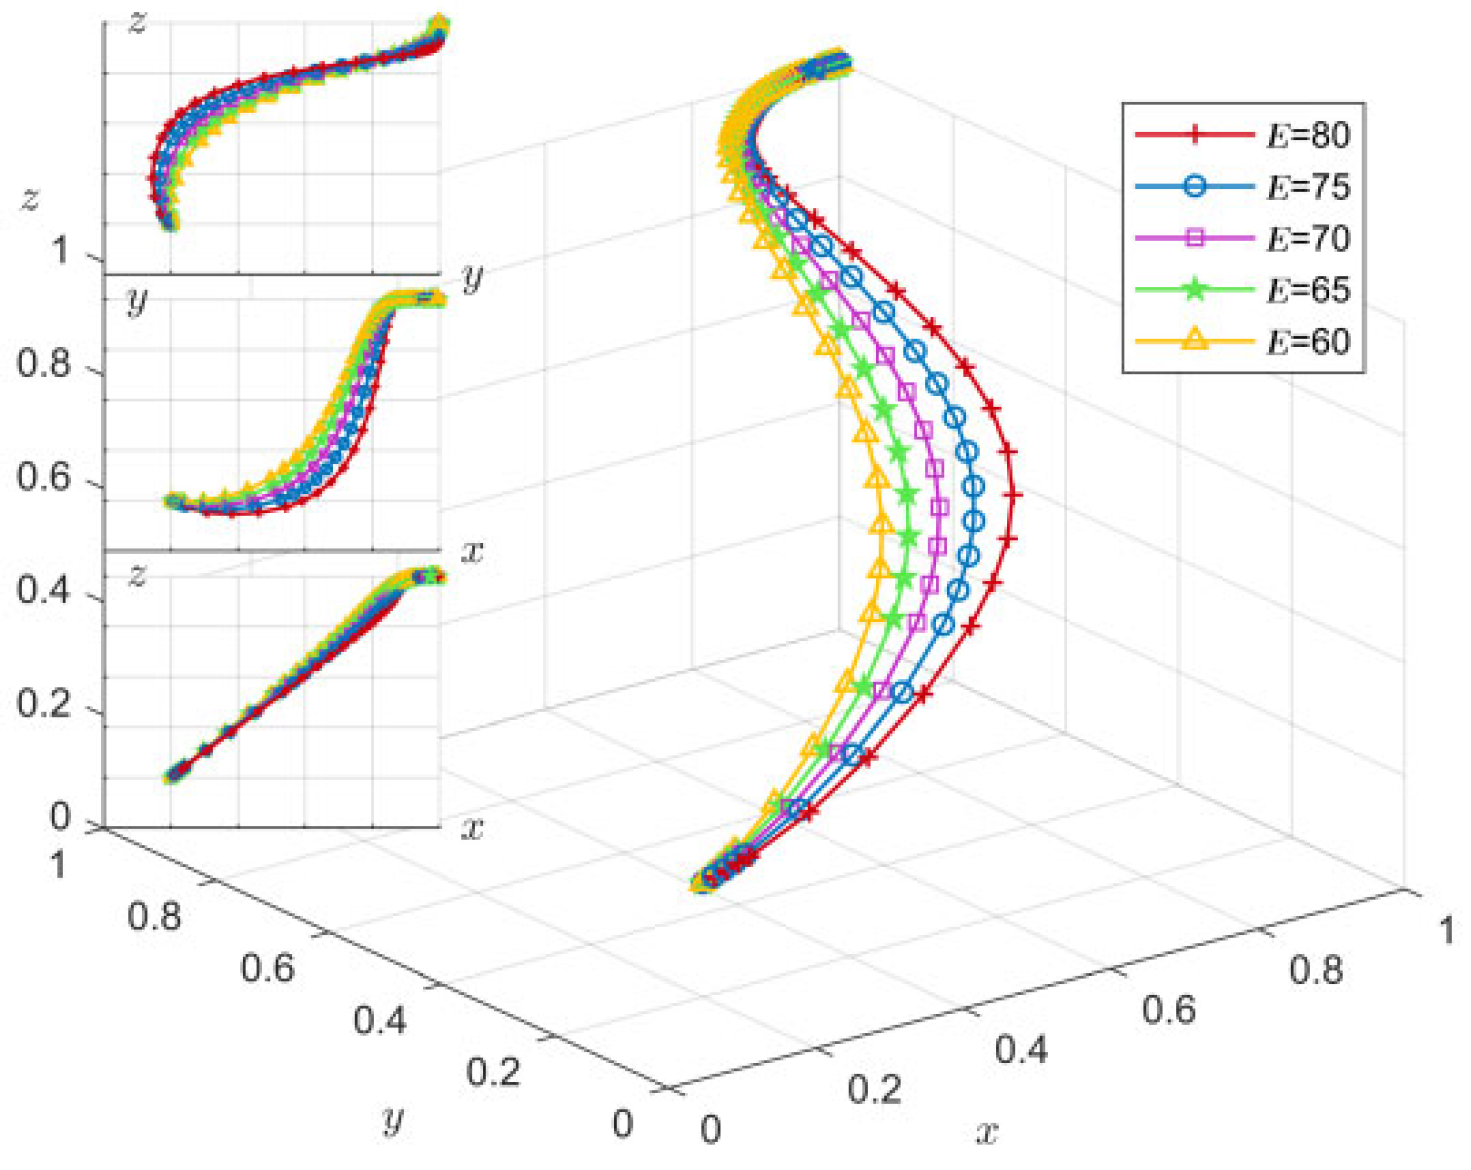
G, and the difference between the two is E = E
O − E
G. Define E as the green gap, reflecting the green efforts made by the developer to reduce carbon emissions. E
T is the carbon emission amount distributed free of charge by the government to enterprises within the jurisdiction [
40]. When the developer’s emissions are greater than E
T, the enterprise needs to purchase emissions in the CET market; when the emission of the developer is less than E
T, the developer can sell the excess CET right in the market [
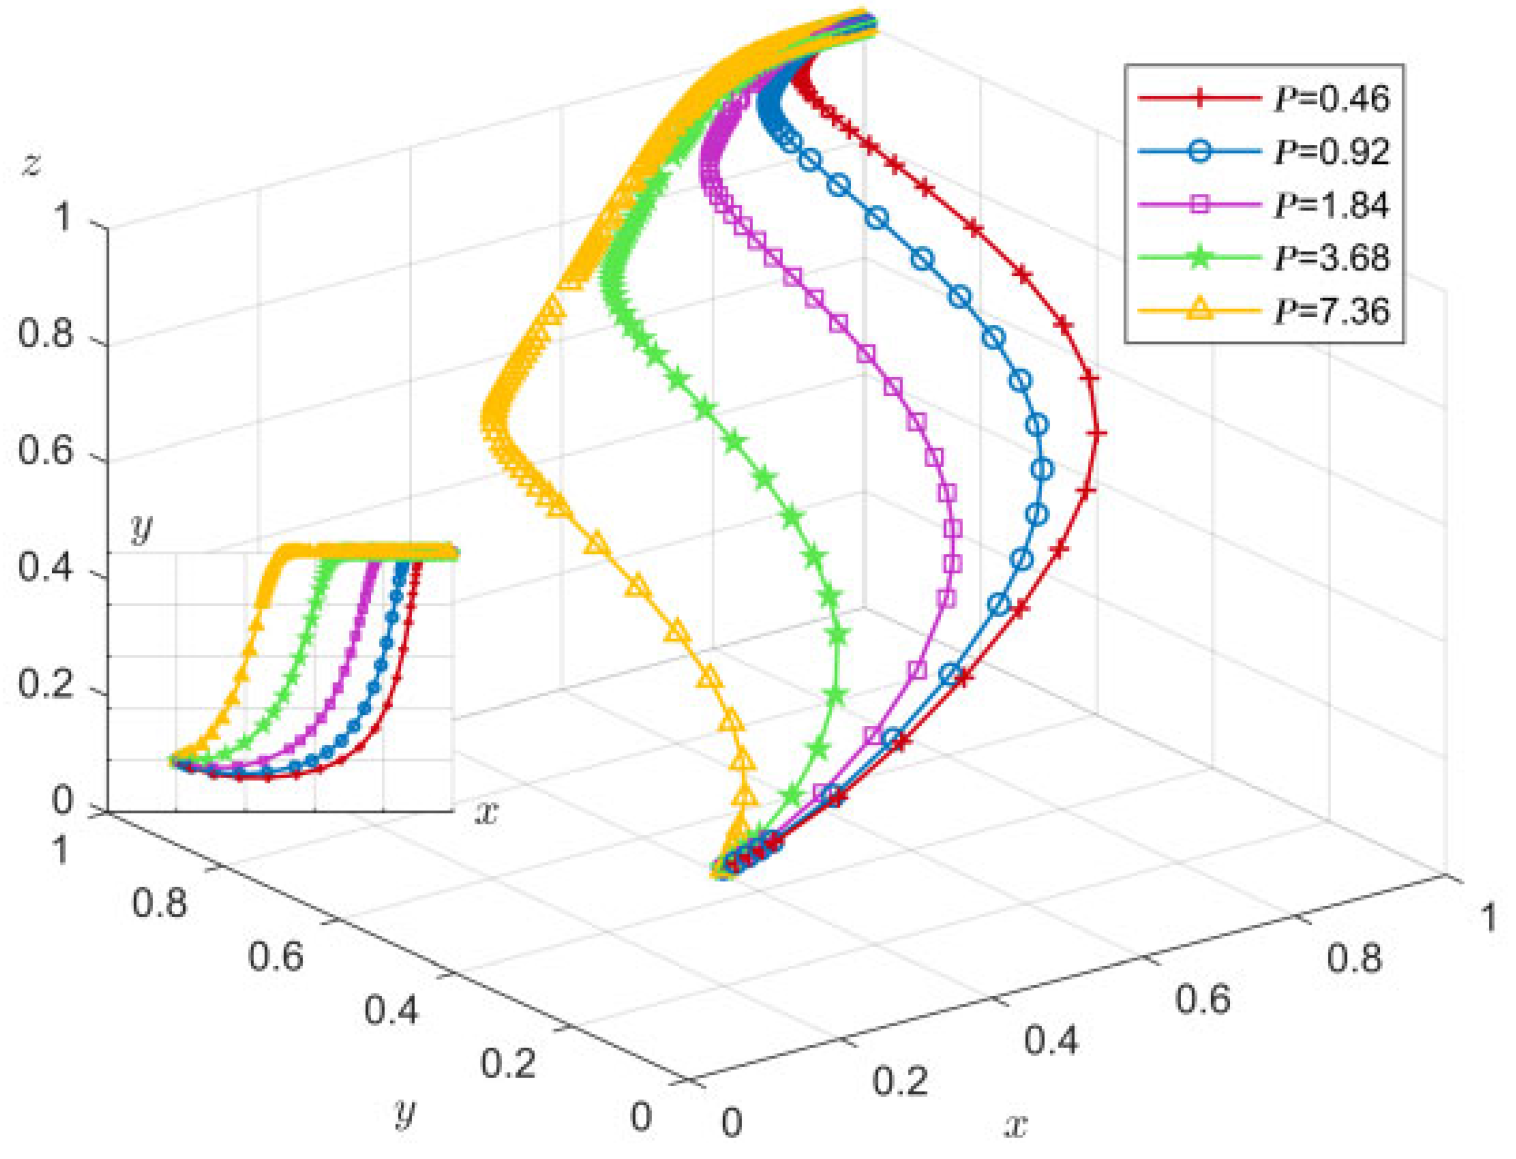
40]. The unit CET price P is determined by the market.
In this study, the cost of developers to develop OH is C
DO. Assuming that there is a quadratic relationship between incremental cost and green gap [
8], the incremental cost to develop GH is φE
2, and φ is the incremental cost coefficient. The incremental cost of constructing green buildings includes the investment in applying or upgrading low-carbon technologies [
12]. The direct benefit to the developer of building an ordinary house is R
DO and the incremental benefit is R
DIR. This study assumes that R
DO > C
DO.
The cost of consumers buying ordinary buildings is C
CO, and the incremental cost paid by consumers buying GH is passed on by the incremental cost of developers building GH, which is denoted as (1 + r)φE
2, where r represents the pricing rate of real estate developers. The benefit brought by consumers buying ordinary houses is R
CO, and the incremental benefit is R
CIR. Incremental benefits are the economic benefits of energy and water savings through the use of green buildings [
40]. Potential benefits include consumer satisfaction and comfort of green buildings [
40]. This study assumes that R
CO > C
CO.
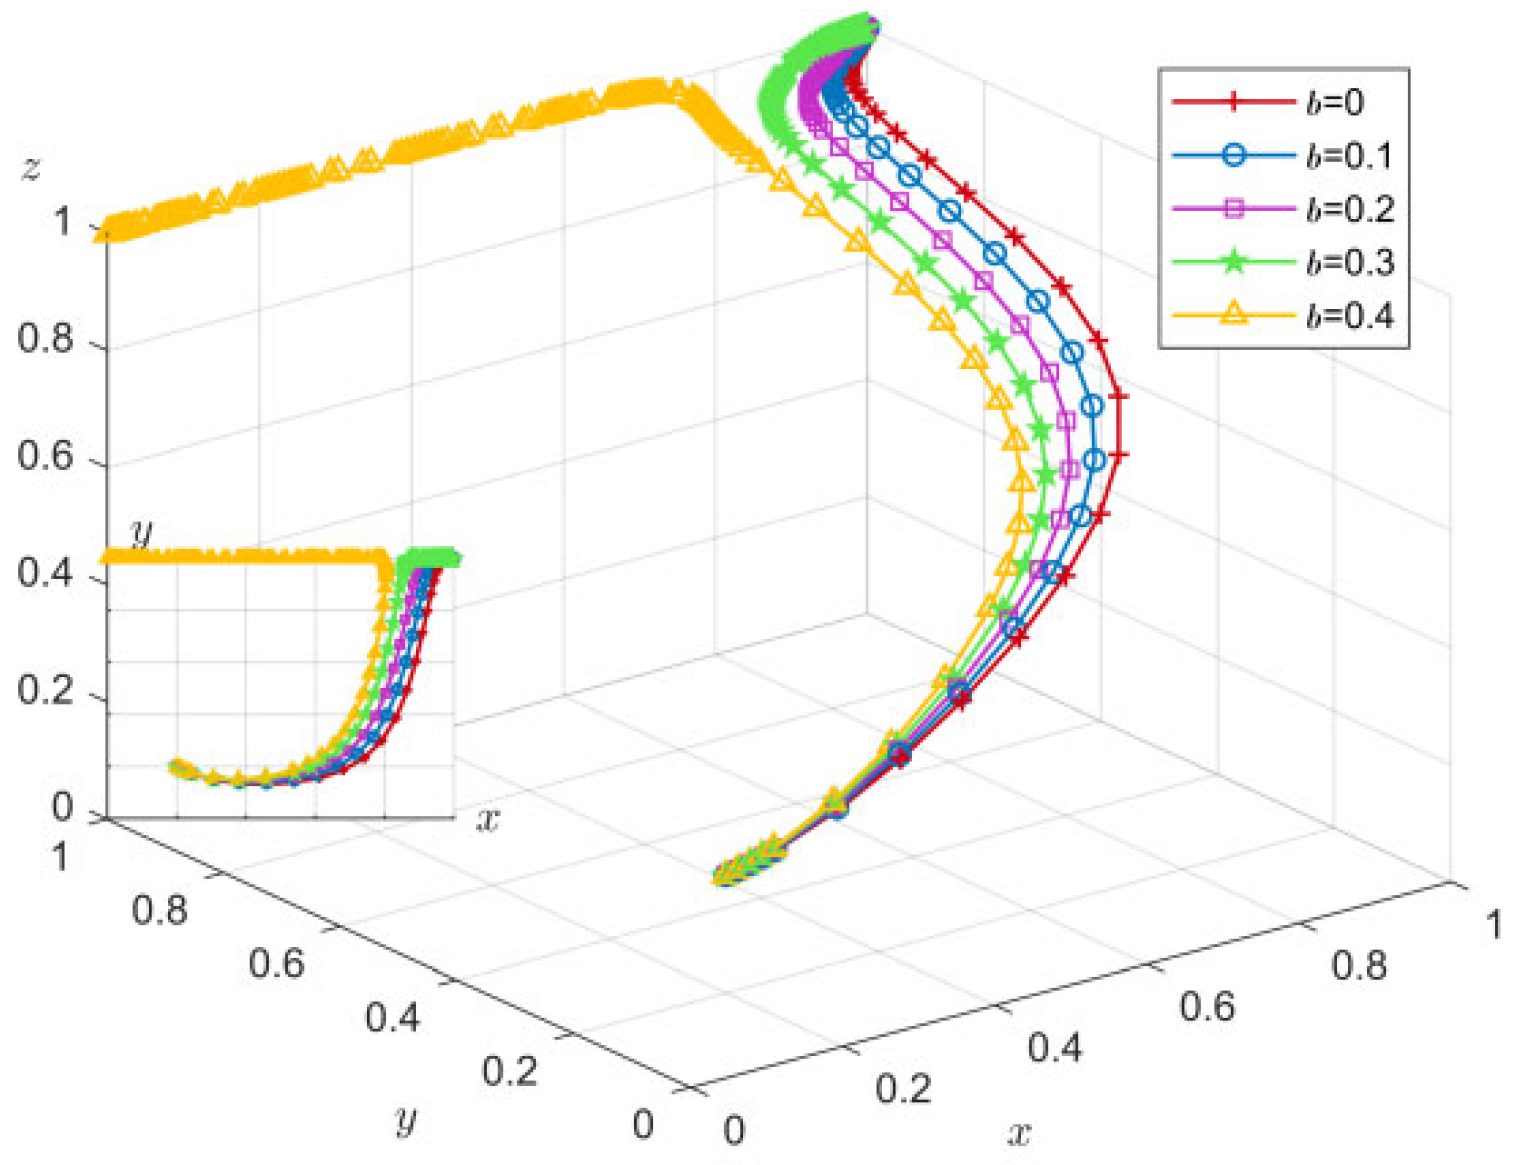
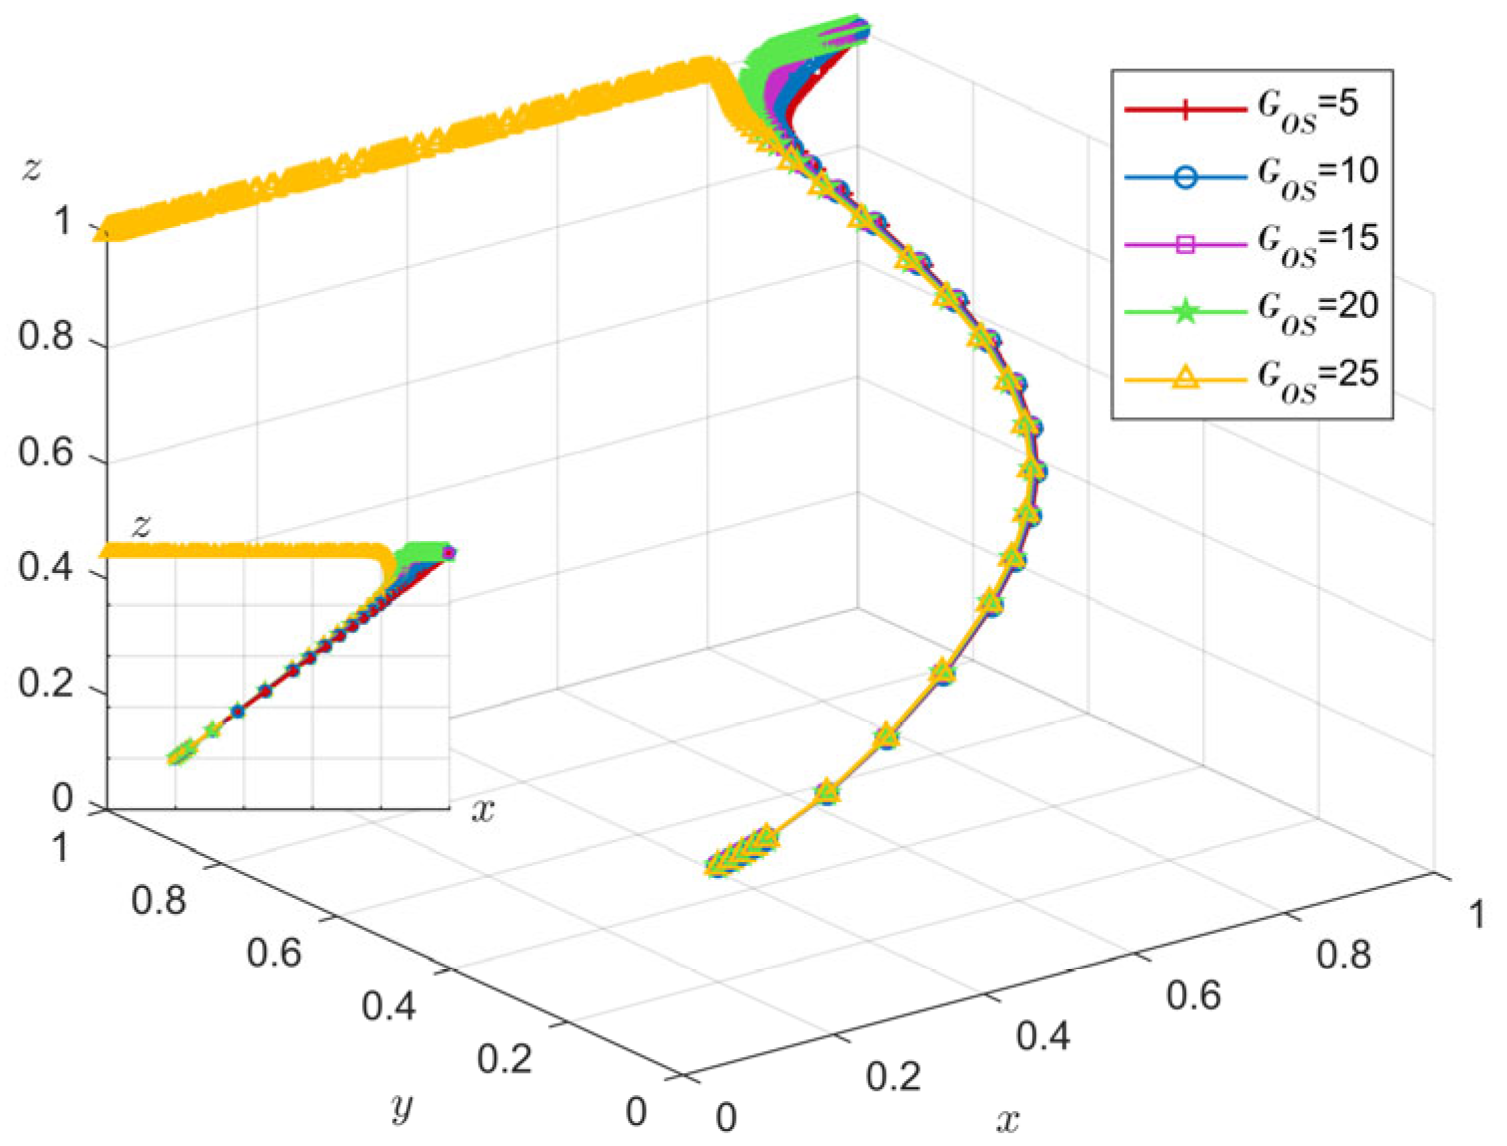
Only under government regulation can subsidies be provided to developers and consumers of GH [
35]. The government gives a certain cost subsidy, bφE
2, to the developers who build GH, and the developers who choose ordinary houses will not get the cost compensation from the local government. It is revealed that the subsidy amount may be affected by the FS coefficient b, the cost coefficient φ, and the green gap E. The government gives an FS to consumers who buy GH, G
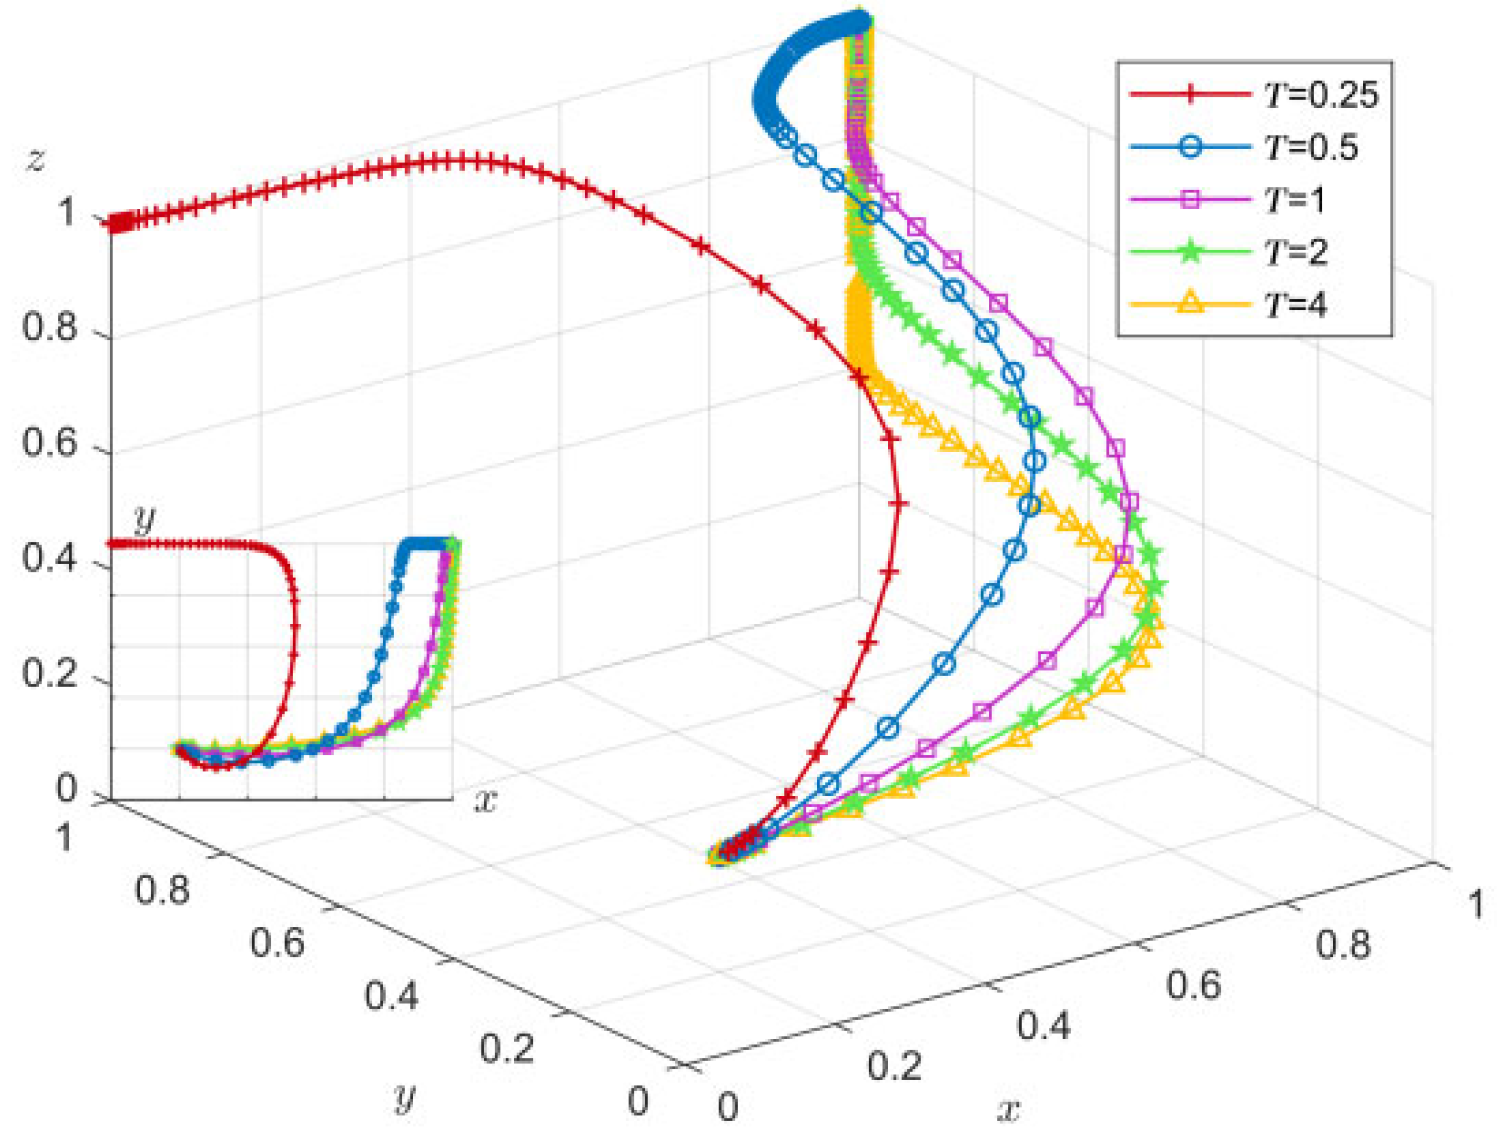
OS. Similarly, CT can be levied on developers at a tax rate of T only when the government regulates [
35].
The economic and social benefits brought by the construction of GH to the government are RGN, while the construction of ordinary houses will bring negative environmental benefits, and the government needs to pay RGE for environmental governance.
Due to market immaturity or other constraints, when consumers choose not to buy, developers will bear the loss of unsold goods, and the loss of unsold goods is a function linearly related to the respective construction costs. μ is the unsalable coefficient of housing built by developers. The symbols and definitions of the parameters are shown in
Table 2.
3.4. Revenue Matrix
Combined with the above relevant assumptions and model parameters, the revenue matrix of governments, developers, and consumers is constructed, as shown in
Table 3.
3.5. Stability Analysis
3.5.1. Policy Stability Analysis of Governments
The expected income of government regulation or unregulated and average expected returns (
,
,
) are, respectively, as follows:
The dynamic equation of the government policy selection is
The first derivative of x and the set of G(y) are
According to the stability theorem of differential equations, the probability of government selection regulation must be satisfied: F(x) = 0 and d(F(x))/dx < 0. ∂G(y)/∂y > 0, G(y) is an increasing function. Therefore, when y = T
EO/(Z
GOS + bφE
2 + T(E
O − E
G)) = y*, G(y) = 0, d(F(x))/dx < 0, the government is not determined to determine the stable strategy. When y < y*, G(y) < 0, d(F(x))/dx|
x=1 < 0, the x = 1 is the evolution stability strategy. Conversely, the x = 0 is the evolutionary stability strategy.
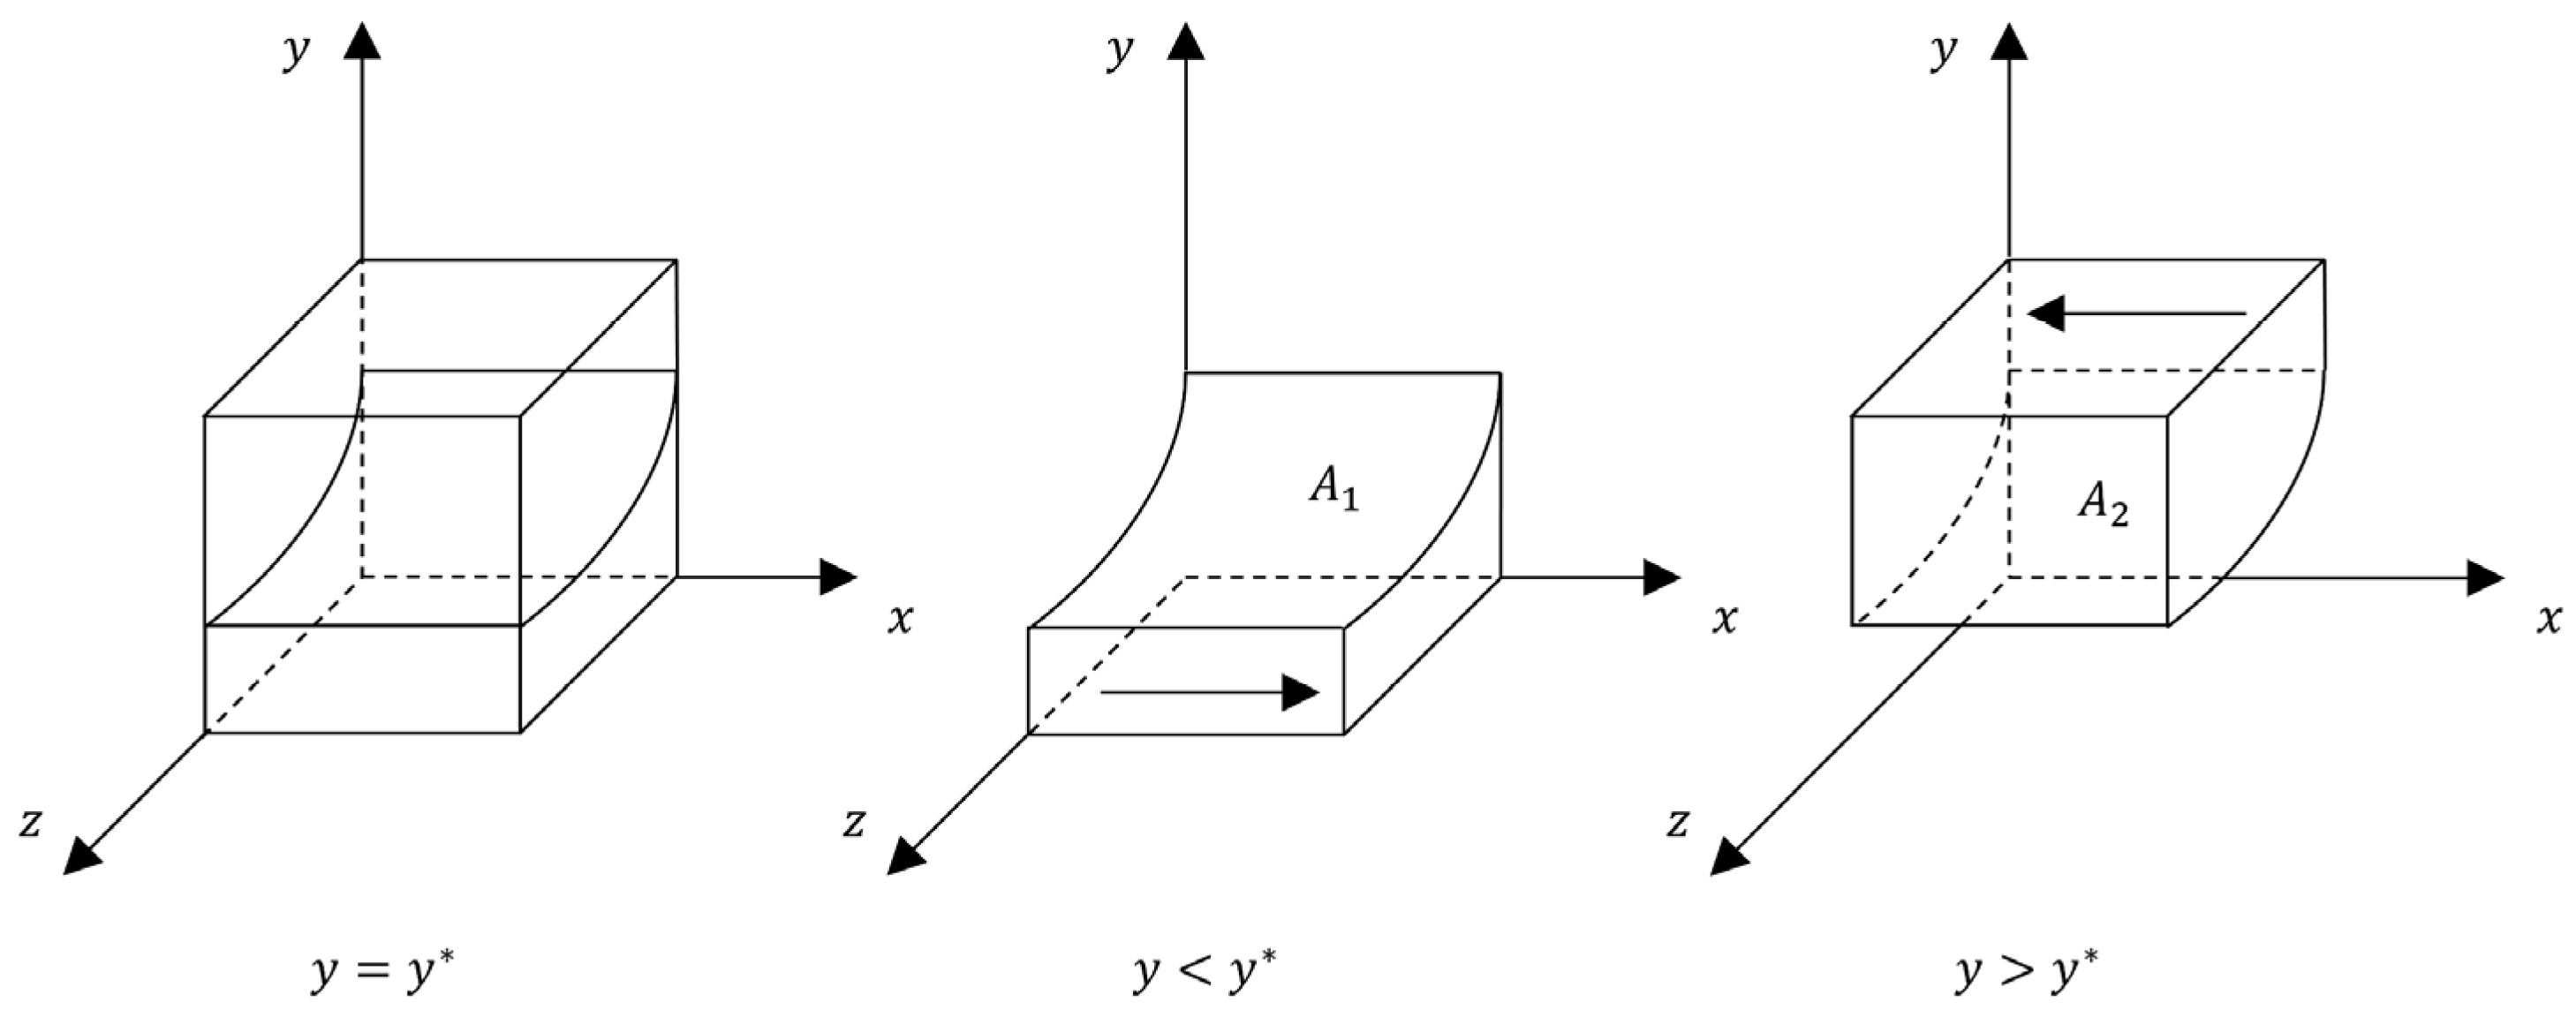
Figure 2 is the government’s strategic evolution phase diagram.
Figure 2 shows that the volume of A
1 represents the probability of government regulation and the volume of A
2 represents the probability of government non-regulation. It is calculated as follows:
Proposition 1. The probability of government regulation is positively correlated with taxes, and negatively correlated with government subsidies to consumers, subsidies to developers, cost coefficient of developers, carbon emissions of ordinary houses, and carbon emissions of GH.
According to the government regulation probability VA1 expression of the elements of a first order partial derivative, GOS/(bφ(EO − EG)2 + T(EO − EG) + GOS) < ln(1 + GOS)/((bφ(EO − EG)2 + T(EO − EG)) < GOS/((bφ(EO − EG)2 + T(EO − EG)), ∂VA1/∂GOS < 0, ∂VA1/∂T > 0, ∂VA1/∂b < 0, ∂VA1/∂φ < 0, ∂VA1/∂EO < 0 (s.t.bφ(EO − EG)2 < TEG + 2bφEO), ∂VA1/∂EG < 0. Therefore, when bφ(EO − EG)2 < TEG + 2bφEO, EO increases and VA1 decreases. At the same time, the increase in T or the decrease in GOS, b, φ, EO, and EG can increase the probability of government regulation.
Proposition 2. In the evolution process, the probability of government regulation decreases with the increase in the probability of developers developing GH or the probability of consumers purchasing housing.
According to the analysis of the evolutionary stability of the government’s strategy choice, when y < y*, z < −(ybφE2) + yT(EO − EG) − TEO)/yGOS, x = 1 is the evolutionary stable strategy. Conversely, x = 0 is an evolutionarily stable strategy (ESS). Therefore, with the increase in y and z, the probability of government regulation decreases from x = 1 to x = 0.
3.5.2. Policy Stability Analysis of Developers
The developer’s expected revenue and average expected revenue (
,
,
) are as follows:
The replication dynamic equation of developers’ strategy selection is as follows:
The first derivative of y and the set G(x) are, respectively, as follows:
According to the stability theorem of differential equations, the probability of the developer choosing GH in the steady state must satisfy F(y) = 0 and d(F(y))/dy < 0.
∂Q(x)/∂x < 0, so Q(x) is a decreasing function. Therefore, when x = ((1 − (z − 1)μ)φE
2 − zR
DIR)/(bφE
2 + (P + T)E) = x*, Q(x) = 0, d(F(x))/dx = 0, developers cannot determine the stable strategy; when x < x*, Q(x) > 0, y = 0 is an ESS. Otherwise, y = 1 is an ESS.
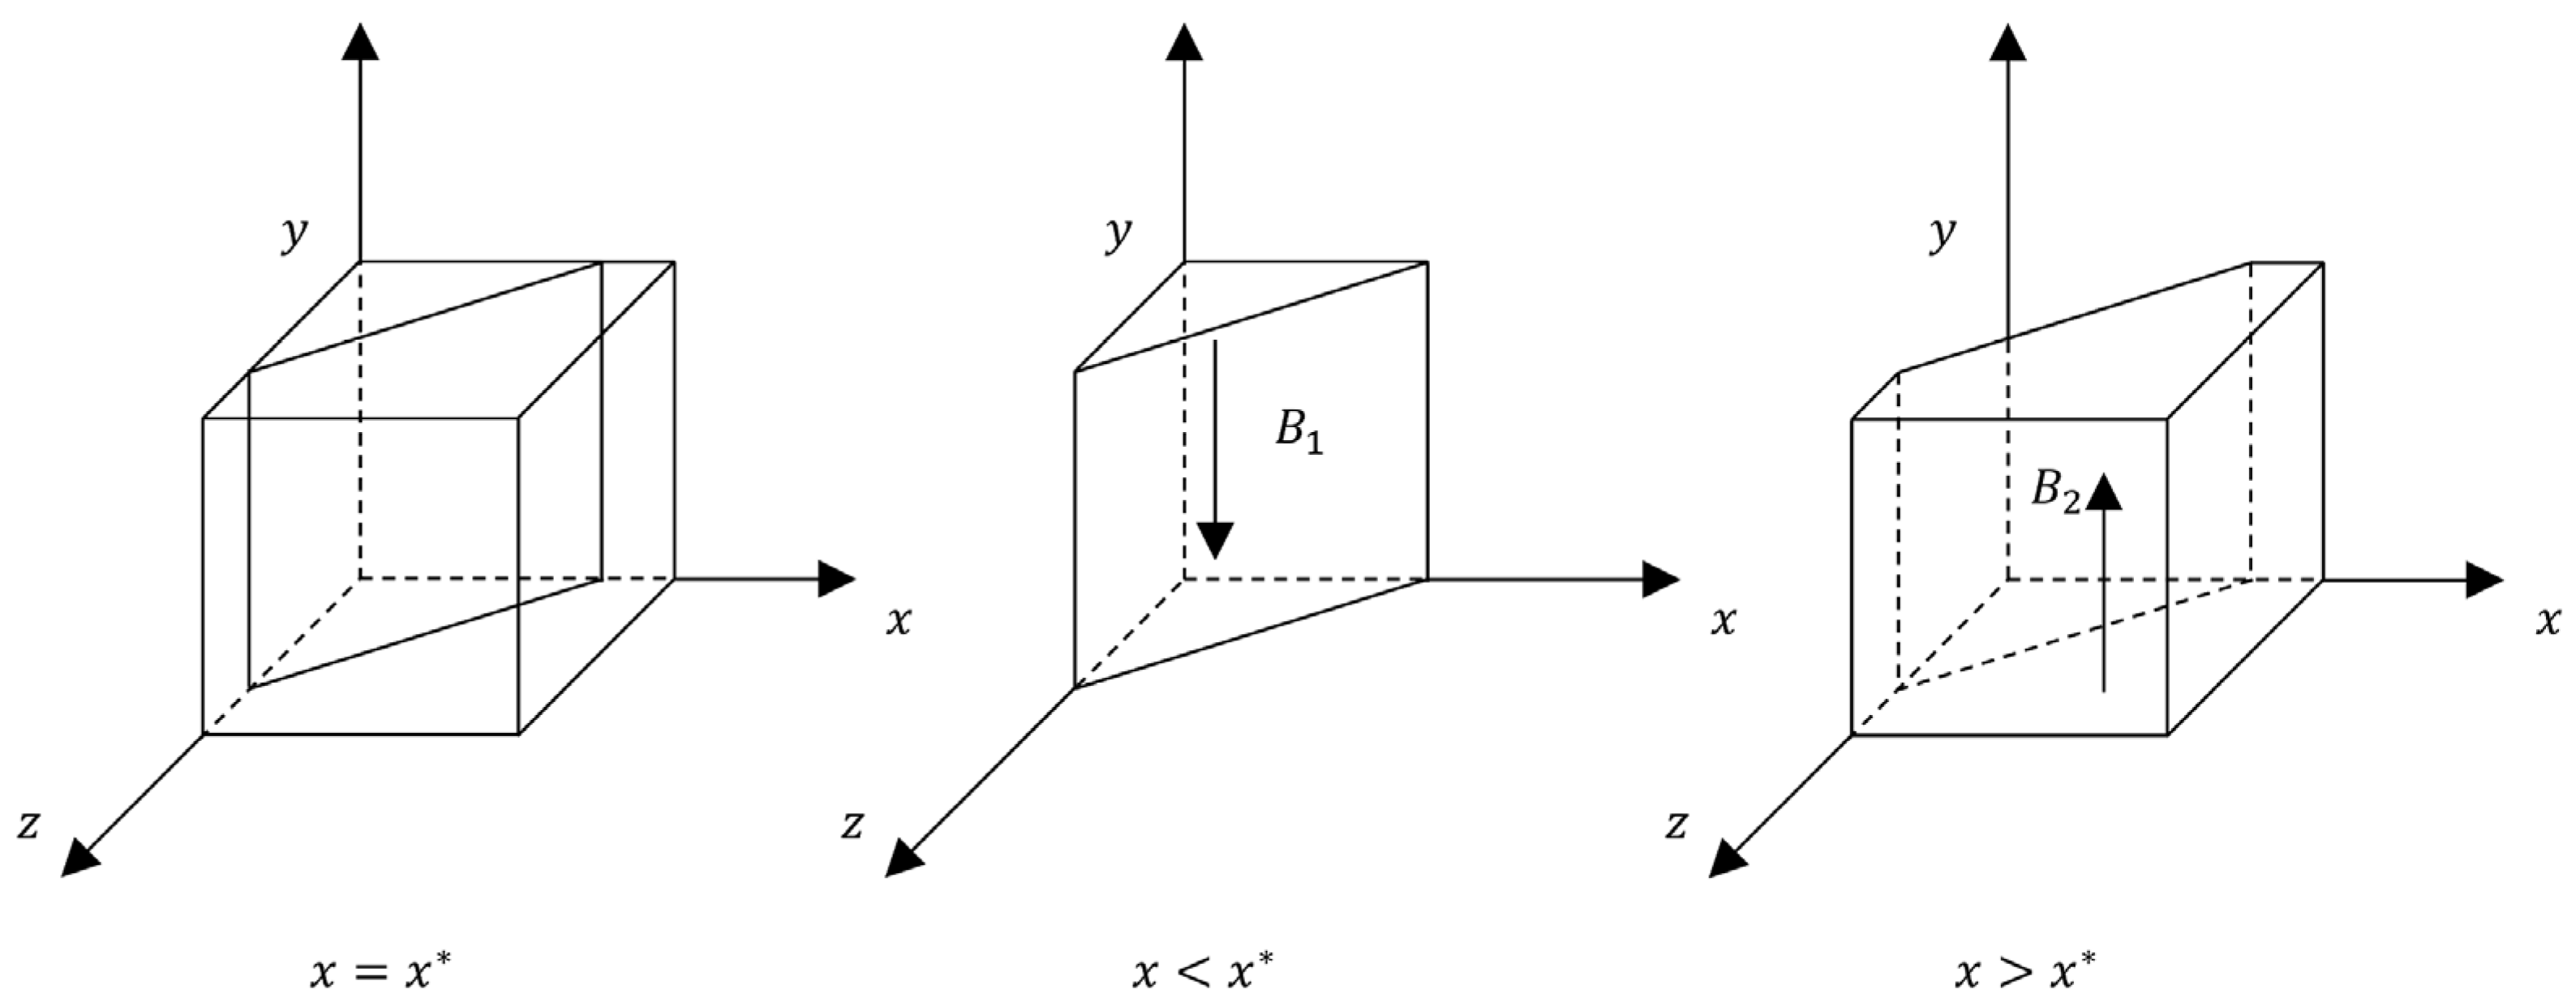
Figure 3 is the developer’s strategic evolution phase diagram.
Figure 3 shows that the volume of B
1 represents the probability that the developer develops OH, and the volume of B
2 represents the probability that the developer develops GH. It is calculated as follows:
Proposition 3. The probability of developers developing ordinary houses is positively correlated with the carbon emission difference of GH, the cost coefficient of GH, and the unsalable coefficient of GH, and negatively correlated with the incremental revenue of GH, the carbon rate, the government subsidy for developers to develop GH, and the carbon price.
According to the expression of the probability VA1 of the developer to develop OH, the first partial derivative of each element is obtained, ∂VA1/∂E > 0, ∂VA1/∂φ > 0, ∂VA1/∂μ > 0 (s.t. (μ − 1)φE2 + 2RDIR > 0), ∂VA1/∂RDIR < 0, ∂VA1/∂T < 0, ∂VA1/∂b < 0, ∂VA1/∂P < 0. Therefore, ∂μ > 0 (s.t. (μ − 1)φE2 + 2RDIR > 0, μ increases, which can increase VA1. At the same time, the increase in E, φ, and μ or the decrease in RDIR, T, b, and P can increase the probability of developers developing ordinary houses.
Proposition 4. In the evolution process, the probability of developers developing OH increases with the increase in the probability of government regulation or the probability of consumers purchasing housing.
According to the analysis of the evolutionary stability of the government’s strategy choice, when x < x*, z < −(E(xbφE − μφE + 2xP + xT)/(φE2 + RDIR), x = 0 is the evolutionarily stable strategy; conversely, x = 1 is an ESS. Therefore, with the increase in x and z, the probability of government regulation decreases from x = 1 to x = 0, so x increases with the increase in y and z.
3.5.3. Policy Stability Analysis of Consumers
The expected revenue of consumers and the average expected revenue (
,
,
) are as follows:
The replication dynamic equation of consumers’ strategy choice is as follows:
The first derivative of z and H(y) are set as follows:
According to the stability theorem of differential equations, the probability of consumers choosing to buy houses in the steady state must satisfy F(z) = 0 and d(F(z))/dz < 0.
∂H(y)/∂y > 0, so H(y) is an increasing function. Therefore, when y = (RCO − CCO)/((1 + r)φE2 − xGOS − RCIR) = x*, H(x) = 0, d(F(z))/dz = 0, the consumer is not sure that the developer can determine the strategy of the situation. When y < y*, H(x) < 0, d(F(z))/dz|z = 1 < 0, z = 0 is the evolutionary stability strategy. Conversely, z = 0 is the evolutionarily stable strategy.
Figure 4 is the consumer’s strategic evolution phase diagram.
Figure 4 shows that the volume of C
1 represents the probability that a consumer will purchase a dwelling, and the volume of C
2 represents the probability that a consumer will purchase a dwelling. It is calculated as follows:
Proposition 5. The probability of a consumer purchasing a dwelling is positively related to the incremental benefit of a consumer purchasing a green dwelling, and negatively related to the same.
According to the expression of the probability VA1 of consumers not buying houses, the first partial derivatives of each element can be obtained, ∂VA1/∂RCO > 0, ∂VA1/∂CCO < 0, ∂VA1/∂r < 0, ∂VA1/∂RCIR > 0, ∂VA1/∂φ < 0, ∂VA1/∂E < 0, and ∂VA1/∂GOS > 0. Therefore, the increase in RCO, RCIR, and GOS or the decrease in CCO, r, φ, and E can increase the probability of consumers purchasing housing.
Proposition 6. In the evolution process, the probability of consumers buying houses decreases with the increase in government regulation and the probability of developers developing GH.
According to the evolutionary stability analysis of consumers’ strategy choices, when y < y*, x < (yrφE2 + yφE2 − yRCIR + CCO − RCO)/yGOS, z = 1 is the evolutionarily stable strategy; conversely, z = 0 is an ESS. Therefore, with the increase in x and y, the probability of consumers purchasing housing decreases from z = 1 to z = 0, so there is a decrease in z with the increase in x and y.
3.5.4. The Stability Analysis of the Equilibrium Point of the Evolutionary Game System
From F(x) = 0, F(y) = 0, and F(z) = 0, the eight pure strategy equilibrium points of the system can be determined: E1(0,0,0), E2(1,0,0), E3(0,1,0), E4(0,0,1), E5(1,1,0), E6(1,0,1), E7(0,1,1), and E8(1,1,1).
The Jacobian matrix of the three-party evolutionary game system is
According to Lyapunov’s system stability theory, when all the eigenvalues of J have negative real parts at some equilibrium point, the equilibrium point is the ESS of the game [
45]. The eigenvalues of each equilibrium point are calculated by substituting each pure strategy equilibrium point into Equation (19).
Table 4 lists the eigenvalues of the eight pure strategy equilibrium points.
TE0 > 0, RCO − CCO > 0, (μ + 1)φE2 > 0, so E1~E4 are unstable equilibrium points, and we only need to analyze the stable equilibrium of E5~E8. There are eigenvalues in E5~E8 that cannot be determined as positive or negative, and they need to be analyzed one by one. The product life cycle theory reflects the entire evolution and development process of an industry from introduction to stability. The equilibrium points E6, E5, E8, and E7 correspond to the initial stage, developmental stage, mature stage, and stable stage, respectively.
- (1)
Initial stage
When E
6(1,0,1) is a stable equilibrium point, the following condition must be satisfied:
- (2)
Developmental stage
When E
6(1,1,0) is a stable equilibrium point, the following three conditions need to be satisfied:
- (3)
Mature stage
When E
8(1,1,1) is a stable equilibrium point, the following three conditions must be satisfied:
- (4)
Stable stage
When E
7(0,1,1) is a stable equilibrium point, the following three conditions need to be satisfied:
In summary, when different conditions are satisfied, four equilibrium points that tend to be stable over time can be obtained.
5. Discussions
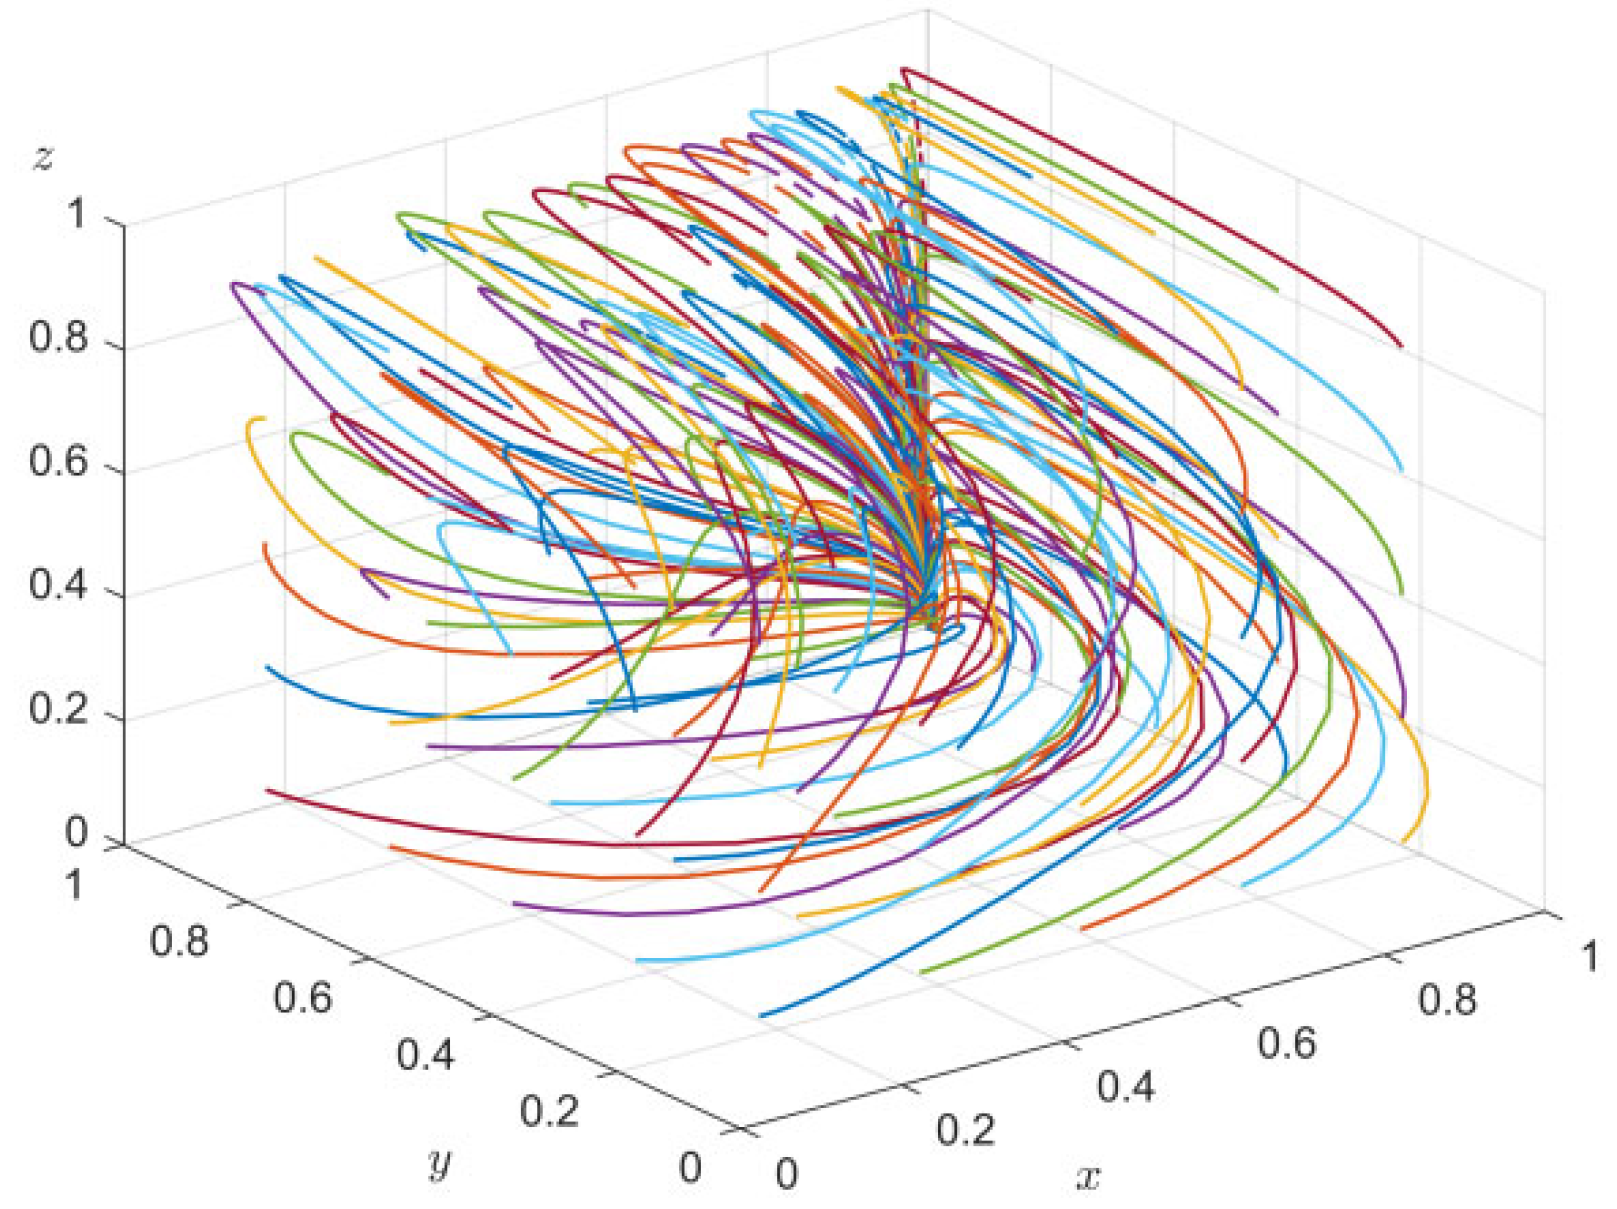
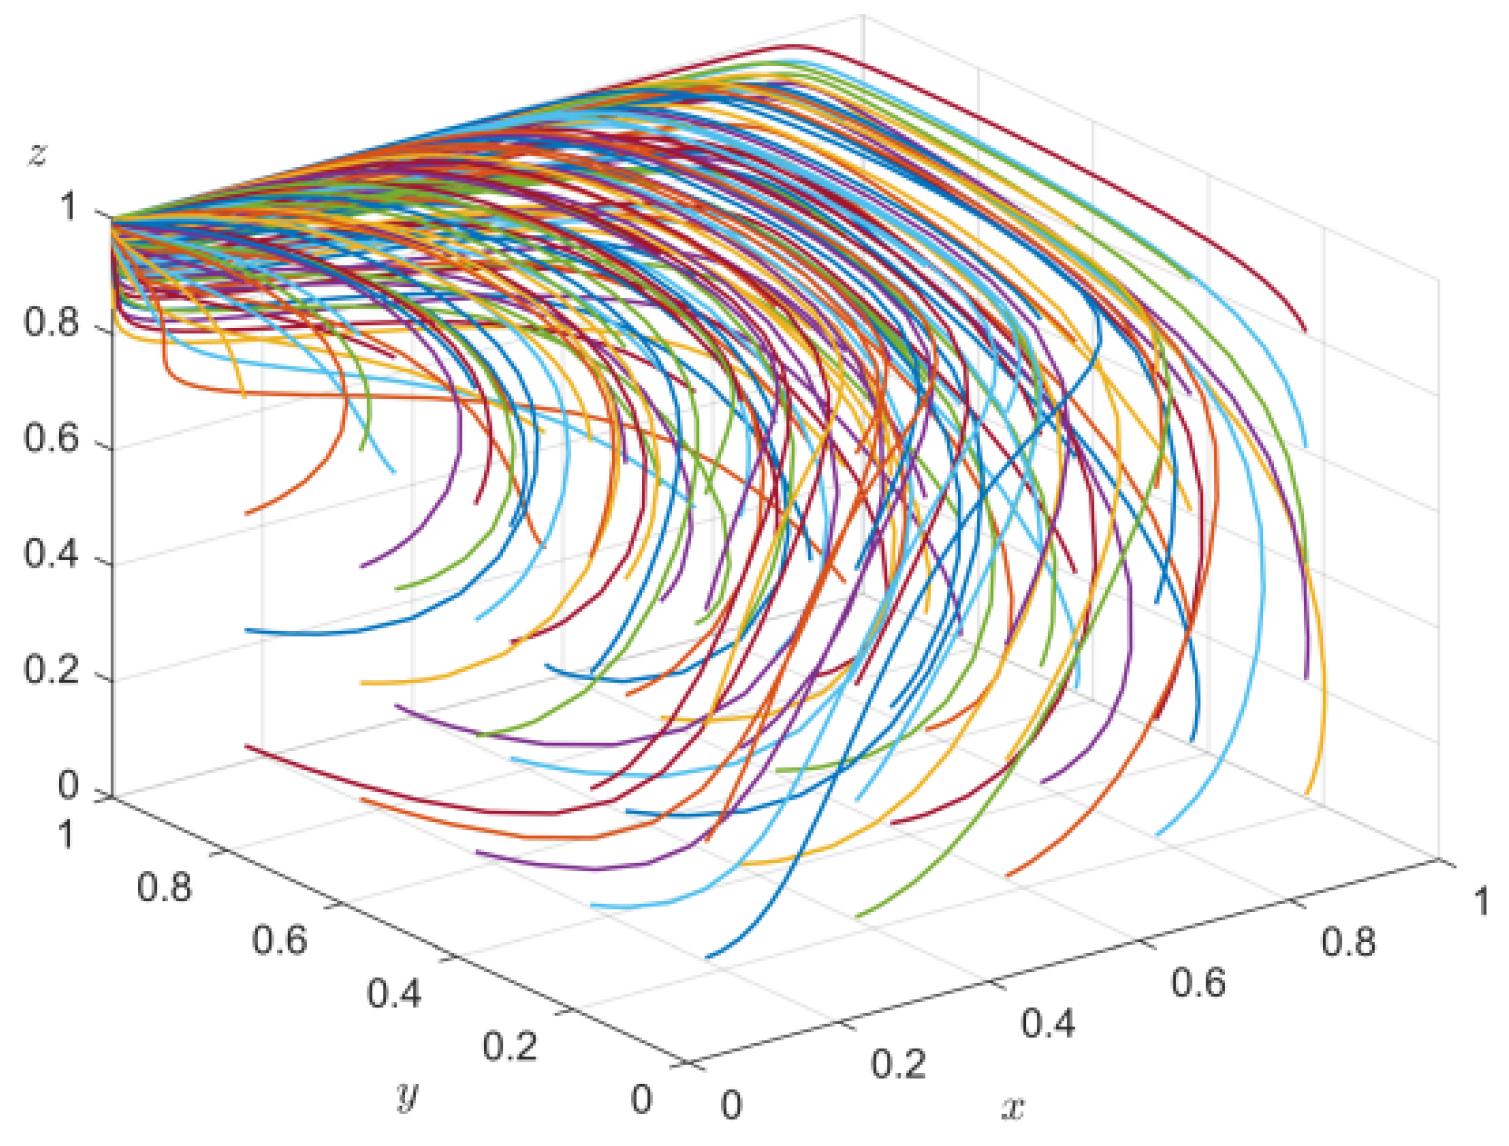
Based on the simulation results of the evolutionary game model from
Figure 5,
Figure 6,
Figure 7,
Figure 8,
Figure 9,
Figure 10,
Figure 11,
Figure 12,
Figure 13 and
Figure 14, it is observed that stakeholder strategies in the GHM dynamically adjust in response to different policy scenarios. This study systematically analyzes the influence of various policy tools on stakeholder decision-making and proposes targeted recommendations to support the sustainable development of GH.
5.1. Government Strategies for Promoting the Green Housing Market
To promote the sustainable development of the GHM, the government should take coordinated actions to support supply and demand. On the supply side, it is important to maintain steady financial investment in the construction industry, encourage low-carbon housing projects, and provide rewards for demonstration projects. The government should also improve compensation mechanisms by offering support for developers in areas such as technology and talent development. It can increase motivation and promote long-term participation in green construction. On the demand side, more financial support should be given to consumers. A unique agency could be set up to guarantee green housing mortgage loans. At the same time, financial institutions can be guided to lower down payment requirements or offer better loan interest rates. These measures can help reduce the financial pressure on consumers and encourage them to choose GH. By supporting developers and consumers, the government can actively build a low-carbon and sustainable GHM.
While the model assumes abstract strategy spaces and indirect interactions, the abstraction aligns with the bounded rationality of stakeholders. In practice, developers, consumers, and governments refine decisions by observing market outcomes rather than engaging in direct negotiations. Consequently, the evolutionary game model serves as a conceptual approximation of the real-world adaptation process, allowing researchers and policymakers to predict and understand the likely trajectories of stakeholder behavior.
5.2. Enhancing the Role of Developers in the Green Housing Market
Developers play a critical role in advancing the high-quality development of the GHM and should prioritize both technological innovation and intelligent energy management. Continuous improvement in GH technologies is essential, including actively adopting advanced equipment and construction methods and using renewable energy sources, such as solar, geothermal, wind, and biomass. By integrating intelligent construction tools, such as Building Information Modeling (BIM), developers can achieve standardized design, precise construction, digital management, and industrialized production, significantly reducing resource consumption and carbon emissions. At the same time, developers should establish comprehensive building energy consumption monitoring platforms using innovative technologies, such as BIM, big data, and the Internet of Things. These platforms enable multi-dimensional monitoring and evaluation of carbon emissions, incorporating factors such as infrastructure performance, renewable energy integration, and carbon sinks. These initiatives facilitate refined energy management and support goals such as reducing CO2 emissions by 30% by 2030 compared to 2020 levels in GH.
5.3. Empowering Consumers to Make Informed Green Choices
To promote the sustainable development of the GHM, the government must emphasize the critical role of consumers as the demand drivers. The government should intensify public education and outreach efforts to raise awareness of energy-saving, environmental protection, health, and economic benefits, thereby fostering a preference for green consumption. By leveraging mainstream media, real estate platforms, and other channels, information asymmetry can be mitigated. Furthermore, the government should refine the consumer finance support system by establishing a green housing guarantee mechanism, encouraging financial institutions to offer low-interest and low-payment green loan products, and reducing the barriers to home ownership. Simultaneously, the government should optimize finance subsidy policies through tiered subsidies, streamlined procedures, expanded coverage, and enhanced policy predictability and stability to bolster consumer confidence. Additionally, the government could establish a green consumption credit system that links green housing purchases with public services, strengthens incentive mechanisms, and fosters a positive environment for green consumption, ultimately driving the healthy and sustainable development of the GHM.
It is essential to highlight that this study treats consumers as a homogeneous group. While this assumption streamlines the analysis process, it may overlook actual variations among consumers in terms of income level, educational background, and environmental awareness. Such differences are likely to result in significant differences in consumer price sensitivity, which in turn affects their responsiveness to green housing subsidy policies. For example, high-income or environmentally conscious consumers may exhibit a greater willingness to purchase green housing, even if its cost exceeds that of traditional housing. Conversely, low-income groups may place greater emphasis on financial subsidies as a critical factor influencing their purchasing decisions. Therefore, future research could enhance the analysis framework by incorporating consumer heterogeneity variables and employing stratified modeling to characterize the behavior of different consumer segments. This approach would not only improve the precision of evaluating the effectiveness of fiscal subsidy policies but also offer more targeted recommendations for policy design.
6. Conclusions
This study examines the strategic choices of stakeholders in the GHM under the low-carbon policy, following a three-step approach. First, the interactive behaviors of stakeholders in the GHM are discussed. The study finds that stakeholders’ strategies are influenced by comparing costs and benefits, a conclusion consistent with Fan et al. [
27].
Next, the key to further research is to take a scientific method to explore the critical conditions that need to be met to reach the state of evolutionary equilibrium. It is found that the change of parameters will affect the final stability strategy. According to the product life cycle theory, the four ESS in this study correspond to the initial stage E6(1,0,1), development stage E5(1,1,0), mature stage E8(1,1,1), and stable stage E7(0,1,1) of GHM development.
Finally, MATLAB simulations and a sensitivity analysis are conducted to reveal the internal factors driving GHM development. The results show that (1) consumer subsidies have a more significant incentive effect than subsidies for developers. (2) FSs for developers place more significant financial pressure on the government compared to FSs for consumers. (3) CET policies speed up the decision-making process of developers to build green housing. (4) Appropriate taxation policies accelerate developers’ green decision-making and are critical to GHM development. (5) Reducing the green gap helps the GHM reach a stable stage. Therefore, implementing effective policies can guide stakeholder behavior in the GHM toward optimal outcomes.
Compared with earlier studies that primarily examined two-party interactions in static contexts and focused on limited policy tools or a single market stage, this study makes the following three theoretical contributions:
- (1)
It introduces a dynamic evolutionary game framework grounded in product life cycle theory, which enables the simulation of stakeholder strategies across four distinct stages of green housing market development: initial, growth, maturity, and stabilization.
- (2)
The model illustrates more complex and realistic interactions by incorporating a tripartite structure involving governments, developers, and consumers. It further considers the combined effects of multiple low-carbon policy instruments.
- (3)
The parameter design reflects economic conditions accurately by including variables such as the green gap, unsold housing risks, and fluctuating carbon prices.
However, due to time constraints and the limitations of the simulation, this study only considers quantifiable and research-based variables in model development. The actual market environment is more complex than what is captured in mathematical simulations, and other factors may also influence stakeholder strategic decisions. Future research should explore the impact of these objective social factors, as addressing this will be crucial for policymakers and enterprise managers when formulating management strategies.


