
Characterisation of Faecal Sludge from Different Nature-Based Treatment Processes for Agricultural Application


Abstract

1. Introduction
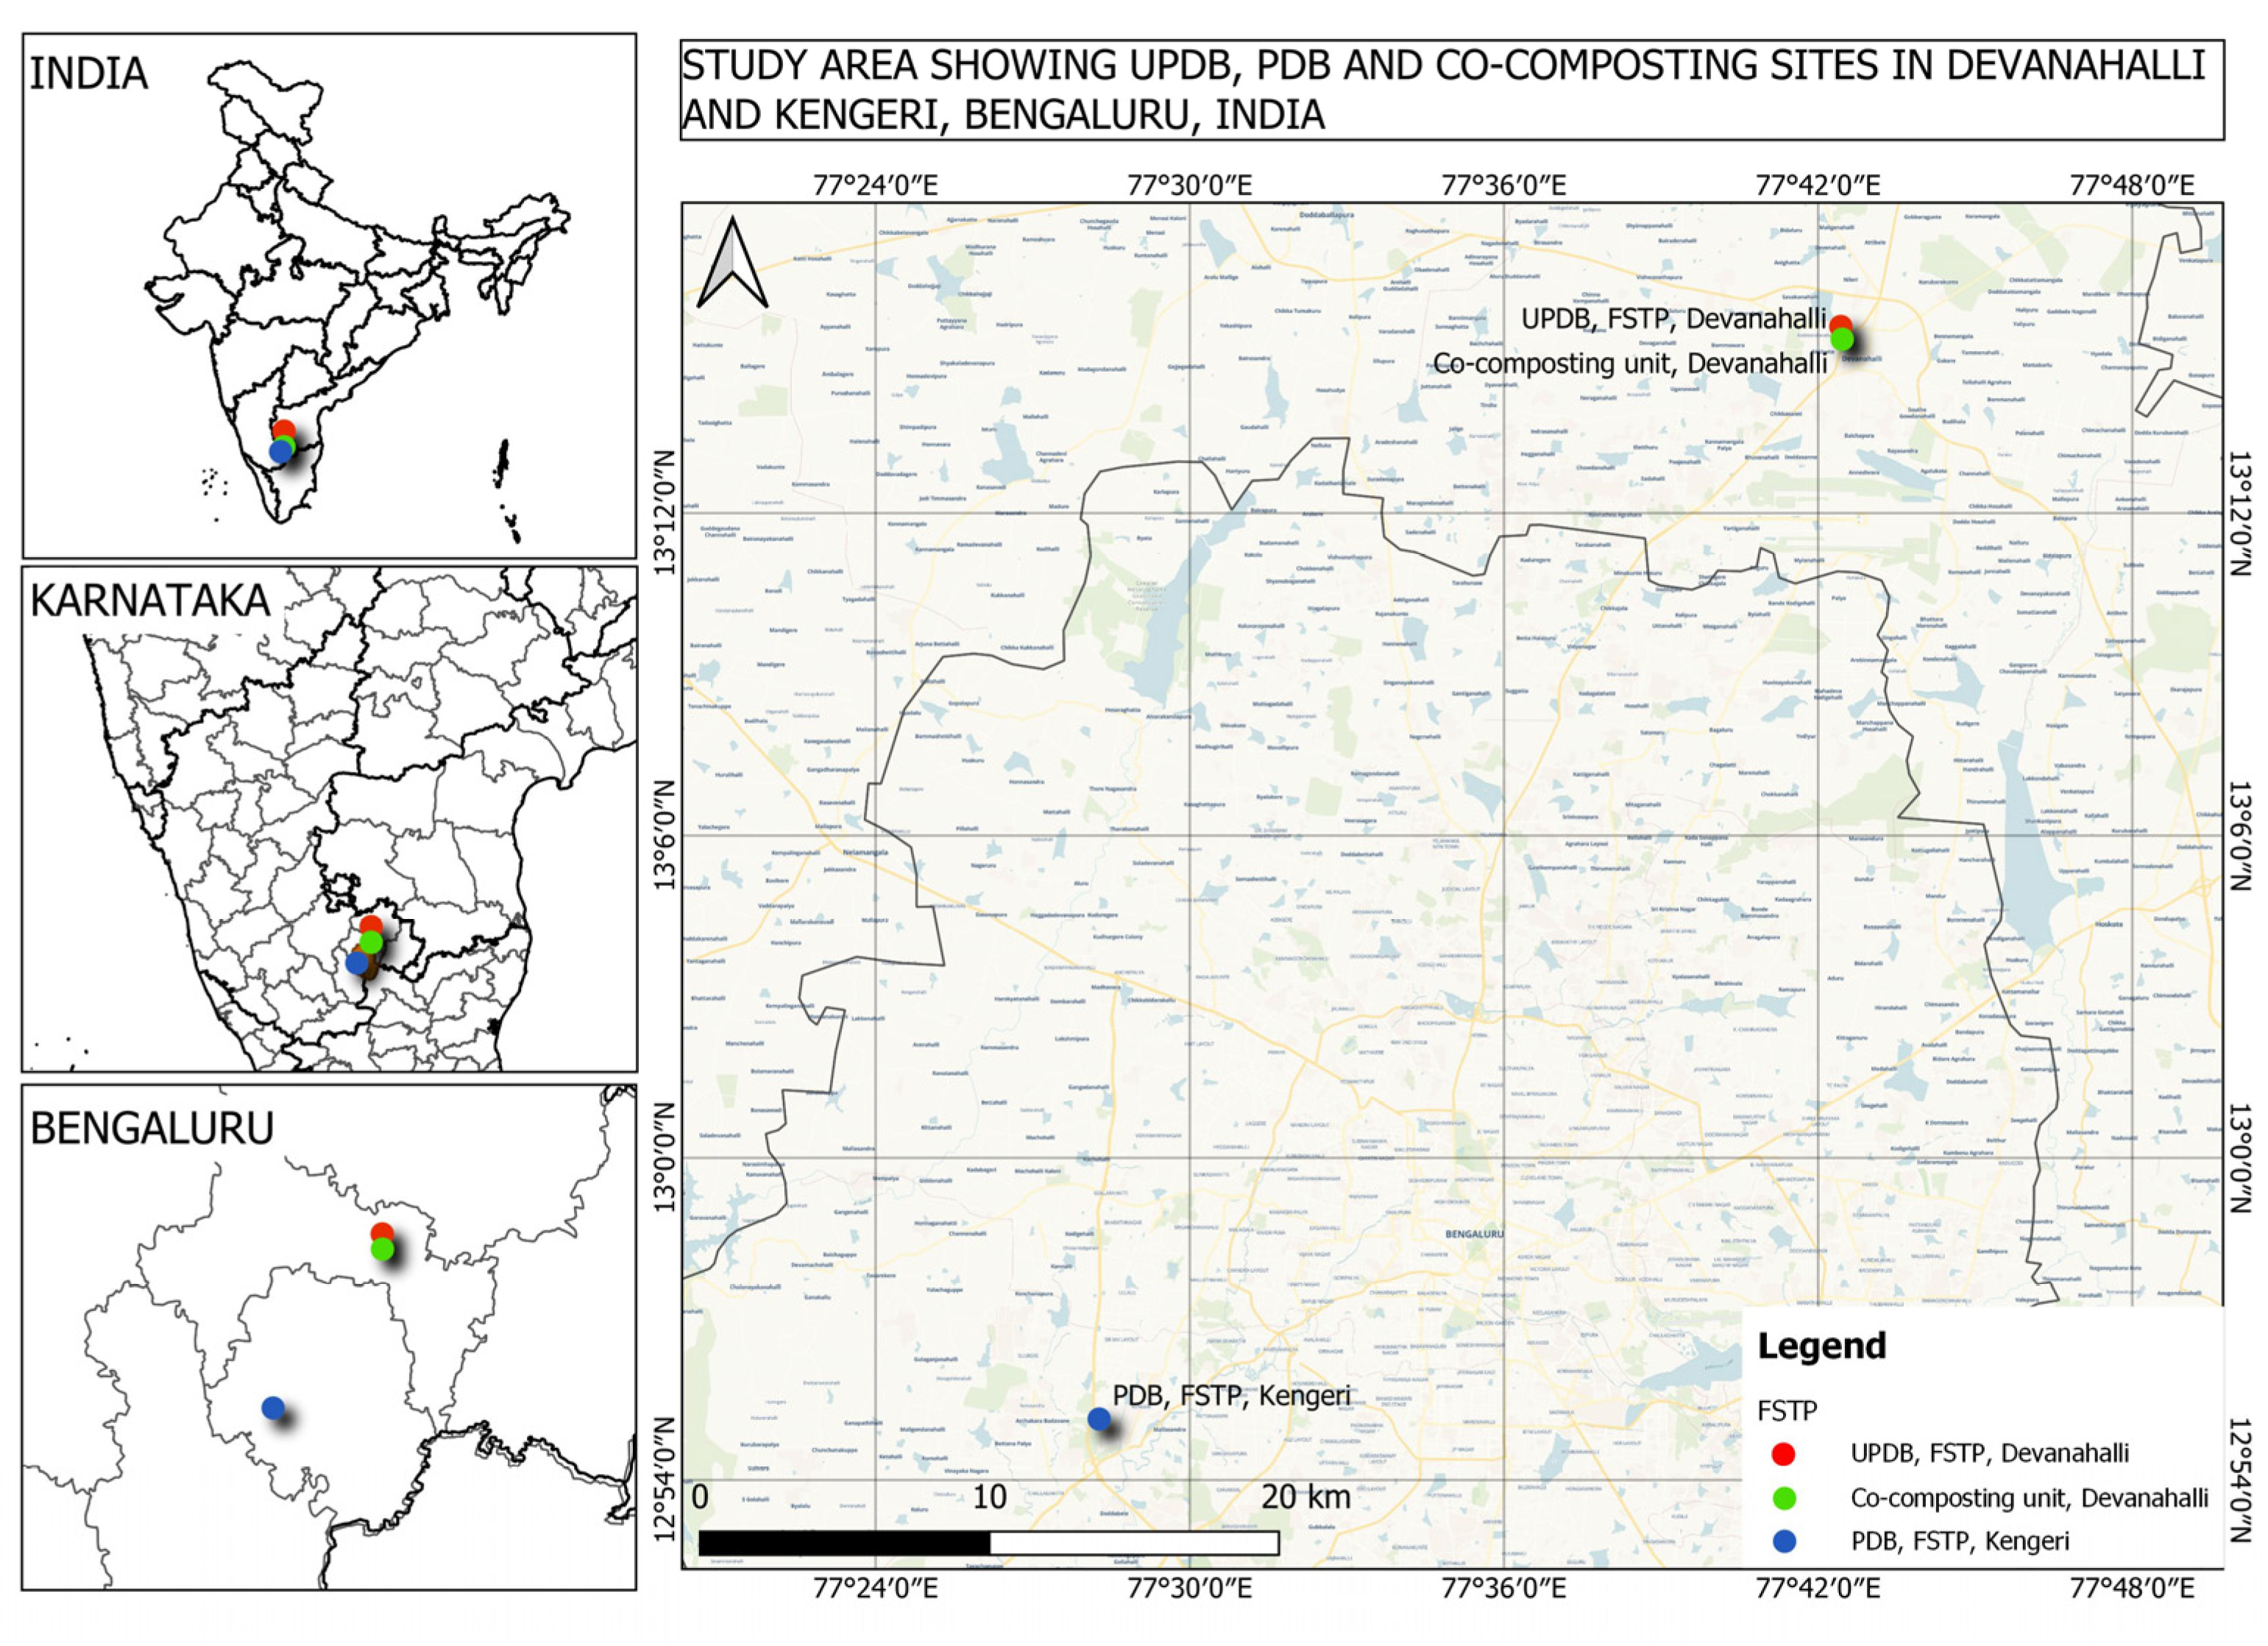
2. Materials and Methods
2.1. Treatment Processes
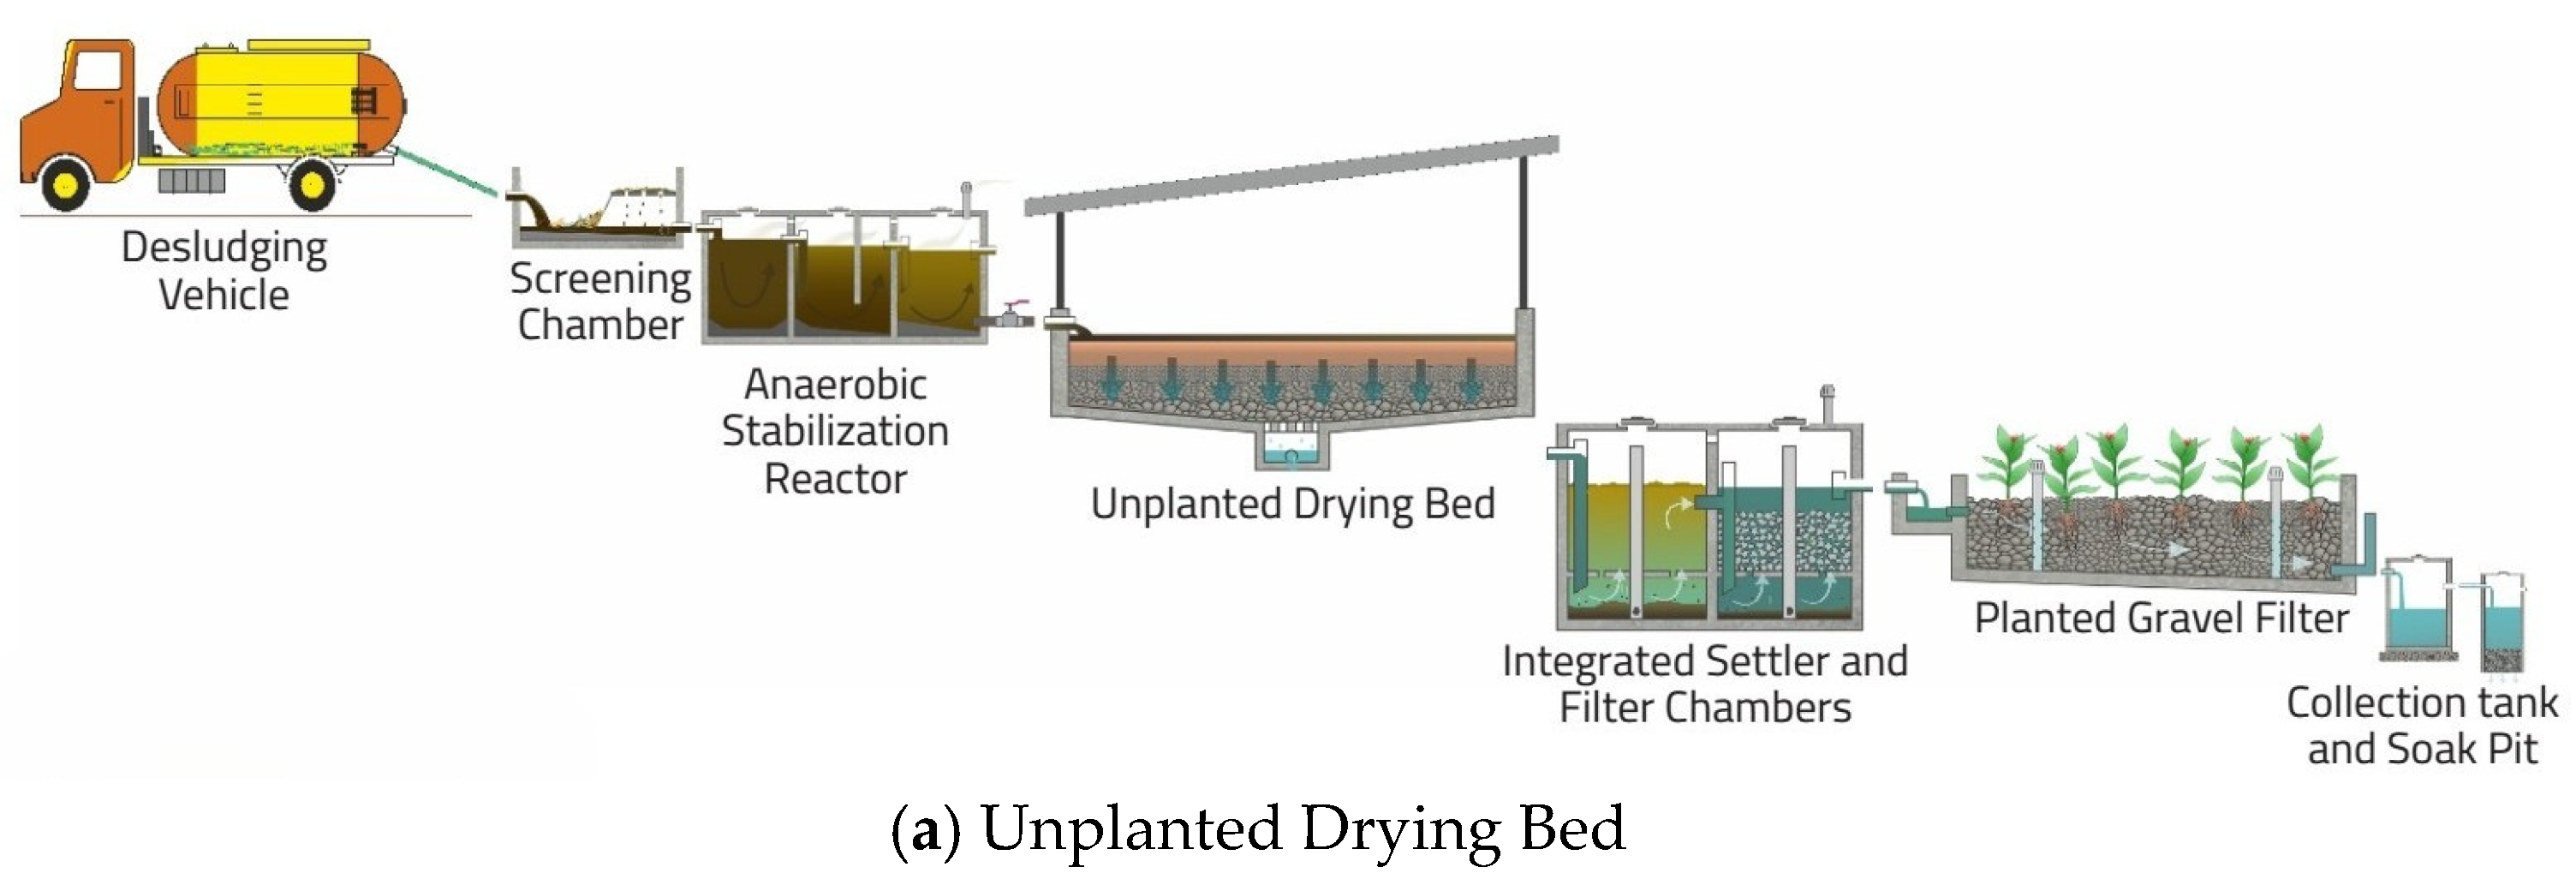
2.1.1. Unplanted Drying Bed (UPDB)
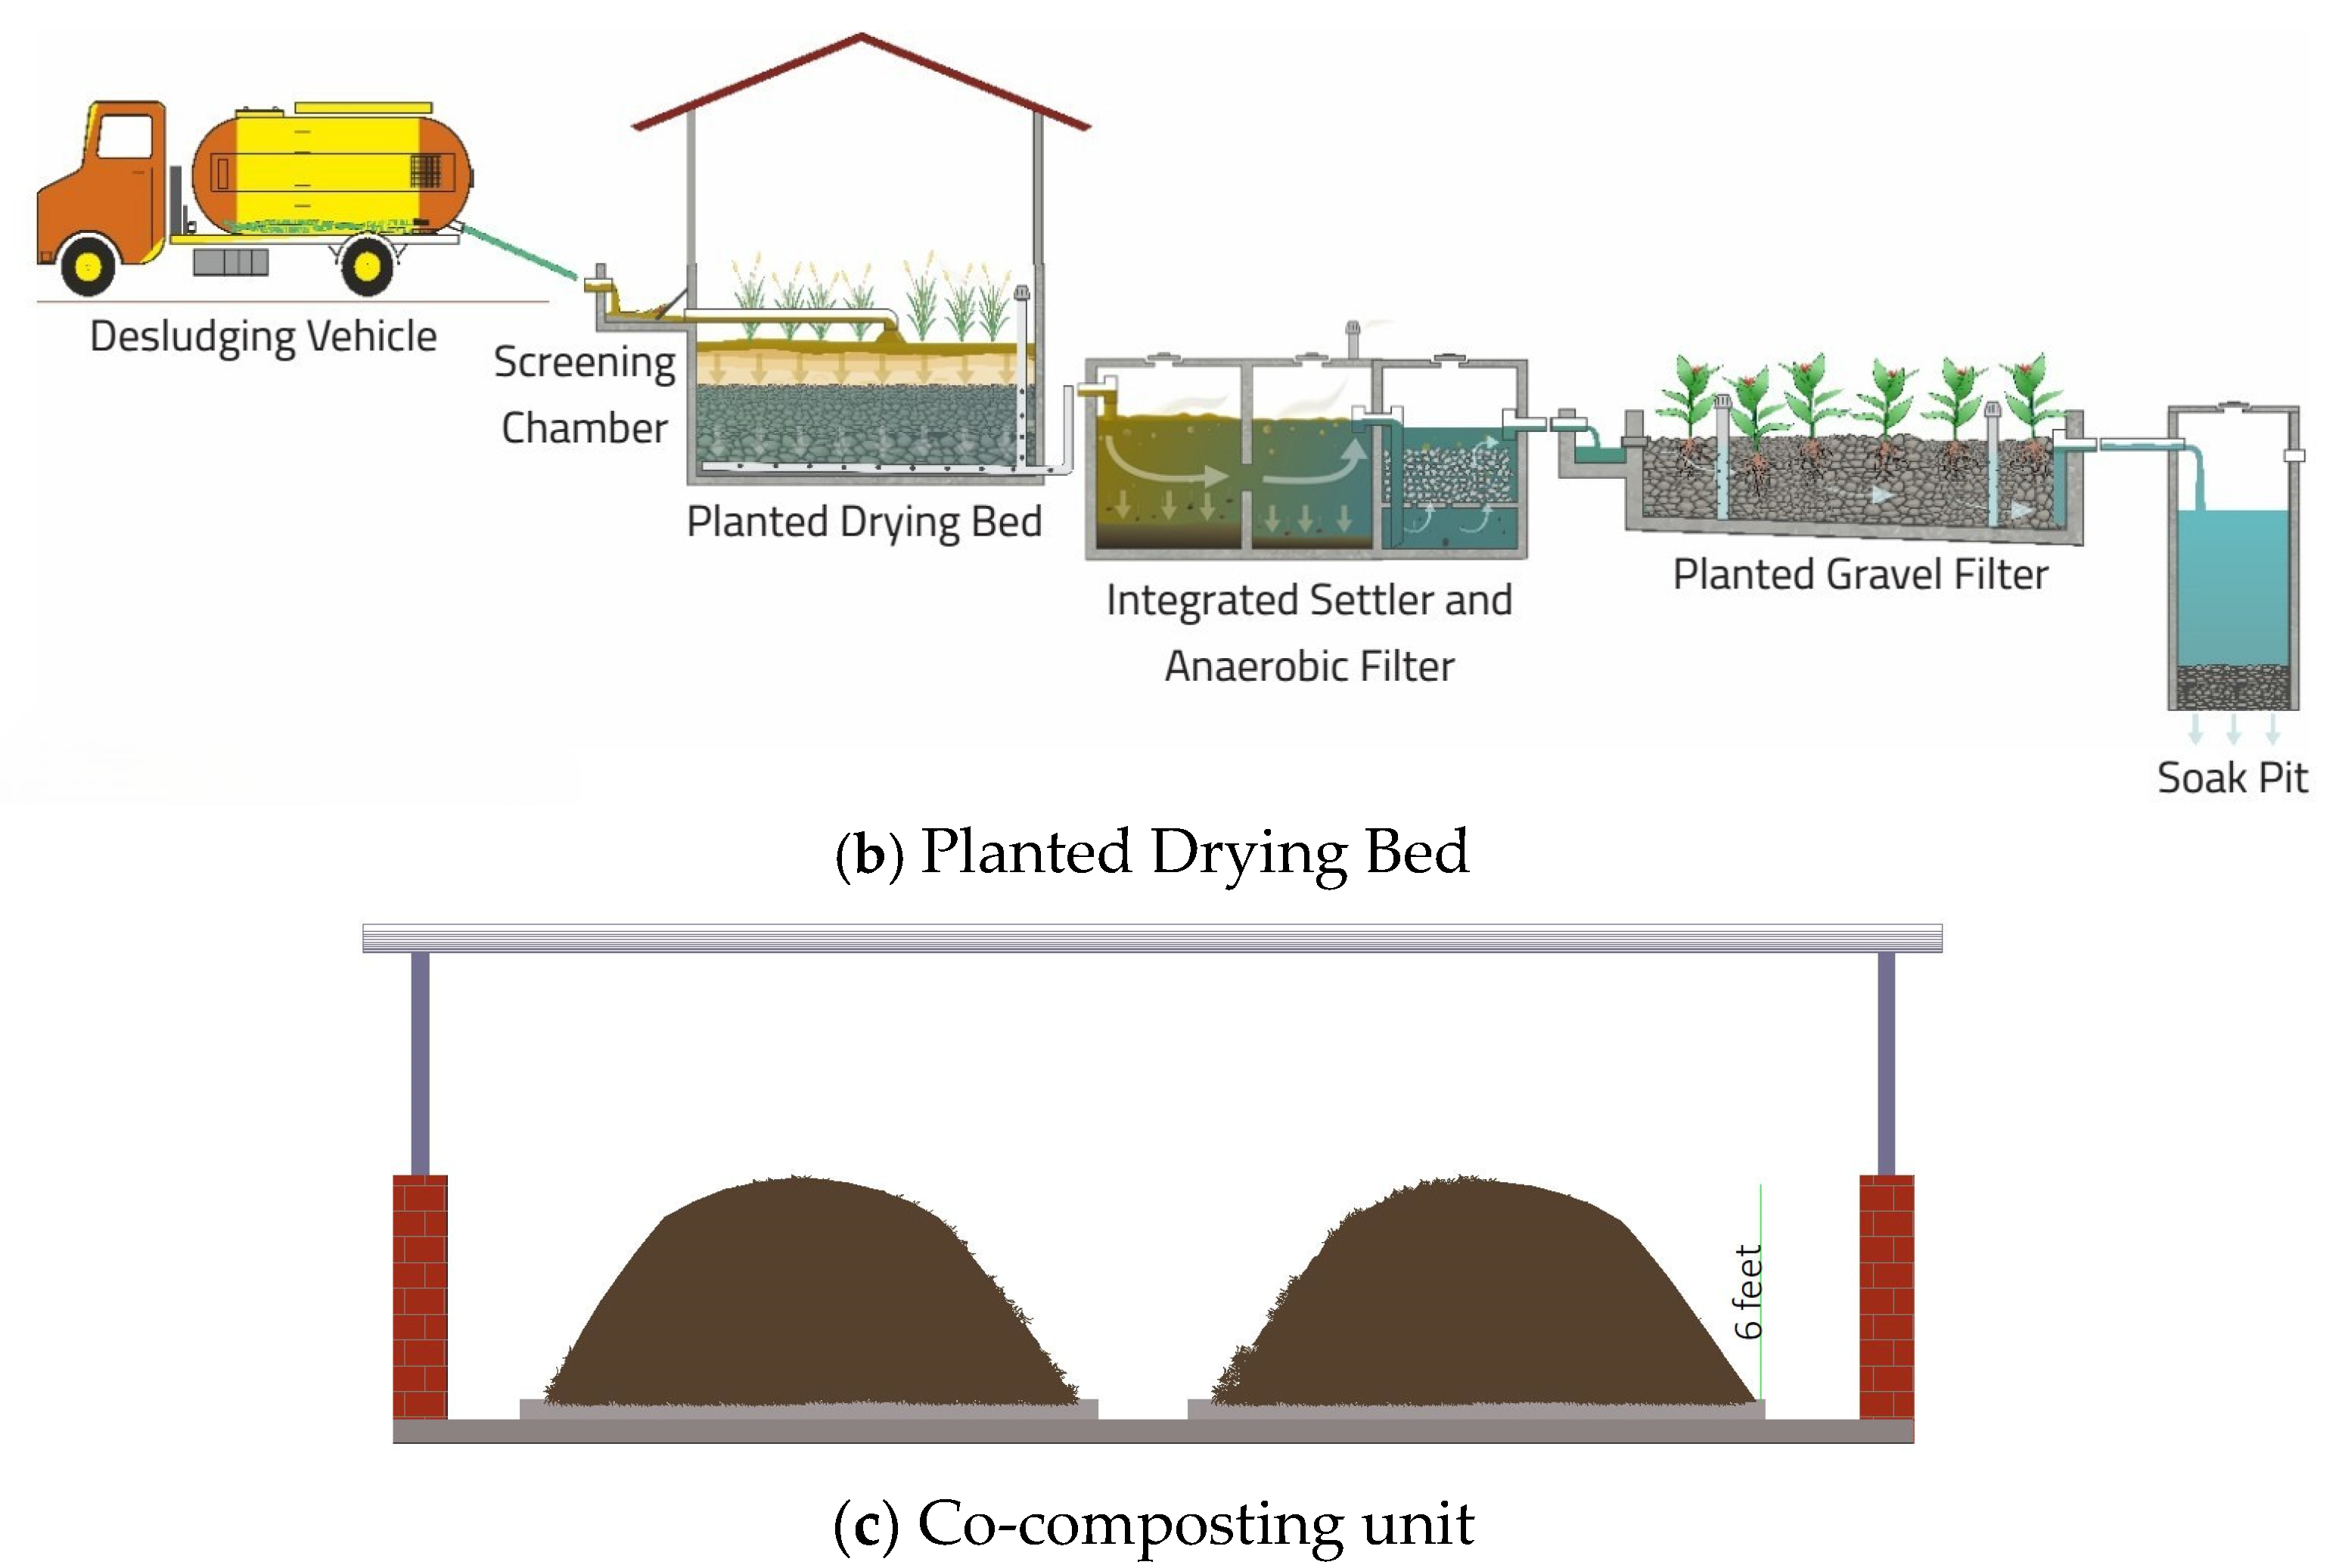
2.1.2. Planted Drying Bed (PDB)
2.1.3. Co-Composting
2.2. Sampling
2.3. Analytical Methods
2.4. Statistical Analysis
3. Results and Discussion
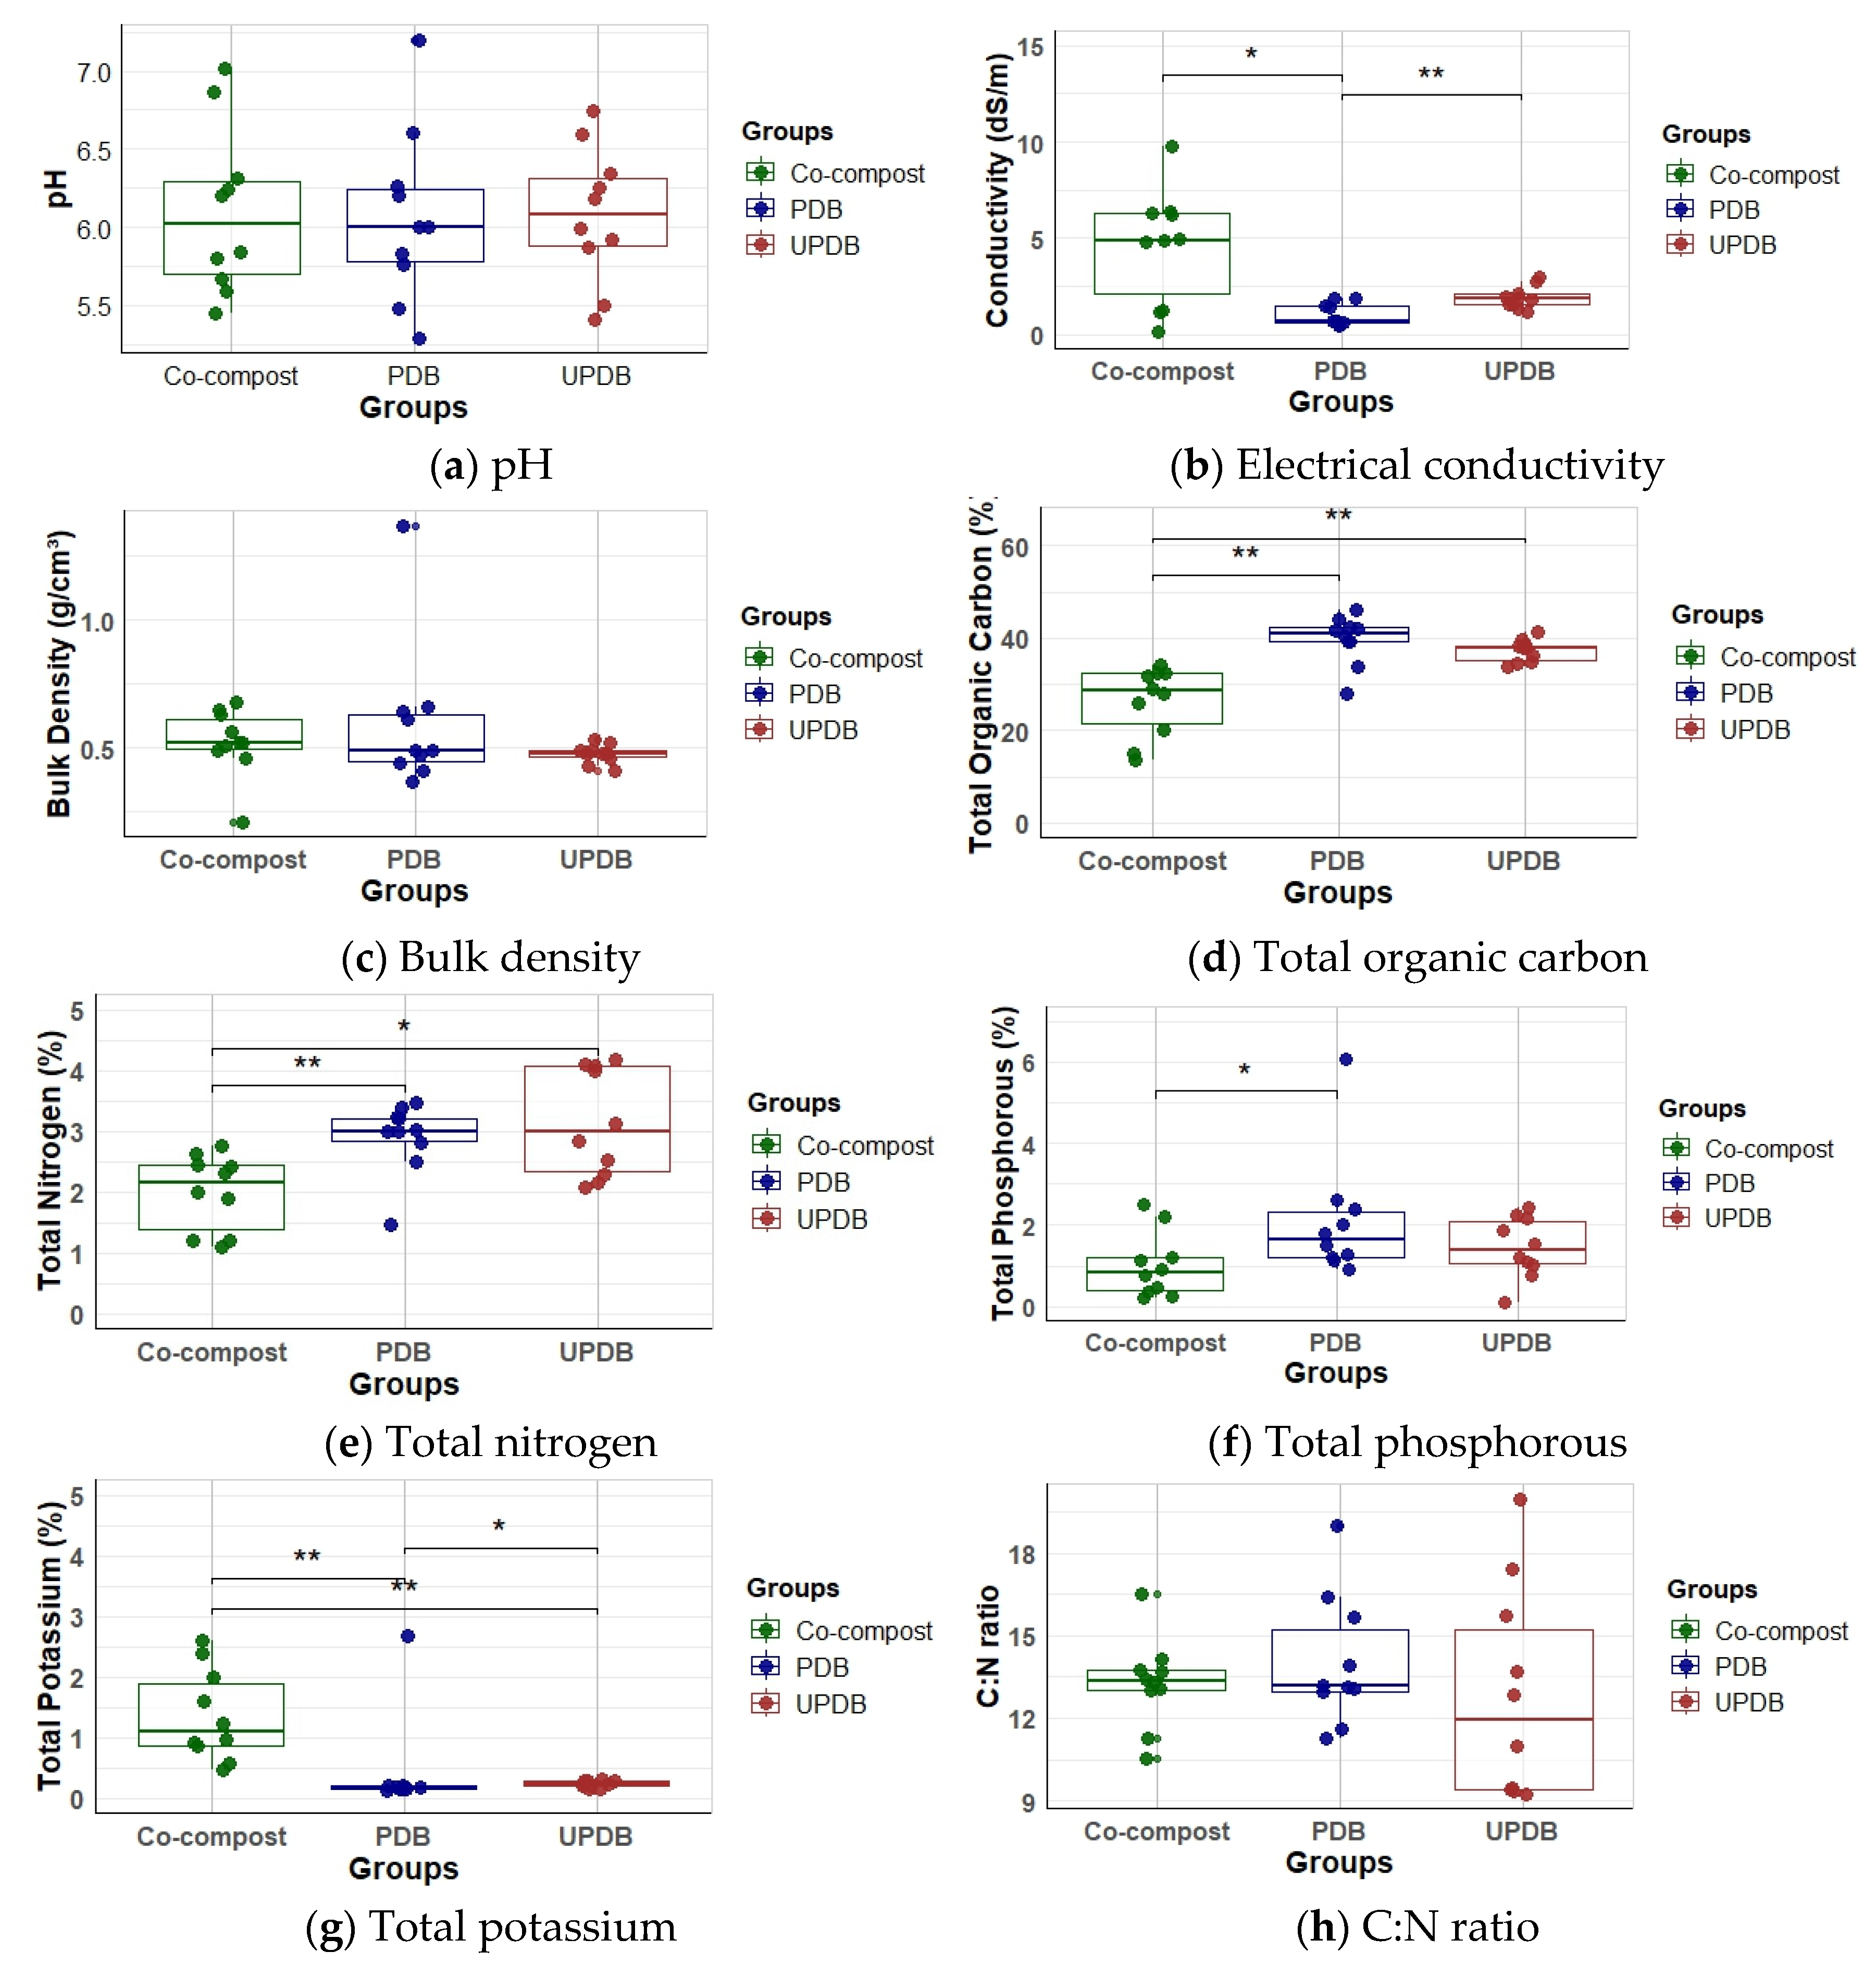
3.1. Characterisation of Faecal Sludge
3.2. Critical Parameters for Soil Application
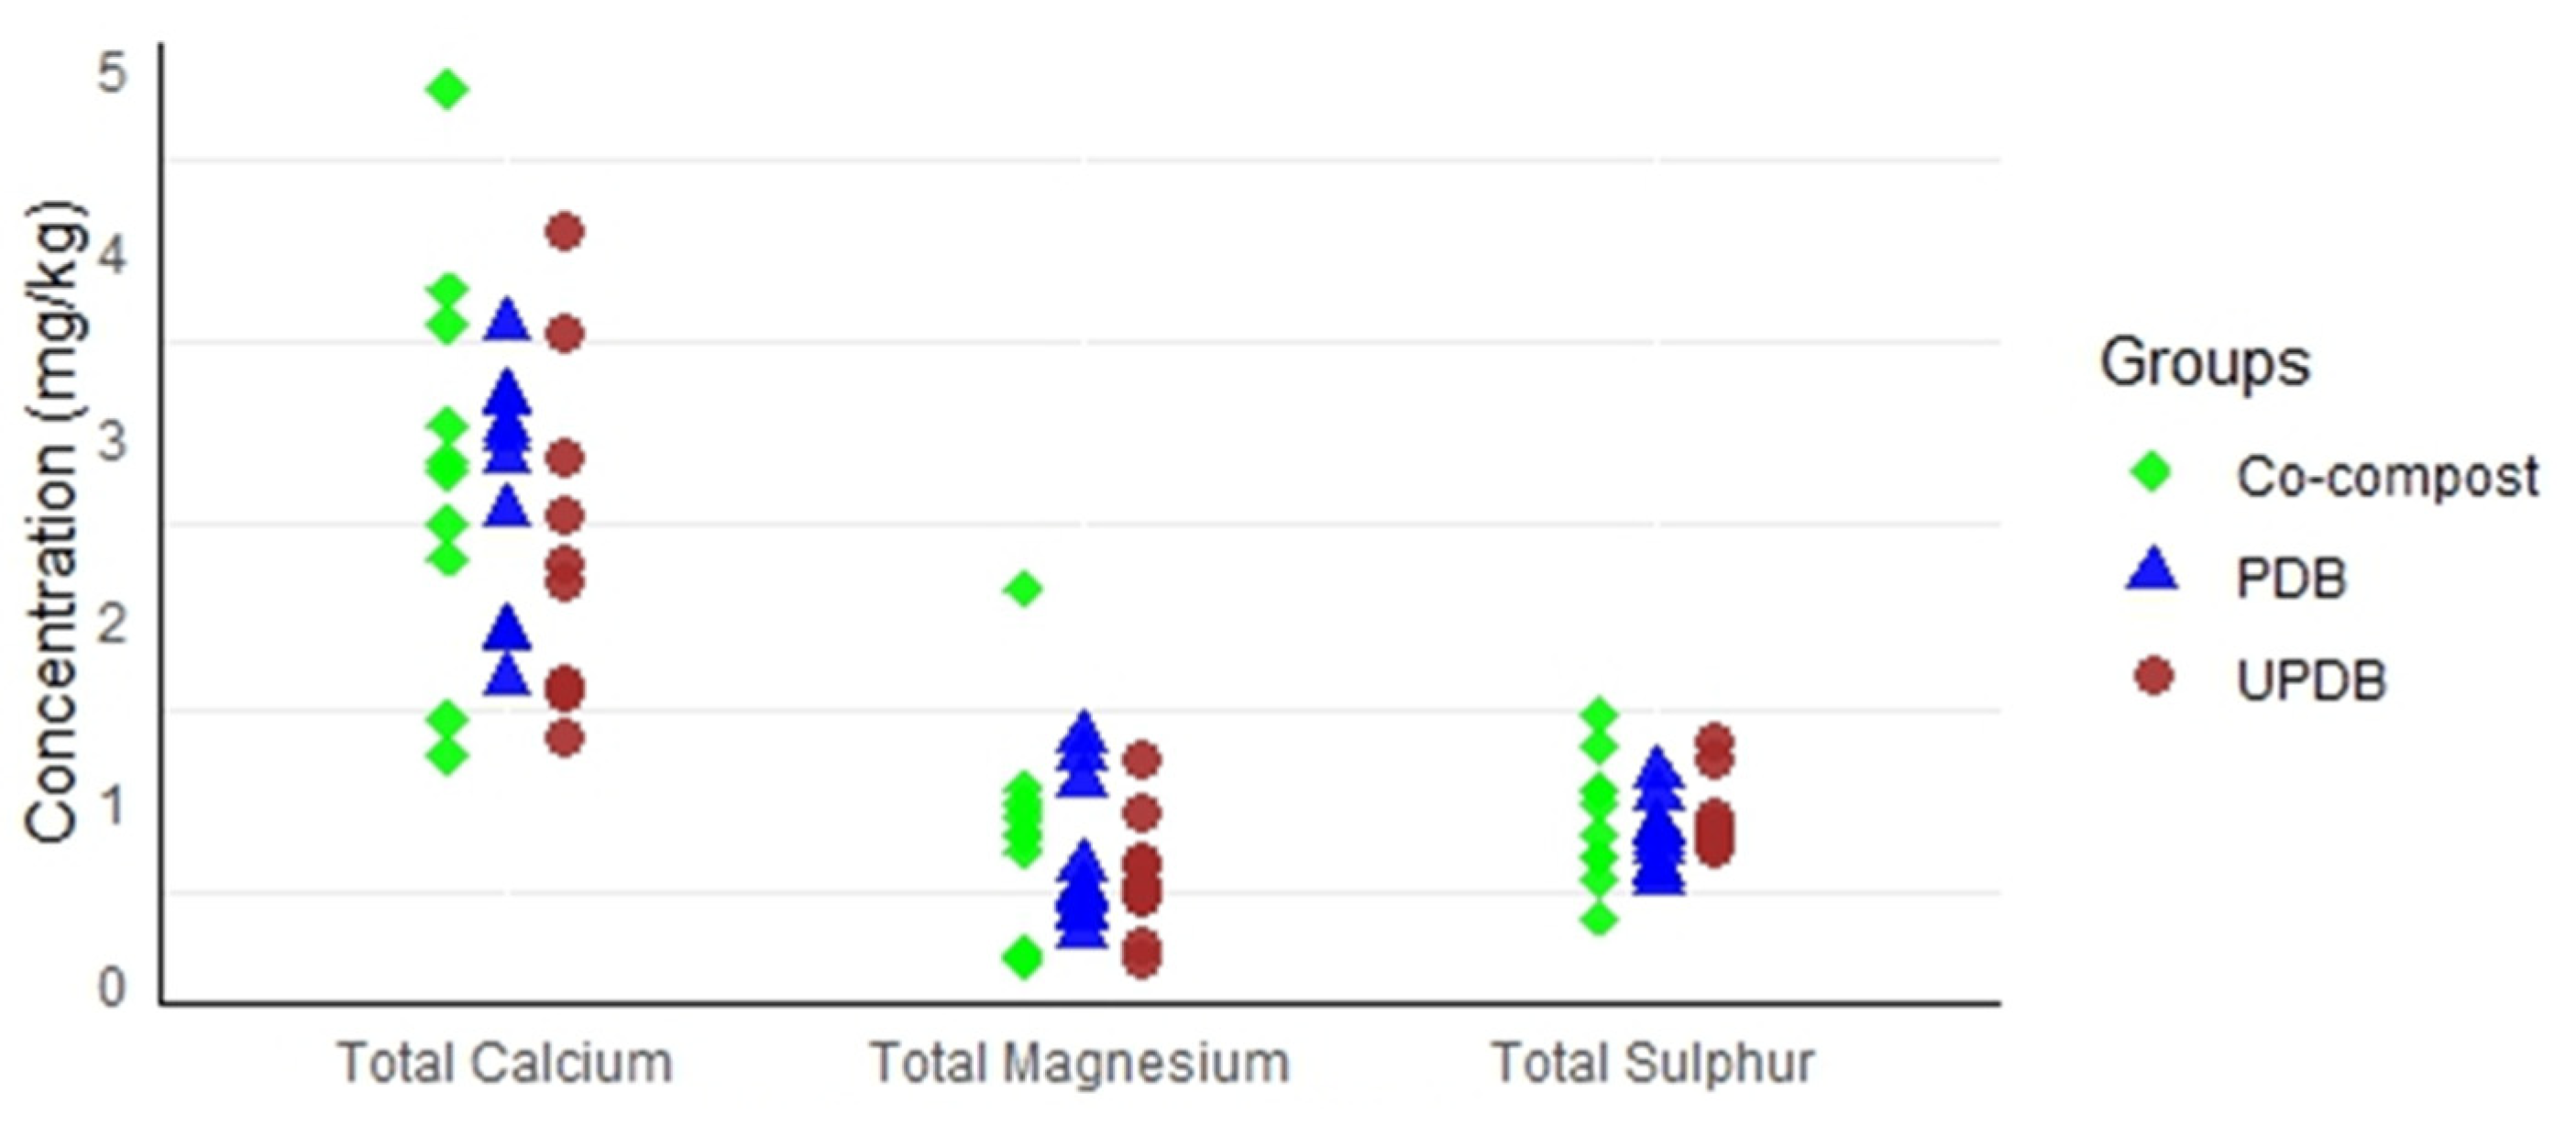
3.3. Secondary Macronutrients
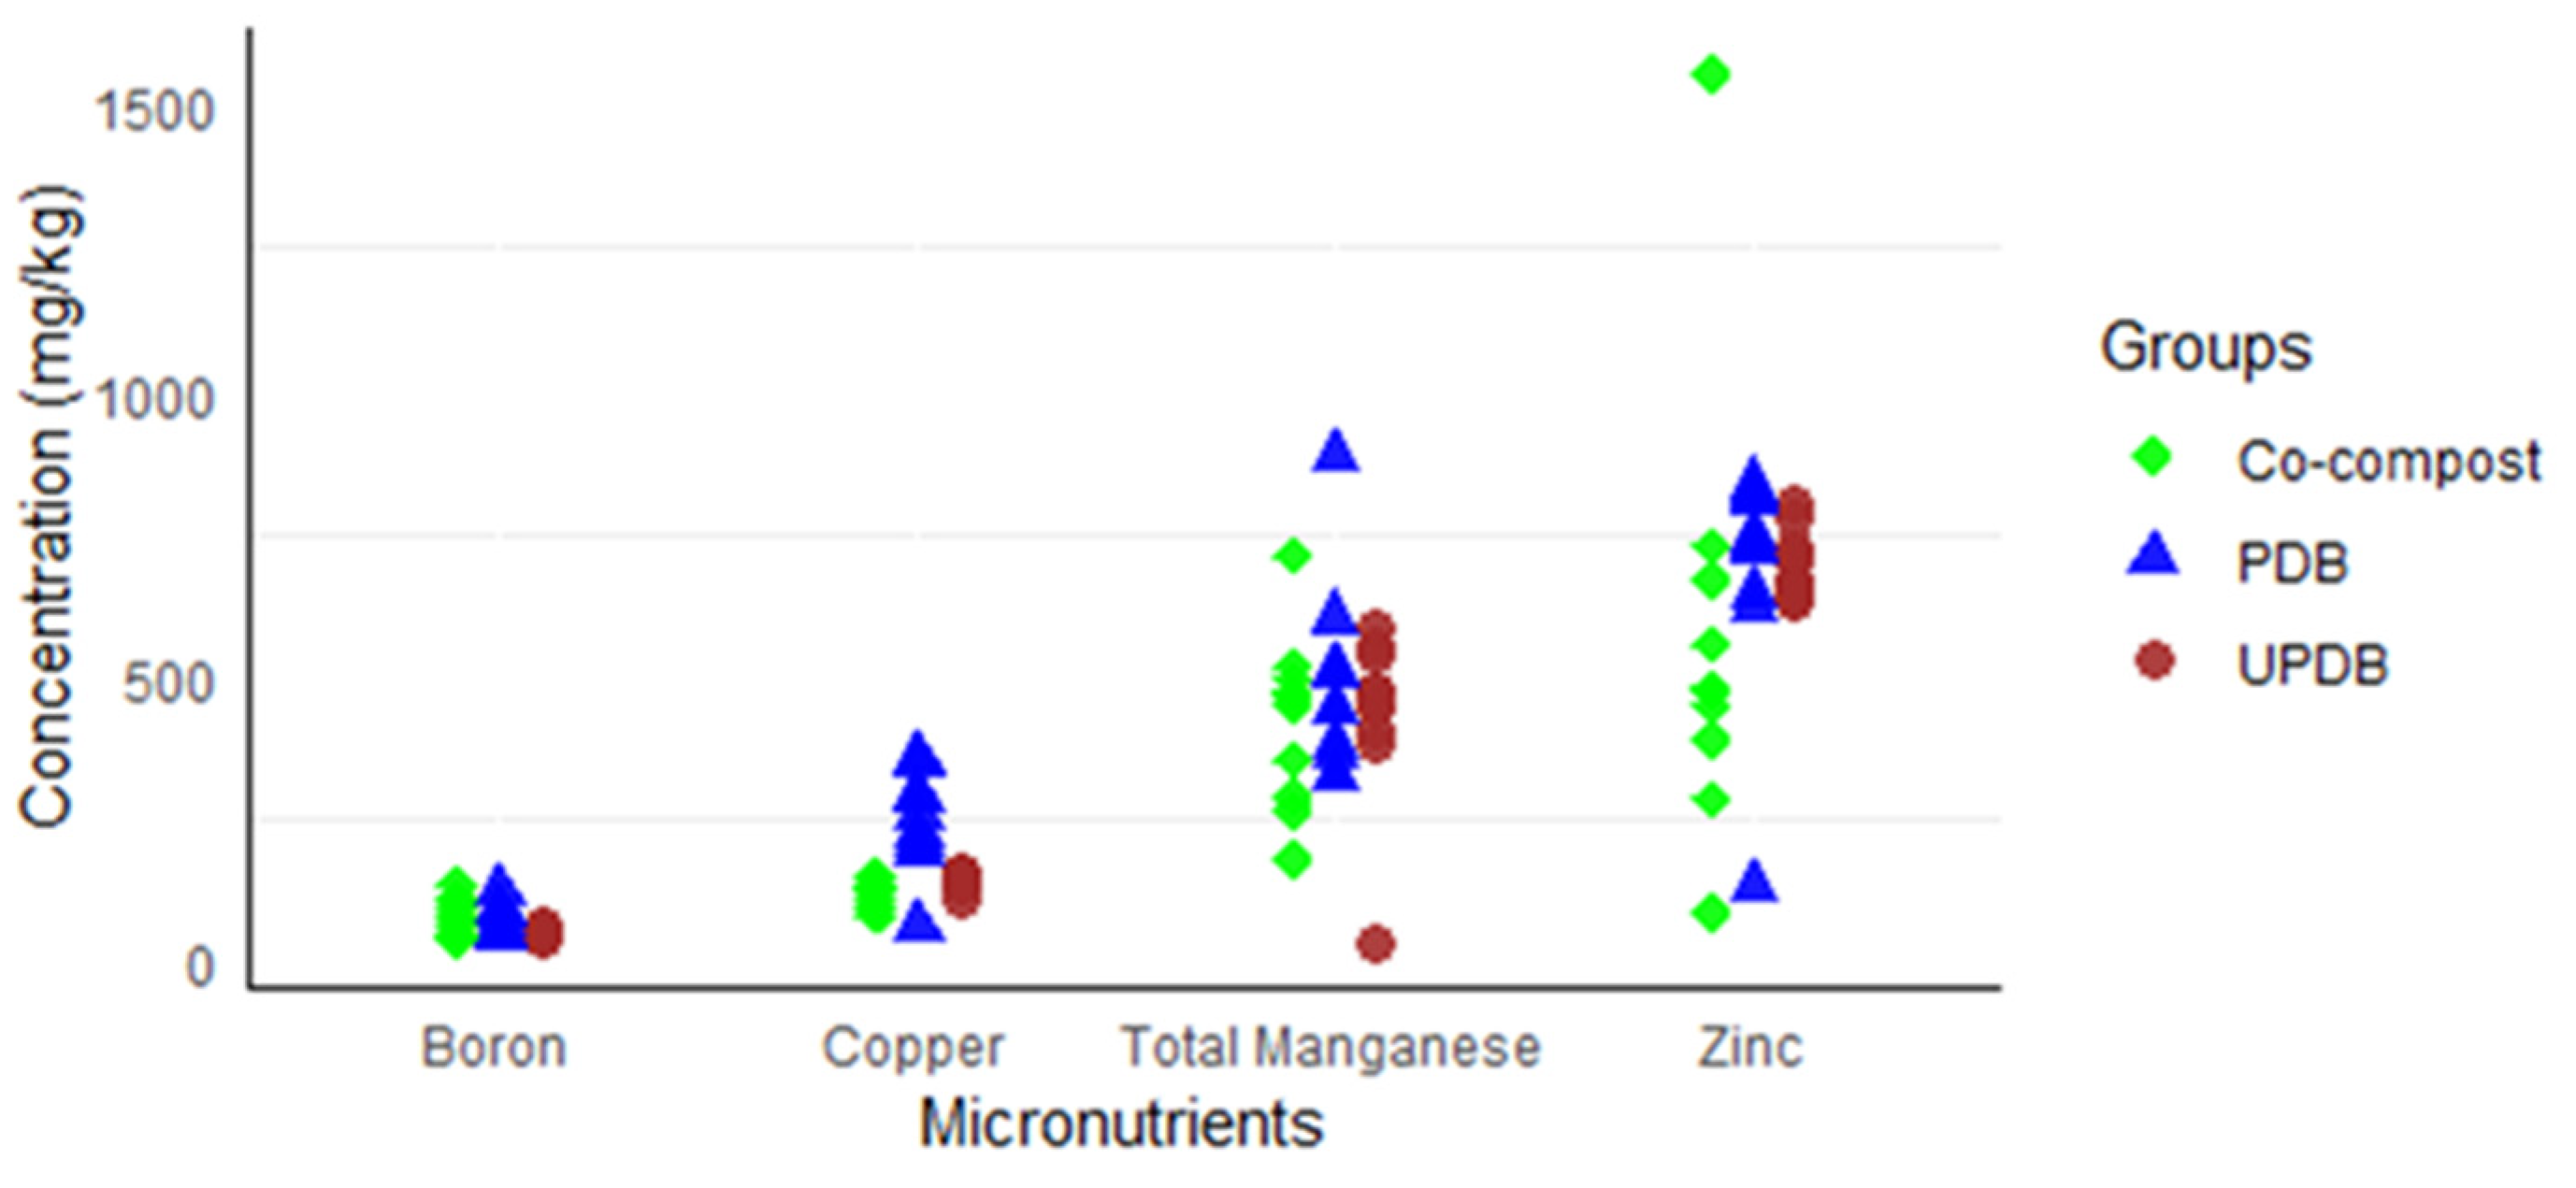
3.4. Micronutrients
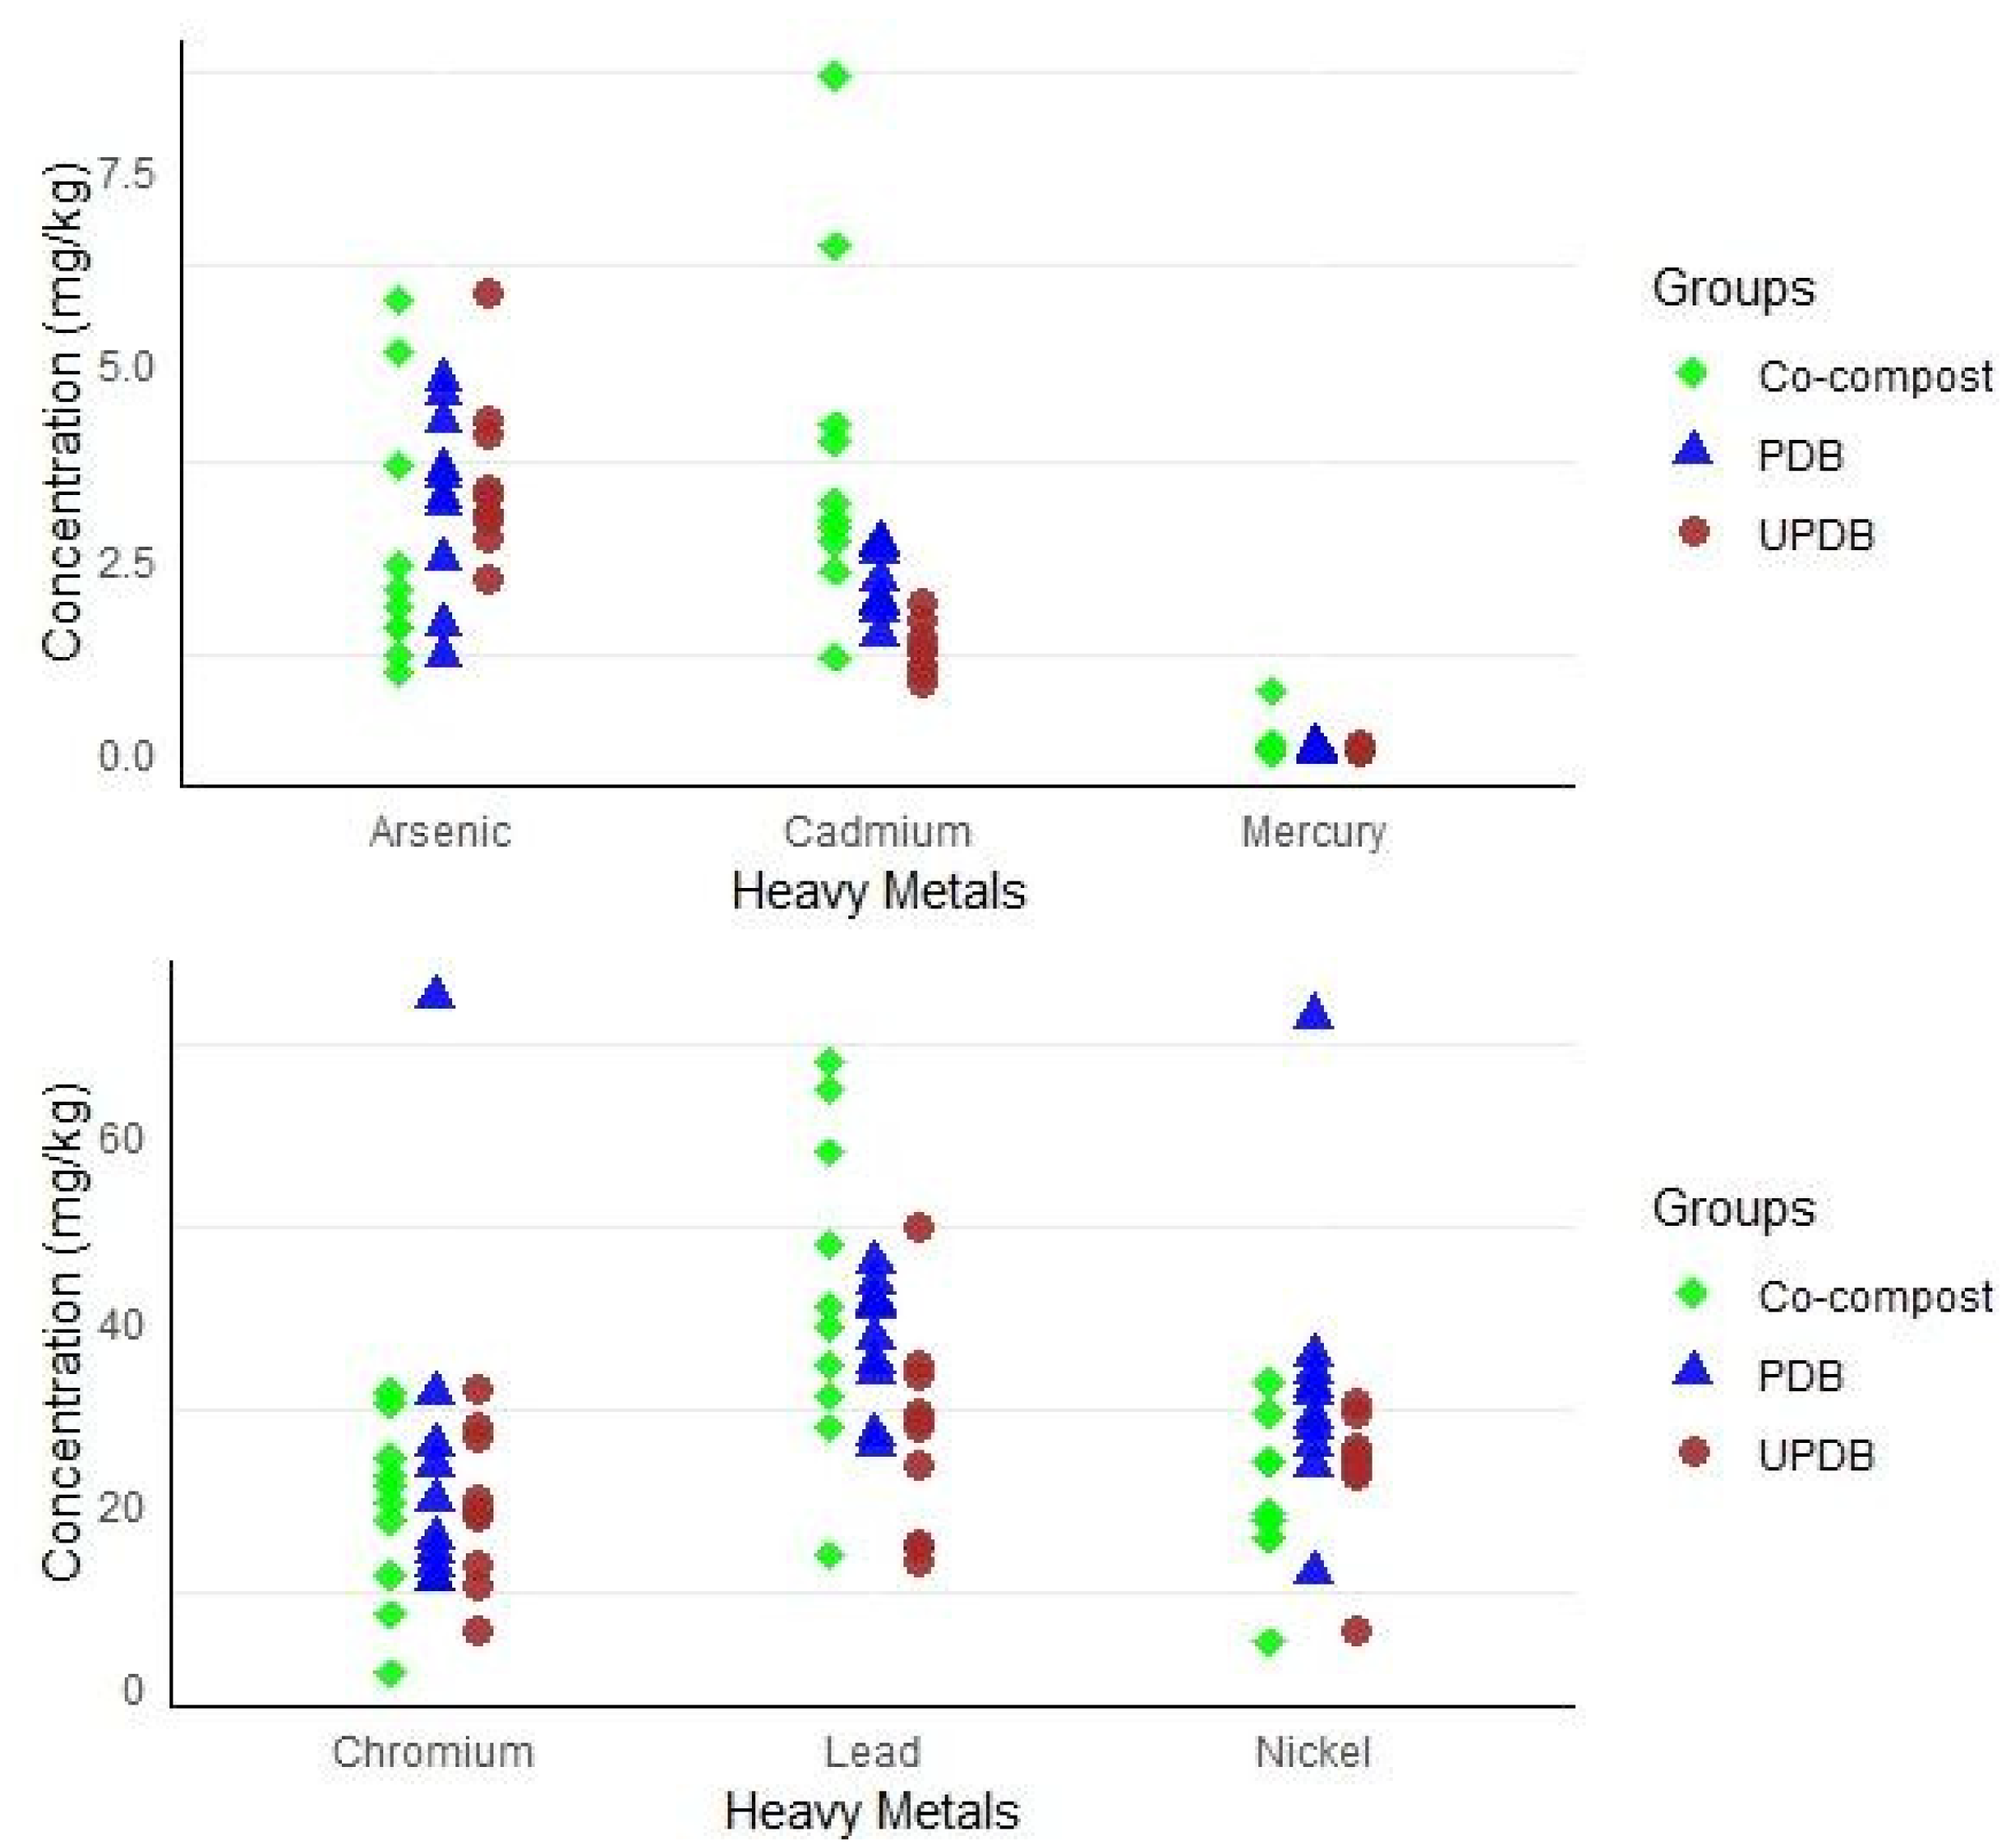
3.5. Heavy Metals
4. Conclusions
Supplementary Materials
Author Contributions
Funding
Institutional Review Board Statement
Informed Consent Statement
Data Availability Statement
Acknowledgments
Conflicts of Interest
Abbreviations
| FS | Faecal sludge |
| UPDB | Unplanted drying bed |
| PDB | Planted drying bed |
References
- World Health Organisation (WHO) United Nations Children’s Fund (UNICEF). Progress on Household Drinking Water, Sanitation and Hygiene 2000–2022: Special Focus on Gender; WHO and UNICEF Joint Monitoring Programme (JMP): Geneva, Switzerland, 2023. Available online: https://www.who.int/publications/m/item/progress-on-household-drinking-water--sanitation-and-hygiene-2000-2022---special-focus-on-gender (accessed on 15 January 2025).
- Singh, S.; Raju, N.J.; Mehmood, G.; Gupta, S.K.; Ahmed, S. A review of the current scenario and best possible solution for fecal sludge management (FSM) in India. Groundw. Sustain. Dev. 2024, 27, 101346. [Google Scholar] [CrossRef]
- Ministry of Jal Shakti, Department of Drinking Water and Sanitation. Swachh Bharat Mission (Gramin) 2.0 Dashboard. Available online: https://sbm.gov.in/sbmgdashboard/statesdashboard.aspx (accessed on 20 January 2025).
- Zewde, A.A.; Li, Z.; Xiaoqin, Z. Improved and promising faecal sludge sanitising methods: Treatment of faecal sludge using resource recovery technologies. J. Water Sanit. Hyg. Dev. 2021, 11, 335–349. [Google Scholar] [CrossRef]
- Jain, M.; Upadhyay, M.; Gupta, A.K.; Ghosal, P.S. A review on the treatment of septage and faecal sludge management: A special emphasis on constructed wetlands. J. Environ. Manag. 2022, 315, 115143. [Google Scholar] [CrossRef] [PubMed]
- Hülsmann, S.; Jampani, M. The nexus approach as a tool for resources management in resilient cities and multifunctional land-use systems. In A Nexus Approach for Sustainable Development: Integrated Resources Management in Resilient Cities and Multifunctional Land-Use Systems; Springer International Publishing: Cham, Switzerland, 2020; pp. 1–13. [Google Scholar] [CrossRef]
- Suryakumar, A.K.R.; Parra-Angarita, S.L.; Léonard, A.; Pocock, J.; Septien, S. Mechanical Properties of Faecal Sludge and Its Influence on Moisture Retention. Chemengineering 2024, 9, 2. [Google Scholar] [CrossRef]
- Nicholas, H.; Winrow, E.; Devine, A.; Robertson, I.; Mabbett, I. Faecal sludge pyrolysis as a circular economic approach to waste management and nutrient recovery. Environ. Dev. Sustain. 2023, 27, 5893–5924. [Google Scholar] [CrossRef]
- Jothinathan, H.; Singh, A.P. Faecal sludge characterisation, treatment, and resource recovery options: A state-of-the-art review on faecal sludge management. Environ. Sci. Pollut. Res. 2023, 30, 119549–119567. [Google Scholar] [CrossRef]
- Chandana, N.; Rao, B. Evaluating the Physicochemical, Nutrient, and Pathogenic Characteristics of Fecal Sludge for Fertilizer Application: Case from Vadgaon Maval, Maharashtra, India. J. Environ. Eng. 2021, 147, 04021003. [Google Scholar] [CrossRef]
- Krueger, B.C.; Fowler, G.D.; Templeton, M.R. Critical analytical parameters for faecal sludge characterisation informing the application of thermal treatment processes. J. Environ. Manag. 2021, 280, 111658. [Google Scholar] [CrossRef]
- Strande, L.; Schoebitz, L.; Bischoff, F.; Ddiba, D.; Okello, F.; Englund, M.; Ward, B.J.; Niwagaba, C.B. Methods to reliably estimate faecal sludge quantities and qualities for the design of treatment technologies and management solutions. J. Environ. Manag. 2018, 223, 898–907. [Google Scholar] [CrossRef]
- Englund, M.; Carbajal, J.P.; Ferré, A.; Bassan, M.; Vu, A.T.H.; Nguyen, V.-A.; Strande, L. Modelling quantities and qualities (Q&Q) of faecal sludge in Hanoi, Vietnam and Kampala, Uganda for improved management solutions. J. Environ. Manag. 2020, 261, 110202. [Google Scholar] [CrossRef]
- Doglas, B.; Kimwaga, R.; Mayo, A. Variability of faecal sludge characteristics and its implication for dewaterability across different on-site sanitation containments in unplanned settlements in Dar es Salaam, Tanzania. Water Pract. Technol. 2021, 16, 1182–1193. [Google Scholar] [CrossRef]
- Samal, K.; Moulick, S.; Mohapatra, B.G.; Samanta, S.; Sasidharan, S.; Prakash, B.; Sarangi, S. Design of faecal sludge treatment plant (FSTP) and availability of its treatment technologies. Energy Nexus 2022, 7, 100091. [Google Scholar] [CrossRef]
- Chandana, N.; Rao, B. Assessing inter and intra-variation in the characteristics of faecal sludge from Vadgaon Maval, Maharashtra: For better faecal sludge management in India. J. Environ. Manag. 2021, 300, 113634. [Google Scholar] [CrossRef] [PubMed]
- Tchobanoglous, G.; Burton, F.L.; Stensel, H.D. Metcalf Eddy wastewater engineering: Treatment and reuse. Am. Water Work. Assoc. J. 2003, 95, 201. [Google Scholar]
- Velkushanova, K.; Brdjanovic, D.; Koottatep, T.; Strande, L.; Buckley, C.; Ronteltap, M. Methods for Faecal Sludge Analysis; IWA publishing: London, UK, 2021. [Google Scholar]
- Manga, M.; Evans, B.E.; Ngasala, T.M.; Camargo-Valero, M.A. Recycling of Faecal Sludge: Nitrogen, Carbon and Organic Matter Transformation during Co-Composting of Faecal Sludge with Different Bulking Agents. Int. J. Environ. Res. Public Health 2022, 19, 10592. [Google Scholar] [CrossRef] [PubMed]
- Bremner, J.M. Nitrogen-Total. In Methods of Soil Analysis, Part 3 Chemical Methods; Sparks, D.L., Ed.; SSSA Book Series 5.3; Soil Science Society of America: Madison, WI, USA, 1996; pp. 1085–1122. [Google Scholar] [CrossRef]
- Fertiliser India. Fertiliser Control Order 1985 (as Amended Up to November 2023). Ministry of Chemicals and Fertilizers, Government of India. 2023. Available online: https://www.scribd.com/document/849712527/Fco-Book-Amended-Up-to-November-2023 (accessed on 24 April 2025).
- Motsara, M.R.; Roy, R.N. Guide to Laboratory Establishment for Plant Nutrient Analysis; Food and Agriculture Organization of the United Nations: Rome, Italy, 2008; Volume 19, pp. 101–122. Available online: https://www.fao.org/3/a-i0131e.pdf (accessed on 15 January 2025).
- Olsen, S.R.; Sommers, L.E. Phosphorus. In Methods of Soil Analysis Part 2—Chemical and Microbiological Properties; Page, A.L., Ed.; ASA Monograph Number 9; American Society of Agronomy: Madison, WI, USA, 1982. [Google Scholar] [CrossRef]
- Nelson, D.W.; Sommers, L.E. Total Carbon, Organic Carbon, and Organic Matter. In Methods of Soil Analysis: Part 3. Chemical Methods; Sparks, D.L., Page, A.L., Helmke, P.A., Loeppert, R.H., Eds.; Soil Science Society of America and American Society of Agronomy: Madison, WI, USA, 1996; pp. 963–1010. [Google Scholar] [CrossRef]
- Lindsay, W.L.; Norvell, W.A. Development of a DTPA soil test for zinc, iron, manganese, and copper. Soil Sci. Soc. Am. J. 1978, 42, 421–428. [Google Scholar] [CrossRef]
- Ministry of Environment, Forest and Climate Change. Solid Waste Management Rules, 2016; Government of India: New Delhi, India, 2016. Available online: https://cpcb.nic.in/uploads/MSW/SWM_2016.pdf (accessed on 20 January 2025).
- Nachar, N. The Mann–Whitney U: A test for assessing whether two independent samples come from the same distribution. Quant. Methods Psychol. 2008, 4, 13–20. [Google Scholar] [CrossRef]
- Vrbin, C.M. Parametric or nonparametric statistical tests: Considerations when choosing the most appropriate option for your data. Cytopathology 2022, 33, 663–667. [Google Scholar] [CrossRef]
- Aluko, O.O.; Oloruntoba, E.O.; Ana, G.R.; Hammed, T.B.; Afolabi, O.T. Characteristics of co-composts produced from raw faecal sludge and organic market waste in Osun state, southwest Nigeria. Int. J. Recycl. Org. Waste Agric. 2020, 9, 333–347. [Google Scholar] [CrossRef]
- Choudhury, A.R.; Banerjee, R.; Banka, N.; Lanke, M.; Sarkar, J.; Anandapu, S.C. Evaluation of the Functionality of GeoTube® Based Physicochemical Faecal Sludge Treatment: A Cursory Alternate. Int. J. Plant Environ. 2020, 6, 122–128. [Google Scholar] [CrossRef]
- Nikiema, J.; Cofie, O.; Impraim, R.; Adamtey, N. Processing of faecal sludge to fertiliser pellets using a low-cost technology in Ghana. Environ. Pollut. 2013, 2, 70. [Google Scholar] [CrossRef]
- Yadav, K.D.; Tare, V.; Ahammed, M.M. Integrated composting–vermicomposting process for stabilization of human faecal slurry. Ecol. Eng. 2012, 47, 24–29. [Google Scholar] [CrossRef]
- Cofie, O.; Kone, D.; Rothenberger, S.; Moser, D.; Zubruegg, C. Co-composting of faecal sludge and organic solid waste for agriculture: Process dynamics. Water Res. 2009, 43, 4665–4675. [Google Scholar] [CrossRef]
- Zavala, M.A.L.; Funamizu, N.; Takakuwa, T. Characterization of Feces for Describing the Aerobic Biodegradation of Feces. Doboku Gakkai Ronbunshu 2002, 2002, 99–105. [Google Scholar] [CrossRef] [PubMed]
- Mengistu, T.; Gebrekidan, H.; Kibret, K.; Woldetsadik, K.; Shimelis, B.; Yadav, H. Comparative effectiveness of different composting methods on the stabilisation, maturation and sanitisation of municipal organic solid wastes and dried faecal sludge mixtures. Environ. Syst. Res. 2018, 6, 5. [Google Scholar] [CrossRef]
- Septien, S.; Mirara, S.; Makununika, B.; Singh, A.; Pocock, J.; Velkushanova, K.; Buckley, C. Effect of drying on the physical and chemical properties of faecal sludge for its reuse. J. Environ. Chem. Eng. 2020, 8, 103652. [Google Scholar] [CrossRef]
- Hübner, T.; Herrmann, A.; Kretzschmar, J.; Harnisch, F. Suitability of fecal sludge from composting toilets as feedstock for carbonization. J. Water Sanit. Hyg. Dev. 2019, 9, 616–626. [Google Scholar] [CrossRef]
- Ahamada, Z.; Maureen, N.N.; Nicholas, K.; Robert, K.; Abia, K.; Allan, J.K. A critical analysis of physiochemical properties influencing pit latrine emptying and feacal sludge disposal in Kampala Slums, Uganda. Afr. J. Environ. Sci. Technol. 2016, 10, 316–328. [Google Scholar] [CrossRef]
- Liu, X.; Li, Z.; Zhang, Y.; Feng, R.; Mahmood, I.B. Characterization of human manure-derived biochar and energy-balance analysis of slow pyrolysis process. Waste Manag. 2014, 34, 1619–1626. [Google Scholar] [CrossRef]
- Cartmell, E.; Gostelow, P.; Riddell-Black, D.; Simms, N.; Oakey, J.; Morris, J.; Jeffrey, P.; Howsam, P.; Pollard, S.J. BiosolidsA Fuel or a Waste? An Integrated Appraisal of Five Co-combustion Scenarios with Policy Analysis. Environ. Sci. Technol. 2005, 40, 649–658. [Google Scholar] [CrossRef]
- Hafford, L.M.; Ward, B.J.; Weimer, A.W.; Linden, K. Fecal sludge as a fuel: Characterization, cofire limits, and evaluation of quality improvement measures. Water Sci. Technol. 2018, 78, 2437–2448. [Google Scholar] [CrossRef] [PubMed]
- Sharma, N.; Gupta, S.; Vyas, A.D. Estimation of fuel potential of faecal sludge in a water scarce city, a case study of Jaipur Urban, India. Water Pract. Technol. 2020, 15, 506–514. [Google Scholar] [CrossRef]
- Aouabe, A.; Boutasknit, A.; Lahbouki, S.; Errouh, F.; Oudra, B.; Chagiri, H.; Khalisse, H.; Meddich, A. Effect of Different Levels of Humic Substances from Horse Manure and Slag Composting on Growth, Yield and Fruit Quality of Radish. Waste Biomass Valorization 2025, 1–16. [Google Scholar] [CrossRef]
- Xiao, J.; He, D.; Ye, Y.; Yang, B.; Duan, A.; Wang, D. Recent progress in persulphate to improve waste activated sludge treatment: Principles, challenges and perspectives. Chem. Eng. J. 2023, 469, 143956. [Google Scholar] [CrossRef]
- Manga, M.; Muoghalu, C.C.; Acheng, P.O. Inactivation of faecal pathogens during faecal sludge composting: A systematic review. Environ. Technol. Rev. 2023, 12, 150–174. [Google Scholar] [CrossRef]
- Sun, L.; Guan, W.; Tai, X.; Qi, W.; Zhang, Y.; Ma, Y.; Sun, X.; Lu, Y.; Lin, D. Research Progress on Microbial Nitrogen Conservation Technology and Mechanism of Microorganisms in Aerobic Composting. Microb. Ecol. 2025, 88, 19. [Google Scholar] [CrossRef]
- Hue, N.V.; Silva, J.A. Organic soil amendments for sustainable agriculture: Organic sources of Nitrogen, phosphorus, and Potassium. In Plant Nutrient Management in Hawaii’s Soils Approaches for Tropical and Subtropical Agriculture; College of Tropical Agriculture and Human Resources, University of Hawaii: Manoa, HI, USA, 2000; pp. 133–144. [Google Scholar]
- United States Environmental Protection Agency, Office of Wastewater Management, United States, Environmental Pro-tection Agency, Office of Wastewater Management, Municipal Technology Branch. A Plain English Guide to the EPA Part 503 Biosolids Rule; US Environmental Protection Agency, Office of Wastewater Management: Washington, DC, USA, 1994.
- Ouedraogo, N.I.G.; Konaté, Y.; Sawadogo, B.; Beré, E.; Sodré, S.; Karambiri, H. Characterization and Methanogenic Potential Evaluation of Faecal Sludge: Case of the Kossodo Biogas Plant in Ouagadougou. Sustainability 2023, 15, 16401. [Google Scholar] [CrossRef]
- Oshunsanya, S.O. Introductory chapter: Relevance of soil pH to agriculture. In Soil PH for Nutrient Availability and Crop Performance; IntechOpen: London, UK, 2018. [Google Scholar] [CrossRef]
- Xu, D.; Yu, X.; Li, X.; Chen, J.; Li, J. Effects of compost as a soil amendment on bacterial community diversity in saline–alkali soil. Front. Microbiol. 2023, 14, 1253415. [Google Scholar] [CrossRef]
- Mathewos, M.; Dugassa, M.; Melese, K.G.; Ketema, A.; Nigussie, T.A. The effects of domestic sludge and diammo-nium phosphate on yield and yield components of haricot bean (Phaseolus vulgaris L.) and soil characteristics. Discov. Sustain. 2025, 6, 89. [Google Scholar] [CrossRef]
- Głąb, T.; Żabiński, A.; Sadowska, U.; Gondek, K.; Kopeć, M.; Mierzwa–Hersztek, M.; Tabor, S. Effects of co-composted maize, sewage sludge, and biochar mixtures on hydrological and physical qualities of sandy soil. Geoderma 2018, 315, 27–35. [Google Scholar] [CrossRef]
- Saikia, S.; Maturi, K.C.; Prit, H.; Pottipati, S.; Kalamdhad, A.S. Application of municipal solid waste (MSW) char during rotary drum co-composting (RDC) of vegetable waste and its characterization. Environ. Sci. Pollut. Res. 2024, 1–17. [Google Scholar] [CrossRef] [PubMed]
- Anwar, Z.; Irshad, M.; Fareed, I.; Saleem, A. Characterization and Recycling of Organic Waste after Co-Composting—A Review. J. Agric. Sci. 2015, 7, 68. [Google Scholar] [CrossRef]
- Adolfo, G.-F.G.; Wolf-Anno, B.; Martin, R.; Christina, S. Co-composting of biochar and nitrogen-poor organic residues: Nitrogen losses and fate of polycyclic aromatic hydrocarbons. Waste Manag. 2022, 143, 84–94. [Google Scholar] [CrossRef]
- Bouhia, Y.; Hafidi, M.; Ouhdouch, Y.; Zeroual, Y.; Lyamlouli, K. Organo-mineral fertilisation based on olive waste sludge compost and various phosphate sources improves phosphorus agronomic efficiency, Zea mays agro-physiological traits, and water availability. Agronomy 2023, 13, 249. [Google Scholar] [CrossRef]
- Sadeghipour, O. Enhancing cadmium tolerance in common bean plants by potassium application. Philipp. Agric. Sci. 2018, 101, 167–175. [Google Scholar]
- Sharma, P.; Bano, A.; Verma, K.; Yadav, M.; Varjani, S.; Singh, S.P.; Tong, Y.W. Food waste digestate as biofertilizer and their direct applications in agriculture. Bioresour. Technol. Rep. 2023, 23, 101515. [Google Scholar] [CrossRef]
- Chen, Z.; Li, Y.; Peng, Y.; Mironov, V.; Chen, J.; Jin, H.; Zhang, S. Feasibility of sewage sludge and food waste aerobic co-composting: Physicochemical properties, microbial community structures, and contradiction between microbial metabolic activity and safety risks. Sci. Total. Environ. 2022, 825, 154047. [Google Scholar] [CrossRef] [PubMed]
- Li, H.; Xu, Y.; Zheng, X.; Tan, L.; Cheng, W.; Zhang, C.; Wang, Q.; Yang, B.; Gao, Y. Optimising mixed aerobic and anaerobic composting process parameters for reducing bacterial pathogenicity in compost-derived products. J. Environ. Manag. 2022, 304, 114293. [Google Scholar] [CrossRef]
- Eneji, A.E.; Yamamoto, S.; Honna, T.; Ishiguro, A. Physico-chemical changes in livestock feces during composting. Commun. Soil Sci. Plant Anal. 2001, 32, 477–489. [Google Scholar] [CrossRef]
- Achkir, A.; Aouragh, A.; El Mahi, M.; Labjar, N.; Bouch, M.E.; Ouahidi, M.L.; Badza, T.; Farhane, H.; Moussaoui, T.E. The application rates of sewage sludge increased with increasing soil fertility and heavy metal contamination risk. Emerg. Contam. 2023, 9, 100200. [Google Scholar] [CrossRef]
- Shahzad, M.; Bibi, A.; Khan, A.; Shahzad, A.; Xu, Z.; Maruza, T.M.; Zhang, G. Utilization of Antagonistic Interactions Between Micronutrients and Cadmium (Cd) to Alleviate Cd Toxicity and Accumulation in Crops. Plants 2025, 14, 707. [Google Scholar] [CrossRef] [PubMed]
- Ogwu, M.C.; Izah, S.C.; Sawyer, W.E.; Amabie, T. Environmental risk assessment of trace metal pollution: A sta-tistical perspective. Environ. Geochem. Health 2025, 47, 94. [Google Scholar] [CrossRef] [PubMed]
- Eliyan, C.; Vinnerås, B.; Zurbrügg, C.; Koottatep, T.; Sothea, K.; McConville, J. Factors influencing physicochemical characteristics of faecal sludge in Phnom Penh, Cambodia. J. Water Sanit. Hyg. Dev. 2021, 12, 129–140. [Google Scholar] [CrossRef]

| Treatment Process | UPDB | PDB | Co-Compost | Literature Values from Previous Studies | Quality Guidelines * | ||||
|---|---|---|---|---|---|---|---|---|---|
| Parameters | Mean | SD | Mean | SD | Mean | SD | Range | Source | FCO, 2016 |
| pH | 6.08 | 0.43 | 6.06 | 0.55 | 6.10 | 0.53 | 6.21–7.96 | [10,19,29,30,31,32,33,34] | 6.5–7.5 |
| Conductivity (dsm−1) | 1.91 | 0.58 | 1.03 | 0.56 | 4.58 | 2.95 | 0.11–7.6 | [10,19,29,30,31,32,35] | 4 (not more than) |
| Moisture content | 58.7 | 8.40 | 60.40 | 19.60 | 31.80 | 13.70 | 5–97% | [10,19,29,32,33,36,37,38,39,40,41] | 15.0–25.0 |
| Bulk density (g/cm3) | 0.48 | 0.04 | 0.60 | 0.29 | 0.52 | 0.13 | 1.05–1.06 | [10,19] | <1.0 |
| Total organic Carbon (%) | 37.24 | 2.40 | 39.65 | 5.26 | 26.28 | 7.56 | 3.5–33.5 | [19,32,35] | 12 (min) |
| Total Nitrogen (N) (%) | 3.14 | 0.88 | 2.91 | 0.58 | 1.99 | 0.63 | 1.05–17.83 | [10,19,31,32,33,34,35,36,39,40,41] | 0.8 (min) |
| Total Phosphate (%) | 1.45 | 0.73 | 2.09 | 1.50 | 1.00 | 0.79 | 1–8.1 | [19,29,30,31,32,33,36,38,39] | 0.4 (min) |
| Total Potassium (%) | 0.23 | 0.06 | 0.42 | 0.79 | 1.36 | 0.75 | 0.44–3.45 | [19,29,31,32,33,36,38,39] | 0.4 (min) |
| C: N ratio | 12.81 | 3.84 | 14.02 | 2.37 | 13.28 | 1.61 | 9.86–22 | [10,19,29,30,32,33] | <20 |
| Arsenic as Ar, (mg/kg) | 3.51 | 1.03 | 3.27 | 1.18 | 2.65 | 1.67 | <0.01–2.8 | [10,40] | 10 |
| Zinc as Zn, (mg/kg) | 697.63 | 58.13 | 688.90 | 208.58 | 568.86 | 392.26 | 0.3–4946 | [10,19,29,30] | 1000 |
| Copper as Cu, (mg/kg) | 140.37 | 12.34 | 243.65 | 86.95 | 117.47 | 24.53 | 0.01–373 | [10,19,29,30,31,40] | 300 |
| Lead as Pb, (mg/kg) | 27.34 | 11.11 | 37.55 | 6.85 | 42.84 | 17.11 | <0.1–189 | [10,19,31,40] | 100 |
| Chromium as Cr, (mg/kg) | 19.42 | 8.11 | 24.38 | 19.09 | 19.13 | 9.76 | <0.01–485 | [10,19,40] | 50 |
| Cadmium as Cd, (mg/kg) | 1.34 | 0.30 | 2.19 | 0.43 | 3.88 | 2.19 | 0.9–20 | [10,19] | 5 |
| Nickel as Ni, (mg/kg) | 23.78 | 6.73 | 32.70 | 15.66 | 20.30 | 8.01 | <0.1–30 | [10,19,40] | 50 |
| Mercury as Hg, (mg/kg) | 0.07 | 0.02 | 0.06 | 0.02 | 0.26 | 0.36 | <0.9, <0.1 | [10] | 0.15 |
| Total Calcium % | 2.37 | 0.91 | 2.68 | 0.66 | 2.85 | 1.08 | 1.15–5 | [19,29,33,36] | - |
| Total Magnesium % | 0.58 | 0.32 | 0.68 | 0.39 | 0.79 | 0.60 | 0.634–4.074 | [19,29,33,36] | - |
| Total Sulphur % | 0.91 | 0.20 | 0.80 | 0.18 | 0.89 | 0.34 | 0.27–1.7 | [29,33,34,36,37,39,40,41,42] | - |
| Total Iron % | 14.35 | 43.12 | 0.65 | 0.27 | 0.91 | 0.49 | 0.44–37 | [19,29,30,31] | - |
| Total Manganese (ppm) | 434.42 | 155.94 | 479.41 | 167.54 | 422.30 | 151.74 | 0.03–2040 | [19,29,30] | - |
| Boron as B (ppm) | 50.92 | 5.55 | 67.38 | 26.96 | 82.94 | 30.68 | - | - | - |
| Parameters | pH | Conductivity (dS/m) | Bulk Density (g/cm3) | Total Organic Carbon (%) | Total Nitrogen (%) | Total Phosphorous (%) | Total Potassium (%) | C:N Ratio |
|---|---|---|---|---|---|---|---|---|
| UPDB vs. PDB | 0.850 | 0.007 | 0.494 | 0.064 | 0.219 | 0.393 | 0.045 | 0.280 |
| UPDB vs. Co-compost | 0.912 | 0.123 | 0.068 | <0.001 | 0.012 | 0.226 | <0.001 | 0.436 |
| PDB vs. Co-compost | 0.940 | 0.015 | 0.677 | 0.001 | 0.001 | 0.029 | 0.003 | 0.912 |
| Parameters | Total Calcium % | Total Magnesium % | Total Sulphur % |
|---|---|---|---|
| UPDB vs. PDB | 0.212 | 0.940 | 0.173 |
| UPDB vs. Co-compost | 0.353 | 0.364 | 0.850 |
| PDB vs. Co-compost | 0.971 | 0.912 | 0.570 |
| Parameters | Total Manganese (ppm) | Boron as B (ppm) | Zinc as Zn, (mg/kg) | Copper as Cu, (mg/kg) |
|---|---|---|---|---|
| UPDB vs. PDB | 0.796 | 0.353 | 0.280 | 0.002 |
| UPDB vs. Co-compost | 0.579 | 0.015 | 0.043 | 0.019 |
| PDB vs. Co-compost | 0.631 | 0.257 | 0.043 | 0.002 |
| Parameters | Arsenic (mg/kg) | Lead (mg/kg) | Chromium (mg/kg)) | Cadmium (mg/kg)) | Nickel (mg/kg) | Mercury (mg/kg) |
|---|---|---|---|---|---|---|
| UPDB vs. PDB | 0.940 | 0.029 | 0.912 | 0.001 | 0.043 | 0.879 |
| UPDB vs. Co-compost | 0.075 | 0.041 | 0.971 | <0.001 | 0.121 | 0.347 |
| PDB vs. Co-compost | 0.280 | 0.579 | 0.940 | 0.005 | 0.031 | 0.246 |
Disclaimer/Publisher’s Note: The statements, opinions and data contained in all publications are solely those of the individual author(s) and contributor(s) and not of MDPI and/or the editor(s). MDPI and/or the editor(s) disclaim responsibility for any injury to people or property resulting from any ideas, methods, instructions or products referred to in the content. |
© 2025 by the authors. Licensee MDPI, Basel, Switzerland. This article is an open access article distributed under the terms and conditions of the Creative Commons Attribution (CC BY) license (https://creativecommons.org/licenses/by/4.0/).
Share and Cite
Ramakrishna, G.; Patil, B. Characterisation of Faecal Sludge from Different Nature-Based Treatment Processes for Agricultural Application. Sustainability 2025, 17, 5683. https://doi.org/10.3390/su17135683
Ramakrishna G, Patil B. Characterisation of Faecal Sludge from Different Nature-Based Treatment Processes for Agricultural Application. Sustainability. 2025; 17(13):5683. https://doi.org/10.3390/su17135683
Chicago/Turabian StyleRamakrishna, Girija, and Balachandra Patil. 2025. "Characterisation of Faecal Sludge from Different Nature-Based Treatment Processes for Agricultural Application" Sustainability 17, no. 13: 5683. https://doi.org/10.3390/su17135683
APA StyleRamakrishna, G., & Patil, B. (2025). Characterisation of Faecal Sludge from Different Nature-Based Treatment Processes for Agricultural Application. Sustainability, 17(13), 5683. https://doi.org/10.3390/su17135683