Article

What Are the Disparities in Spatiotemporal Patterns Between Urban and Rural Well-Being? Evidence from a Rapidly Urbanizing Region in China

1
School of Environmental and Geographical Sciences, Shanghai Normal University, Shanghai 200234, China
2
Yangtze River Delta Urban Wetland Ecosystem National Field Scientific Observation and Research Station, Shanghai 200234, China
*
Author to whom correspondence should be addressed.
Sustainability 2025, 17(13), 5682; https://doi.org/10.3390/su17135682
Submission received: 2 May 2025 / Revised: 15 June 2025 / Accepted: 17 June 2025 / Published: 20 June 2025
(This article belongs to the Special Issue Nature-Based Solutions for Landscape Sustainability Challenges)

Abstract

:
Enhancing human well-being is a core priority of the Sustainable Development Goals. Understanding urban–rural well-being disparities is crucial for bridging gaps and improving social harmony. However, most existing studies focus on either urban or rural residents’ well-being, neglecting their disparities. This study quantified and compared the spatiotemporal patterns of the well-being of urban and rural residents in the Yangtze River Delta (YRD) urban agglomeration from 2000 to 2020 using the human development index (HDI). Results show the following: (1) Urban and rural well-being improved markedly from 2000 to 2020, with urban HDI increasing from 0.66 to 0.83 and rural HDI from 0.55 to 0.74. (2) Urban education and rural income inequalities were more pronounced, with the average Gini coefficients over 2000–2020 more than threefold and twofold those of urban and rural health, respectively. (3) Although disparities existed between urban and rural well-being, rural HDI had grown faster between 2000 and 2020, narrowing the urban–rural gap. From 2000 to 2020, the growth rate for rural HDI (34.55%) exceeded that for urban HDI (27.13%). To foster the shared urban and rural well-being, this study recommends diversifying rural industries, optimizing educational resources, and enhancing rural healthcare infrastructure in the YRD and beyond.

1. Introduction

Human well-being is a complex, multidimensional concept that can be divided into objective and subjective well-being [1,2]. Objective well-being focuses on the infrastructure and public services that cities provide to improve residents’ quality of life [3,4]. Subjective well-being, on the other hand, refers to an individual’s feelings, perceptions, and satisfaction with their living environment, including life satisfaction, perceived freedom, social relationships, and personal security [5,6]. Enhancing human well-being is a key priority of the Sustainable Development Goals (SDGs) [7,8]. Quantifying human well-being and examining its spatiotemporal patterns provide a scientific basis for governments to formulate policies on regional development and resource allocation, promoting social equity and improving overall well-being.
Imbalanced urban–rural development hinders the improvement of human well-being. Rapid urbanization worsened the urban–rural imbalance, leading to social and environmental issues such as rural population decline, the hollowing-out of rural areas, and environmental degradation [9,10,11]. The Chinese government prioritized integrated urban–rural development, emphasizing the coordination of new urbanization with rural revitalization to narrow the urban–rural gap and foster shared prosperity. Therefore, studying the spatiotemporal patterns and disparities in urban and rural well-being can support the formulation of effective policies, creating a more equitable and prosperous environment and ultimately improving both urban and rural well-being.
Current methods of quantifying human well-being include subjective, objective, and combined approaches [12,13,14]. Subjective well-being is assessed through surveys and interviews, while objective well-being relies on government statistics and geospatial data. The combined approach integrates both. Human well-being indicators are typically classified as either single or composite. Single indicators include GDP per capita, cancer mortality, and life satisfaction, while composite indices include the Human Well-Being Index (HWBI) and the Human Development Index (HDI) [15,16,17].
Among these, the HDI has become one of the most widely used indicators to assess human well-being due to its multidimensional nature and accessible data. The HDI is a composite index formulated by the United Nations Development Programme (UNDP) that integrates three key dimensions: income, health, and education. It offers a comprehensive approach to evaluating human well-being, overcoming the limitations of traditional single indicators [18]. The HDI is now widely used to assess human well-being at global [19,20,21], continental [22,23], and national [24,25] scales. However, most studies primarily conduct aggregate analyses of the HDI at these scales without differentiating between urban and rural HDI. With the advancement of new urbanization and rural revitalization strategies, some studies separately quantified a urban or rural HDI. At the urban level, Sedaghati et al. [26] analyzed the urban HDI and migrant group HDI in Bojnurd, Iran, for the years 2006, 2011, and 2016. At the rural level, Xu et al. [27] constructed a Rural Human Development Index (RHDI) to quantify the development levels of 322 villages across 27 provinces in China.
Nevertheless, research focusing on urban–rural HDI disparities remains limited. This, on the one hand, leads to insufficient understanding of the heterogeneous evolutionary mechanisms of the urban–rural HDI under the backdrop of urbanization and rural revitalization; on the other hand, it also makes it difficult for policy formulation to accurately target urban–rural development differences, creating practical challenges in unbalanced urban–rural development. Existing studies often draw conclusions that urbanization significantly promotes HDI improvement based on aggregated national or regional data. For example, Anisuijaman [28] found a positive correlation between the level of urbanization and the HDI using regional data from West Bengal, India. After controlling for Mongolian GDP, Huang and Jiang [29] still found a significant positive correlation between the urbanization rate and the HDI. However, these studies ignored that rural areas may experience asymmetric development of the rural HDI during the urbanization process due to lagging public service provisions relative to rural residents’ needs. Wu et al. [30] found that rural investment in infrastructure, such as transportation and water conservancy, had long been lower than that in urban areas; in 2010, per capita rural infrastructure investment was only one-third that of urban areas, resulting in low agricultural production efficiency (e.g., low cultivated land utilization efficiency), which constrained the improvement of rural HDI. Therefore, it is necessary to conduct differentiated research on urban and rural HDI to fill the aforementioned cognitive gaps and provide a practical basis for differentiated policy design.
In-depth studies of urban and rural well-being disparities are crucial for revealing the mechanisms of human–environment coupling, narrowing urban–rural well-being gaps, and promoting regional common prosperity. In recent years, a few studies have begun to address urban–rural well-being differences. For example, Bobkov et al. [31] employed HDI to investigate the disparities in human potential between urban and rural areas in Russia during 2020–2021. He et al. [32] used HDI to analyze the spatiotemporal differences in urban and rural well-being along the Yangtze River Economic Belt from 2005 to 2015 and further explored the influencing factors. However, these studies primarily rely on the composite HDI without considering its sub-indicators, (e.g., income, health, and education). Performing analysis based only on the HDI composite index obscures the changing characteristics of sub-indicators such as income, health, and education, making it difficult to identify asynchronous development trends in different dimensions of well-being. When the improvement in one dimension is offset by a decline in another, it may affect the targeting and timeliness of policy interventions. Therefore, it is necessary to carry out research that differentiates the spatiotemporal patterns of urban–rural HDI and its disparities and analyzes the spatiotemporal heterogeneity of sub-indicators, such as income, health, and education, so as to provide more precise practical guidance for policy formulation.
As a leading economic region in China and a pioneer in urbanization, urban and rural well-being in the YRD urban agglomeration not only enhanced the quality of life for local residents, but also served as a model for the rest of the country. Investigating the spatiotemporal patterns and disparities in urban and rural well-being within the YRD urban agglomeration highlighted key areas of regional imbalance and informed the development of coordinated regional policies. Therefore, this study quantified and compared the spatiotemporal patterns of urban and rural well-being in the YRD urban agglomeration from 2000 to 2020, focusing on dimensions such as decent living standards, access to knowledge, and long and healthy life. Additionally, it explored disparities in well-being between urban and rural residents. Specifically, the study applied local Moran’s I to analyze spatial clustering of the urban and rural HDI and its sub-indicators and employed the Gini coefficient to measure inequalities of the sub-indicators for both urban and rural HDI. This study comprehensively assessed well-being disparities among urban and rural residents in the YRD urban agglomeration for promoting balanced urban–rural development and improving human well-being.

2. Study Area and Data Sources
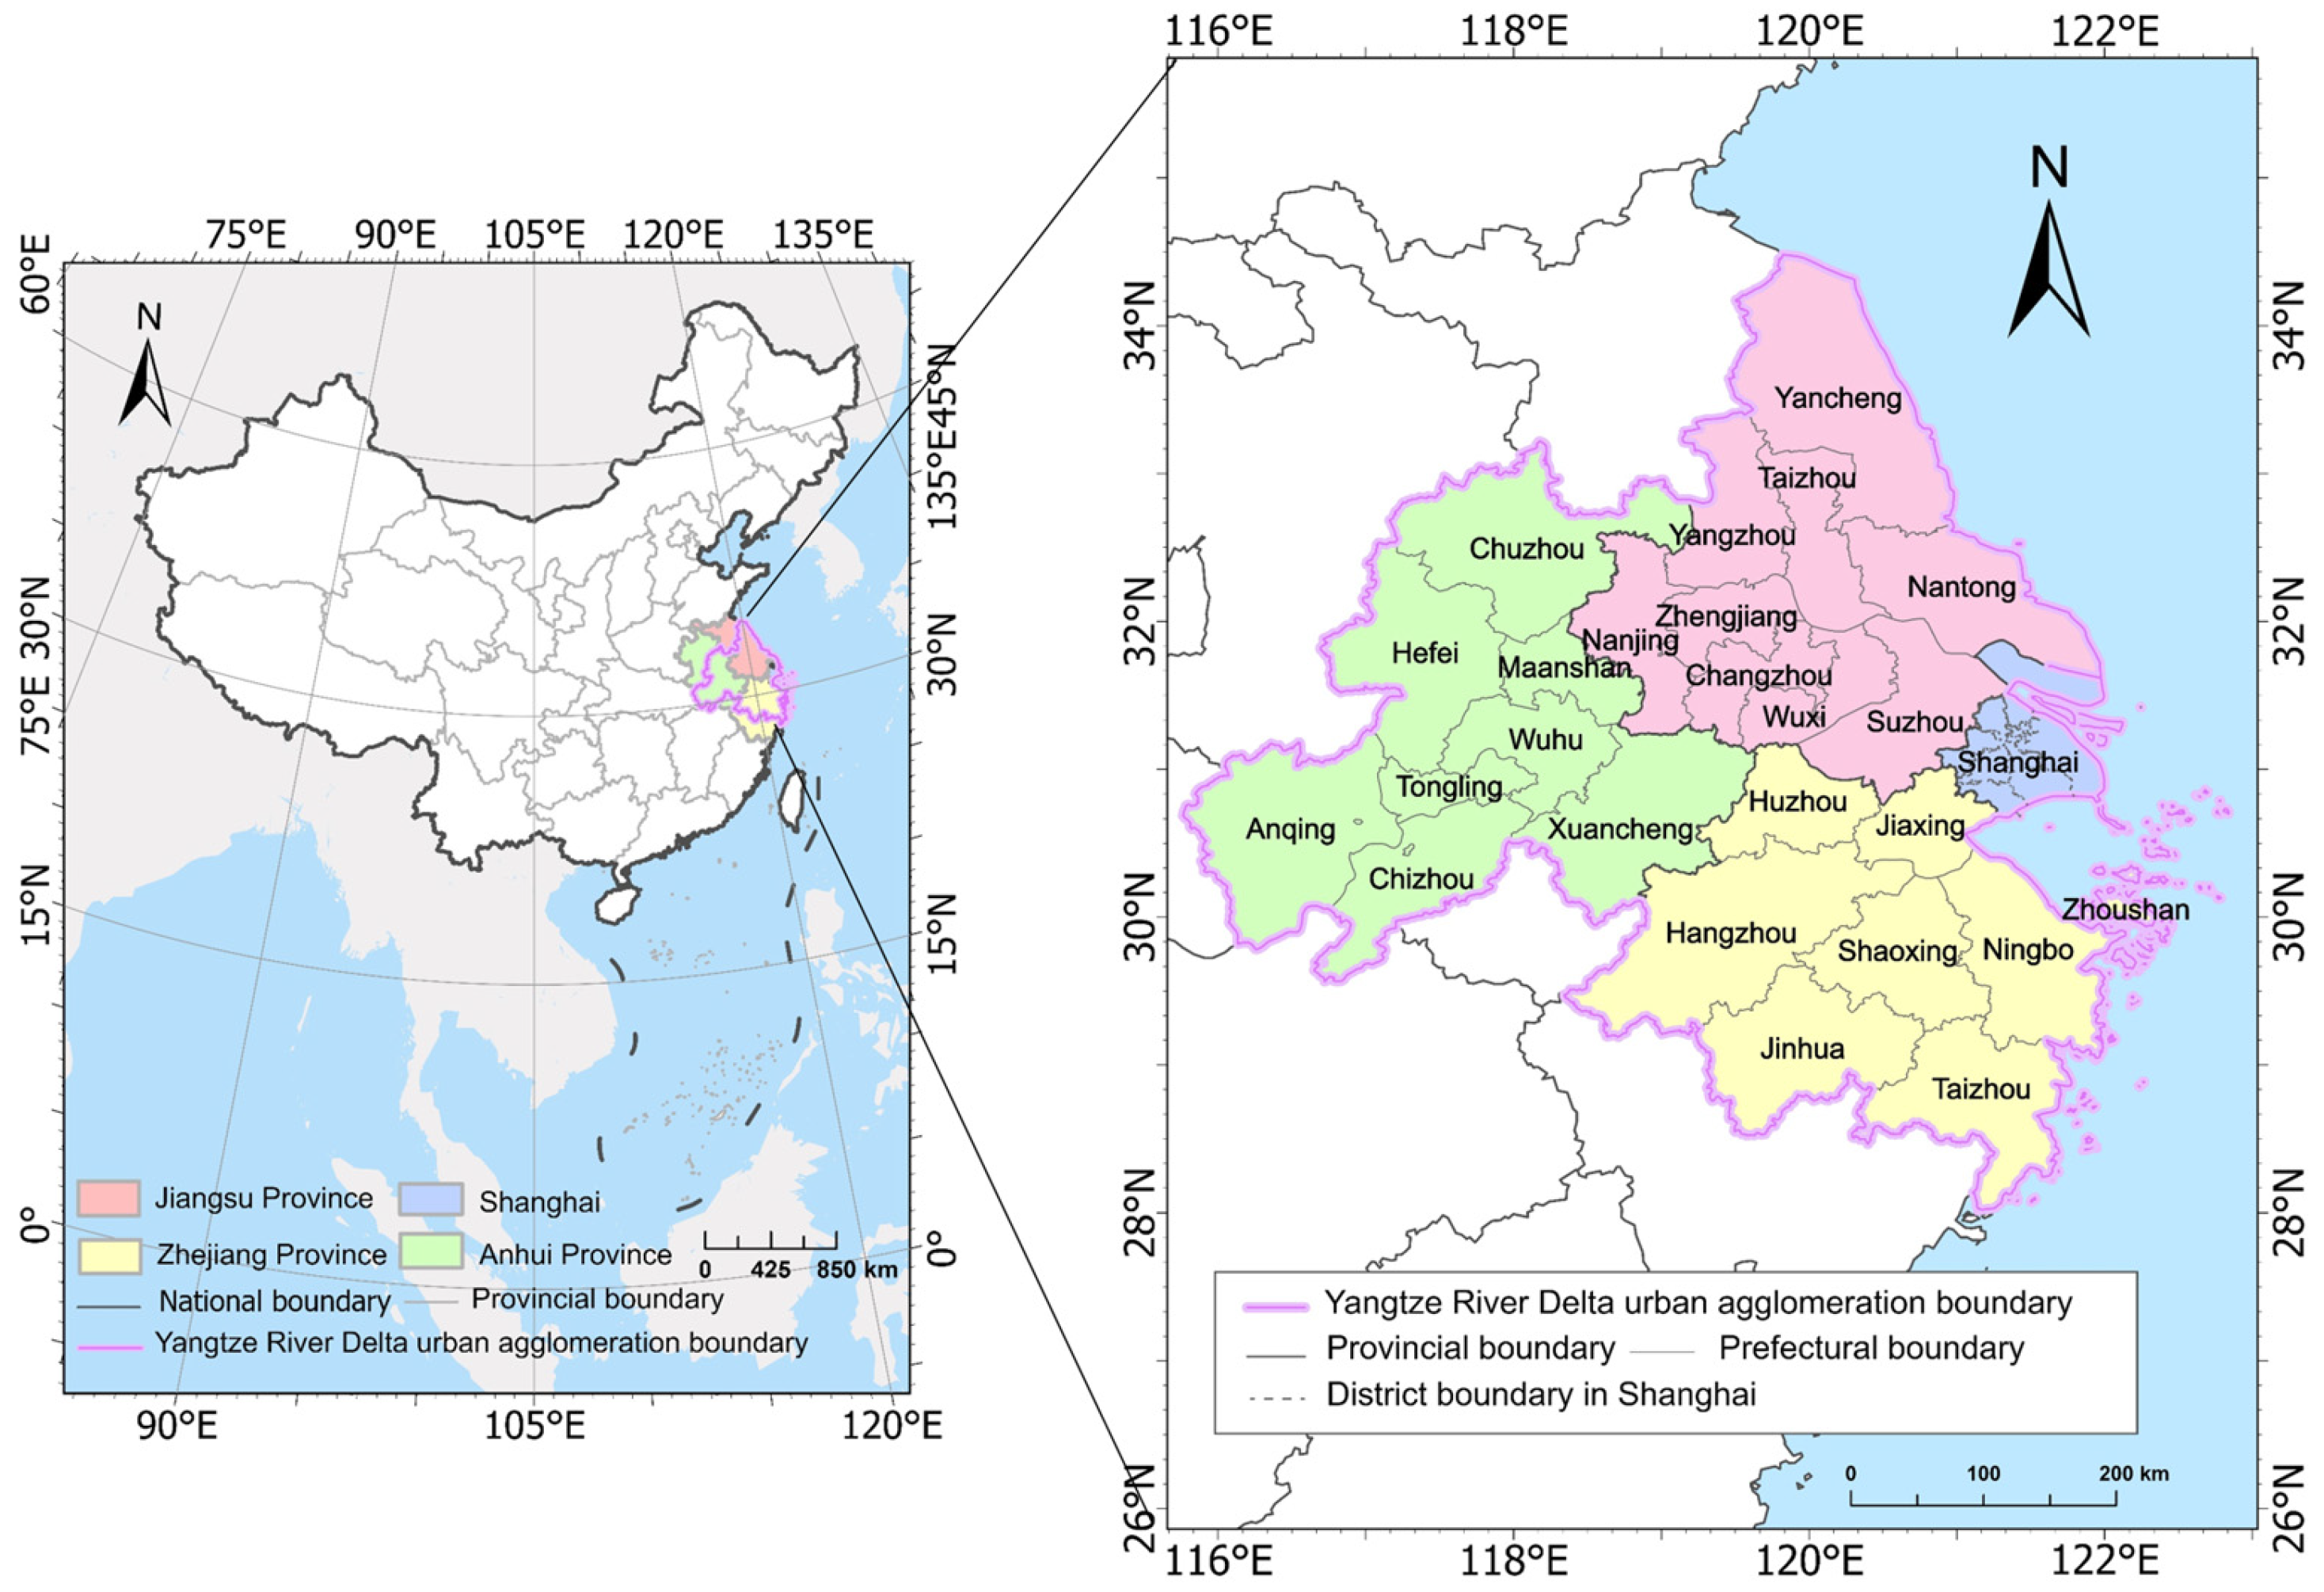
2.1. Study Area

The YRD urban agglomeration is located on the alluvial plain at the estuary of the Yangtze River (18°33′~123°10′ E, 28°0′~33°52′ N), encompassing four administrative regions: Jiangsu Province, Zhejiang Province, Anhui Province, and Shanghai Municipality (Figure 1). Jiangsu Province includes nine prefecture-level cities, such as Nanjing, Wuxi, and Suzhou; Zhejiang Province covers eight cities, including Hangzhou, Ningbo, and Jinhua; and Anhui Province comprises eight cities, such as Hefei, Wuhu, and Anqing.
The YRD urban agglomeration belongs to the subtropical monsoon climate zone, with annual precipitation ranging from 1011 to 1630 mm and an average annual temperature between 16.3 °C and 17.5 °C. The region’s land use is diverse, mainly including farmland, construction land, and forests. The northern part of the YRD is predominantly farmland, the southern part has expansive forests, and the eastern part has a high proportion of construction land [13]. The study area covers more than 200,000 square kilometers, accounting for only 2.1% of China’s total land area. However, its GDP constitutes 20% of the national total in 2020. Furthermore, in 2021, the urbanization rate in the study area reached 73%, surpassing the national average of 64% in the same period. The high urbanization rate is typically accompanied by significant differentiation in urban and rural industrial structures and disparities in resource allocation, leading to differences in income levels, as well as access to education and healthcare services between urban and rural residents. This makes the YRD urban agglomeration a valuable area for studying the well-being differences between urban and rural residents.

2.2. Data Sources

This study employed per capita disposable income, expected years of schooling, and life expectancy to evaluate the HDI of urban and rural residents, representing a decent standard of living, access to knowledge, and a long and healthy life (Table 1). The data on per capita disposable income were obtained from the Statistical Yearbooks of the respective provinces over the years. Expected years of schooling serves as a key indicator for assessing the level of educational development and individual educational opportunities within a country or region. It represents the total number of years a child is projected to receive education, assuming that current age-specific enrollment rates remain unchanged until all educational stages are completed. However, obtaining data on expected years of schooling poses a challenge. Following a previous study [32], this study equated China’s expected years of schooling with actual years of schooling. The actual years of schooling data were derived by calculating the number of individuals at each educational stage using the 2000, 2010, and 2020 Census Yearbooks, as well as the 1% population sample survey data from 2005 to 2015 for each province. In Shanghai, data on actual years of schooling were unavailable for certain years, and thus, this study used a linear regression model for interpolation to estimate the missing values. Life expectancy was estimated using the simple life table method based on the age-specific population and mortality data from the 2000, 2010, and 2020 Census Yearbooks, along with the 1% population sample survey data from 2005 to 2015 [33]. It should be noted that the data presented in a given year’s China Statistical Yearbook correspond to the previous calendar year. For instance, the China Statistical Yearbook 2001 contains data collected for the year 2000. Therefore, by utilizing the China Statistical Yearbooks from 2001 through 2021, we analyzed data spanning the years 2000 to 2020.
We chose the 2000–2020 timeframe based on two primary considerations: Firstly, from the perspective of urbanization, China entered an unprecedented phase of rapid urban growth starting in 2000, with the urbanization rate significantly accelerating compared to previous periods [34,35]. During this time, the introduction of the National New-Type Urbanization Plan (2014–2020) and the rural revitalization strategy provided critical policy orientation for analyzing the evolution of urban and rural well-being. Secondly, regarding data availability, the study utilized decennial national census data (e.g., 2000 and 2010), with the most recent data extending to 2020. Additionally, the 1% population sampling surveys supplemented data for 2005 and 2015, forming a comprehensive longitudinal dataset covering the years 2000, 2005, 2010, 2015, and 2020. This dataset enables a thorough examination of the spatiotemporal dynamics of urban and rural well-being over the 2000–2020 period.
The YRD urban agglomeration comprises one centrally administered municipality (Shanghai) and 25 prefecture-level cities. Given that municipalities have a higher administrative status than prefecture-level cities, this study further subdivided Shanghai into 16 municipal districts (Figure 1). Relevant data for each district were obtained from the Shanghai Statistical Yearbook. During data collection, urban data were gathered from 16 municipal districts in Shanghai and 25 prefecture-level cities in Jiangsu, Anhui, and Zhejiang provinces, totaling 41 districts and cities. Rural data were ultimately collected from 33 districts and cities due to the near absence of rural populations in Huangpu, Xuhui, Changning, Putuo, Hongkou, Yangpu, and Jing’an Districts, as well as the unavailability of rural data in Minhang District.

3. Methods

3.1. Quantification of the HDI

This study quantified urban and rural well-being at the prefecture-level city scale based on the HDI calculation methodology delineated in the technical notes of the Human Development Report (https://hdr.undp.org/sites/default/files/2023-24_HDR/hdr2023-24_technical_notes.pdf, Accessed 3 February 2025). The HDI is computed as the geometric mean of the income index, education index, and health index. Ranging from 0 to 1, the HDI reflects the overall level of development, with higher values indicating greater achievements in terms of a decent standard of living, access to knowledge, and a long and healthy life. The HDI is calculated as follows:
H D I = income index × health index × education index 3 .
Drawing on relevant studies by the UNDP and taking into account data availability and the characteristics of the study area, this study made specific adjustments to the selection of indicators. The final indices were calculated using the following methods:
income index = ln Real per capita disposable income ln Minimum disposable income per capita ln Maximum disposable income per capita ln Minimum disposable income per capita
education index = Average years of schooling in real terms Minimum average years of schooling Maximum average years of schooling Minimum average years of schooling
health index = Average life expectancy in real terms Minimum average life expectancy Maximum average life expectancy Minimum average life expectancy .
The UNDP calculates the income index using gross national income (GNI) per capita. While GNI is derived from GDP, the two measure economic output from different perspectives. GDP reflects production output, capturing the total economic output of a country or region from a production standpoint. It includes the value added by all production activities within the country, regardless of whether they are generated by domestic or foreign-invested enterprises. In contrast, GNI measures total income, assessing economic output from the perspective of primary income distribution. Specifically, GNI is obtained by adjusting GDP—subtracting income earned by foreign capital and labor within the country and adding income earned by domestic capital and labor abroad. Since the Statistical Yearbooks do not publish GNI data for prefecture-level cities and the difference between GDP and GNI values is relatively small, it is common in academic research to use per capita GDP as a proxy for per capita GNI [36,37]. However, as existing GDP data do not differentiate between urban and rural residents, and per capita disposable income better reflects the income well-being of these populations, this study used per capita disposable income instead of per capita GNI to calculate the income index [38].
The health index was calculated using life expectancy data. Previous studies employed an abbreviated life table to estimate residents’ life expectancy [39,40,41], and this study followed a similar approach. The calculation of the education index was adjusted based on the UNDP framework. According to the UNDP methodology, the education index is derived from the arithmetic mean of the average years of schooling and the expected years of schooling, where the average number of years of schooling is determined based on enrollment rates at different educational stages. However, due to variations in statistical standards, obtaining enrollment rate data for urban and rural residents across different regions is challenging. Additionally, calculating the average expected years of schooling for urban and rural residents is equally difficult. In contrast, the average years of schooling can serve as a reliable indicator of knowledge accessibility for urban and rural populations. Therefore, this study followed the approach of He et al. [32], assuming that the average years of schooling for urban and rural residents in each region is equivalent to the expected years of schooling. The average years of schooling was calculated by dividing the total number of years of formal education received by individuals aged six and above by the total population aged six and above. The specific calculation formula is as follows:
Average years of schooling = 6 × Number of elementary school culture + 9 × Number of persons with lower secondary education + 12 × Number of high school educators + 16 × Number of university cultures Number of persons over 6 years of age .
This study sets the threshold values for the HDI sub-indicators based on the benchmark thresholds set by the UNDP, while also considering the regional characteristics of the study area. Specifically, the threshold values for the health and education indices remained consistent with those established by the UNDP. However, the threshold for the income index was modified following the method proposed by Song [42]. The determination of the income index thresholds involved two key steps. First, the UNDP’s GNI per capita thresholds in purchasing power parity (PPP) dollars were converted into Chinese yuan (RMB). This conversion was achieved by calculating the ratio of GNI per capita based on exchange rates to GNI per capita based on PPP for the year 2017. This ratio was then used to convert the UNDP’s income index thresholds from PPP dollars to RMB. In the second step, the RMB thresholds for GNI per capita were further converted into RMB thresholds for per capita disposable income. Given the broader availability of GDP per capita data, GDP per capita was used as a proxy for GNI per capita in this conversion. The ratio of per capita disposable income to per capita GDP from 2016 to 2019 was applied to approximate this transformation, ultimately deriving threshold values applicable to per capita disposable income. The calculated maximum and minimum values were RMB 131,446.5 and RMB 175.3, respectively. For ease of computation in subsequent analyses, these values were rounded to RMB 135,000 and RMB 180. The adjusted maximum and minimum values for each indicator are presented in Table 2.
The aforementioned indices were further normalized, yielding data within a range of 0 to 1. After obtaining the normalized values for each index, the geometric mean was calculated to derive the HDI (Formula (1)), which serves as an indicator of human well-being. According to the UNDP, an HDI above 0.8 signifies a high level of human development, an HDI between 0.5 and 0.799 indicates a medium level, and an HDI below 0.5 represents a low level of development. Considering the specific HDI distribution of urban and rural residents in the YRD urban agglomeration, this study employed the natural breaks method to classify urban and rural HDI values into three categories: high, medium, and low. Specifically, an HDI ranging from 0.46 to 0.63 corresponds to a low level of human well-being, an HDI between 0.63 and 0.75 represents a medium level, and an HDI from 0.75 to 0.89 denotes a high level.

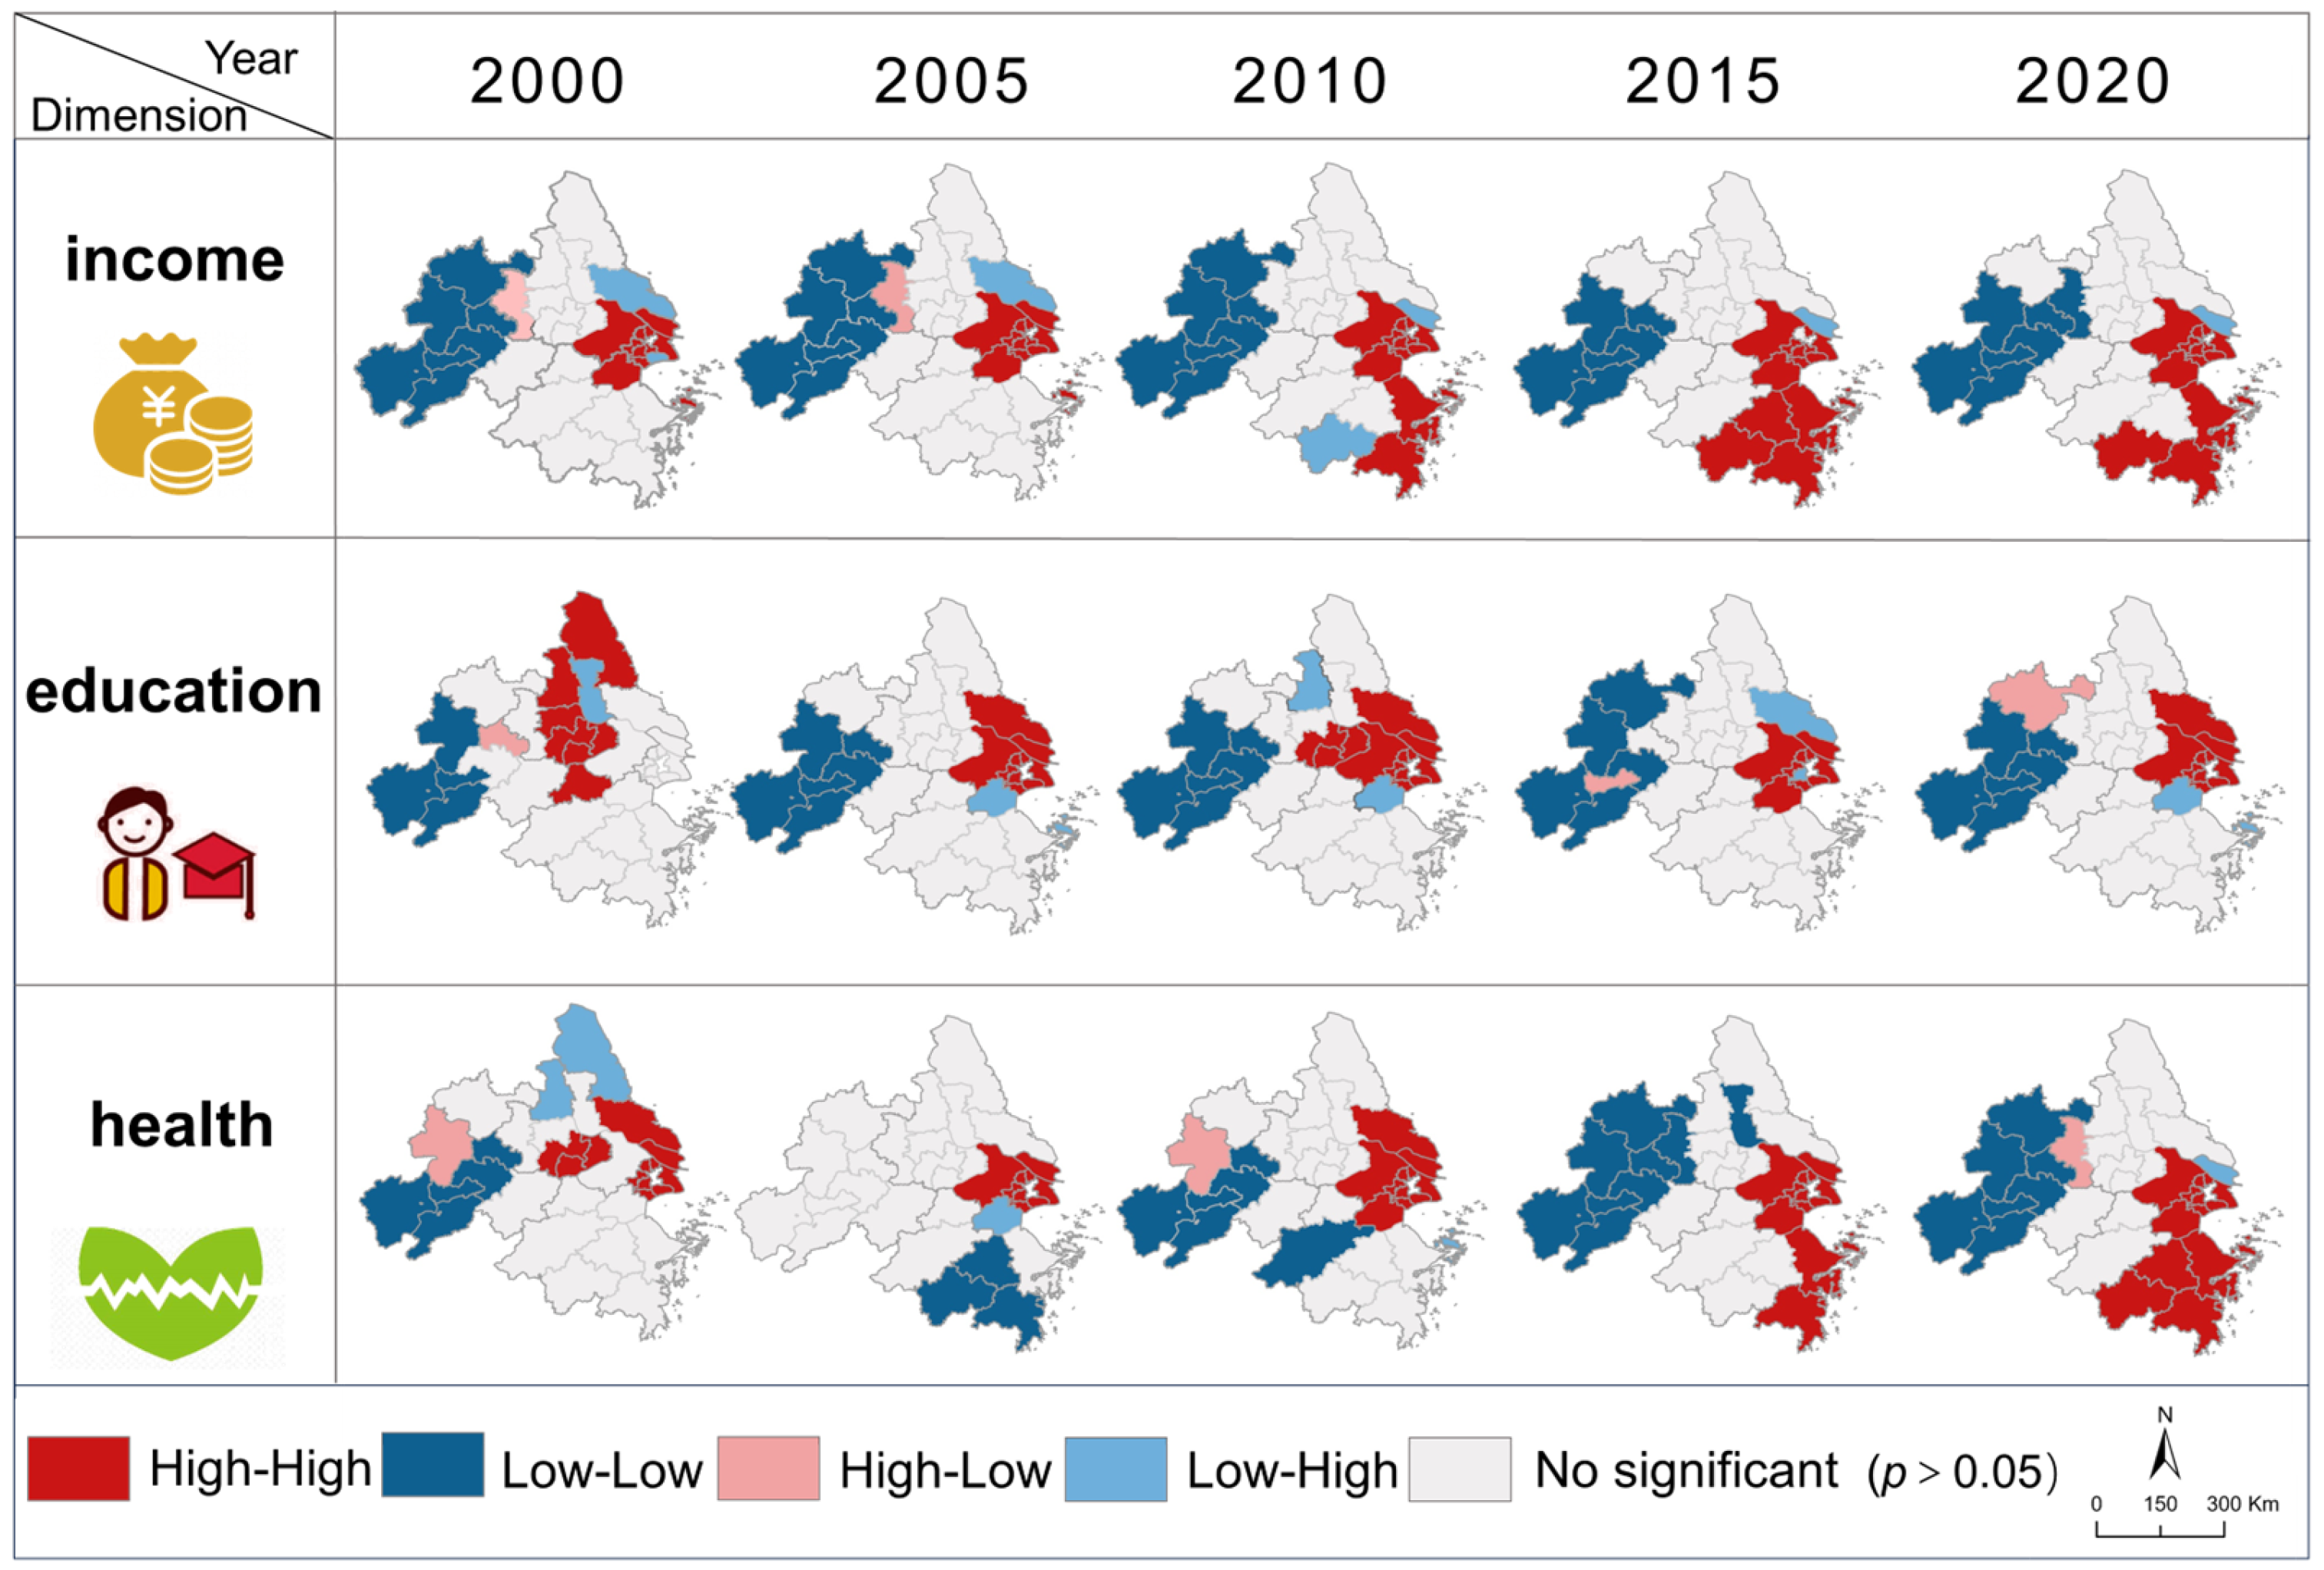
3.2. Quantifying the Spatiotemporal Patterns of Urban and Rural Well-Being

This study applied Moran’s index to assess the spatial clustering of urban and rural well-being in the YRD urban agglomeration. Moran’s index consists of two components: the global Moran’s index (GMI) and the local Moran’s index (LMI). The GMI was employed to examine the overall spatial autocorrelation across the entire region, while the LMI was used to capture the localized spatial clustering patterns around a specific region i within the YRD urban agglomeration. In this study, the LMI was particularly utilized to explore the spatiotemporal dynamics of urban and rural well-being in the region. The LMI was calculated using GeoDa (Version 1.14) software, and the results are visualized with ArcGIS Pro (Version 3.1.6). Significance testing was conducted to determine the reliability of spatial clusters. The p-value of the Kolmogorov–Smirnov test (KS test) was used to assess the goodness-of-fit of the function and to guide function selection. A p-value greater than 0.05 indicates that the goodness-of-fit test is passed. The formula for LMI is expressed as follows:
L o c a l M o r a n s I = Z i S 2 j i n w i j Z j
Z i = x i x ¯ , Z j = x j x ¯ , S 2 = 1 n x i x ¯ 2 .
In the formula, wij represents an element of the spatial weight matrix w; n denotes the total number of prefecture-level cities in the study area; and xi and xj correspond to the HDI values of adjacent prefecture-level cities.
Local spatial clustering can be classified into four patterns: high–high (HH) clustering, low–low (LL) clustering, high–low (HL) clustering, and low–high (LH) clustering. Among these, HH and LL clustering indicate positive spatial autocorrelation. HH clustering occurs when a region with a high HDI is surrounded by neighboring regions that also exhibit high HDI values, forming a high-value cluster of human well-being. Conversely, LL clustering occurs when a region with a low HDI is surrounded by regions with similarly low HDI values, resulting in a low-value cluster of human well-being. In contrast, HL and LH clustering indicate negative spatial autocorrelation. HL clustering refers to a region with a high HDI that is surrounded by regions with low HDI values, whereas LH clustering describes a region with a low HDI that is surrounded by regions with high HDI values.

3.3. Quantifying Disparities in Well-Being Between Urban and Rural Residents

This study used the urban–rural HDI ratio and the Gini coefficient to quantify urban–rural disparities in HDI within the YRD urban agglomeration. The urban–rural HDI ratio primarily reflects the overall gap between urban and rural residents, highlighting the extent of dual contrast. In contrast, the Gini coefficient measures inequality across various dimensions of well-being from a distributional perspective, providing a more comprehensive assessment of disparity. The urban–rural ratio is calculated as follows:
R = Urban HDI Rural HDI .
The formula is defined as follows, where R represents the urban–rural HDI ratio. A value closer to 1 indicates a smaller well-being gap between urban and rural residents, reflecting more balanced regional development.
This study classified urban–rural well-being disparities into different levels using the natural breaks method, combined with the actual data characteristics. Specifically, an urban–rural HDI ratio between 0.9 and 1.1 was categorized as no disparity; a ratio between 1.1 and 1.3 was classified as low disparity; a ratio between 1.3 and 1.5 was considered medium disparity; and a ratio exceeding 1.5 was defined as high disparity.
The Gini coefficient is a key international metric for comprehensively assessing inequality in income distribution among residents. In this study, we used the Gini coefficient to evaluate the inequality and evolutionary trends of well-being across various dimensions for urban and rural residents separately within the YRD urban agglomeration. The Gini coefficient is calculated as the ratio of the area of inequality to the area of perfect inequality in the Lorenz curve diagram. The formula for computing the HDI Gini coefficient (GiniHDI) is expressed as follows:
G i n i H D I = 1 1 P W i = 1 n W i 1 + W i × P i
The formula is expressed as follows: P represents the total population of either urban or rural residents, W denotes the overall HDI value of either urban or rural population in the study area, and Wi indicates the cumulative HDI of either urban or rural population up to the i-th prefecture-level city or municipal district. The Gini coefficient ranges from 0 to 1. A coefficient approaching 0 indicates a more equitable distribution of urban or rural well-being across regions within the YRD urban agglomeration; whereas a coefficient approaching 1 signifies greater inequality in the distribution of urban or rural well-being.

4. Results

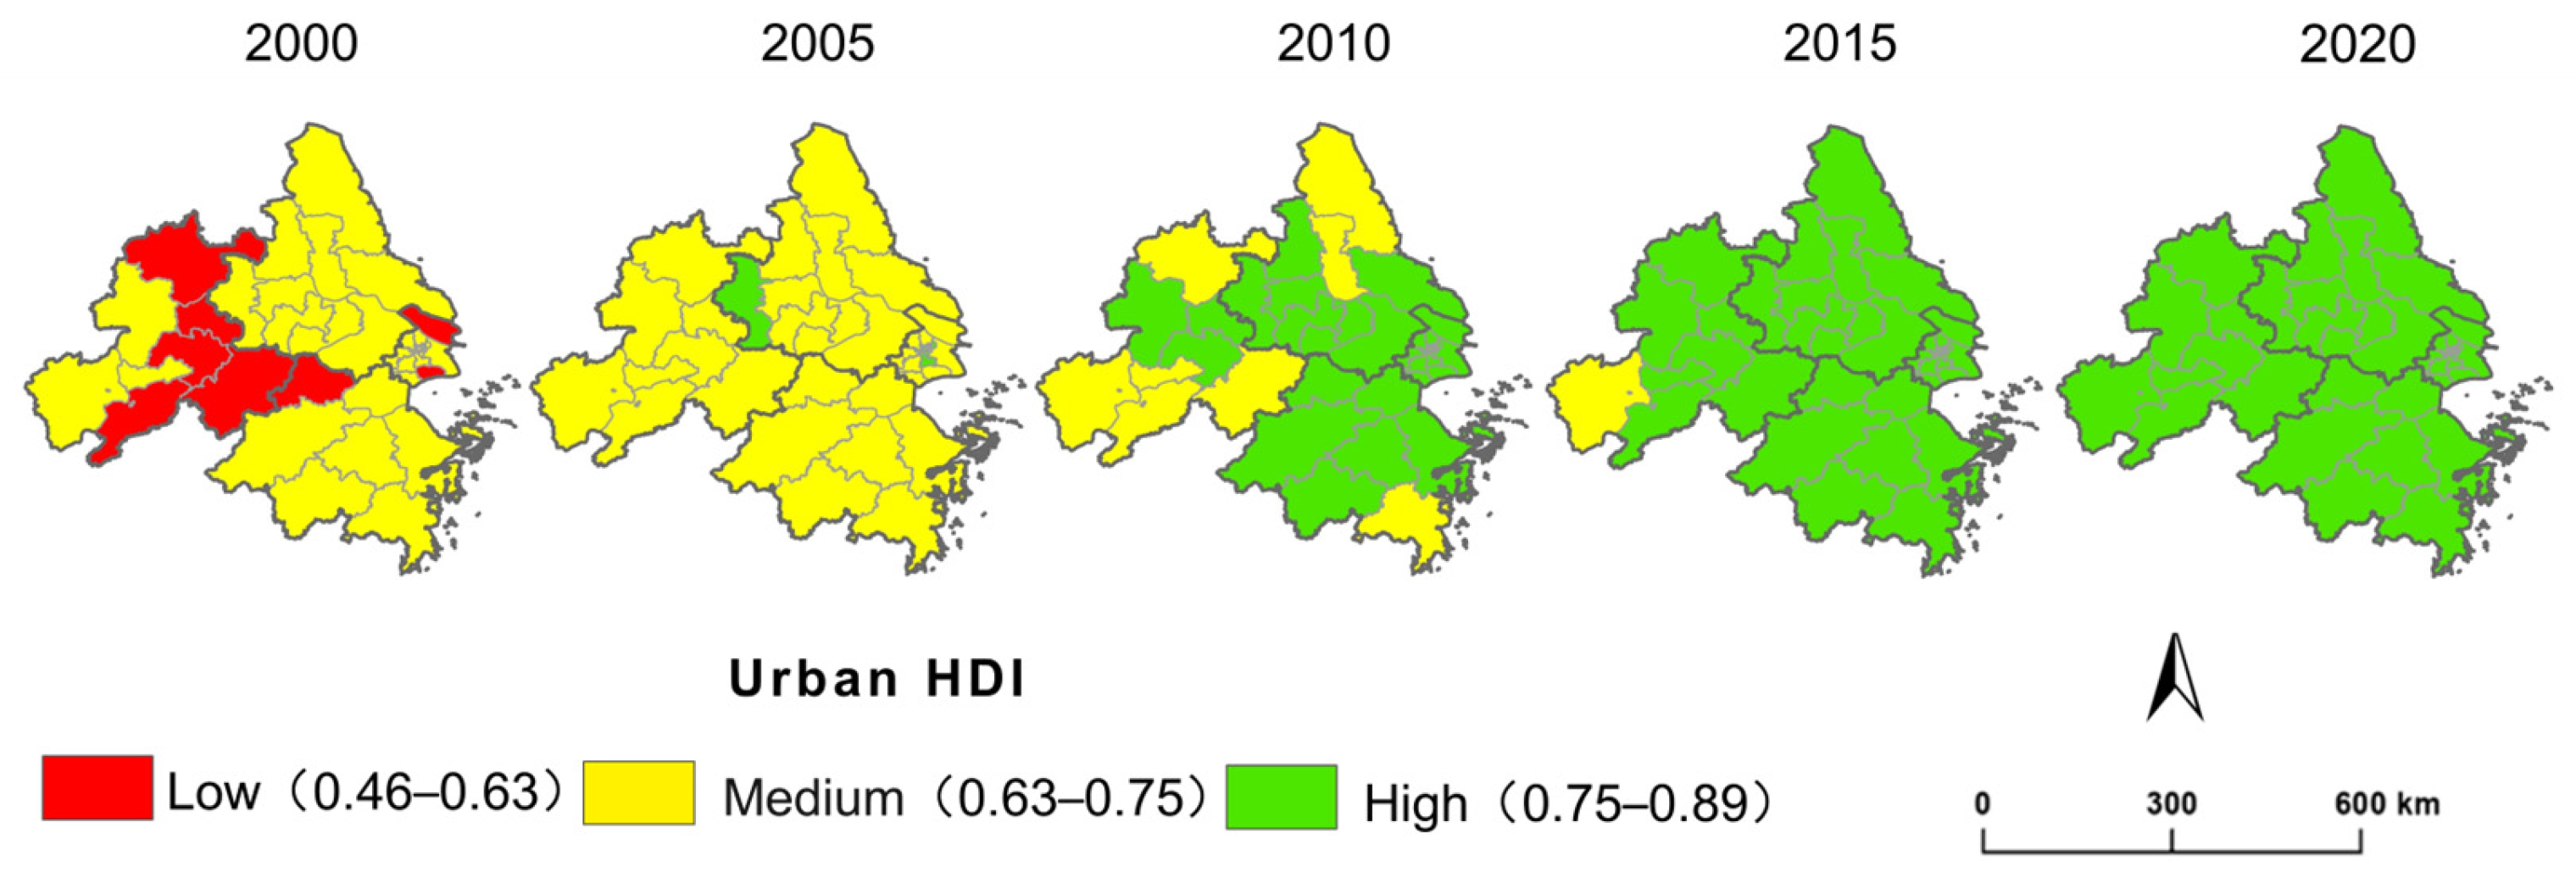
4.1. Spatiotemporal Patterns of Urban HDI from 2000 to 2020

From 2000 to 2020, the well-being of urban residents in the study area improved significantly. The average urban HDI increased from 0.66 in 2000 to 0.83 in 2020, reflecting a growth of 27.13%. In terms of spatial distribution, in 2000, areas with low urban HDI accounted for 25.03% of the region, while the remaining areas exhibited medium-level ussrban HDI (Figure 2). By 2005, 96.58% of the region had medium-level urban HDI, with the remainder exhibiting high-level HDI. By 2020, all areas reached a high-level urban HDI.
In terms of HDI sub-indicators, urban income well-being in the YRD urban agglomeration showed significant improvement. The average urban income index rose from 0.59 to 0.88 between 2000 and 2020, reflecting a growth of 49.12%. From the perspective of spatial clustering, at a significance level of 0.05, the HH clusters of the income index expanded outward from Shanghai to surrounding areas such as Suzhou, with their spatial share increasing from 2.85% in 2005 to 6.10% in 2020 (Figure 3). Meanwhile, LL cluster areas in Anhui Province continuously contracted between 2000 and 2020, as their spatial areas declined from 47.35% in 2000 to 28.11% in 2020. Urban education well-being in the study area also showed improvement. The average education index rose from 0.55 in 2000 to 0.67 in 2020, representing a growth of 21.81%. Spatially, the spatiotemporal pattern of the education index mirrored that of the income index, with a reduction in LL clusters and an expansion of HH clusters. Between 2000 and 2020, most districts in Shanghai displayed HH clustering with a slight outward diffusion trend. From 2005 to 2020, persistent LL clustering was observed in the southern YRD urban agglomeration, although its spatial proportion decreased from 17.72% in 2005 to 9.45% in 2020 (Figure 3).
Urban health well-being in the study area also improved from 2000 to 2020, with the average health index rising from 0.88 to 0.99, a 12.5% increase. Unlike the spatiotemporal pattern of the education index, the health index exhibited spatial transitions between HH and LL clustering zones. HH clusters shifted southward between 2000 and 2020, while LL clusters migrated from the southern region to the northern area between 2005 and 2015, and subsequently moved from the northern to the western region from 2015 to 2020 (Figure 3).

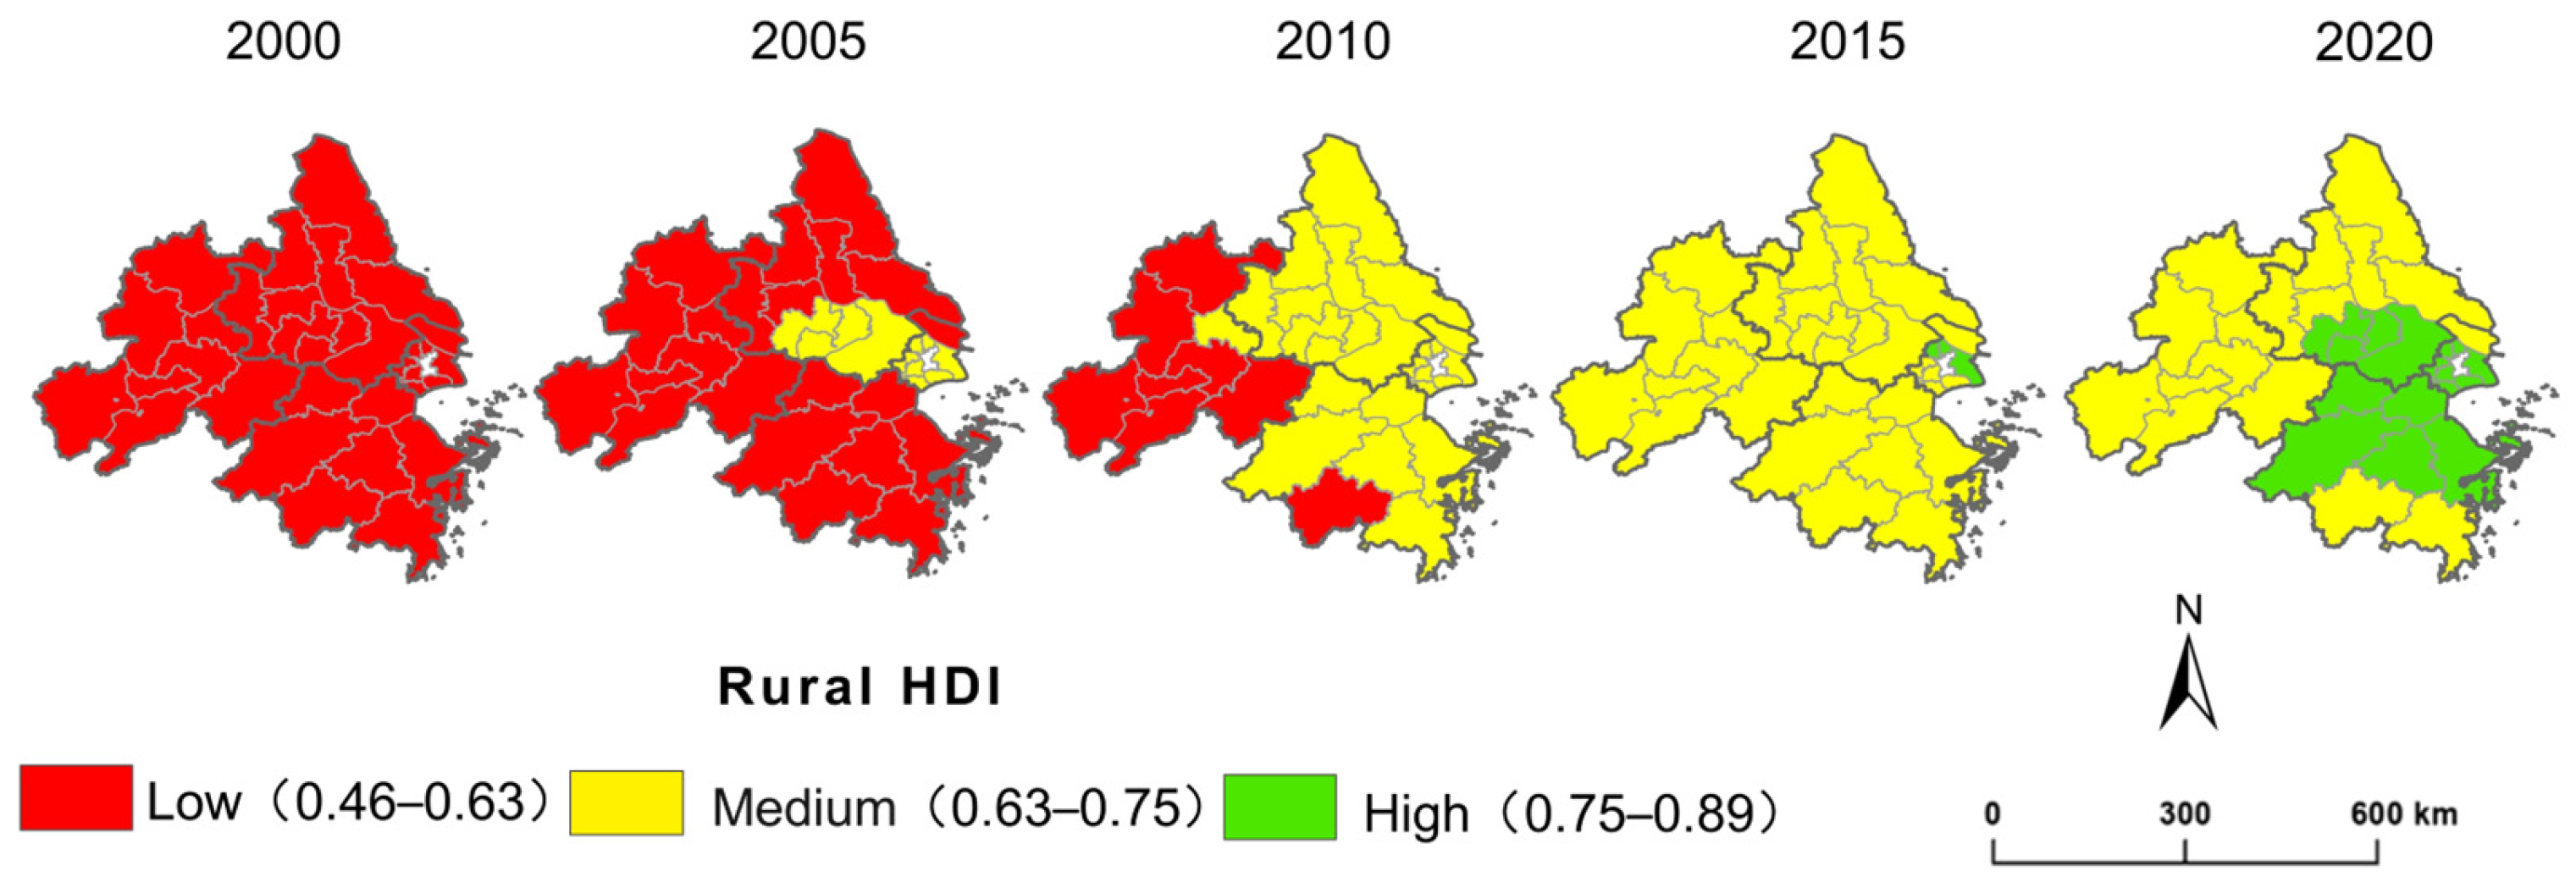
4.2. Spatiotemporal Patterns of Rural HDI from 2000 to 2020

From 2000 to 2020, the well-being of rural residents in the YRD urban agglomeration improved. The average rural HDI increased from 0.55 in 2000 to 0.74 in 2020, reflecting a growth of 34.55%. In terms of spatial distribution, all areas exhibited low-level rural HDI in 2000 (Figure 4). By 2015, medium-level rural HDI covered 98.9% of the region, with the remainder attaining high-level HDI, leaving no areas at the low level. By 2020, 31.83% of areas achieved high-level rural HDI, while the remaining areas maintained medium-level HDI.
From the perspective of HDI sub-indicators, rural income well-being in the YRD urban agglomeration showed marked improvement. The average rural income index increased from 0.47 in 2000 to 0.77 in 2020, representing a growth of 66.3%. Spatially, HH clustering zones of the rural income index expanded significantly, extending from Shanghai as the center to southern Zhejiang Province. The proportion of areas exhibiting HH clustering characteristics in southern Zhejiang Province increased from 10.32% in 2000 to 23.4% in 2020. Meanwhile, the proportion of LL clustering zones in Anhui Province decreased from 28.22% in 2000 to 24.89% in 2020 (Figure 5).
From 2000 to 2020, rural education well-being in the YRD urban agglomeration also improved. The average education index increased from 0.44 in 2000 to 0.54 in 2020, reflecting a 22.73% growth. During this period, the spatial evolution of education well-being was primarily characterized by the spatial transition of HH clustering zones (Figure 5). In 2000, HH clusters were mainly distributed in the central-northern part of the YRD urban agglomeration. From 2005 to 2020, these HH clusters shifted from the central-northern region to Shanghai and its surrounding regions, where they remained stable.
Similar to the trends observed in income and education well-being, rural health well-being in the YRD urban agglomeration also showed an upward trend over the two decades. The average health index increased from 0.87 in 2000 to 0.98 in 2020, representing a 12.64% growth. Between 2000 and 2020, the rural health index similarly demonstrated spatial transitions in its evolution. From 2000 to 2005, the HH clusters of the rural health index were mainly concentrated in Shanghai, with parts of Jiangsu Province also showing HH spatial clustering. Between 2005 and 2010, these HH clusters in Shanghai continued to expand into surrounding areas such as Suzhou, Jiaxing, and Nantong. From 2010 to 2020, the HH clusters spread southward from Shanghai and its vicinity into southern Zhejiang Province. The spatial proportion of HH clusters in the rural health index increased from 12.26% in 2000 to 27.11% in 2020 (Figure 5).

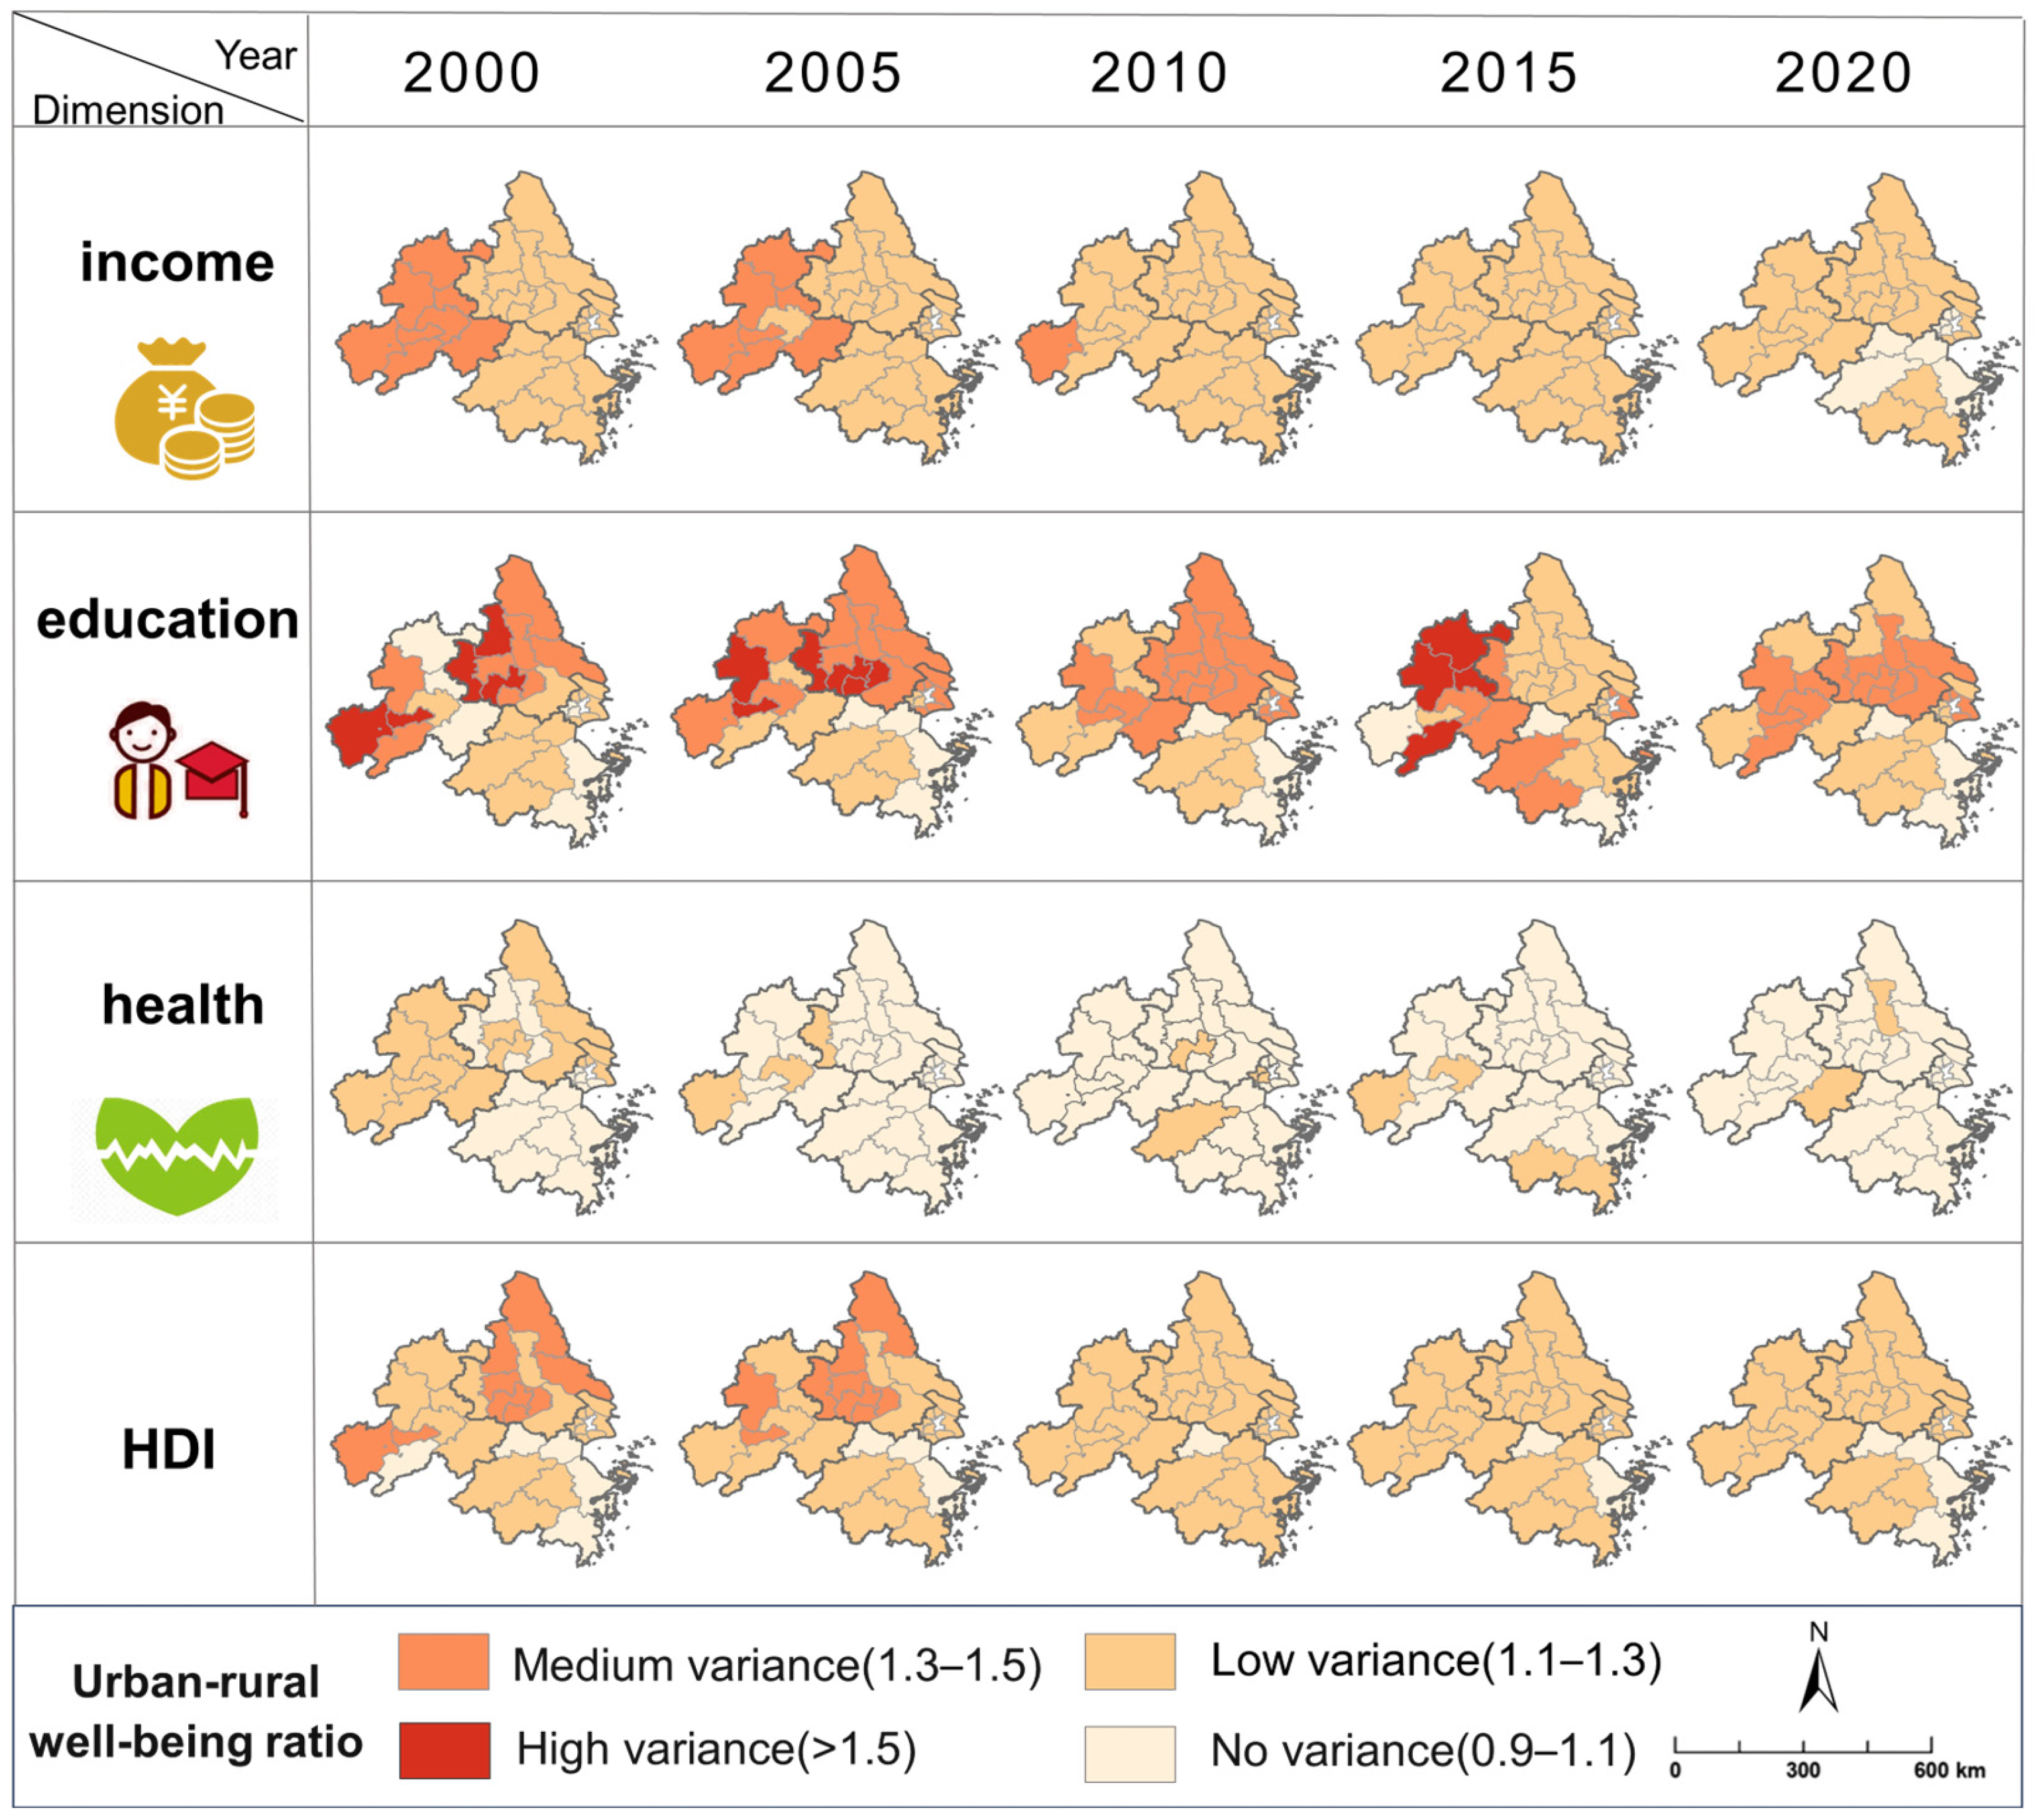
4.3. Spatiotemporal Patterns of Urban–Rural HDI Disparities from 2000 to 2020

From 2000 to 2020, the urban–rural well-being disparity in the YRD urban agglomeration gradually narrowed. In 2000, areas with low-level urban–rural disparity accounted for 53.22% of the region, while medium-level disparity areas constituted 28.97%, and areas with essentially no disparity represented 17.81% (Figure 6). By 2020, the proportion of low-disparity areas increased to 86.09%, with the remaining 13.91% of the region showing essentially no urban–rural well-being disparity.
The urban–rural income gap showed a significant reduction from 2000 to 2020. In 2000, areas with medium-level urban–rural income disparity accounted for 34.04% of the YRD urban agglomeration. By 2020, over 81.09% of the region exhibited low-level income disparity, while the remaining 18.9% showed essentially no gap. The urban–rural education gap remained substantial during 2000–2020. In 2020, 37.51% of the region still maintained medium-level education disparity. For health well-being, the urban–rural gap was less pronounced. In 2000, all areas displayed either low or medium-level health disparity. During 2000–2020, 47.75% of the region saw their health disparity decrease from low-level to essentially no gap. Notably, the urban–rural health ratio in southern Zhejiang Province consistently remained below 1 from 2000 to 2005 (Figure 6).
Significant differences exist in the Gini coefficients of both urban and rural HDI and their sub-indicators. During 2000–2020, the average Gini coefficient for urban HDI was 0.020, lower than the rural average of 0.031. Regarding sub-indicators, the urban education index showed the highest average Gini coefficient (0.047), being over three times greater than that of the urban health index (0.015) (Figure 7a). Conversely, the rural income index exhibited the largest average Gini coefficient (0.048), being more than double that of the rural health index (0.022) (Figure 7b). From 2000 to 2020, the Gini coefficients for both urban and rural well-being in the study area showed a consistent downward trend. Specifically, the urban HDI Gini coefficient decreased by 44.71%, with corresponding declines of 33.11% for the income index, 30.71% for the education index, and 71.04% for the health index. By contrast, rural declines were smaller for HDI (31.04%), the education index (23.6%), and the health index (30.03%), while the rural income index showed a greater reduction (48.16%) than its urban counterpart (Figure 7).

5. Discussion

5.1. The Well-Being of Urban and Rural Residents (Especially Income) in the YRD Urban Agglomeration Has Been Significantly Improved

This study found that the well-being of both urban and rural residents in the YRD urban agglomeration significantly improved from 2000 to 2020. The average HDI for urban residents increased from 0.66 in 2000 to 0.83 in 2020, reflecting a growth of 27.13%. In contrast, the average HDI for rural residents rose from 0.55 in 2000 to 0.74 in 2020, marking an increase of 34.55%. This improvement may be attributed to the rapid national economic development following the reform and opening-up policy, as well as a series of supportive policies directed at the YRD region. The promotion of industrial upgrading and transformation, as well as the creation of numerous job opportunities, can effectively raise residents’ incomes. The improved public services, with enhanced educational resources and substantially better healthcare conditions, greatly contributed to the well-being of residents in the YRD urban agglomeration.
Over the past two decades, income well-being has shown the most significant improvement for both urban and rural residents in YRD urban agglomeration (Figure 2 and Figure 4). The growth rates of the urban and rural income indices reached 49.12% and 66.3% from 2000 to 2020, respectively. In terms of spatial patterns, LL income clusters of both urban and rural residents in Anhui Province exhibited a shrinking trend (Figure 3 and Figure 5). This change may be attributed to the poverty alleviation policies, industrial structure adjustments, and improvements in urban and rural infrastructure implemented in recent years [43]. These measures effectively promoted economic development and increased residents’ income, which may have reduced the extent of LL income clusters. At the national level, the advancement of the “targeted poverty alleviation” strategy effectively promoted income growth and mitigated the spatial clustering of poverty [44]. In comparison, spatial poverty clustering remains prevalent in other developing countries. For instance, Basu et al. [45] found that in India, high–high poverty clusters were mainly concentrated in central regions such as Bastar. These areas were characterized by ecological fragility, a high concentration of tribal populations, and delayed policy responses. This situation contrasts with the continuous contraction of low-income clusters in the YRD urban agglomeration.
Meanwhile, HH income clusters of urban and rural residents expanded from Shanghai outward between 2000 and 2020, spreading to surrounding regions (Figure 3 and Figure 5). This finding aligns with the research by Zhang et al. [46] on the coupling coordination of rural revitalization, new-type urbanization, and ecological environment (R-U-E), which indicates that between 2011 and 2022, the region centered around Shanghai consistently exhibited a “high–high” clustering pattern. Wu et al. [47] also pointed out that core cities such as Shanghai and their surrounding counties formed a “high investment—high output—high efficiency” (HHH) development model. The development of surrounding counties relied on the agglomeration of capital and technology in core cities, as well as market demands for metropolitan agriculture and rural tourism. These studies confirm Shanghai’s key role in promoting spatially coordinated development.
As the core of the YRD urban agglomeration, Shanghai’s “polarization effect” concentrated a variety of resources, including industries, capital, talent, raw materials, science, technology, and information [48] (Figure 8). This “polarization effect” not only solidifies Shanghai’s position as an economic center, but also transmits resources and development opportunities to neighboring urban and rural residents via its “radiation effect,” thus fostering a concurrent improvement in income well-being among these residents [49]. Research in other regions also confirms the role of the “polarization radiation” effect of core cities in promoting regional coordinated development. For example, Feng et al. [50] found that Zhengzhou has driven regional development through the expansion of transportation networks and the diffusion of manufacturing and service industries to surrounding counties. Similarly, Tokyo leveraged the extension of rail transit to promote the transfer of labor-intensive industries to the suburbs and the agglomeration of high value-added industries in the core area, forming an “agglomeration radiation” effect [51,52].
Furthermore, HH income clusters of rural residents in the study area expanded beyond the vicinity of Shanghai and notably towards southern Zhejiang Province. The proportion of rural residents within HH income clusters in southern Zhejiang increased from 10.32% in 2000 to 23.4% in 2020 (Figure 5). This phenomenon is likely linked to Zhejiang’s substantial achievements in developing emerging industries such as agricultural modernization, rural tourism, and e-commerce [53] (Figure 8). These emerging industries not only enhanced rural residents’ incomes, but also contributed to the optimization and upgrading of the economic structure among urban and rural residents, thereby driving the growth of the high-income rural group.

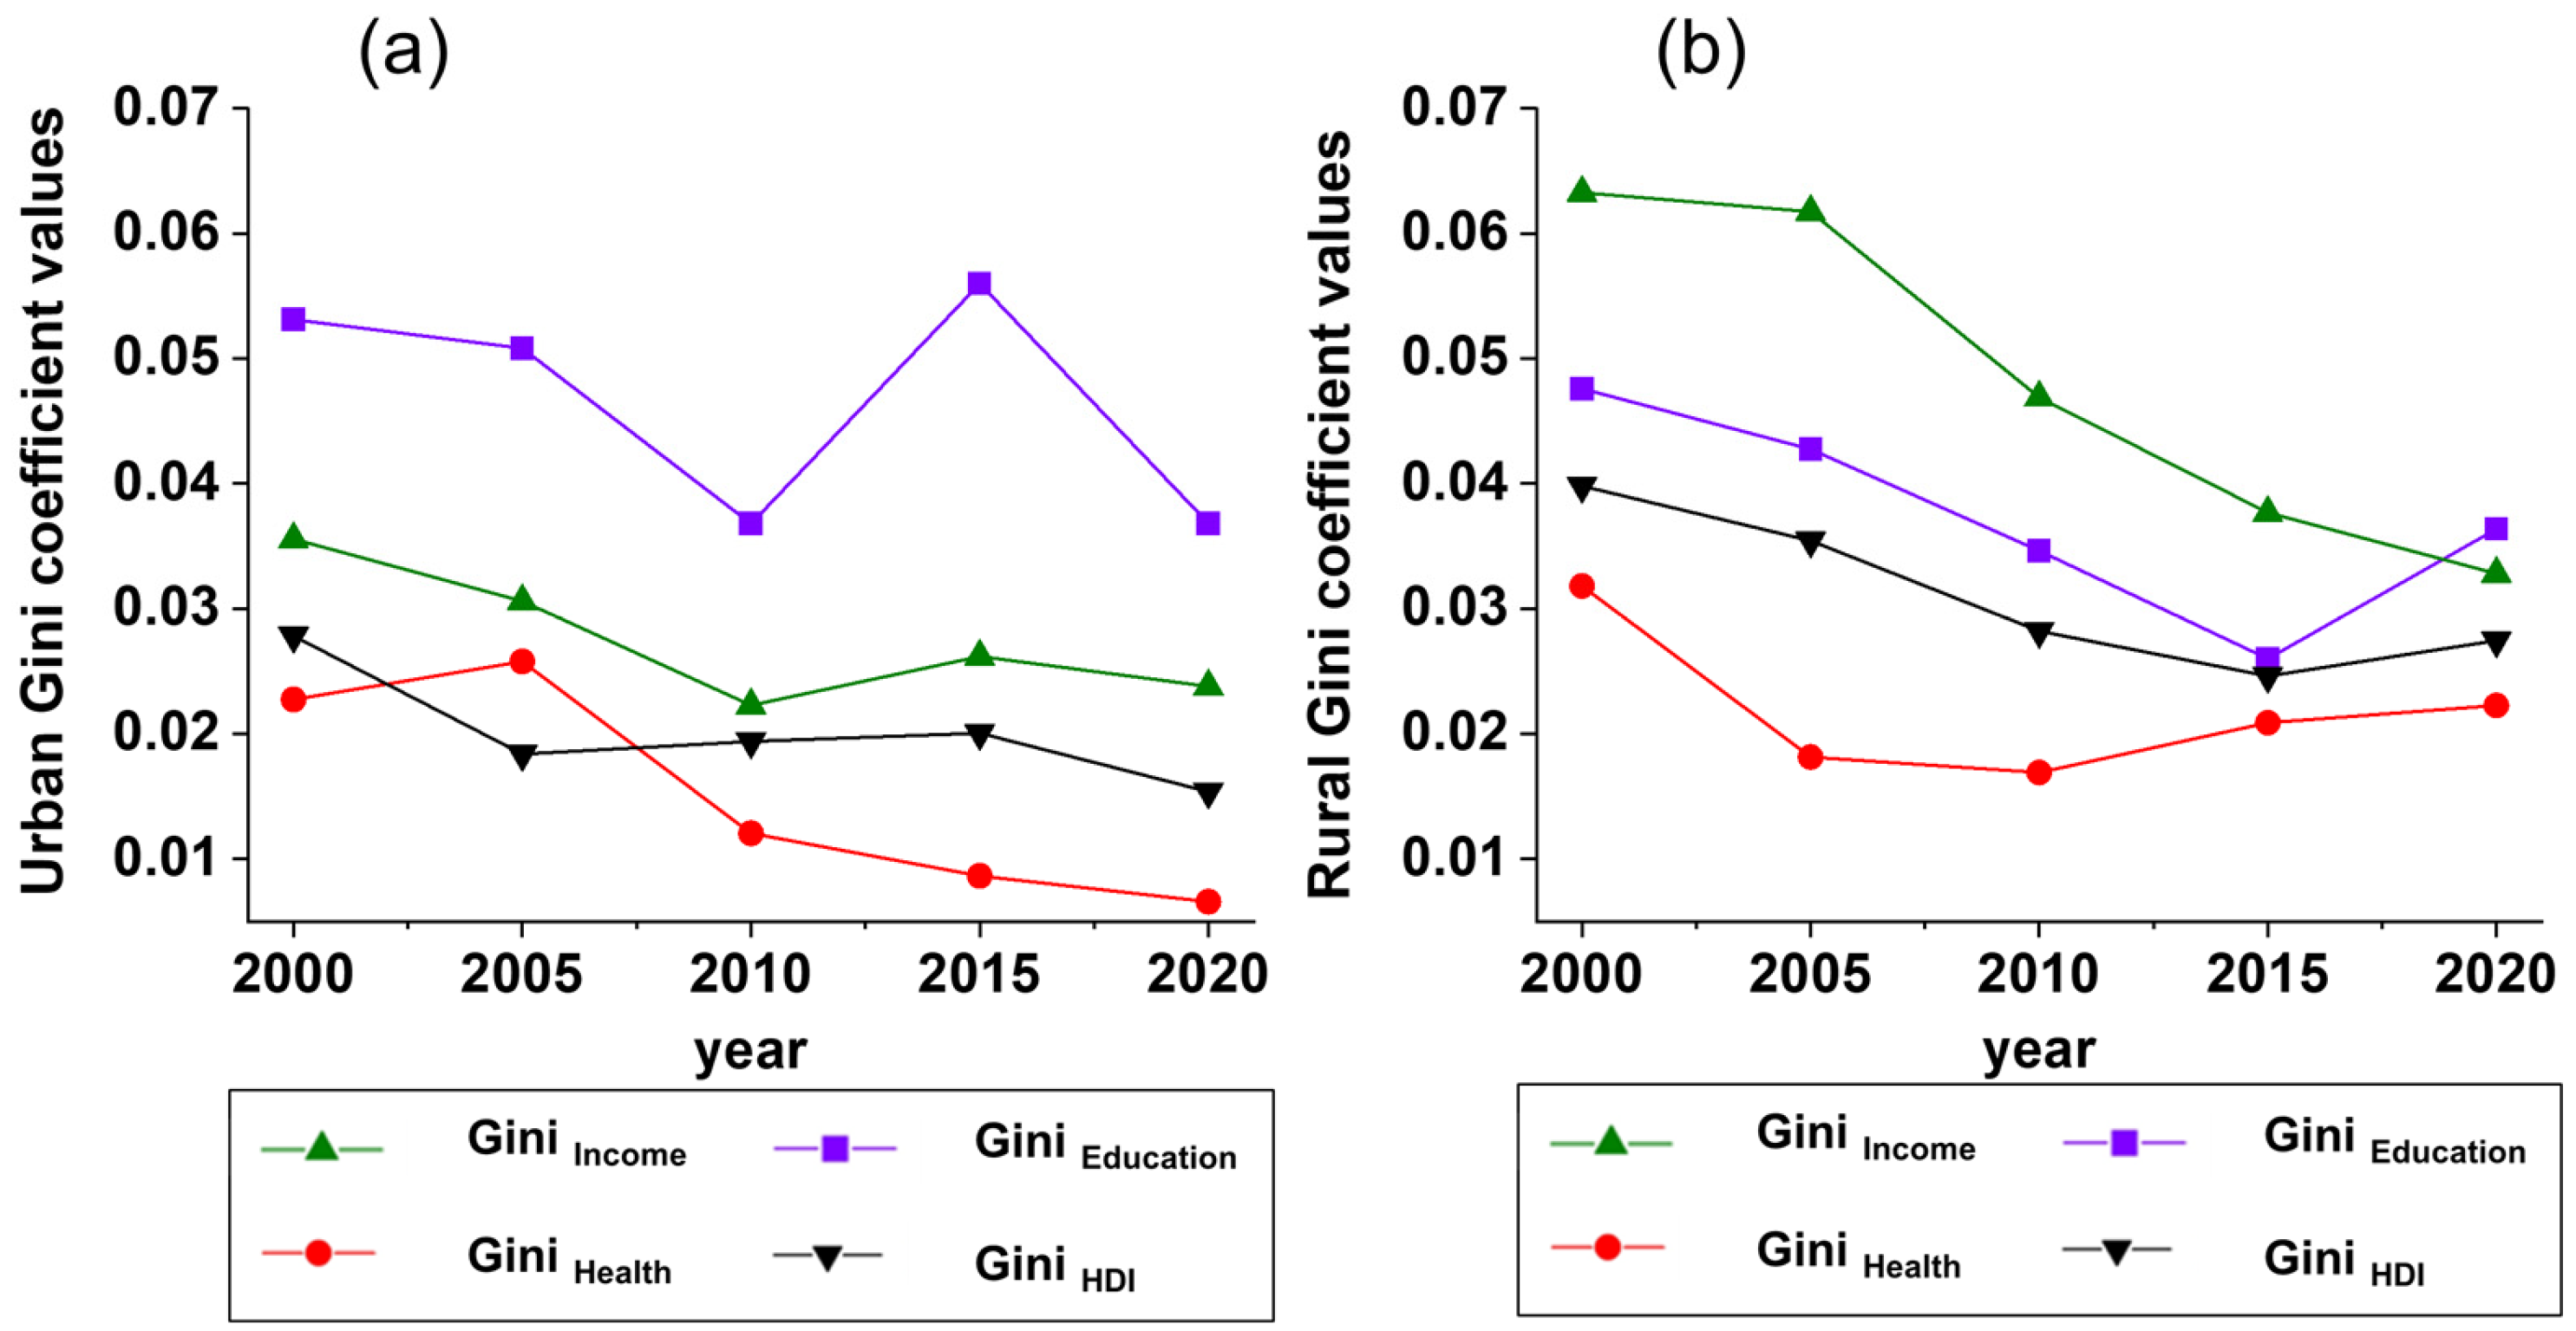
5.2. Inequality in Both Urban Education and Rural Income Within the YRD Urban Agglomeration Remains Prominent

Although the well-being of residents in the YRD urban agglomeration significantly improved over the past two decades, inequality in urban education well-being remains relatively pronounced compared to other dimensions of human well-being. Over this period, the average Gini coefficient for urban education well-being was more than three times that of urban health well-being and nearly twice that of urban income well-being. Academic research indicated that the unequal distribution of education well-being across the YRD region primarily stems from admission threshold policies and resource allocation mechanisms [54]. At the level of enrollment thresholds, each city in the YRD urban agglomeration implements a material access system and a points-based enrollment system. The material access system requires applicants to provide supporting documents (e.g., proof of identity and evidence of job and residence) to qualify for enrollment. The points-based enrollment system mandates that at least one parent participates in the local points-based management scheme, accumulating points (e.g., based on social security contributions or length of residence) to determine their child’s eligibility for admission. Through these institutional arrangements, cities in the YRD urban agglomeration established enrollment barriers for migrant children. These thresholds do not exhibit a gradual reduction from core cities to peripheral ones, and their rigidity reduces the likelihood of migrant children accompanying their parents by 55%, disproportionately affecting low-income groups and limiting their access to quality education [54]. In terms of resource allocation, data from 2017 to 2020 indicate that cities experiencing population growth (e.g., Hangzhou) faced shortages of educational resources, whereas cities with population decline (e.g., Yancheng) saw an increase in surplus resources. This spatial mismatch had a severe impact on educational equity and resource efficiency, constraining the region’s overall educational well-being and balanced development.
From 2000 to 2020, the average Gini coefficient for the urban education index in the YRD urban agglomeration (0.047) was higher than that for the rural education index (0.037) (Figure 7). This disparity may be attributed to the fact that, with the development of new urbanization, a large number of migrant workers’ children entered cities, leading to a shortage in the total supply of urban education resources. This results in challenges in achieving equitable distribution of compulsory education resources in urban areas [55]. Moreover, the unregulated movement of migrant workers’ children increased the management difficulties for local governments in receiving areas [56,57]. While the YRD urban agglomeration has a strong economic foundation, further supply-side reforms are needed to achieve a better spatial alignment between educational resources and demand (Figure 8). One proposed strategy is to enhance both support and regulation for private education at the compulsory education level. This approach could not only alleviate the burden on educational authorities and public schools in managing substantial financial, personnel, and land resources, but also provide migrant children with more diverse and equitable educational opportunities [58].
Similarly, inequality in rural income well-being within the YRD urban agglomeration is also relatively pronounced compared to other dimensions of human well-being. Wang et al. [59] used the Gini coefficient to assess the equilibrium of the HDI in China and found that the mean GiniHDI value in China from 2006 to 2018 was 0.028. This study found that the mean Gini coefficient for rural income well-being in the YRD urban agglomeration from 2000 to 2020 was 0.048, which was nearly twice the national average GiniHDI (0.028) and twice the Gini coefficient for rural health well-being in the YRD urban agglomeration (0.022). These findings indicate that inequality in rural income well-being remains more pronounced than that in other well-being dimensions and exceeds the national average. Between 2000 and 2020, the mean Gini coefficient for the rural income index (0.048) was nearly twice that of the urban income index (0.028), highlighting significantly higher income inequality among rural residents compared to urban residents (Figure 7). This finding aligns with previous research [60,61]. Huang et al. [61] suggested that this phenomenon may stem from two factors. First, some rural residents still depend primarily on traditional agriculture, with limited development of non-agricultural industries. This results in relatively low incomes and widening income disparities among rural residents. In contrast, urban residents benefit from diversified industries, such as manufacturing and services, which provide more varied income opportunities and may enhance equity among urban residents. Second, there is an imbalance in agricultural support policies: rural residents in economically developed regions receive significantly more fiscal subsidies and infrastructure investments than those in less developed regions, hindering balanced income development among rural residents. Multiple factors influence rural income growth, including the overall development of the rural economy, structural optimization, the acceleration of marketization, urbanization processes, increases in rural capital investment, the expansion of rural financial services, and improvements in farmers’ human capital, among others [62]. Due to variations in economic development models, resource endowments, and policy orientations, different regions within the YRD exhibit disparities in rural income levels. For instance, some regions achieved income growth through increased investment in science, technology, and finance, diversification in income sources, and policy-driven development benefits [63]. In contrast, other regions remain constrained by traditional agricultural dependence, employment limitations, and lagging development of emerging industries, resulting in slower income growth. These disparities in income level and structures exacerbate the issue of rural income inequality in the YRD urban agglomeration, highlighting the urgent need for policy interventions and targeted countermeasures.

5.3. Although Disparities Existed Between Urban and Rural Well-Being, the Urban–Rural Gap Narrowed, with Rural Health Well-Being Even Better than That of Urban Residents

Although the well-being of both urban and rural residents in the YRD urban agglomeration improved significantly over the past two decades, a persistent gap still remained. By 2020, urban well-being reached a high level across the entire region, whereas only 31.83% of areas demonstrated high-level rural well-being (Figure 2 and Figure 4). Due to their higher initial development levels with an average HDI of 0.66 in 2000, urban residents were more likely to transition from low and medium to high levels of human well-being during subsequent developmental stages. In contrast, rural residents faced greater challenges in achieving upward mobility from low to high well-being levels, which is primarily due to their lower initial HDI values (the average HDI of 0.55 in 2000). Nevertheless, despite starting from a disadvantaged position, rural residents exhibited faster improvements in well-being than urban residents over the past two decades, indicating strong potential for progress. From 2000 to 2020, the YRD urban agglomeration experienced a 27.13% increase in urban HDI, whereas rural HDI improvement was significantly higher, averaging 33.08%. This differential likely reflects the Chinese government’s prioritization of rural revitalization through the Beautiful Village Development Program during the YRD’s integration process. As part of the coordinated rural development efforts, the government enhanced institutionalized collaboration mechanisms, expanded collective village economies, and implemented agricultural benefit-sharing systems to promote the common prosperity. These measures collectively facilitated interregional rural resource sharing.
Notably, between 2000 and 2005, the urban–rural health well-being ratio in southern Zhejiang Province consistently remained below 1, suggesting that rural residents enjoyed better health well-being than urban residents during this period (Figure 6). However, a nationwide study by Du [64] in China found that urban older adults generally had better health status than their rural counterparts, with only 10.6% of urban seniors reporting poor health compared to 20.3% of rural seniors. This discrepancy may stem from two key factors. First, the choice of health well-being evaluation indicators varies. Du [64] focused on physical health conditions and self-care ability, whereas our study assessed health well-being based on life expectancy within the HDI framework. Such differences in evaluation criteria may lead to varying interpretations of health well-being. Second, Zhejiang Province actively implemented a series of effective rural development policies, laying a solid foundation for progress in rural healthcare. For instance, the innovative “welfare risk” model of the New Rural Cooperative Medical System (NRCMS) adopted in Yinzhou District optimized institutional design and resource allocation, significantly increasing participation rates, benefit coverage, and compensation ratios [65]. This initiative not only provided tangible medical benefits to farmers, but also improved rural healthcare conditions, effectively enhancing the health well-being of rural residents. Consequently, the urban–rural health well-being dynamics in the YRD region may differ from national trends (Figure 8).
Additionally, this study identified significant regional disparities in the urban–rural income well-being gap within the YRD urban agglomeration from 2000 to 2020 (Figure 6). This finding aligns with the conclusions of Zhao and Jiang [66]. Their analysis of the spatiotemporal characteristics of urban–rural integration in 27 central cities of the YRD from 2003 to 2020 revealed that cities with stronger economic development, such as Shanghai, Nanjing, Suzhou, and Wuxi, exhibited smaller urban–rural income disparities, whereas cities such as Anqing, Chizhou, and Chuzhou demonstrated larger gaps. Empirical research by Wang et al. [67] further demonstrated that the YRD urban agglomeration could leverage digital inclusive finance to narrow the urban–rural income gap. Digital inclusive finance operates through two key mechanisms: first, by promoting household savings behavior, enabling rural residents to save more conveniently, and thereby strengthening rural financial capacity; and second, by fostering innovation and entrepreneurial activities at the societal level, which expands income sources and further balances urban–rural income distribution.
From 2000 to 2020, the YRD urban agglomeration exhibited significant polarization and radiation effects (Figure 3 and Figure 5). This phenomenon may be attributed to Shanghai driving development in surrounding areas through technological spillovers and capital diffusion [68,69], resulting in the formation of HH income clusters centered around Shanghai among both urban and rural residents of the region (Figure 3 and Figure 5). Looking ahead, further facilitating the rational flow of resources—such as capital, technology, information, and talent—to surrounding areas could enhance the well-being of urban and rural residents across the YRD. Additionally, the development of emerging industries plays a crucial role in improving rural income well-being [70,71]. Between 2010 and 2020, HH income clusters expanded southward from Shanghai into southern Zhejiang Province. The share of HH income clusters there increased from 7.5% in 2010 to 64.2% in 2020 (Figure 5), likely reflecting Zhejiang Province’s emphasis on promoting emerging industry development [72,73].
Although both urban and rural HDI in the YRD urban agglomeration significantly improved (Figure 2 and Figure 4), the region still exhibited prominent imbalances in urban education well-being and rural income well-being. The mean Gini coefficient for urban education was more than three times higher than that for urban health, while the mean Gini coefficient for rural income was over twice that for rural health (Figure 7). In the future, the government could enhance the spatial alignment of population and educational resources (e.g., by strengthening support for and regulation of private compulsory education) to improve regional equity in urban education well-being. Additionally, policies promoting rural tourism, e-commerce, and smart agriculture may help balance regional disparities in rural income well-being. Improving the equitable distribution of medical resources and enhancing urban–rural medical insurance systems facilitate further elevation of the well-being of both urban and rural residents, fostering coordinated and sustainable development in the YRD urban agglomeration [74,75].

5.4. Limitations and Prospects

This study systematically assessed the objective well-being of urban and rural residents in the YRD urban agglomeration from 2000 to 2020 based on the HDI. However, subjective well-being was not considered in this evaluation. Some scholars quantified subjective well-being in the core region of the YRD through questionnaire surveys and interviews [76]. As two distinct dimensions of quality of life measurement, objective and subjective well-being offer different perspectives on living conditions. Future studies should incorporate the evaluation of residents’ subjective well-being using methods such as questionnaire surveys and in-depth interviews to capture their perceptions and lived experiences. Such an approach would provide a more holistic understanding of both objective and subjective well-being among urban and rural residents.
Moreover, this study was limited to the prefecture-level city scale within the YRD urban agglomeration and did not extend to the county or finer level. This limitation may have influenced the comprehensiveness and accuracy of the findings. Future research should expand the geographical scope and refine the analysis at the county or finer level. A more granular perspective and in-depth examination will help uncover both the differences and commonalities in urban and rural well-being across various regions and spatial scales, providing a scientific basis for formulating more targeted and effective policies.

6. Conclusions

Based on the HDI, this study examined the spatiotemporal disparities in well-being among urban and rural residents in the YRD urban agglomeration from 2000 to 2020. The findings indicate a significant improvement in well-being for both urban and rural residents over this period. The average urban HDI increased from 0.66 in 2000 to 0.83 in 2020, while the rural HDI rose from 0.55 to 0.74. Among the various dimensions of well-being, income well-being exhibited the most substantial growth, with the urban income index increasing by 49.12% and the rural income index rising by 66.3%. Despite the overall improvements in human well-being across the YRD urban agglomeration, a persistent gap between urban and rural residents remained. However, rural well-being demonstrated considerable development potential. The well-being of rural residents increased by 34.55% from 2000 to 2020, surpassing the 27.13% growth observed among urban residents. This trend was particularly evident in health well-being, as rural residents in southern Zhejiang maintained higher health well-being levels than their urban counterparts from 2000 to 2005. Additionally, notable regional disparities persisted in income well-being between urban and rural residents within the YRD urban agglomeration. Looking ahead, digital inclusive finance can serve as a key instrument for narrowing the income well-being gap between urban and rural residents, thereby fostering more balanced regional development. The findings of this study provide valuable insights for policymakers in the YRD urban agglomeration. They offer a scientific basis for formulating evidence-based urban and rural development strategies, promoting regional equity, and enhancing overall human well-being.

Author Contributions

Conceptualization, Q.M.; methodology, Y.Z. and Y.H.; formal analysis, Y.H. and Y.Z.; writing—original draft preparation, Y.Z. and Y.H.; writing—review and editing, Q.M., Y.Z., Y.H., X.S., J.D. and N.Z.; visualization, Y.Z.; supervision, Q.M.; project administration, Q.M. and J.G. All authors have read and agreed to the published version of the manuscript.

Funding

This research was funded by the National Social Foundation of China (Grant No. 17ZDA058), and Philosophy and Social Sciences Planning fund of Shanghai (Grant No. 2024BCK011).

Institutional Review Board Statement

Not applicable.

Informed Consent Statement

Not applicable.

Data Availability Statement

The original contributions presented in this study are included in this article, further inquiries can be directed to the corresponding author.

Conflicts of Interest

The authors declare no conflicts of interest.

References

  1. Ciftcioglu, G.C. Assessment of the relationship between ecosystem services and human wellbeing in the social-ecological landscapes of Lefke Region in North Cyprus. Landsc. Ecol. 2017, 32, 897–913. [Google Scholar] [CrossRef]
  2. Summers, J.K.; Smith, L.M.; Case, J.L.; Linthurst, R.A. A review of the elements of human well-being with an emphasis on the contribution of ecosystem services. AMBIO 2012, 41, 327–340. [Google Scholar] [CrossRef] [PubMed]
  3. Diener, E.; Oishi, S.; Tay, L. Advances in subjective well-being research. Nat. Hum. Behav. 2018, 2, 253–260. [Google Scholar] [CrossRef] [PubMed]
  4. Oswald, A.J.; Wu, S. Objective Confirmation of Subjective Measures of Human Well-Being: Evidence from the U.S.A. Science 2010, 327, 576–579. [Google Scholar] [CrossRef] [PubMed]
  5. Krueger, A.B.; Stone, A.A. Progress in measuring subjective well-being. Science 2014, 346, 42–43. [Google Scholar] [CrossRef]
  6. Layard, R. Measuring Subjective Well-Being. Science 2010, 327, 534–535. [Google Scholar] [CrossRef]
  7. Dade, M.C.; Bonn, A.; Eigenbrod, F.; Felipe-Lucia, M.R.; Fisher, B.; Goldstein, B.; Holland, R.A.; Hopping, K.A.; Lavorel, S.; le Polain de Waroux, Y.; et al. Landscapes—A lens for assessing sustainability. Landsc. Ecol. 2025, 40, 28. [Google Scholar] [CrossRef]
  8. Fu, B.; Liu, Y.; Zhao, W.; Wu, J. The emerging “pattern-process-service-sustainability” paradigm in landscape ecology. Landsc. Ecol. 2025, 40, 54. [Google Scholar] [CrossRef]
  9. Long, H.-L.; Zou, J. Rural Transformation and Development during Rapid Urbanization in China. J. Soochow Univ. (Philos. Soc. Sci. Ed.) 2011, 32, 97–100. (In Chinese) [Google Scholar]
  10. Liu, Y.S.; Liu, Y.; Chen, Y.F.; Long, H.L. The process and driving forces of rural hollowing in China under rapid urbanization. J. Geogr. Sci. 2010, 20, 876–888. [Google Scholar] [CrossRef]
  11. Liu, Y.S.; Yang, R.; Li, Y.H. Potential of land consolidation of hollowed villages under different urbanization scenarios in China. J. Geogr. Sci. 2013, 23, 503–512. [Google Scholar] [CrossRef]
  12. Du, J.; Liu, Y.; Xu, Z.; Duan, H.; Zhuang, M.; Hu, Y.; Wang, Q.; Dong, J.; Wang, Y.; Fu, B. Global effects of progress towards Sustainable Development Goals on subjective well-being. Nat. Sustain. 2024, 7, 360–367. [Google Scholar] [CrossRef]
  13. Liu, L.; Liu, Y.; Kong, L.; Zhong, Z.; Fang, X. How Do Changes in Ecosystem Services Multifunctionality Influence Human Wellbeing? Evidence From the Yangtze River Delta Urban Agglomeration in China. Land Degrad. Dev. 2024, 35, 5224–5236. [Google Scholar] [CrossRef]
  14. Wei, H.; Liu, H.; Xu, Z.; Ren, J.; Lu, N.; Fan, W.; Zhang, P.; Dong, X. Linking ecosystem services supply, social demand and human well-being in a typical mountain–oasis–desert area, Xinjiang, China. Ecosyst. Serv. 2018, 31, 44–57. [Google Scholar] [CrossRef]
  15. Buck, K.D.; Summers, J.K.; Smith, L.M.; Harwell, L.C. Application of the Human Well-Being Index to Sensitive Population Divisions: A Children’s Well-Being Index Development. Child Indic. Res. 2018, 11, 1249–1280. [Google Scholar] [CrossRef]
  16. Lakócai, C. How sustainable is happiness? An enquiry about the sustainability and wellbeing performance of societies. Int. J. Sustain. Dev. World Ecol. 2023, 30, 420–427. [Google Scholar] [CrossRef]
  17. Shay, C.M.; Poudel, R.; Stitzel, K.; Khan, Y. Current and Future Perceptions of Well-being are Associated With General Health Status in Adults: Results From the Gallup National Health and Well-being Index, 2018. Circulation 2020, 141 (Suppl. S1), AP393. [Google Scholar] [CrossRef]
  18. Yin, R.; Lepinteur, A.; D’Ambrosio, C. Life Satisfaction and the Human Development Index Across the World. J. Cross-Cult. Psychol. 2021, 54, 002202212110447. [Google Scholar] [CrossRef]
  19. Khazaei, S.; Armanmehr, V.; Nematollahi, S.; Rezaeian, S.; Khazaei, S. Suicide rate in relation to the Human Development Index and other health related factors: A global ecological study from 91 countries. J. Epidemiol. Glob. Health 2017, 7, 131–134. [Google Scholar] [CrossRef]
  20. Khazaei, Z.; Mazaheri, E.; Hasanpour-Dehkordi, A.; Pordanjani, S.R.; Naghibzadeh-Tahami, A.; Naemi, H.; Goodarzi, E. COVID-19 Pandemic in the World and its Relation to Human Development Index: A Global Study. Arch. Clin. Infect. Dis. 2020, 15, e103093. [Google Scholar] [CrossRef]
  21. Kummu, M.; Taka, M.; Guillaume, J.H.A. Gridded global datasets for Gross Domestic Product and Human Development Index over 1990–2015. Sci. Data 2018, 5, 180004. [Google Scholar] [CrossRef] [PubMed]
  22. Khazaei, Z.; Sohrabivafa, M.; Darvishi, I.; Naemi, H.; Goodarzi, E. Relation between obesity prevalence and the human development index and its components: An updated study on the Asian population. J. Public Health 2020, 28, 323–329. [Google Scholar] [CrossRef]
  23. Mabaso, M.L.H.; Zama, T.P.; Mlangeni, L.; Mbiza, S.; Mkhize-Kwitshana, Z.L. Association between the Human Development Index and Millennium Development Goals 6 Indicators in Sub-Saharan Africa from 2000 to 2014: Implications for the New Sustainable Development Goals. J. Epidemiol. Glob. Health 2018, 8, 77–81. [Google Scholar] [CrossRef] [PubMed]
  24. Çilingirtürk, A.M.; Koçak, H. Human Development Index (HDI) Rank-Order Variability. Soc. Indic. Res. 2018, 137, 481–504. [Google Scholar] [CrossRef]
  25. Rende, S.; Donduran, M. Neighborhoods in Development: Human Development Index and Self-organizing Maps. Soc. Indic. Res. 2013, 110, 721–734. [Google Scholar] [CrossRef]
  26. Sedaghati, A.; Talebkhah, H.; Omrani, S. Analyzing The Role of Migration Phenomenon on The Human Development Index of The City, Case Study: Bojnord City. Int. J. Sustain. Constr. Eng. Technol. 2023, 14, 134–147. [Google Scholar] [CrossRef]
  27. Xu, Y.A.; Li, H.; Zhang, R.F.; Wang, T.; Sui, P.; Sheng, J.; Gao, W.S.; Chen, Y.Q. Balancing the development and carbon emissions in rural areas of China. J. Clean. Prod. 2024, 454, 142338. [Google Scholar] [CrossRef]
  28. Bhattacharya, B. Urbanisation and human development in West Bengal: A district level study and comparison with inter-state variation. Econ. Political Wkly. 1998, 33, 3027–3032. [Google Scholar]
  29. Huang, G.; Jiang, Y. Urbanization and Socioeconomic Development in Inner Mongolia in 2000 and 2010: A GIS Analysis. Sustainability 2017, 9, 235. [Google Scholar] [CrossRef]
  30. Wu, Y. Economic Perspectives on Human Development in China. Ph.D. Thesis, Jilin University, Changchun, China, 2014. (In Chinese). [Google Scholar]
  31. Bobkov, V.N.; Dolgushkin, N.K.; Odintsova, E.V. The Inequality of Human Potential in Urban and Rural Areas: Risks and Opportunities. Her. Russ. Acad. Sci. 2023, 93, 285–293. [Google Scholar] [CrossRef]
  32. He, Y.; Liu, C.; Zhou, G.; Chen, Y. Measurement and Differences of Urban and Rural Residents’ Well-being in the Yangtze River Economic Belt. Trop. Geogr. 2021, 41, 327–339. (In Chinese) [Google Scholar]
  33. Liu, Y.; Chen, S.; Wang, X.; He, B.; Sun, D.; Yin, D. Research on the Prediction of Per Capita Life Expectancy in Hainan Province from 2018 to 2022. Chin. J. Prev. Med. 2024, 25, 1148–1151. (In Chinese) [Google Scholar]
  34. Kuang, W.H. 70 years of urban expansion across China: Trajectory, pattern, and national policies. Sci. Bull. 2020, 65, 1970–1974. [Google Scholar] [CrossRef] [PubMed]
  35. Liu, J.; Zhang, Q.; Hu, Y. Regional differences of China’s urban expansion from late 20th to early 21st century based on remote sensing information. Chin. Geogr. Sci. 2012, 22, 1–14. [Google Scholar] [CrossRef]
  36. Hu, A.-G.; Shi, Z.-D.; Tang, X. China’s HDI Regional Disparity Continuously Decreases and Its Explanatory Factors (1982–2015). J. Xinjiang Norm. Univ. (Philos. Soc. Sci. Ed.), 2018; 47–55+2. (In Chinese) [Google Scholar]
  37. Ren, D.; Wu, X.; Cao, G. Measurement and Influencing Factors of Human Development Levels in Different Regions of China. Chin. Popul. Sci. 2020, 41–52+127. (In Chinese). Available online: https://kns.cnki.net/kcms2/article/abstract?v=i7m15r_oBqoQEO2HTZ39N94cZahYsGBPeXfSZ6RCNhHPnAW7-y5Z6vq4cbz6Pj6SzHKQkz_hrI7_fF13d1s8-zWvr1dn9t9BvnmdIr4tm8YA9wPYbTaMMiLJTG4ufBNTLne_LG9Ne2K7kNnNEMD08zoK2sAx6zMkoqWPav5pBlb9DJdfbZSkJA==&uniplatform=NZKPT&language=CHS (accessed on 16 June 2025).
  38. Peng, G.; Liu, M. Urban–Rural Development Disparities at the Provincial Level in China: Measurement and Evolution Based on HDI. Stat. J. 2024, 5, 12–25. (In Chinese) [Google Scholar]
  39. Chen, Q.; Wang, F.; Li, X.; Yang, J.; Yu, S.; Hu, J. Development of a Simplified Life Table Excel Program and Its Application in Evaluating Residents’ Health Status. J. South. Med. Univ. 2012, 32, 627–630. (In Chinese) [Google Scholar]
  40. Qiu, H.; Li, J.; Yu, L.; Yu, D.; Hou, Z. Analysis of Average Life Expectancy and Disease Influencing Factors. Popul. J. 2018, 40, 31–39. (In Chinese) [Google Scholar]
  41. Vachon, P.J.; Sestier, F. Life Expectancy Determination. Phys. Med. Rehabil. Clin. N. Am. 2013, 24, 539–551. [Google Scholar] [CrossRef]
  42. Song, H.; Ma, H. An Estimation of Urban–Rural Disparity in China Using the Human Development Index. Econ. Res. J. 2004; 4–15. (In Chinese) [Google Scholar]
  43. Wang, Z.; Zheng, X.; Wang, Y.; Bi, G. A multidimensional investigation on spatiotemporal characteristics and influencing factors of China’s urban-rural income gap (URIG) since the 21st century. Cities 2024, 148, 104920. [Google Scholar] [CrossRef]
  44. Zhou, Y.; Liu, Z.; Wang, H.; Cheng, G.Q. Targeted poverty alleviation narrowed China’s urban-rural income gap: A theoretical and empirical analysis. Appl. Geogr. 2023, 157, 103000. [Google Scholar] [CrossRef]
  45. Basu, T.; Das, A. Formulation of deprivation index for identification of regional pattern of deprivation in rural India. Socio-Econ. Plan. Sci. 2021, 74, 100924. [Google Scholar] [CrossRef]
  46. Zhang, R.J.; Bao, Q.F. Evolutionary characteristics, regional differences and spatial effects of coupled coordination of rural revitalization, new-type urbanization and ecological environment in China. Front. Environ. Sci. 2024, 12, 1510867. [Google Scholar] [CrossRef]
  47. Wu, Y.Z.; Chen, X.M. A Spatiotemporal Evolution and Pathway Analysis of Rural Development Efficiency: A Case Study of the Yangtze River Delta. Sustainability 2024, 16, 6543. [Google Scholar] [CrossRef]
  48. Ma, L.; Xu, D.N.; Liang, R.; Song, J.B. Exploring Spatial Connection Networks in Metropolitan Areas Led by Megacities: A Case Study of the Shanghai Metropolitan Area. J. Urban Plann. Dev. 2023, 149, 15. [Google Scholar] [CrossRef]
  49. Ye, C.; Zhu, J.; Li, S.; Yang, S.; Chen, M. Assessment and analysis of regional economic collaborative development within an urban agglomeration: Yangtze River Delta as a case study. Habitat Int. 2019, 83, 20–29. [Google Scholar] [CrossRef]
  50. Feng, D.; Jia, J.; Qiao, X. Assessment on Radiant Ability of Regional Central City—A Case Study of Zhengzhou City. Geogr. Sci. 2006, 26, 266–272. (In Chinese) [Google Scholar]
  51. Liu, Y.D.; Nath, N.; Murayama, A.; Manabe, R. Transit-oriented development with urban sprawl? Four phases of urban growth and policy intervention in Tokyo. Land Use Policy 2022, 112, 105854. [Google Scholar] [CrossRef]
  52. Williams, G. Metropolitan governance and strategic planning: A review of experience in Manchester, Melbourne, and Toronto. Prog. Plan. 1999, 52, 1–100. [Google Scholar] [CrossRef]
  53. Fan, X.Q.; Lu, Z.L.; Wu, H.X. Current Situation of Rural Residents’ Tourism: A Case Study in Zhejiang Province in China. Asia Pac. J. Tour. Res. 2014, 19, 1191–1206. [Google Scholar] [CrossRef]
  54. Zheng, L.; Zheng, Y.; Zhang, C. Urban Compulsory Education Enrollment Threshold and Migrant Children’s Settlement Decisions: Optimizing Spatial Allocation of Educational Resources under New Population Mobility Trends. J. Educ. 2024, 20, 126–141. (In Chinese) [Google Scholar]
  55. Li, H. Analysis of the Impact of New Urbanization on the Balanced Allocation of Urban and Rural Compulsory Education Resources and Countermeasures: A Case Study of Henan Province. Value Eng. 2013, 32, 240–242. (In Chinese) [Google Scholar]
  56. Bo, X.; Wang, Y. Crossing the threshold: A study on school-choice strategies of migrant worker families’ children under the point-based admission policy. J. China Univ. Min. Technol. (Soc. Sci. Ed.). 2025, pp. 1–17. (In Chinese). Available online: https://kns.cnki.net/kcms2/article/abstract?v=i7m15r_oBqr3Lbo2MzJ3z9RHxToYRqFBuqprjZfgI0JYalhD6uNHkLcqVdZSR5mig1qDEUOoArpNK8KiQsw3enCsxYGSwh6ibcqs4CTRah14KJvgZFH1XlAgQS0LsnDnVbKPvZIEa_VRUrMTXSZ-UepJIBfuXpKH-QN2aZL4bhr6X_dV9oiWsg==&uniplatform=NZKPT&language=CHS (accessed on 16 June 2025).
  57. Central Institute of Educational Sciences Research Team. Survey Report on the Educational Status of Migrant Workers’ Children Entering Cities. Educ. Res. 2008, 29, 13–21. (In Chinese) [Google Scholar]
  58. Ding, X.; Wu, Z.; Xu, Q. Why Do Large Cities Face Compulsory Education Resource Carrying Capacity Issues? Res. Educ. Dev. 2019, 39, 8–15. (In Chinese) [Google Scholar]
  59. Wang, S.Y.; Duan, L.C.; Jiang, S.W. Research on Spatial Differences and Driving Effects of Ecological Well-Being Performance in China. Int. J. Environ. Res. Public Health 2022, 19, 9310. [Google Scholar] [CrossRef]
  60. Hu, J. Study on the Impact of Urban Coordinated Development in the Yangtze River Delta on the Urban-Rural Income Gap. Ph.D. Thesis, Beijing Jiaotong University, Beijing, China, 2024. (In Chinese). [Google Scholar]
  61. Huang, G. Analysis of Factors Influencing the Urban-Rural Income Gap: An Empirical Study of 16 Prefecture-Level Cities in the Yangtze River Delta. Shanghai Econ. Res. 2009; 15–25. (In Chinese) [Google Scholar]
  62. Pan, H.; Song, H.; Hu, Y.; Wang, Y. Study on the Impact of Rural Financial Development on Farmers’ Income Growth in the Yangtze River Delta Region. Value Eng. 2013, 24, 46–54. (In Chinese) [Google Scholar]
  63. Wang, D.; Zhao, Z. Practice and Exploration of Regional Collaborative Innovation at the Shanghai Academy of Agricultural Sciences. Shanghai Agric. J. 2018, 34, 107–111. (In Chinese) [Google Scholar]
  64. Du, P. Analysis of the Health Status of the Elderly Population in China. Popul. Econ. 2013; 3–9. (In Chinese) [Google Scholar]
  65. Zhang, Q.; Zhao, B. Performance Analysis of the “Welfare-Risk” Model in the New Rural Cooperative Medical System: An Empirical Study Based on Yinzhou District, Zhejiang Province. Econ. Syst. Reform. 2009, pp. 106–110. (In Chinese). Available online: https://kns.cnki.net/kcms2/article/abstract?v=i7m15r_oBqrGE3plDp_eRtqUv_4IcmqTrAhCs61zro9bGYGJlFOaNZq7ycjxsa3jY8TuRJB8GOZjRV_0DJGMJA0U3NVMYrbYmu6r6qDE9qhljrxtX1yeHQRXqVmYvKcPFQ0O7HVyVUtQ6HR2p12juItbDXHyCuIUvuOx7gZsIv0iPTZfADQx6w==&uniplatform=NZKPT&language=CHS (accessed on 16 June 2025).
  66. Zhao, W.; Jiang, C. Analysis of the Spatial and Temporal Characteristics and Dynamic Effects of Urban-Rural Integration Development in the Yangtze River Delta Region. Land 2022, 11, 1054. [Google Scholar] [CrossRef]
  67. Wang, S.; Wu, C.; Fu, B. The dual effects of digital inclusive finance on the urban-rural income gap: An empirical investigation in China’s Yangtze River Delta region. Financ. Res. Lett. 2024, 69, 106049. [Google Scholar] [CrossRef]
  68. Gu, R.; Yin, W. On the Formation of the Yangtze River Delta Urban Economic Circle and the Functional Positioning of Its Core City, Shanghai. Areal Res. Dev. 2001, 20, 27–31. (In Chinese) [Google Scholar]
  69. Chen, M.; Li, Q.; Zhang, B.; Xie, L.; Liu, J.; Geng, Y.; Liu, Z. The Spatial Correlation Network of China’s High-Quality Development and Its Driving Factors. Sustainability 2023, 15, 15738. [Google Scholar] [CrossRef]
  70. Liu, Y. Agricultural Digital Transformation Efficiency Analysis and Response Strategies. Econ. Rev. 2020, 7, 106–113. (In Chinese) [Google Scholar]
  71. El Bilali, H.; Allahyari, M.S. Transition towards sustainability in agriculture and food systems: Role of information and communication technologies. Inf. Process. Agric. 2018, 5, 456–464. [Google Scholar] [CrossRef]
  72. Su, F.; Luo, J.; Liu, H.; Tong, L.; Li, Y. Assessment and Promotion Strategy of Rural Resilience in Yangtze River Delta Region, China. Sustainability 2022, 14, 5382. [Google Scholar] [CrossRef]
  73. Zhang, D.; Lin, Q.; Mao, S. Addressing Rural Decline: China’s Practices in Rural Transformation and Farmers’ Income Growth. Agriculture 2024, 14, 1654. [Google Scholar] [CrossRef]
  74. Liu, H.; Dai, W.D. An Empirical Study on the Benefits Equity of the Medical Security Policy: The China Health and Nutrition Survey (CHNS). Int. J. Environ. Res. Public Health 2020, 17, 1203. [Google Scholar] [CrossRef]
  75. Yang, H.; Chen, H.L. From State Security Model to Selective plus Residual Security Model: Health care regime shift in urban China. Int. J. Soc. Welf. 2018, 27, 62–73. [Google Scholar] [CrossRef]
  76. Gao, Y.M.; Zhang, N.J.; Ma, Q.; Li, J.W. How is human well-being related to ecosystem services at town and village scales? A case study from the Yangtze River Delta, China. Lands. Ecol. 2024, 39, 126. [Google Scholar] [CrossRef]
Figure 1. Location of the Yangtze River Delta urban agglomeration in China.
Sustainability 17 05682 g001
Figure 2. Spatial distributions of urban HDI from 2000 to 2020 in the Yangtze River Delta. The criteria for the HDI classification used natural breaks and UNDP HDI standards.
Sustainability 17 05682 g002
Figure 3. Spatial clustering maps of the three indicators composing urban HDI in the Yangtze River Delta from 2000 to 2020.
Sustainability 17 05682 g003
Figure 4. Spatial distributions of rural HDI from 2000 to 2020 in the Yangtze River Delta. The criteria for the HDI classification used natural breaks and UNDP HDI standards.
Sustainability 17 05682 g004
Figure 5. Spatial clustering maps of the three indicators composing rural HDI in the Yangtze River Delta from 2000 to 2020.
Sustainability 17 05682 g005
Figure 6. Spatial distributions of the urban–rural gap in HDI and its corresponding three indicators from 2000 to 2020 in the Yangtze River Delta.
Sustainability 17 05682 g006
Figure 7. Gini coefficients of urban HDI (a) and rural HDI (b), and those of their corresponding three indicators in the Yangtze River Delta from 2000 to 2020.
Sustainability 17 05682 g007
Figure 8. Characteristics and implications of urban–rural HDI in the Yangtze River Delta.
Sustainability 17 05682 g008
Table 1. Data sources for each dimension.
DimensionIndicatorData Sources
A decent standard of livingPer capita disposable income (yuan)Shanghai Statistical Yearbook (2001–2021)
Zhejiang Statistical Yearbook (2001–2021)
Jiangsu Statistical Yearbook (2001–2021)
Anhui Statistical Yearbook (2001–2021)
Access to knowledgeAverage years of schooling (year)Census Yearbook 2000
Data from the 1% Population Sample Survey, 2005
Census Yearbook 2010
Data from the 2015 1% Population Sample Survey.
2020 Census Yearbook
A long and healthy lifeAverage life expectancy (year)Census Yearbook 2000
Data from the 1% Population Sample Survey, 2005
Census Yearbook 2010
Data from the 2015 1% Population Sample Survey.
2020 Census Yearbook
Table 2. Maximum and minimum values of the indicators of average life expectancy, average years of schooling, and disposable income per capita.
DimensionIndicatorMinimumMaximum
A decent standard of livingPer capita disposable income (yuan)180135,000
Access to knowledgeAverage years of schooling (year)015
A long and healthy lifeAverage life expectancy (year)2085
Disclaimer/Publisher’s Note: The statements, opinions and data contained in all publications are solely those of the individual author(s) and contributor(s) and not of MDPI and/or the editor(s). MDPI and/or the editor(s) disclaim responsibility for any injury to people or property resulting from any ideas, methods, instructions or products referred to in the content.

