1. Introduction
On average, low-income households in the United States are less energy efficient than households in other income brackets [
1]. One in three low-income households struggles to afford energy costs, and one in five must make difficult tradeoffs and neglect necessities like food and medicine to meet their energy costs [
1]. Low-income communities make up nearly 20% of the United States population [
2], so energy-efficient retrofits made available to these residents at low or no cost can substantially reduce the energy burden associated with a transition to energy-efficient household practices. A household’s energy burden refers to the percentage of total annual income spent on home energy expenses (Energy Burden = Annual Utility Bills/Annual Household Income). From single-family to multifamily households, resident energy experiences differ significantly. Single-family residents typically have a higher capacity to repair and upgrade their homes. On the other hand, residents living in multifamily housing are typically responsible for utility bills but cannot undertake structural upgrades, select appliances, and other parameters, which, if they are renters, are the responsibility of property management teams. This means that property managers ultimately decide when appliances and home structures should be upgraded, replaced, or repaired.
Subsidized housing is associated with proportionally higher energy costs by income than similar markets. Low-income households across the U.S. spend, on average, 7.2 percent of their income on utility costs, more than twice as much as higher-income households [
3]. Eligibility for affordable housing in most cities is based on area median income and is regulated by the U.S. Department of Housing and Urban Development (HUD). Many cities are challenged by low-income housing needs that exceed existing housing availability. Thus, energy-efficient accommodations for residents take a backseat to general housing accommodations and commonly become the responsibility of management or residents rather than the local housing authority. Weatherization measures, like building envelope insulation, help reduce the heating and cooling demand, thus reducing the combustion of fossil fuels at the residential level and reducing the emissions of pollutants like sulfur dioxide (SO
2) [
4]. Current research on the experience of low-income households illustrates that energy-related programs across the United States are inaccessible, as many families do not qualify for rebates associated with implementing housing retrofits or cannot activate these benefits because they are renters. For example, Michigan residents who make the switch to solar panels can receive a 30% tax credit [
5]. However, this is not a feasible option for low-income residents who do not own their residences and cannot make major personal renovations. Energy efficiency and weatherization dollars are failing to reach renters including multifamily renters. Therefore, research on how energy efficiency programs can become more accessible to lower-income individuals is needed.
Prior work in this field is relatively limited. A review of research on residential energy efficiency interventions in low-income households indicates a significant variation in the impacts of these programs, driven by the populations involved, installation of measures, types of measures involved, and the ways the installed measures affect household behaviors [
6]. In some of the reviewed studies, residential energy efficiency interventions led to savings, while other interventions led to small or negative savings [
6]. A study in Poland suggests financial assistance, subsidies, and tax incentives combined with narratives that promote energy-saving behaviors are socially desirable ways to drive energy-efficient behaviors among low-income residents and help overcome cognitive and behavioral barriers to energy efficiency [
7]. Ultimately, families living on low incomes are making difficult tradeoffs and foregoing essentials to heat and cool their homes. Frank et al. use the term “heat or eat” to describe this type of dilemma, where residents must choose between spending money on heating their homes or food [
8]. Hernandez and Bird cite the Low-Income Home Energy Assistance Program and Weatherization Assistance Program as the two most notable U.S. federal resources for low-income households [
9]. The authors, however, note that these programs are historically vulnerable to budget cuts, weakening their reliability as resources for relief from energy hardship. Across low-income residents, homeowners and renters have low involvement in energy efficiency programs that, in theory, were designed to target their specific needs. Program materials that clearly outline the requirements and benefits of energy efficiency programs increase the likelihood that a resident will participate or make an inquiry to their landlord. According to Kleeman et al., uncertainty about eligibility is an especially important barrier to participation in low-income residential energy efficiency programs [
10]. The authors note that this barrier encompasses uncertainty around income requirements, home repair prerequisites, and even permission from landlords [
10], which applies specifically to residents living in units like those of our study participants. Multifamily housing poses unique challenges for the implementation of energy-efficient upgrades. A Swedish study found that during the planning and design phase for energy-efficient renovations in public housing, the property developer, consultant (contracted via public procurement), and the management team for a particular property generally met to make the final determinations on program design and investment [
11]. However, life cycle costing was not applied during these planning meetings, nor was sustainability a priority, and, instead, the least expensive measures were approved [
11].
Energy-efficient retrofits provide a clear path to cost savings at the household level [
9]. While programs that carry out these upgrades provide viable intervention strategies, they must be refined to make the benefits more accessible and enhance sustainability at a societal level. To effectively reach those families most in need, detailed individual household energy data are needed. Reames describes the proprietary nature of energy data as another significant barrier to successful programs, where utilities are concerned about customer privacy or are not incentivized to support projects that could jeopardize revenues [
12]. Considering this barrier, holistic and community-based approaches to energy efficiency can be applied to reach sustainability goals. Additionally, the relatively scarce evidence in this area of research and practice means that even smaller studies that engage community members in documenting their experiences with home energy improvements offer valuable insights for efforts to enhance sustainability and improve quality of life.
Partnership approaches to research that share power with and engage community partners, while benefiting the communities involved, are called community-based participatory research (CBPR) practices [
13]. CBPR methods can involve researchers providing technical assistance, incentivizing community participation in an existing program, or partnering with a community organization to achieve a common goal [
13]. In this study, University of Michigan (UM) researchers and community partners, in a CBPR partnership, helped facilitate community participation in a Detroit-based energy efficiency program.
The goal of this study was to examine energy and cost savings associated with a utility-offered energy efficiency program carried out in a low-income multifamily community of townhome-style units in Detroit, Michigan. We addressed the following research questions (RQs) in our work:
RQ1: What energy and monetary savings could public housing residents obtain from participating in a utility-offered energy efficiency program?
RQ2: What are the challenges associated with implementing an energy efficiency program in public housing?
Our intervention began with the installation of minor energy-conserving measures (ECMs) in each unit. As part of our intervention process, researchers hosted collaborative workshops where baseline energy surveys were distributed to residents before and after the installation of upgrades. We utilized these pre- and post-intervention survey responses to understand the expected and actual benefits to participants from the energy efficiency program. Additionally, we analyzed the energy consumption data collected before and after the installation of these measures to understand the energy and monetary savings resulting from the ECMs. Our community-engaged approach and findings can serve as a framework for assessing the impact of utility-offered energy efficiency programs and designing future programs, specifically for income-constrained multifamily residents. From this study, we can recommend solutions to better meet the energy needs of low-income multifamily homes and public housing residents.
2. Materials and Methods
2.1. Description of Study Area
Detroit is the most heavily populated city in Michigan, located in the southeast region of the state. As of 2020, Detroit’s total population is 639,611, with 254,275 total occupied housing units [
14]. Of this population, 77.8% of residents are Black, 12.2% of residents are White, and 7.5% are Hispanic or Latino. Detroit has a USD 37,761 median household income, and 31.5% of the population is in poverty. Deindustrialization and job and housing discrimination came to a head in 1967, when Detroit endured one of the most violent and ruinous uprisings in U.S. history [
15]. In all, 43 people were killed and more than USD 50 million (USD 470 million in 2024 dollars) in property was destroyed [
16,
17]. Between 1970 and 1980, more than 310,000 White Detroit residents left for nearby suburbs, increasing the percentage of Black residents in Detroit drastically [
18].
Much of Detroit’s housing stock was never repaired following the uprising, and presently, 80% of Detroit’s mostly single-family housing stock was built before 1960 [
19]. Aged housing stock is commonly associated with a high energy burden, where residents require repairs or remodels to bring their homes to the current energy-efficient standards and make them comfortable to live in. With a high energy burden considered to be above 6% and a severe energy burden of about 10% [
20], many Detroiters experience this high burden in part because of the aged housing stock and economic disinvestment in the city. Detroit is one of six metropolitan areas with a greater percentage of high energy-burdened households (30%) than the national average of 25% [
20]. While the median energy burden across Detroit is 3.8%, the median energy burden for Detroiters with a low income is 10.2%, and the energy burden for multifamily residents with a low income is 6% [
20].
Friends of Parkside (FOP) is a 501(c)(3) organization located in the Villages at Parkside (TVP)—a public housing community on Detroit’s east side. Originally named Parkside Homes, the development was constructed in 1939 with 775 family-dwelling units. When Parkside Homes was built in the 1930s, the property’s brick exterior used products that did not meet today’s standards for building materials and require updates. In fact, Michigan did not change its building code until 1970, when it became a requirement for exterior walls to be insulated [
21]. This is also true of many low-income multifamily dwellings built across the U.S. in the 1950s following the Housing Act of 1949, which reauthorized the expansion of public housing and new construction [
22]. The last full-scale redevelopment occurred in 1996, when the property was renamed the Villages at Parkside (TVP) and consisted of 275 units built in Villages 2 and 4. Villages 1 and 3 were slated for redevelopment but to this day remain vacant. The existing homes in TVP (
Figure 1) are handicapped-accessible townhome-style units with bedrooms ranging from 1 to 5. Each unit has central air conditioning.
2.2. Origins of Study, Participant Recruitment, Data Collection, Energy Upgrades
The collaboration between University of Michigan researchers and FOP on health and the impacts of climate change began in 2016 [
23], and we have since conducted a range of energy and health-related projects with this community. TVP was chosen for this study because of our long-term collaboration with FOP and the importance of understanding the energy burdens among residents in public housing. We designed a survey to capture key characteristics of participants as well as their experiences with energy use and financial thereof before and after the planned upgrades (please see details below) to support evaluation. Additionally, available resources from the local utility (DTE) to improve energy efficiency in multifamily housing were acquired by a local service provider, Walker-Miller Energy Services [
24], providing an opportunity to evaluate the experiences of the residents. Beginning in 2022, we collected data for this energy efficiency intervention over two years.
After human subjects research approval for the study was received from the University of Michigan Institutional Review Board (classified as exempt), residents in TVP were recruited through a series of public workshops hosted at a TVP community center. Introductory workshops were held from July 2022 through September 2022. In the time leading up to each workshop, resident outreach was conducted by the Executive Director (ZER) and staff at FOP. A wide variety of promotional materials were utilized to maximize participant recruitment. We prepared flyers, banners, voice messages, and promotional videos that were used for robocalls and text messages to aid in community outreach conducted by FOP.
Introductory workshops provided an overview of the study, including compensation for participants at each data collection stage, allotted time for potential participants to ask questions, and concluded with a baseline energy survey for the research participants. At the beginning of the workshops, Walker-Miller Energy Services provided an overview of the residential energy efficiency measures they would provide each resident (regardless of study participation) starting in August 2022. Next, a presentation providing an overview of the study was shared by the investigators (MWM, CJG, MSO, and ZER), and participants received information sheets; if they agreed to participate, they were invited to remain at the workshop. Surveys were then administered electronically by the project staff (including MWM, KCK, MSO, SMC, and AM) on provided tablets via the Qualtrics survey platform.
Multiple choice survey questions, which were in part sourced from the U.S. Energy Information Administration’s Residential Energy Consumption Survey (RECS), were used to collect information on the residents’ socioeconomic status, energy-related habits, in-home appliances, and other data regarding their energy-related experiences. Detailed survey sections included Household Budget (from RECS), Respiratory and Cardiovascular Health, Financial Worry, Household and Neighborhood Environment, Mold/Pest Questions (from the American Housing Survey), Sleep/Work Schedule, Connectivity and Device Use, Household Demographics, and DTE energy bills. The Pittsburgh Sleep Quality Index, Satisfaction, Alertness, Timing, Efficiency, and Duration, and The Epworth Sleepiness Scale were also included in the survey, although those outcomes are not addressed in this paper.
Once the surveys were completed, staff provided instructions for the participants to install indoor temperature and humidity monitors (HOBO MX 1101, Onset Corp, Bourne, MA, USA) in their bedrooms. One monitor was issued per participating household. At the end of the workshops, most residents provided recent DTE bills as hard copies or via email to the research team for the analysis of pre-intervention energy consumption and associated costs.
Energy efficient upgrades were installed in TVP units by Walker-Miller Energy Services beginning in August 2022, with funding provided by DTE’s Multifamily Program. Specific upgrades available to TVP residents included: light emitting diode (LED) light bulbs, Emerson Sensi Wi-Fi enabled thermostats, ENERGY STAR certified refrigerators, energy-efficient shower heads, hot water pipe wraps, and kitchen/bathroom faucet aerators. Approximately 6 months after the upgrades were installed, the research team held another series of workshops during which the participants were surveyed again and were asked to return their temperature/humidity loggers. The post-intervention survey included new multiple-choice and open-ended questions on the residents’ satisfaction with the upgrades, expected savings, willingness to implement upgrades again, and other feedback.
2.3. Survey Analysis
Pre- and post-survey questionnaires were administered via Qualtrics and the responses were evaluated to assess the number and proportion of the participants’ responses for a given categorical response or the mean and standard deviation of continuous, numeric survey responses. Missing data, non-response, or “don’t know” responses were also reported for each survey question. Data cleaning was performed in Excel where categorical responses with multiple selections allowed were converted into a long format. Descriptive statistics were calculated using R in RStudio version 2024.04.2, using packages from readxl (v1.4.5) [
25], gtsummary (v2.2.0) [
26], dplyr (v1.1.4) [
27], and tidyr (v1.3.1) [
28]. For stress scales, responses were assigned values on a scale of 0 (did not happen) to 7 (extremely stressful) and
t-tests were performed. For categorical data, chi-squared tests comparing the never category to the 1 or more categories were performed. Results were considered statistically significant at
p < 0.05.
2.4. Energy Analysis: Pre- and Post-Intervention Energy Consumption
Copies of DTE bills were collected from the study participants in two phases, during the initial workshop after the pre-intervention survey, and at the end of the study after the post-intervention survey. Each DTE bill contains monthly gas and electricity consumption and costs for the 12 months leading up to the billing date. This allowed the research team to analyze the electricity consumption both before enrollment in the study and after home energy upgrades were installed.
The present study focused on the electricity consumption of each participant. Using DTE billing data before and after the energy upgrades were installed, average consumption figures in kWh were calculated for September through to mid-February. The calculations were made for each of the months: September, October, November, December, January, and February (during Fall 2021 and Winter 2022) and compared with the same months one year later, after the installation of the energy upgrades.
Tables were generated using the total monthly electricity consumption data and total estimated temperature-independent electricity consumption. The method used to calculate the temperature-independent electricity consumption is described in the following section. The separate analysis involving temperature-independent consumption totals allows us to focus on the potential effects of the installed energy upgrades, as these upgrades are expected to primarily impact temperature-independent energy consumption.
In addition to the analysis of the monthly electricity consumption figures in kWh, the corresponding expected monthly costs in US dollars to average participants were calculated before and after the installation of the energy upgrades. As the unit costs of energy to participants can slightly vary based on the energy rate plan each household participates in, we used figures based on data from Detroit-wide average costs of electricity per kWh each month, as released by the U.S. Bureau of Labor Statistics.
2.5. Temperature-Dependent and Temperature-Independent Electricity Consumption
In addition to the monthly energy bills, the hourly electricity usage data from June 2022 onwards was obtained from 14 out of 39 participants. Monthly electricity usage data before and after the intervention was used for the 25 remaining participants because the hourly data were unavailable. Hourly electricity usage data were used in combination with the hourly indoor temperature data obtained by the HOBO devices placed in the residents’ bedrooms and the hourly outdoor temperature data obtained from the outdoor airport temperatures at the nearest airport, the Coleman A. Young International Airport, formerly known as the Detroit City Airport.
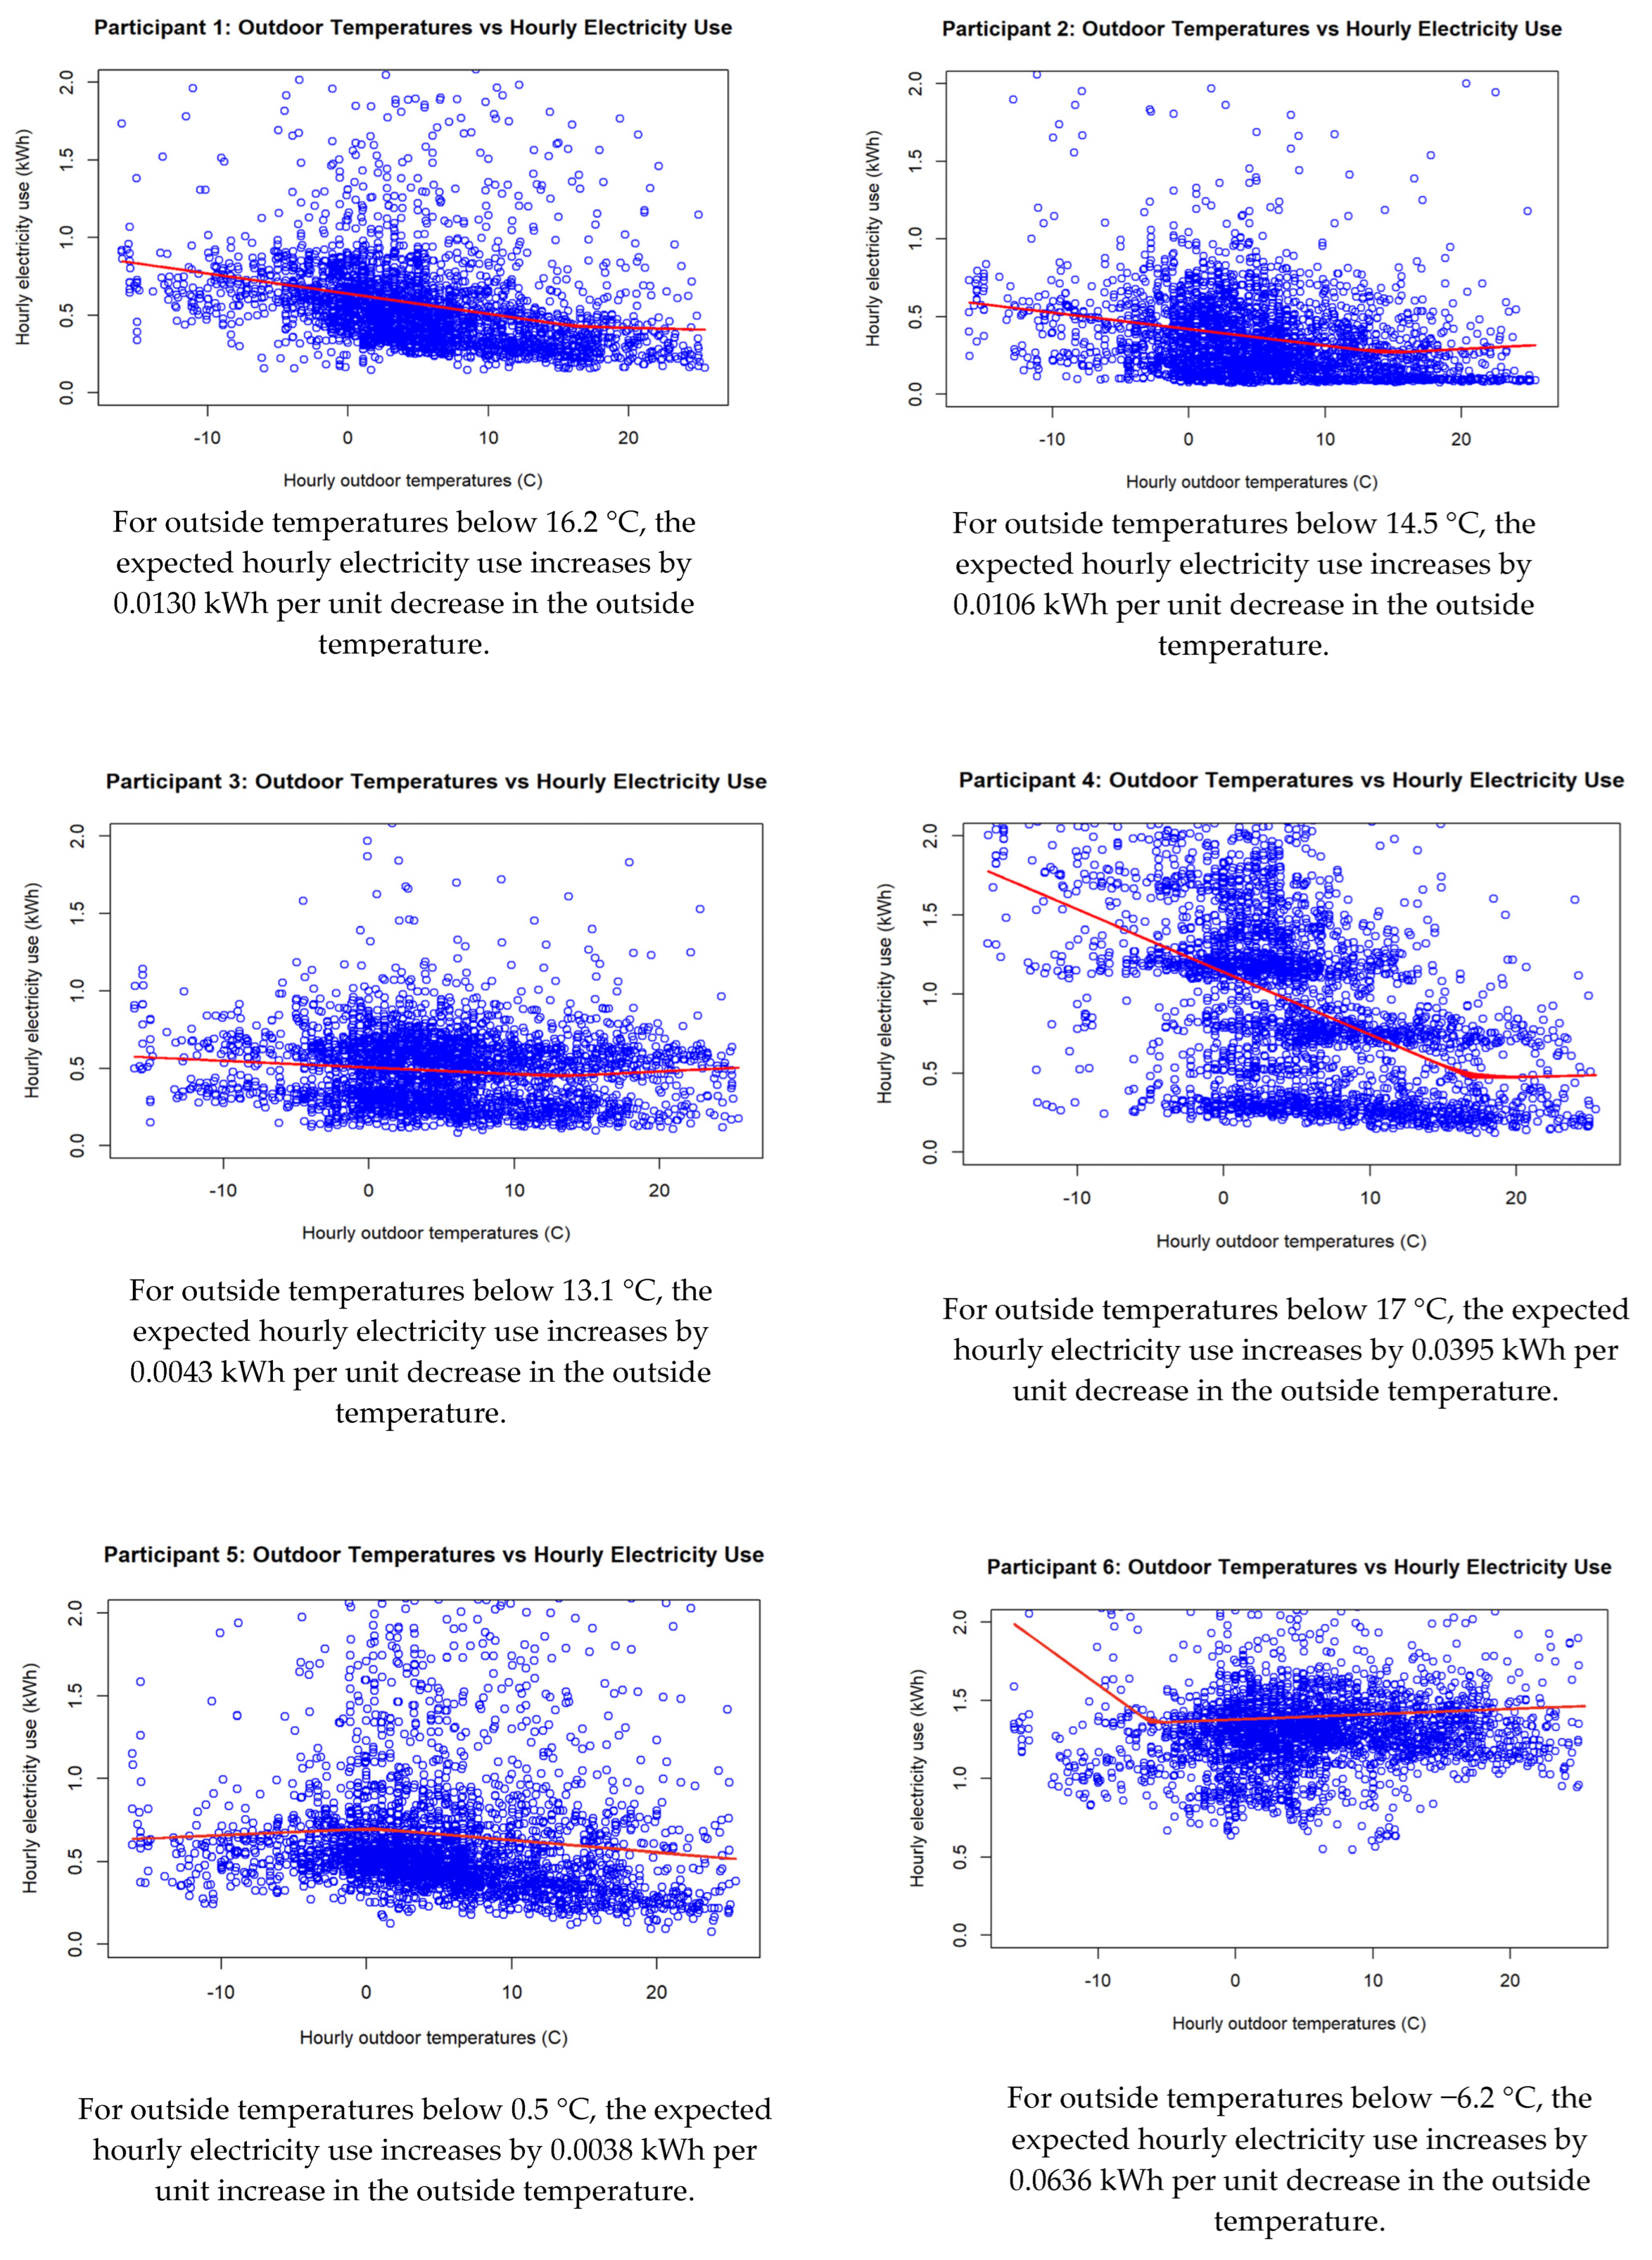
We then ran a piecewise linear regression between the hourly electricity use and the hourly outdoor temperatures to understand how much additional electricity was expected to be used for heating in an individual household for each unit decrease in the outside temperatures below a selected temperature cut point, or the heating degree hours per household. For residents at TVP, natural gas is the main source of heat. However, some participants use additional sources for heating, such as space heaters and kitchen ovens, which result in additional electricity consumption. Therefore, the energy consumed for heating is a combination of gas and electricity.
The percentage of electricity usage attributable to outside temperatures was computed by calculating the heating degree hours for each household with the hourly electricity usage data available. The selected date interval for this analysis was the 4.5-month period of 1 October 2022 to 14 February 2023, corresponding to the fall and winter months. Temperature-dependent electricity consumption percentages were calculated for each household over the full 4.5-month period and for each month within the study period. After obtaining the estimated percentages of electricity consumption attributable to outside temperatures for each household, these findings were compared with the pre-and post-survey responses of additional heating appliances used.
4. Discussion
This study of energy-efficient upgrades in an energy-burdened, low-income urban community provides new insights to help fill knowledge gaps and inform a just and rapid transition to a more climate-friendly future. We were able to gather data before and after the implementation of energy-efficiency upgrades provided to residents of public housing at no cost in Detroit, Michigan. Our primary findings included some perceived benefits of these measures by the participants as well as significant variability in energy burden related to the use of supplemental space heaters. Multiple factors influence energy consumption in a household, and isolating the effect of the upgrades on energy consumption poses challenges because of the weather, uncertainty about how much electricity the residents consume daily due to appliance use, and other factors. However, our analysis of both the potential cost savings and participant experiences with the measures provides qualitative and quantitative measures of impact.
More than half of our study participants received high-efficiency shower heads, ENERGY STAR-certified refrigerators, LED light bulbs, and Wi-Fi-enabled thermostats as part of a utility-offered energy efficiency program. Our pre-intervention surveys indicate that most study participants utilized a central AC unit for cooling, and all participants used a gas furnace for heating. For additional heating needs, the residents utilized a portable electric heater more commonly than any other type of heating equipment. While most participants indicated having central AC, some utilized portable AC units to supplement their cooling needs. Residents most engaged their thermostat units by setting them to one temperature and leaving them. Smart thermostat upgrades provided residents with the option to control temperatures remotely and learn in-home patterns to adjust heating and cooling accordingly. The updated thermostats may have increased ease of use for participants, as they were most popular among the ECMs according to the post-survey.
Our pre- and post-intervention energy analysis findings did not indicate a clear trend in energy savings across participants. Pre- and post-intervention cost savings were also impacted by limitations of the energy consumption data and varied from participant to participant. Subsequently, pre- and post-intervention cost analyses yielded different results across participants, where some residents used less energy and spent less money after the ECMs were installed, while others used slightly more energy and spent more money. More than half of the participants who responded indicated that they would like to save more energy, but did not know where to start, and 43.8% of participants reported that cost was a challenge they faced in reducing their energy usage and utility bills. Compared with participants who reported about USD 10 to USD 20 of perceived monthly savings from the upgrades in the survey responses, the participants were estimated to save an average of USD 101.91 annually, based on the data from the installed ECMs.
Our energy analysis results indicate that the participants were expected to utilize more energy and spend more money in the colder months. Furthermore, our energy consumption analysis identified excessive electricity consumption and higher percentages of electricity attributable to outside temperatures in select households relying on inefficient heating methods, where a substantial reduction in electricity consumption could be achieved by switching to more efficient heating methods. This increase appeared to be mostly due to the usage of space heaters, which are intended to be a temporary heating solution, or due to the use of kitchen ovens. Non-central heating methods should ideally be only used temporarily, but some residents in our study used them continuously during the cold fall and winter months either due to broken heating equipment, insufficient heating and insulation, or efforts to conserve gas costs associated with heating because of difficulties paying gas and electric bills. McKenna et al. [
29] noted that electricity cost 5–6x as much as gas per unit of energy. This means that even if a resident uses a small amount of electricity to heat a small portion of their home, it may cost more than utilizing the home’s furnace. Often, residents choose a low setpoint for their furnaces and run space heaters to generate additional heat at a lower cost, but do not truly benefit financially from this due to the cost of electricity.
These results align with previous findings regarding energy experiences and consumption for residents living in public housing. For example, Zota et al. [
30] cited indoor air exposure to nitrogen dioxide as potentially elevated in low-income households where apartment conditions drive behavioral responses like supplemental heating with a gas stove. This type of heating can drive a spike in household energy costs or increase the risk of health conditions caused or worsened by exposure to nitrogen dioxide. Increased levels of nitrogen dioxide are especially hazardous, as they can exacerbate allergies and symptoms of respiratory illness, create ear, nose, and throat irritation, and contribute to cognitive delays [
31].
The average estimated energy burden for TVP residents, using energy data from across the study period, was higher than 12.9%, which is significantly higher than both the criteria for high (above 6%) and severe energy burden (above 10%). Our estimates of energy burden do not account for the fact that most TVP residents have an annual income of much less than USD 20,000; the actual income figures would likely reveal a greater energy burden. According to an energy burden range developed by Cook and Shah [
32], households with an energy burden of less than 4% are ‘not burdened’, households with an energy burden of 4–7% are ‘energy stressed,’ households with an energy burden of 7–10% are ‘energy burdened’, and households with an energy burden greater than 10% are ‘energy impoverished’. Nearly all study participants fell within the ‘energy burdened’ and ‘energy impoverished’ categories of this range. The small ECMs provided to residents did not yield savings significant enough to reduce their energy burden. To potentially reduce the energy burden for TVP residents, comprehensive energy upgrades with the potential for greater savings need to be installed in these units.
As noted, this study found no evidence that the ECMs had reduced the overall household energy burdens. However, several other factors, including the condition of each home’s envelope, square footage, household appliances, occupied unit hours, and other factors, were important determinants of energy consumption. The ECMs did not include appliances used for heating, motivating the research team to explore, given the cold climate in Detroit, the amount of electricity consumed for heating during the cold months, recognizing that the heating needs vary a lot based on month-to-month differences in outside temperature.
5. Limitations
While all TVP residents were eligible to participate in the utility-offered program administered in the first phase of the project, the number of study participants was much smaller. Each resident who received ECMs did not take the surveys. Similarly, all study participants were not able to provide the research team with DTE bills or hourly energy consumption data. Some participants could not provide paper copies or access their online billing accounts, even with our team’s in-person technical assistance. Therefore, our sample size of participants with complete energy consumption data pre- and post-intervention was limited, and the participants in our study may not have been representative of the entire group receiving the intervention.
The overall size of our sample of participants was relatively limited at 39, but this was due in part to a limited budget for this research; costs included staff time, transportation, and participant incentives. However, given the paucity of research in this field, we feel that evidence from this work should be of use for promoting sustainability and equity in the future. In addition, enrolling participants who face numerous challenges, in addition to paying for energy and multiple demands on their time, can be difficult. Given the novel and challenging context, we had a small sample size, and are unable to claim that these participants—or are findings—are representative. However, we believe that the results are a useful source of hypotheses, which larger studies can seek to test.
Changes in unit occupation during the study may also have impacted the quality of our hourly energy consumption data. Some residents relocated during the study, driving a significant decline in energy consumption. We did not include these participants in the energy analysis. While the expected savings from this and similar programs were generated by engineering models that run under ideal conditions like controlled weather, optimal equipment usage, and other settings [
33], the actual savings were heavily impacted by the aforementioned resident behaviors. Additionally, utility rate plans differed across participants for a portion of the study. The research team could not account for this, and instead used an average for the energy cost.
It should be noted that the heating degree hour modeling approach has some limitations, as there are some potential confounding factors based on seasonal and daily factors (
Table 8). One limitation of the full model across the 4.5-month period is that the daylight hours differ across these months, and colder winter months correlate with longer dark hours, requiring a higher consumption of electricity for lighting needs. Thus, some of the additional electricity consumption observed when there was a higher difference in the indoor and outdoor temperatures may not purely indicate additional temperature-dependent electricity usage, but may be mixed with higher usage due to lighting needs during the dark hours of the day.
Although the monthly approach reduces the potential error in estimates due to changing hours of daylight across the 4.5-month period, a limitation of this approach is that it still does not consider the daily cycles of electricity consumption habits specific to the time of the day (
Table 8). For instance, night hours from 10 p.m. to 6 a.m. each day may be expected to result in less electricity consumption, as these are the most common sleep hours of the participants. However, these night hours also correlate with colder outside temperatures, resulting in greater differences between the indoor and outdoor temperatures. Hence, some reduced temperature-independent electricity consumption due to sleep hours may coincide with an increased need for electricity consumption for heating needs during night hours, causing a potential underestimation of the actual temperature-dependent electricity consumption.
To yield the most reliable figures for the pre- and post-intervention energy consumption, future studies should consider utilizing hourly energy consumption data, rather than relying on the participants to provide utility bills containing figures for the energy consumed. Additionally, future research may examine other approaches for mitigating the impact of seasonal differences or daily patterns of electricity consumption in measuring changes resulting from the ECMs.


 ,
, 


