Article

How to Distinguish Income Indicators of Energy and Transport Vulnerability—A Case Study of Greece

by
Vlasios Oikonomou
1,*,
Samuele Livraghi
1,
Konstantina Karalaiou
1,
Ivana Rogulj
1,2,
Stavros Spyridakos
1,3 and
Christos Tourkolias
4
1
Institute for European Energy and Climate Policy, Kingsfordweg 151, 1043GR Amsterdam, The Netherlands
2
Faculty of Economics and Business, University of Rijeka, Ivana Filipovića 4, 51000 Rijeka, Croatia
3
Department of Chemical Engineering, Aristotle University of Thessaloniki, University Campus, 54124 Thessaloniki, Greece
4
Centre for Renewable Energy Sources and Saving, 19009 Athens, Greece
*
Author to whom correspondence should be addressed.
Sustainability 2025, 17(10), 4275; https://doi.org/10.3390/su17104275
Submission received: 14 February 2025 / Revised: 30 April 2025 / Accepted: 5 May 2025 / Published: 8 May 2025
(This article belongs to the Special Issue Tackling Energy Poverty and Vulnerability Through Energy Efficiency)

Abstract

:
This article examines Greek households’ energy and transport poverty and vulnerability, two concepts often intertwined in policy, making use of both single and composite indicators. The methodology employed aligns with the European Social Climate Fund regulation, using household income from economically active members and the share of expenditures on fossil-based energy use in buildings and transport, as well as the required investment costs in energy efficiency improvements for dwellings or transport decarbonization measures. Through these indicators, the proportion of energy-vulnerable households in Greece ranges from 19% to 40%, while transport vulnerability varies between 22% and 43%. Notably, the analysis reveals that households in higher income categories can still be highly vulnerable, depending on household size, composition and dependency, which impact energy and transport needs. As such, the research findings reveal that the current legislative frameworks may not fully capture the vulnerability of certain demographic groups in the event of additional costs of fossil fuels due to new climate policies. Therefore, it is strongly recommended that policymakers adjust criteria to better target vulnerable households based on their unique characteristics and needs, and use improved data collection systems to monitor energy and transport poverty and vulnerability.

1. Introduction

The challenges of decarbonization and energy transition policies pertain not only to technical and economic issues, but also to societal ones [1]. As such, planning for these energy transitions must avoid the marginalization of vulnerable groups [2], which is a target of many EU interventions, such as the Recovery and Resilience Facility (EU) 2021/241 [1], the Just Transition Fund (EU) 2021/1056 [2], and the Social Climate Fund (SCF) (EU) 2023/955 [3,4].
The SCF Regulation conceptually links energy and transport vulnerability to the impacts expected from the introduction of the Emissions Trading System in buildings and transport (ETS2) (EU) 2023/959 in 2027 [3]. However, the framework narrows the vulnerability definition to affordability under additional costs from carbon pricing [3]. This Regulation requires the development of national Social Climate Plans, which require the identification of vulnerable groups, the estimation of the additional costs from carbon pricing, and the respective measures and investments to alleviate the pressure on the vulnerable groups, hereby referred to as Plans [4].
In drafting such Plans, substantial challenges arise in defining vulnerable targeted populations. This paper responds to this challenge through researching energy justice and a sustainable transition perspective to illustrate the definition of energy and transport vulnerabilities. These refer to how an energy system or entity is affected by adverse events related to economic, social, environmental, and governance risks, and how the energy system and its changes affect the engaged actors—mainly final consumers and their welfare [5]. To gain more contextual knowledge, this paper examines the concept of vulnerability for households experiencing energy and transport poverty, as well as those considered vulnerable under the SCF definition but not identified as energy-poor or transport-poor [6]. The aim is to disentangle the concepts of poverty and vulnerability in the energy and transport, sectors enabling policymakers to better identify the target groups of social and climate policies.
In Section 1, we review the literature and policy frameworks of the multifaced nature of energy and transport vulnerability, with particular emphasis on definitions established under the SCF. Section 2 presents our framework to assess these vulnerabilities through indicators. This includes a comparative analysis of these indicators relative to specific policy needs, with the creation of a composite indicator designed to effectively capture and address energy vulnerability. Taking Greece as a case study and using an updated 2023 household budget survey dataset, Section 3 assesses the extent and characteristics of vulnerable households and transport users. The final section concludes with policy implications to support more targeted and inclusive vulnerability-related interventions.

1.1. Research Contextualization

To better situate this research, a reflection on its relevance from different perspectives is offered through an energy justice approach and a sustainable transition lens. Energy justice puts values at the forefront of a field of science and study that is dominated by technical and economic solutions [7]. By promoting better access to electricity, sustainable energy use, poverty alleviation, and greater well-being for all people—regardless of their income, race, or ethnicity—energy justice aims to lessen energy poverty. Vulnerable groups are particularly susceptible to the negative impacts of energy poverty because of its link to social inequality. In addition to maintaining inequality, this could lead to the emergence of energy underclasses. Therefore, when some groups—typically lower-income households—face disproportionate energy burdens, an energy equity gap may arise. Consequently, policies that consider more than just energy poverty can achieve energy justice more effectively [8]. As such, the three tenets of energy justice can help first understand how the cost/benefits of ETS2 are allocated and determine who is disproportionally affected through the distributive justice lens. Second, the procedural perspective can determine whether affected communities have a say in policymaking. Third, recognition-based justice can inform how the identified vulnerabilities in transport and energy, arising from the foreseen increases in taxation, are acknowledged (and tackled).
Lastly, through the sustainable transition lens, a specific approach that argues interdisciplinary collaboration is essential for innovation because scientific fields can stagnate, and increasing specialization or resistance to opposing viewpoints may be signs of this [9]. The current prevalent metrics (such as energy expenditure ratios) may not be enough to adequately capture vulnerability at this stage of energy poverty research [10]. To incorporate more extensive social, environmental, and behavioral aspects, a paradigm change might be required, as regional differences, hidden forms of hardship, and connections with other aspects, such as transport poverty, are frequently overlooked by current metrics. In fact, little overlap between expenditure and perception-based indicators is observed; despite ample evidence that they overlook important aspects, such as energy availability in rental homes or mobility–energy tradeoffs, many measures of energy poverty continue to be used [11]. Although these practices impede the development of more comprehensive policymaking, they might safeguard the current structure [9]. New energy and transport poverty and vulnerability indicators need to be incorporated into official statistical measurements, curricula, and policy frameworks. Whereas energy justice promotes the necessity of fair energy access and inclusive decision-making, energy vulnerability draws attention to the systemic and structural hazards that sustain energy poverty, inviting experts to explore these conceptual and methodological gaps.

1.2. Dimensions of Energy Vulnerability

The defining challenges of energy vulnerability have been outlined as follows: first, the quality of the dwelling is a major indicator, as it can affect the ability to properly regulate one’s indoor comfort [12]. In addition, high energy costs can lead households to a loss of disposable income and debt, as a household’s ability to switch providers may be restricted by a poor credit history, locking them into more expensive suppliers [13]. Adding to this, the stability of a household influences the space for autonomy and flexibility in a household’s financial choices, and where there are fewer job opportunities, families have limited control over their income. Even fuel expenditures might become exorbitant due to some household members’ non-negotiable needs [14]. Furthermore, ill health and aging pose a persistent risk to financial stability and independence and frequently necessitate higher energy usage, which should also be linked to greater entitlement to care and support services, as well as to financial benefits [15]. Then, stepping out of the household’s environment, in times of need, those with little social connections have no one to turn to, while individuals with a support network of friends and family can may receive assistance with high costs. Furthermore, several issues hinder investment in tenancy arrangements: split incentives, tenant and landlord concerns over the temporary nature of tenancy circumstances, and the building’s condition (the worse the condition, the bigger the issue) [13]. Additional behavioral aspects that further contribute to the energy vulnerability phenomena pertain to household size and expenditure priorities [14], energy-use patterns in daily activities and habits [16], and a lack of awareness or proactivity regarding small energy-saving measures (e.g., switch to energy-saving appliances) [17].

1.3. Energy Vulnerability Within European Legislation and the Social Climate Fund Framework

Whereas people with energy vulnerability experience a risk condition in which systemic causes increase an individual’s or group’s susceptibility to possible energy poverty, people who do not have access to sufficient energy services are considered energy-poor [18]. The EU has defined legally energy poverty in the Energy Efficiency Directive (EED) (EU) 2023/1791 [19] “‘energy poverty’ means a household’s lack of access to essential energy services, where such services provide basic levels and decent standards of living and health, including adequate heating, hot water, cooling, lighting, and energy to power appliances, in the relevant national context, existing national social policy and other relevant national policies, caused by a combination of factors, including at least non-affordability, insufficient disposable income, high energy expenditure and poor energy efficiency of homes”.
The concept of energy vulnerability, as structural, long-term, and embedded in socio-political systems of inequalities in housing, employment, health, social capital, and financial stability, includes several aspects of energy poverty, but at the same time, it clashes with the policy-focused and economically driven definition of vulnerable households under ETS2, which states: “‘vulnerable households’ means households in energy poverty or households, including low-income and lower middle-income ones, that are significantly affected by the price impacts of the inclusion of greenhouse gas emissions from buildings within the scope of Directive 2003/87/EC and lack the means to renovate the building they occupy”.
Although energy poverty is adequately addressed and researched in European legislation, it is important to consider the increasingly used concept of transport poverty. Described in the literature as the forced lack of mobility services required for social engagement due to the inaccessibility, unaffordability, or unavailability of transportation [20,21], it is defined in the SCF as: “[…] individuals’ and households’ inability or difficulty to meet the costs of private or public transport, or their lack of or limited access to transport needed for their access to essential socioeconomic services and activities, taking into account the national and spatial context”.
Still, transport poverty is not uniformly and concretely defined, obstructing its detection and assessment, as it is described at the individual rather than the household level, while there are trade-offs between housing and transport costs to be considered, where individuals may choose higher housing costs to save on transport expenses [22]. The current EU commission approach in the SCF Regulation defines vulnerable transport users as “Individuals and households in transport poverty, but also individuals and households, including low-income and lower-middle-income ones, that are significantly affected by the price impacts of the inclusion of greenhouse gas emissions from road transport within the scope of Directive 2003/87/EC and lack the means to purchase zero- and low-emission vehicles or to switch to alternative sustainable modes of transport, including public transport”. This definition overlaps with the research showing that transport affordability is a key component of transport poverty, reflecting economic stress metrics (e.g., Car-Related Economic Stress and Forced Car Ownership) observed in transport poverty studies [22], while overlooking mobility and accessibility issues; however, it should be noted that these components are not the primary focus of the SCF.

1.4. Research Gap Detection

Though the SCF Regulation aims to diminish the financial burden of carbon pricing on vulnerable households, a significant gap remains concerning the effective identification and qualification of the households and individuals’ vulnerability to rising fossil fuel prices. Existing supra-governmental frameworks, including the SCF, mostly assume indicators of poverty and vulnerability based on income–expenditure thresholds and ignore the structural and behavioral dimensions that dictate energy and transport poverty.
This research seeks to fill that gap by inspecting a wider range of vulnerability indicators through a comprehensive assessment that offers an initial bridging between income-based classifications and behavioral aspects. Additionally, methodological improvements are laid out, aiming to improve the established social climate policies towards addressing diverse vulnerability experiences. This process includes refining data collection systems that capture information of both quantitative and qualitative nature, incorporating spatial and mobility data, and integrating composite indicators that consider both economic, behavioral, and infrastructural factors.

2. Materials and Methods

This study systematically assesses energy and transport poverty, utilizing existing indicators and integrating principles of energy and transport poverty to ascertain vulnerability under the SCF. An overview of indicators for energy and transport poverty is carried out based on data sources at the EU and national levels that highlight their strengths and weaknesses. Moving one step further, this study presents a set of new composite indicators that capture vulnerability dimensions that have been neglected so far, such as the inability to renovate a dwelling or switch to low-emission transport. Finally, these indicators are applied to the case of Greece by supplementing National Household Budget Survey (HBS) data (Household Budget Survey: https://www.statistics.gr/el/statistics/-/publication/SFA05/2022, accessed on 4 May 2025), the European Union Statistics on Income and Living Conditions (EU-SILC: https://ec.europa.eu/eurostat/web/microdata/european-union-statistics-on-income-and-living-conditions/, accessed on 4 May 2025), Labour Force Survey (LFS: https://ec.europa.eu/eurostat/web/microdata/european-union-labour-force-survey, accessed on 4 May 2025), and the European Quality of Life Survey (EQLS: https://www.eurofound.europa.eu/en/surveys/european-quality-life-surveys/european-quality-life-survey-2003, accessed on 4 May 2025), to estimate vulnerability and its alignment with the SCF framework criteria.

2.1. Baseline Indicators Assessment

The analysis began with a review of the European Commission’s latest guidance on energy poverty (SWD 2023/647) and relevant legal obligations under the EED recast. Core EU-recommended indicators—such as the inability to keep the home warm, arrears on utility bills, poor housing conditions, and risk of poverty—were examined for their relevance to Greece. Then, the national implementation was assessed using Greek and European data sources, covering household income and energy expenditure patterns up to 2023, and complemented by data from national building energy performance certificates. Recognizing Greece’s climate-specific vulnerabilities, particular attention was paid to the growing significance of cooling needs. Additionally, the national strategy to alleviate energy poverty was reviewed to understand local methods of identifying energy-poor households based on expenditure thresholds and adjusted income levels.
For transport poverty, the study relied on EU-level datasets (EU-SILC, HBS, LFS, and the EQLS) due to the absence of a national definition or dedicated indicators in Greece. The analysis highlighted significant data gaps, particularly in measuring accessibility and mobility needs, which ideally require spatial datasets capturing service locations, transport infrastructure, and journey times. The lack of regular, detailed national data—especially for rural areas—was identified as a key obstacle to mapping transport poverty or informing targeted policy interventions, including these Plans.

2.2. Methodology for Defining Energy-Vulnerable Households and Transport Users

2.2.1. Data Handling

Energy and transport poverty and vulnerability indicators were extracted from EU-SILC, HBS, and LFS datasets, following the definitions of the variables (see Table A1 and Table A2) (The curated database with the indicators can be retrieved from https://doi.org/10.6084/m9.figshare.28892639.v1, accessed on 4 May 2025). For each indicator, the percentage of households or individuals affected was calculated, using available data between 2017 and 2023. Multi-year averages were computed where possible to stabilize the trends. Indicators with incomplete or outdated data (e.g., see Figure 4, indicators TI.3, TI.5) were excluded from aggregated estimates. A thematic grouping of indicators was applied to better reflect diverse vulnerability dimensions. For population-wide extrapolation, household-level percentages were applied to the total number of households. For energy poverty, a composite estimate was calculated averaging RI.1, RI.2, RI.10, and RI.13, following the requirements of the EED Directive (2023); for transport poverty, TI.8, TI.9, TI.2, and TI.10 were averaged, excluding pre-2020 data for consistency. Given the incomplete and outdated data for accessibility-related transport indicators (TI.3 and TI.5), these were excluded from quantitative estimations of transport poverty but noted as critical gaps impacting the assessment of mobility vulnerabilities. Similarly, for consistency and relevance to current transport policy design, pre-2020 data were excluded from the quantitative aggregation of transport poverty indicators.

2.2.2. Vulnerability Thresholds and Extrapolation Process Clarification

To determine the thresholds for categorizing various types of households as vulnerable groups under the ETS2, we depart from the concept of a disposable income threshold as a standard practice for social policies, which apportion the amounts to be distributed as income support or as subsidies to households based on their income. The selection of the appropriate threshold for the disposable income, to determine the vulnerable groups, is calculated from the average income of vulnerable groups, as defined by each indicator for vulnerability (energy and transport) generated from the HBS. More specifically, the values for each indicator correspond to an average income level from the household sample of the HBS, which is then extrapolated to the whole population of Greece. The same applies to the additional vulnerability indicators (inability to renovate and inability to purchase a new and efficient zero-emissions vehicle) for determining vulnerability based on the SCF. An important note is that this assessment serves to estimate the total size of vulnerable groups based on their income level, within the scope of those significantly affected by the ETS2. The average income is calculated from the HBS sample for three groups: (a) all household members, (b) households with non-zero income based on their declarations, and (c) adults (see Figure 1). In the case of (b), we also include individuals receiving pension and other public benefits, as these are also considered income. It is evident that the average income of the economically active groups is higher in all cases and is a preferred option for setting a threshold for income to determine vulnerable households. The reasoning behind this is that, for the economically active population, we do not include the dependent (zero-income) family members (e.g., children), and this allows for a better representation of households with multiple members (from the HBS dataset and the structure of the households in Greece).
Based on the discussions with the Greek Ministry of Environment and Energy and the national stakeholders, it was decided that the personal income of the individuals with non-zero disposable income, including pensioners, would serve as the basis for calculation, as it is more representative in comparison to the resulting income thresholds from the other alternatives. To better serve the purpose of the SCF, the income thresholds for energy and transport poverty are calculated separately from those for household and transport vulnerability (Table 1). The aim is to target the most vulnerable to the effects of ETS2. Including higher-income groups translates as reduced support for those in need.
The main issue with this transport vulnerability indicator (inability to purchase a zero-emissions vehicle) as a determining factor for guiding decisions is that it might not be considered relevant for the low-income groups in Greece, given the lower income levels and purchase parity in comparison to other EU Member States. Nevertheless, there are many vulnerable households in Greece that depend on car ownership for various personal and job-related reasons. The HBS 2023 dataset (Table 2) was used to define household composition by income bracket. This provided the base for calculating the average income per person and applying income thresholds across household types for both energy and transport vulnerability estimation. When the income is below the threshold, the households belonging to this composition and income category are considered vulnerable. Following the same process, a similar analysis was carried out using the income threshold for transport users.

2.2.3. Thematic Grouping of Indicators

To better capture the multi-dimensional nature of vulnerability, the indicators were conceptually regrouped into four thematic clusters: (i) affordability and direct cost burdens, (ii) structural or hidden vulnerability, (iii) market-driven exposure, and (iv) chronic or efficiency-related risks. This framework was consistently applied to both energy and transport poverty indicators, enabling a more granular analysis of vulnerability pathways relevant to ETS2 impacts.

2.2.4. Alignment with SCF Definitions and Vulnerability Operationalization

To align with the SCF, this assessment defines vulnerable groups as both energy-poor households and those impacted by ETS2 costs. For energy poverty, the largest aggregate is adopted—households in need of renovation—ensuring all vulnerable households are captured, including those who are already energy-poor. Complementing this, the “Inability to Renovate” indicator identifies households lacking the means to invest in necessary renovations, calculated as the inability to cover ten annual installments of EUR 1500 from remaining disposable income (calculated based on the maximum cost of the renovation interventions financed under the national subsidy program—https://exoikonomo2025.gov.gr/, accessed on 4 May 2025). Similarly, following the SCF definitions, all transport-poor households are considered vulnerable transport users. The largest set—total transport-poor households—is used to avoid excluding groups affected by accessibility or affordability barriers. This approach ensures consistency with SCF objectives and a comprehensive vulnerability assessment. Lastly, in Greece, poverty is primarily defined in alignment with European Union standards, utilizing the concept of relative poverty. The at-risk-of-poverty threshold is set at 60% of the national median equivalized disposable income after social transfers. This approach is consistent with the methodology employed by Eurostat and is used to assess the proportion of the population at risk of poverty or social exclusion [23].

2.3. Contextualization of the Research: Selection of Greece for Examining Energy Vulnerability

Greece’s selection as a case study for energy and transport vulnerability is underpinned by its comprehensive and annually updated HBS, which serves as a critical tool for monitoring socio-economic conditions in a systematic and timely manner. As reliable and frequent data collection is essential for understanding the evolving nature of energy poverty and transport vulnerability, particularly in the context of climate and energy transitions [16], the annually updated HBS datasets in Greece enable researchers and policymakers to assess fluctuations in household income, energy expenditures, and affordability constraints with greater precision [17].
The importance of high-frequency, nationally representative data cannot be overstated when addressing energy justice concerns. As highlighted by Boemi and Papadopoulos [24], the ability to measure vulnerability using multiple dimensions—such as income levels, energy expenditure burden, and regional disparities—enhances the accuracy of policy interventions [18,19]. In Greece, the HBS facilitates the application of composite indicators that capture hidden energy poverty (M/2) and high energy cost burdens (2M threshold), providing a multifaceted approach to vulnerability assessment.
Furthermore, the structure of Greece’s energy and transport landscape, particularly its climatic variations, regional inequalities, and dependence on fossil fuels, makes it an ideal case for studying the intersection of socio-economic and infrastructural vulnerability. According to Bouzarovski, non-interconnected islands and remote areas often experience heightened energy poverty due to limited access to affordable energy sources, leading to greater disparities in energy security [20]. The HBS dataset accounts for these regional differences, allowing for a more granular analysis of socio-spatial inequalities in energy access and affordability.
In addition to its empirical robustness, the HBS aligns with European policy priorities, including the EED and the SCF, both of which emphasize the necessity of systematic and high-resolution data for targeting energy-poor households and transport-vulnerable populations [17]. The capacity of Greece’s HBS to continuously update and refine energy poverty indicators ensures that policy decisions are based on the most current socio-economic realities, rather than outdated or extrapolated estimates.
Energy vulnerability in Greece is legally defined under Article 52 of Law 4001/2011, as amended, which delineates categories of vulnerable consumers based on socio-economic, health-related, and geographic criteria [25]. In a nutshell, the law recognizes as vulnerable those household members facing energy poverty, including financially disadvantaged individuals, elderly persons (70+), those with serious health issues or disabilities, and residents of remote areas (especially non-interconnected islands) that are highly dependent on a constant and reliable energy supply. These individuals may struggle to manage energy needs and contracts due to their condition or geographical situation, and are therefore entitled to special services, including pricing, quality, supply security, and transparency, compared to other customers.

3. Results

3.1. Indicators Assessment

In the following sections, available data and indicators at the national level are explored regarding energy and transport poverty, in accordance with the Plans’ definition and requirements. Building on EU guidance and national sources, the analysis proposes key dimensions of vulnerability—affordability, structural conditions, and exposure to market-driven risks—while also highlighting Greece’s specific context and its relevant data limitations.

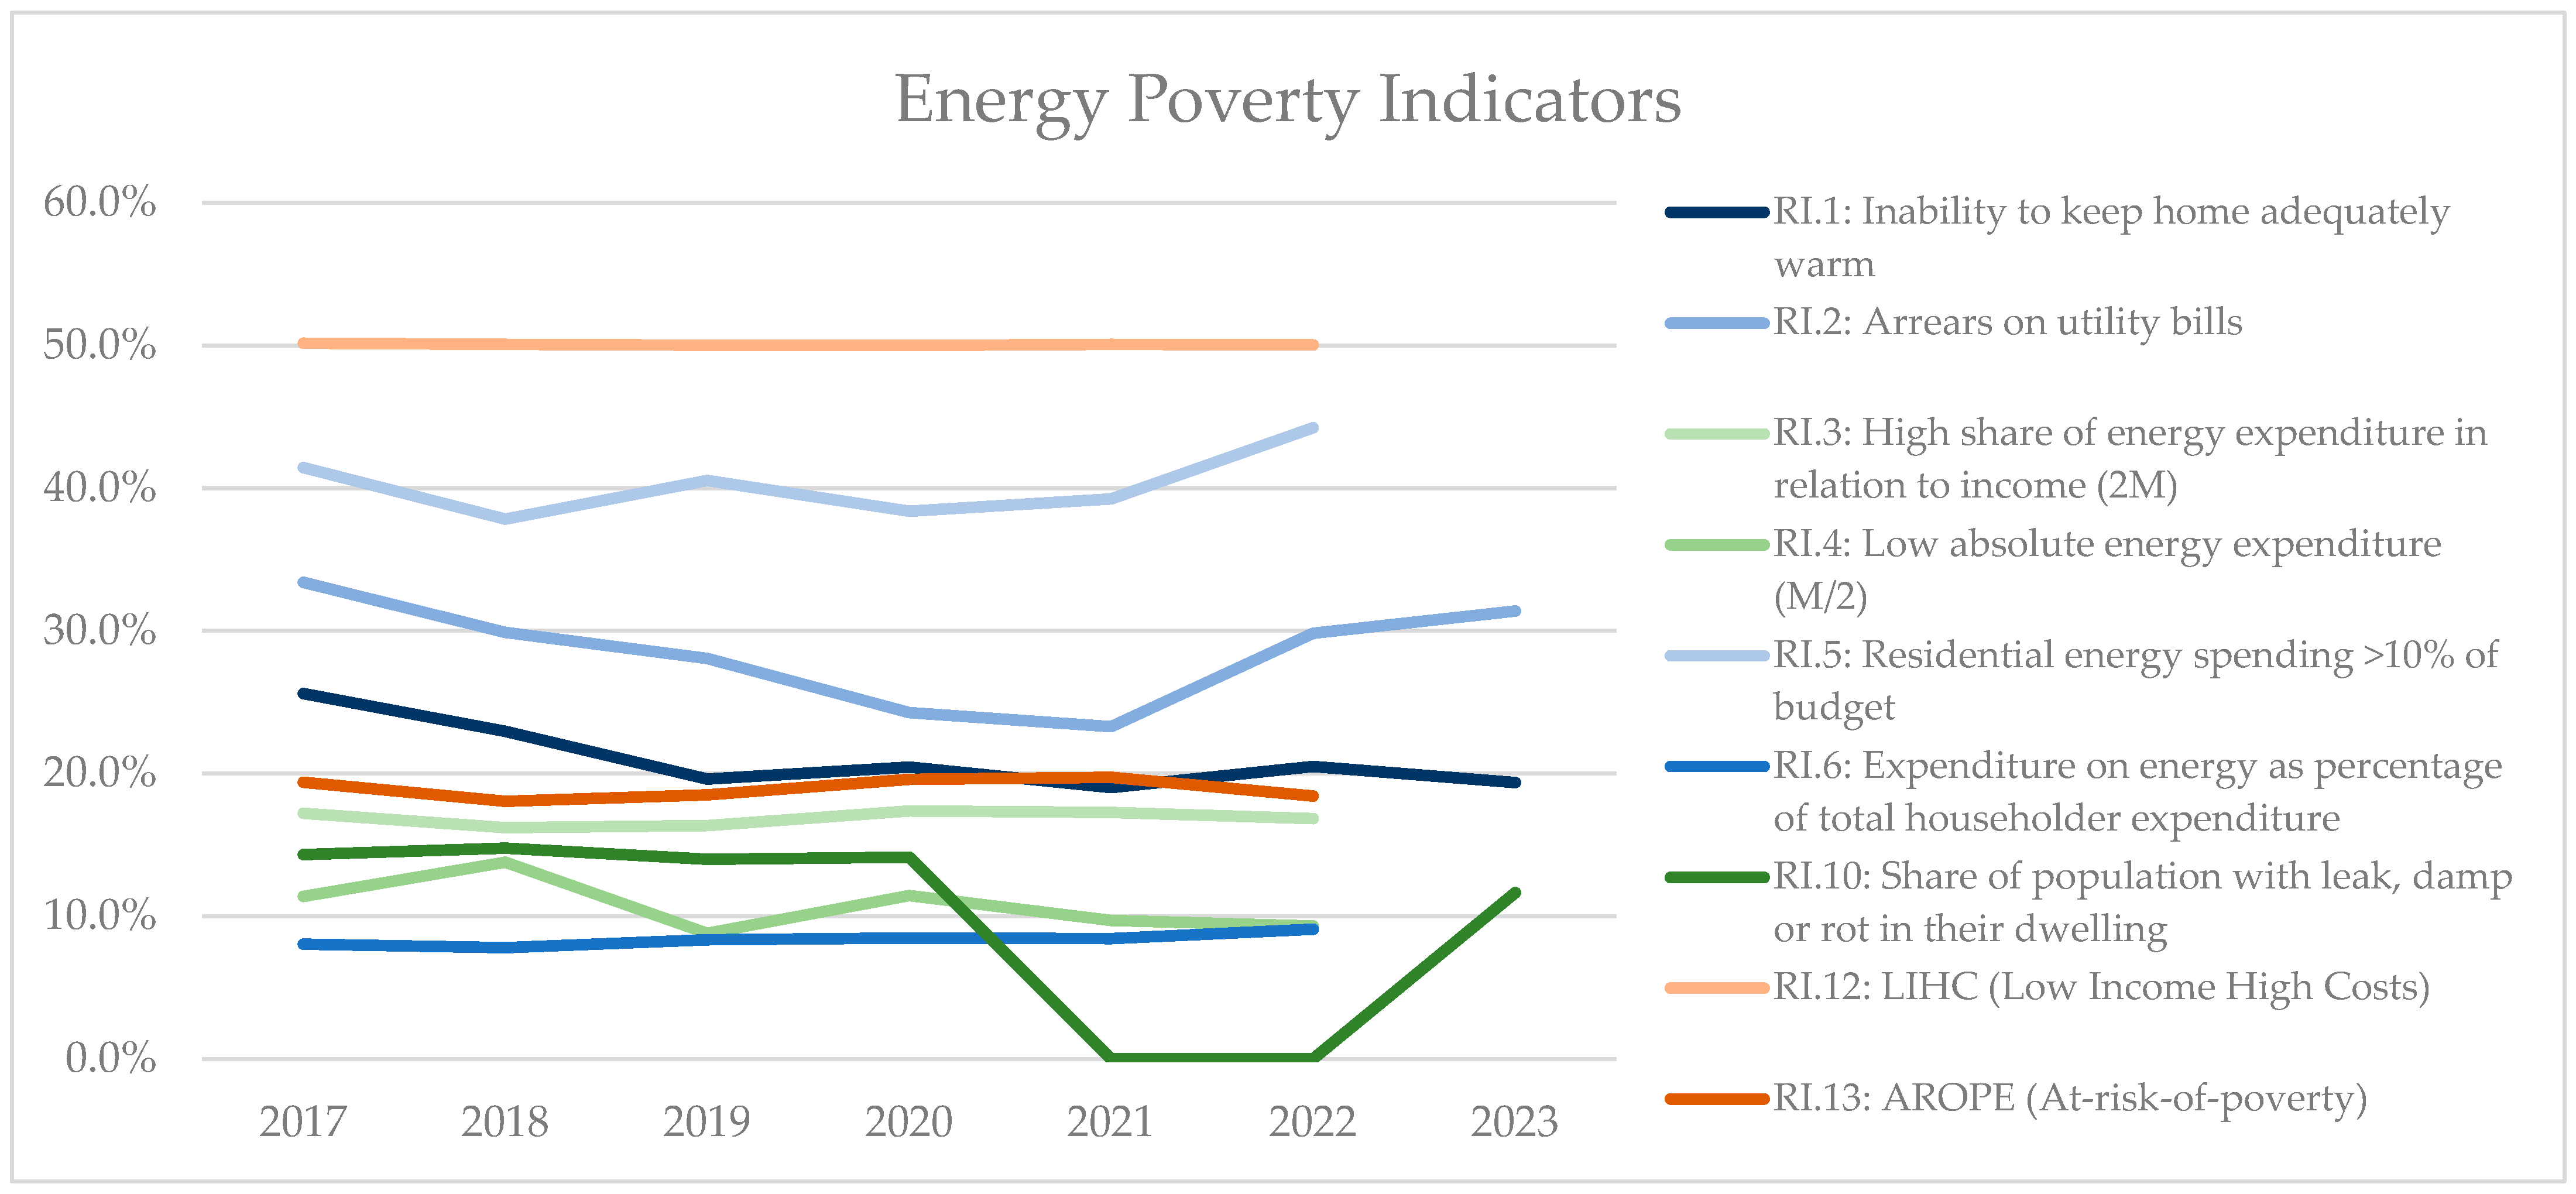
3.1.1. Assessment of Energy Poverty Indicators

This research started by reviewing the suggested EU-level energy poverty indicators (see Appendix A, Table A1 and Table A2), prompting MSs to take these into consideration, while encouraging them not to be limited by this selection and explore alternative approaches suitable for national contexts [26]. Notably, among the indicators listed (see Table A1), (i) the “Inability to keep a home adequately warm” is a subjective indicator based on self-assessment: here, “adequacy” is generally referred to and depends on an individual’s preferences and perceptions, which can vary among people across MSs and within the same MS, depending on differences in temperature and habits [27]. Then, (ii) the indicator Arrears on Utility bills does not refer solely to the energy bills or depict the different types of energy needs, as is the case of underconsumption by households that may not have arrears due to their behavior of limiting energy consumption, but rather describes the affordability component of energy poverty. Lastly, (iii) the indicator Residential energy spending > 10% of the budget is particularly effective at identifying vulnerable individuals who spend a relatively high share of their income on energy [28]. In 2023, 10.6% of the EU population reported being unable to keep their homes adequately warm—a 3.7%-point increase from 2021 [29]. In 2023, Greece had one of the highest shares in the EU, with 19.5% of its population struggling to maintain adequate warmth, placing it alongside countries like Lithuania (20%), Bulgaria (20.7%), Portugal, and Spain (both at 20.8%). Such values, along with the increased reliance on cooling systems during summer and heating during winter, poses additional challenges to the EU’s climate and energy targets, as it leads to heightened energy demand throughout the year.
In Greece, the National Action Plan to combat energy poverty identifies households affected by energy poverty using specific quantitative indicators and establishes a specialized process for monitoring and evaluating progress in mitigating the phenomenon by 2030 [30]. In addition, the annual HBS and national statistics provide data on expenditures and consumption for households across eight income categories based on monthly disposable income. For instance, for Greece, the indicator “Share of population with leak, damp or rot in their dwelling” can be complemented with the information on the age of the buildings provided from the national dataset on EPCs or other building stock data [31]. Additionally, another major issue to be considered for Greece and other MSs is the inability to keep home adequately cool in the warm months. While ‘cooling’ poverty is now mentioned in the EU definition of energy poverty, European-wide data are only available for the year 2012, and a more recent update is expected, with 19% of the EU population reporting ‘not being able to keep their home adequately cool during summer’ [32]. Given the topic’s complexity and contextual nature, there is mixed evidence based on different countries and methodologies regarding the year-by-year trends in heat risk. In addition, ownership of air conditioning systems remains relatively low across Europe but has been rising, as hotter summers become more common, and in Greece, air conditioning ownership is higher than in many other European countries due to the warm climate, as phenomena such as heatwaves become more frequent and severe, leading to an increasing demand for cooling solutions [33].
In the national strategy to alleviate energy poverty, Greece has developed two composite indicators: Index I-II and Index Ι and ΙΙeq. They calculate the number of households that simultaneously meet both of the following conditions:
  • The annual cost of the total energy consumption of each household should be lower than 80% of its annual cost to cover the minimum required energy consumption;
  • The net income of each household on an annual basis should be lower than 60% of the median of the corresponding income for all households, according to the definition of relative poverty.
Overall, combining EU-recommended indicators with national data and context-tailored indices allows Greece to better capture the country’s specific vulnerabilities, including cooling and heating needs, affordability, and availability, while supporting more effective monitoring, policymaking, and ultimately supports alignment with European directives and climate targets, contributing to a more resilient society.

3.1.2. Assessment of Transport Poverty Indicators

Building on the energy poverty framework, the assessment of transport poverty faces even more challenges because of limited conceptualization and data availability. While no national definition of transport energy poverty currently exists in Greece, several transport poverty indicators can be applied using the conceptual framework and available HBS and EU SILC data (see Table A2) [34,35]. However, at the national level, there was no additional data that allowed reflecting on transport concepts in a granular way, for example by estimating additional indicators or adjusting the indicators identified in EU-level studies [36]. This applies in particular to accessibility, for which indicators are ideally estimated using spatial data with information on the location of essential services, the transport network (both public and private), timetables (ideally dynamic), and journey times. A systemic challenge to the effective application of the definition of transport poverty at the national level is the lack of relevant, recent, and reliable data on the existing transport services and mobility of the population, especially in non-urban areas [21,37]. Data from EU-SILC, used to identify the baseline in the absence of other relevant data at NUTS 2 and NUTS 3 levels, are not entirely suitable to assess and monitor the impact of potential measures to be included in the Plans, due to the low frequency and quality of the data collection (subjective and not properly specified survey questions/answers). The indicators identified (see Table A2) serve as the foundation for assessing the scale and nature of energy and transport poverty in Greece. Therefore, in the following section, these indicators are applied to national data, providing an overview of the population groups most exposed to affordability pressures, structural barriers, and market-driven risks.

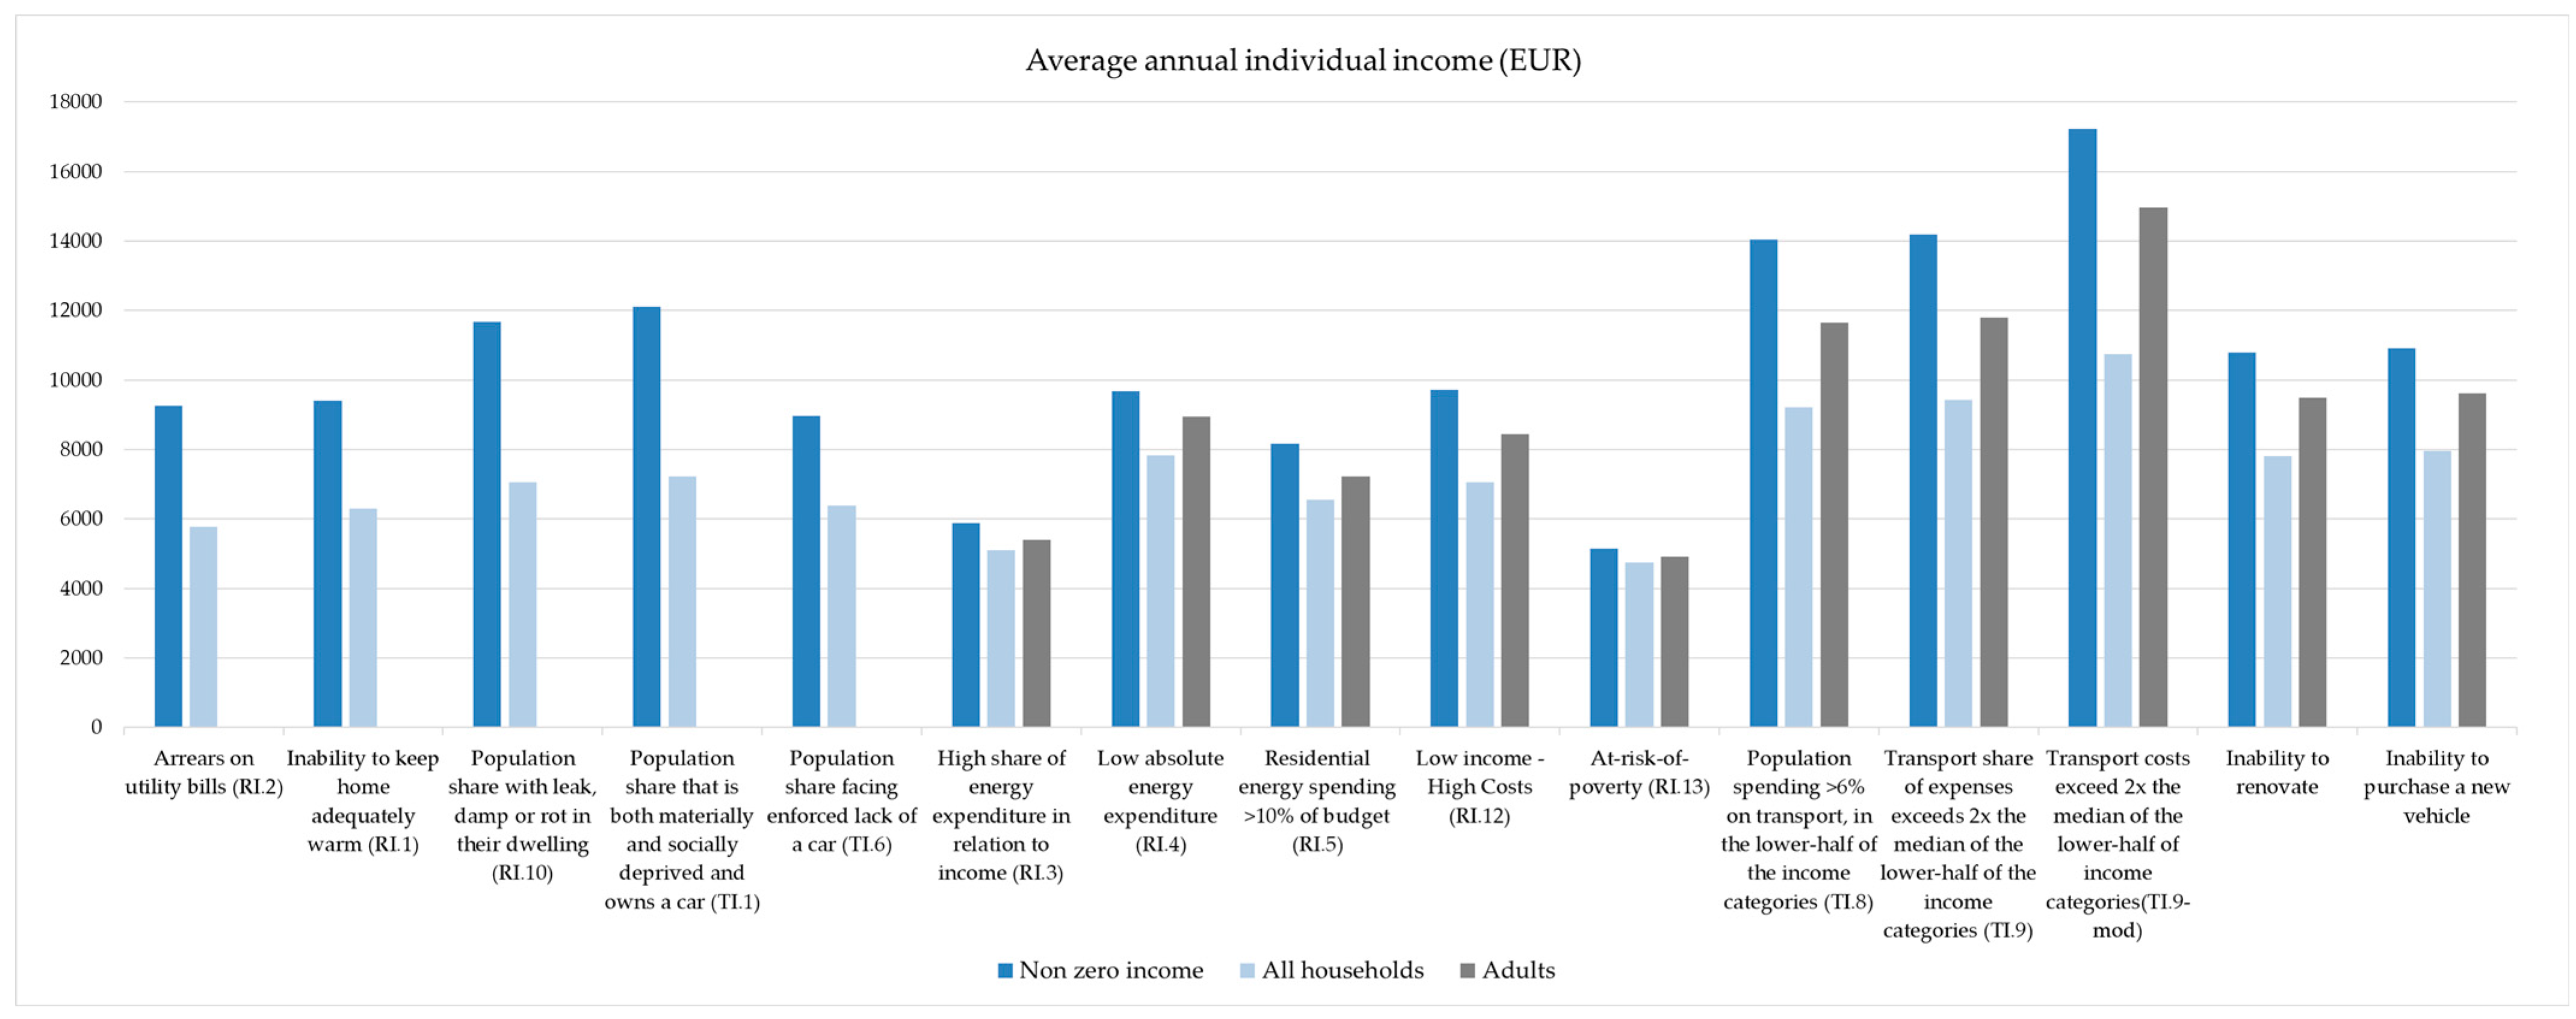
3.2. Outcomes of Household Energy and Transport Poverty and Vulnerability Indicators

Building on the indicator framework, this section presents the outcomes of applying the selected energy and transport poverty indicators to national data, offering different perspectives on the prevalence of vulnerability across Greek households. The results are organized thematically to better capture the multiple dimensions of vulnerability relevant to assessing the potential impacts of ETS2 and informing targeted support measures.

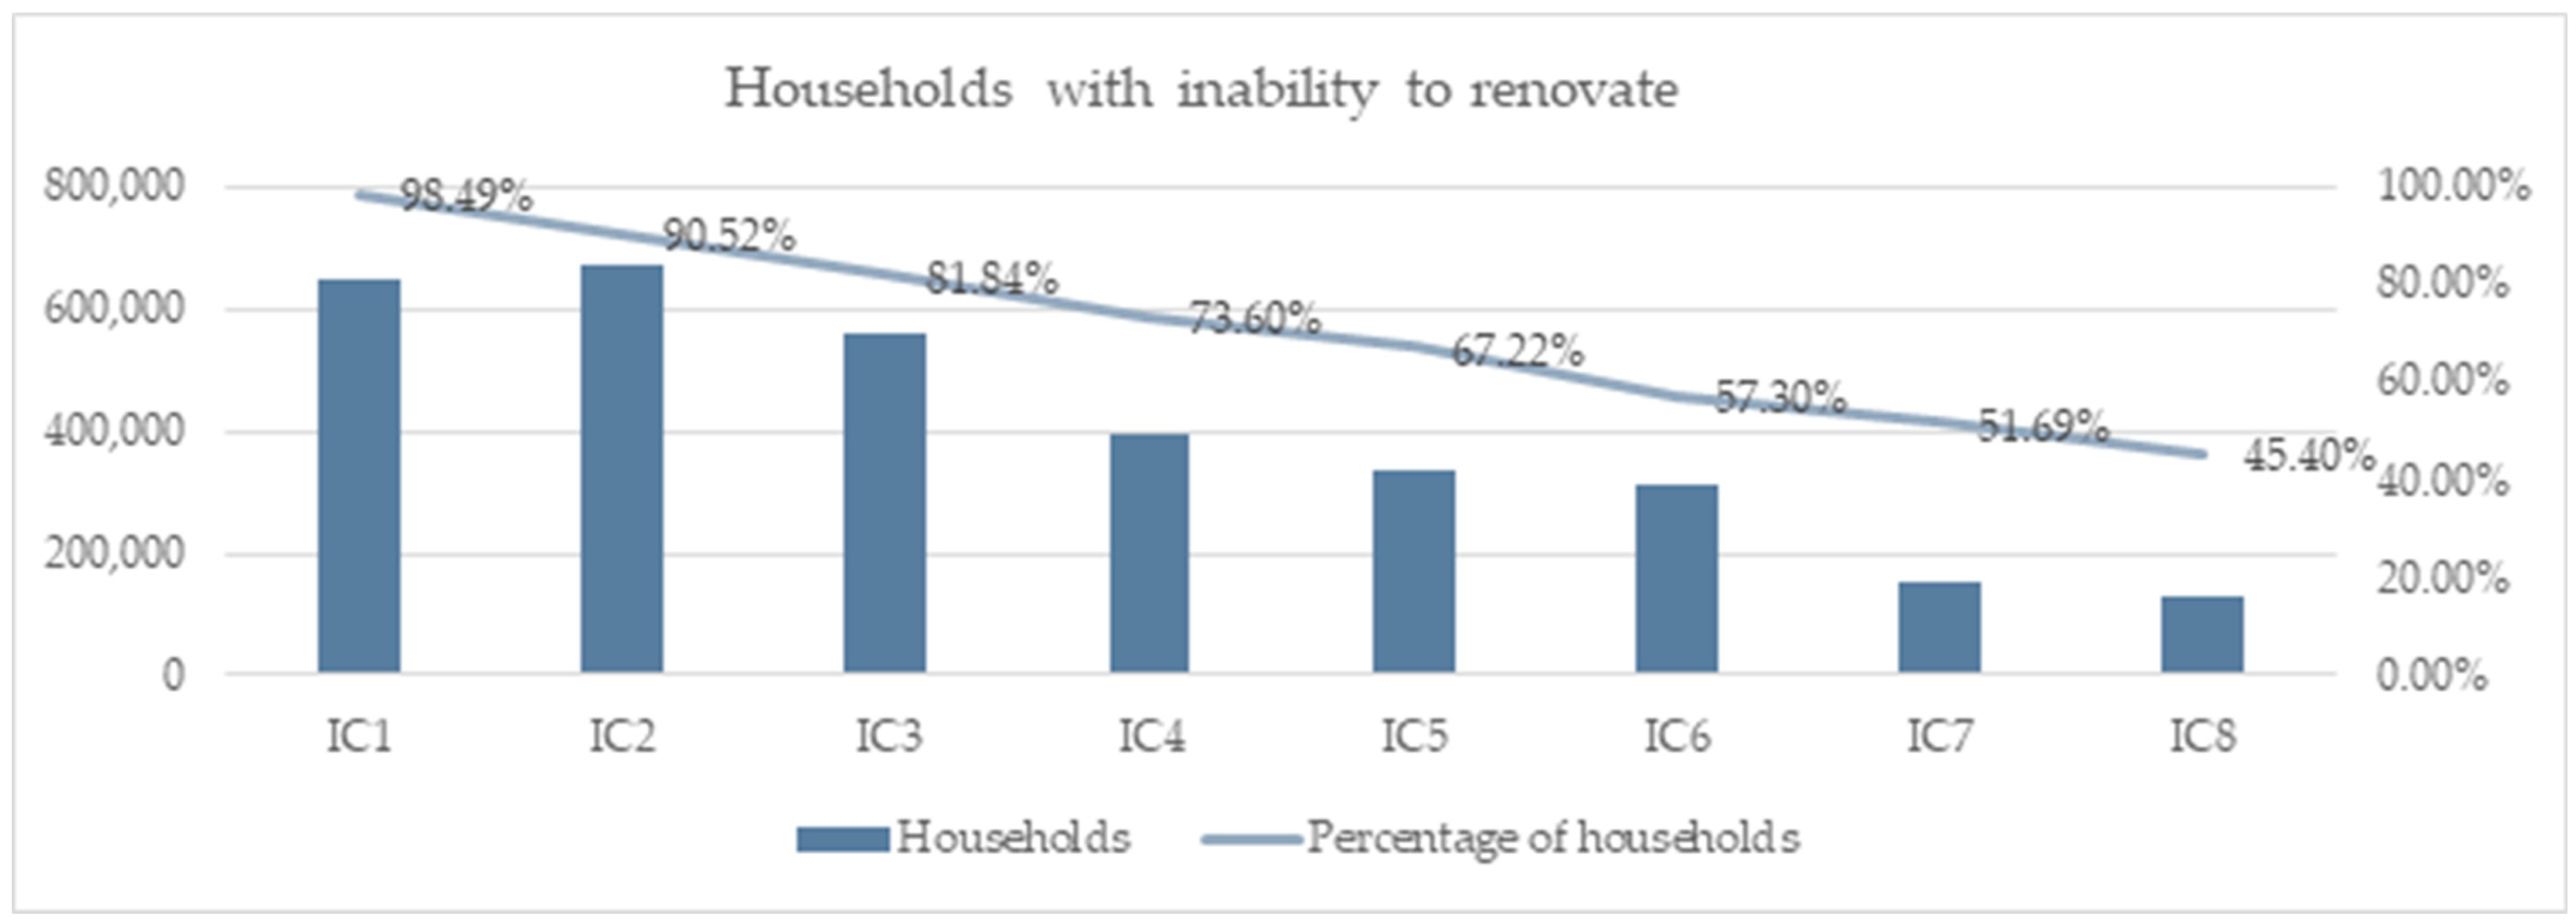
3.2.1. Outcomes of Household Energy Poverty and Vulnerability Indicators

In the following section, the outcomes of Greece’s household energy poverty indicators are presented over the period 2017–2023 (Figure 2), presenting various dimensions of vulnerability, including affordability pressures, structural conditions, and exposure to energy price fluctuations. To show how energy poverty in Greece is not driven by income alone, but it is also shaped by housing conditions, market volatility, and chronic structural inefficiencies, the indicators have been reorganized into four thematic groups to better reflect the different dimensions of household energy poverty and vulnerability: (i) affordability and economic burden—RI.1, RI.2, RI.5, RI.6—shown in blue shades in Figure 2; (ii) structural and hidden energy poverty—RI.3, RI.4, RI.10—shown in green shades; (iii) market-driven vulnerability—RI.7, RI.8, RI.9; (iv) efficiency and chronic vulnerability—RI.11, RI.12, RI.13—shownin red shades.
This first group of indicators reflects the immediate financial strain of energy costs. First, around 21%, of Greek households (the average from 2017 to 2023) could not secure thermal comfort (RI.1), while arrears in utility bills rose to 31.4% (RI.2) because of price spikes following the recent energy crisis [38]. It is important to note that RI.1 and RI.2 reflect distinct aspects of vulnerability: while RI.1 (19.4%) captures a household’s subjective experience of thermal discomfort, RI.2 (31.4%) refers to reported arrears on utility bills, which may encompass various types of services and signal broader financial stress. Many households may prioritize energy payments while cutting back on other needs or accumulating debt elsewhere, resulting in high arrears without necessarily experiencing inadequate comfort; therefore, the two indicators should not be expected to align directly. Moreover, 44.2% of households in 2022 spent more than 10% of their budget on residential energy needs (RI.5). Likewise, the average energy expenditure increased from 8% in 2017 to 9% in 2022, revealing a modest, yet rising financial burden (RI.6). While these indicators reveal immediate financial stress, a deeper layer of vulnerability emerges when looking at structural conditions and persistent hidden energy poverty.
The second group focuses on structural vulnerabilities and hidden forms of energy poverty through income and housing conditions. In 2022, 16.8% of households spent over twice the median share of income on energy/transport (RI.3), and 9.3% faced energy costs that were twice the national average (RI.4). Moreover, 11.6% lived in substandard housing conditions (e.g., damp, leaks) in 2023, marking a decrease from 14.3% in 2017 (RI.10). These rates suggest that certain households are constantly burdened economically from disproportionate expenses on energy needs. These dropping rates can imply increasing renovation/refurbishment activities in the housing sector.
As such, this other set of indicators confirms the impact of rising energy prices and market volatility on household vulnerability. Electricity prices rose from EUR 0.167/kWh in 2017 to EUR 0.232/kWh in 2023 (RI.7), while gas prices more than doubled to EUR 0.122/kWh (RI.9). The sharp price hikes in 2022–2023 point to external market shocks intensifying household energy burdens, particularly for gas-dependent users (RI.8–RI.9). Beyond structural constraints, external factors, such as market-driven energy price fluctuations, further intensify household vulnerability, as illustrated by the following indicators. However, even without price spikes, underlying chronic vulnerabilities, such as efficiency levels and persistent poverty, risk further entrenching of households in long-term energy poverty.
The final group of indicators examines the long-term structural challenges, focusing on households trapped in persistent poverty or limited by stagnant energy efficiency gains that restrict their ability to reduce energy costs. First, energy efficiency levels (RI.11) remained stagnant, indicating households’ limited capacity to cut costs. In addition, over 50% of households (RI.12) were consistently at risk of poverty when accounting for energy/transport burdens, while 19% (RI.13) hovered just above the poverty line. These numbers imply that an important group of households are vulnerable to energy market volatility.
Averaging the EED energy poverty values indicators for Greece shows that around 20.2% of the population falls under the definition of energy poverty. In absolute terms, this means that 859,843 households are considered energy-poor. Based on the Greek NECP, according to the national indicators, the percentage of households under extreme energy poverty in 2021 was 12.4% (showing an increase of 12% as of 2020), amounting to 513,000 households.
Based on the vulnerability indicator for households unable to renovate their buildings, Figure 3 illustrates that in the first four income categories (those with a monthly household income below EUR 1800), almost 2.28 million households are unable to renovate their dwellings, reaching 86% of the total households in these income categories. For the other income categories, the percentages are almost half of the households that cannot afford to renovate, even though they fall outside the scope of the SCF.

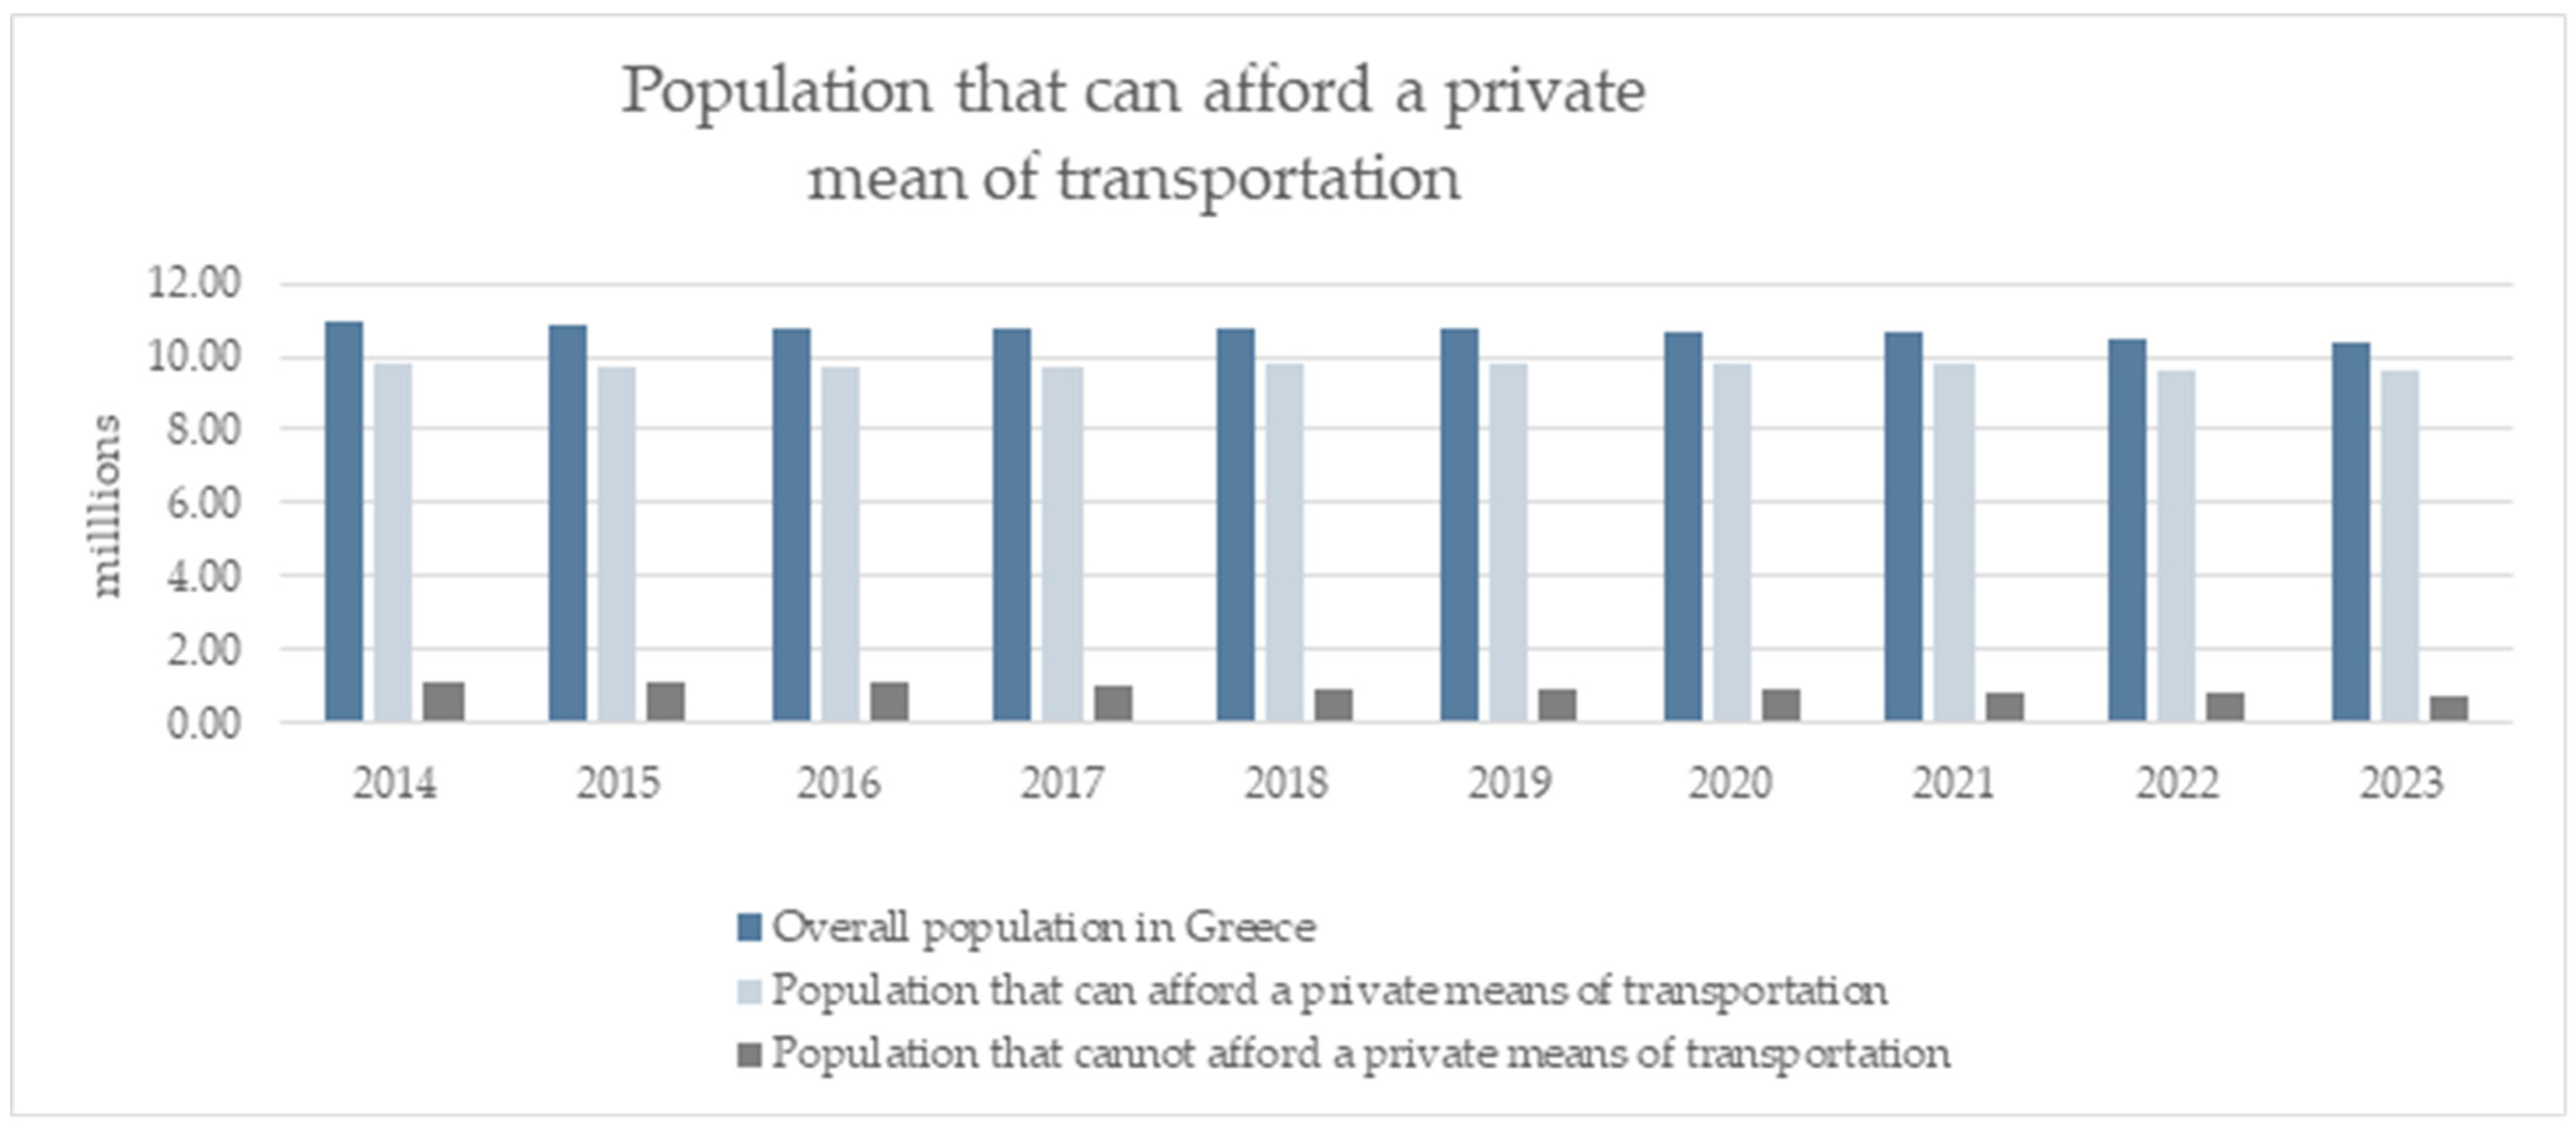
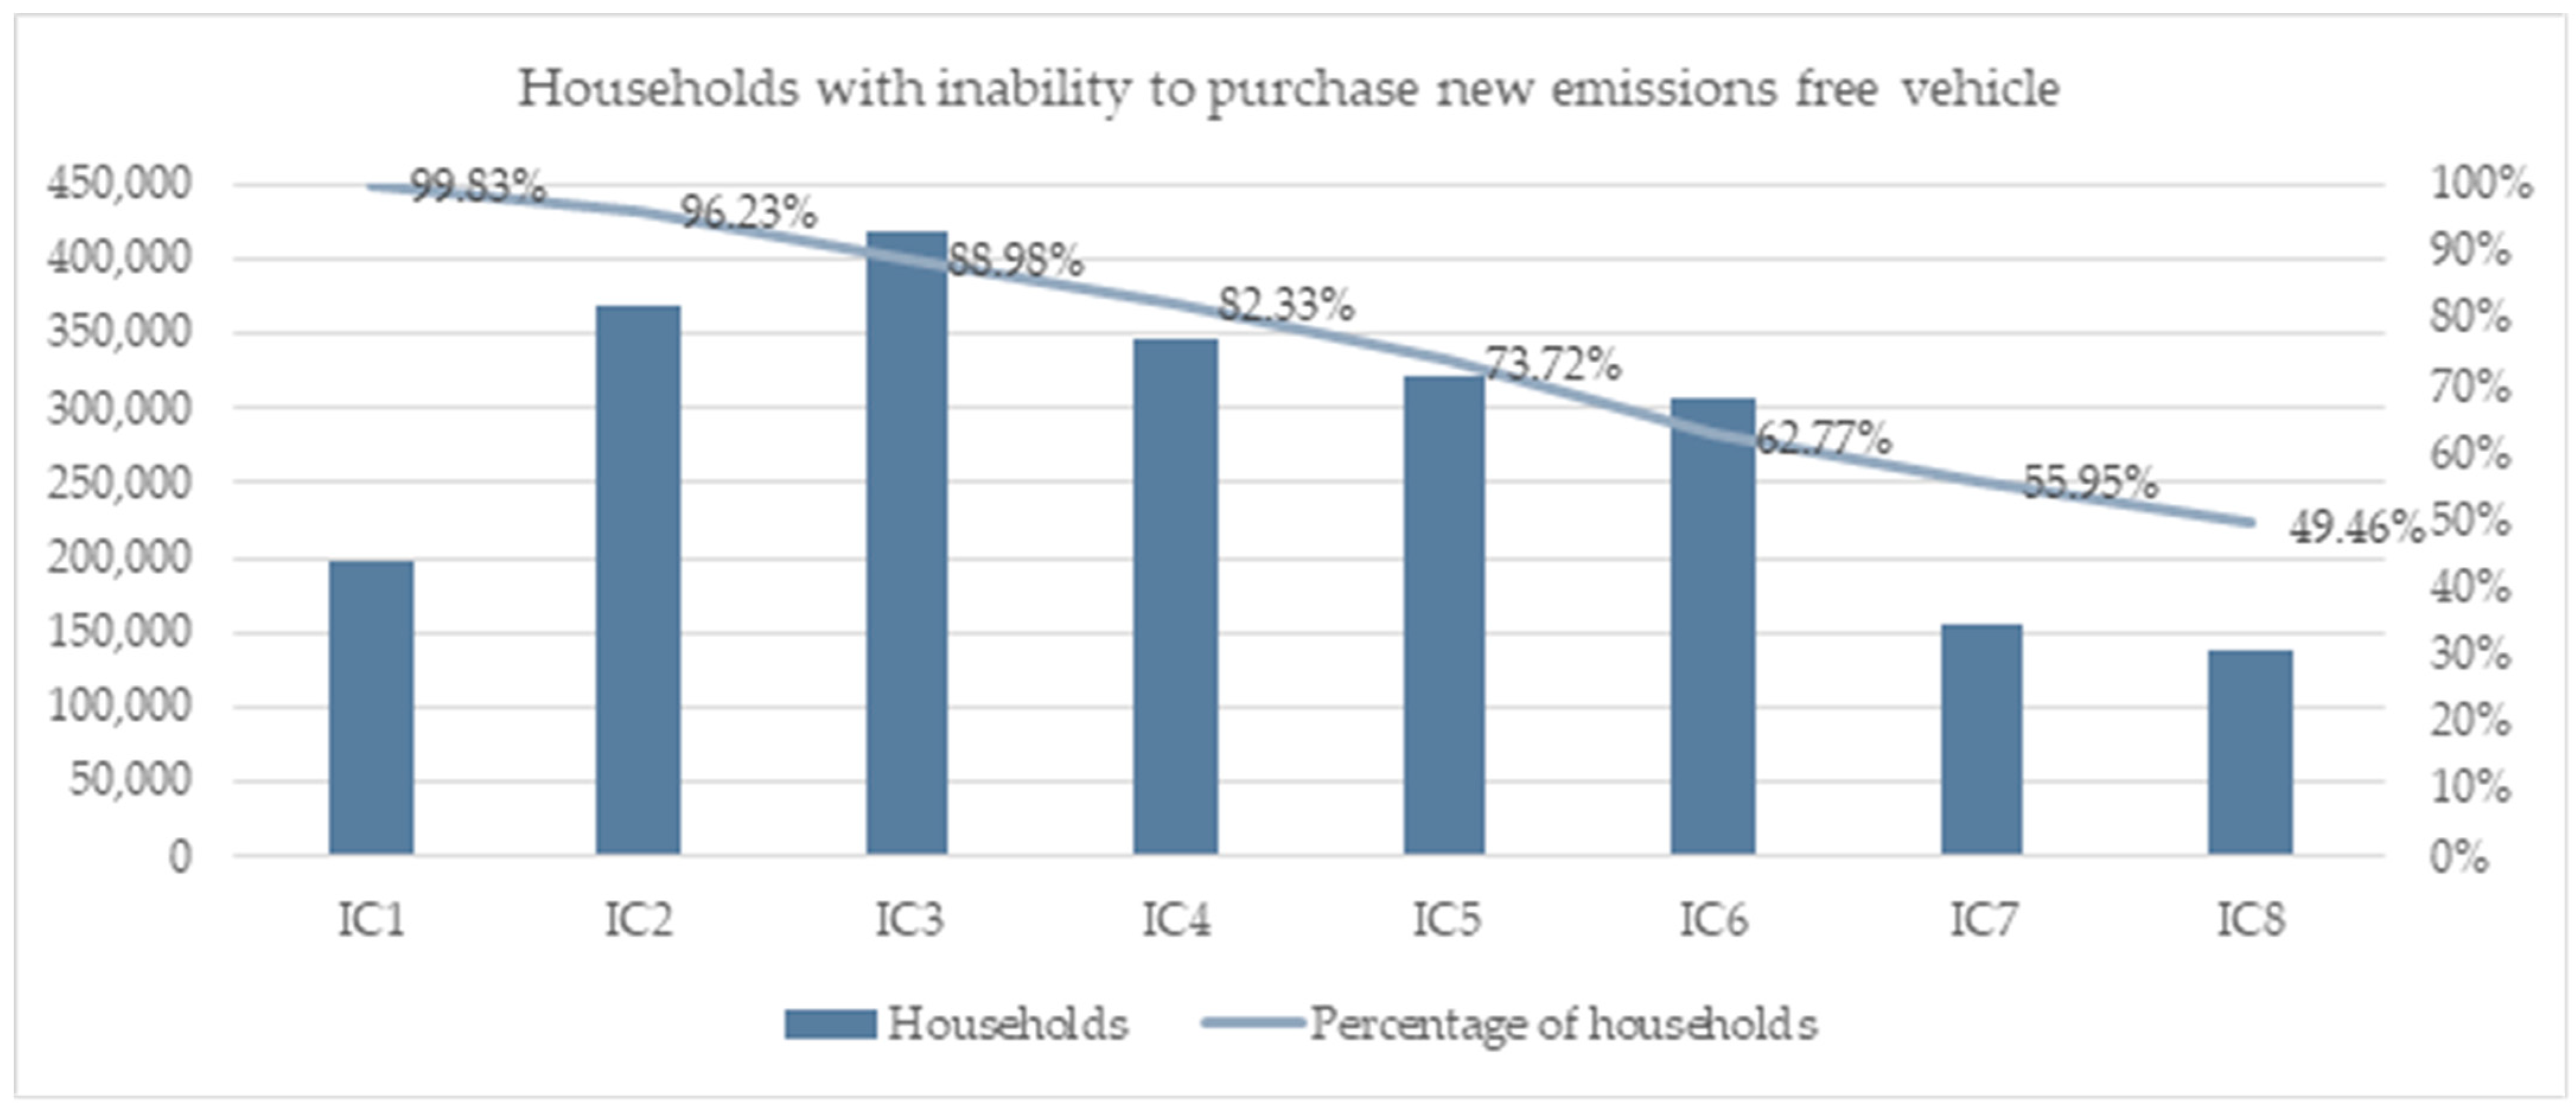
3.2.2. Outcomes of Transport and Poverty Vulnerability Indicators

The analysis of transport poverty in Greece (Table 3) draws on data from EU-SILC, LFS, and the HBS, covering up to 2023. The indicators capture the multiple facets of transport vulnerability, including affordability, accessibility, and structural market-driven challenges [28,39,40]. However, data gaps persist, particularly for mobility barriers and accessibility. To demonstrate that transport poverty in Greece is influenced by more than just income constraints—and is also shaped by accessibility barriers, structural dependence on private vehicles, and exposure to fuel price volatility—the indicators have been reorganized into four thematic groups to explore the diverse dimensions of transport vulnerability (Figure 4): (i) affordability and transport cost burden—TI.8, TI.9—shown in blue shades in Figure 4; (ii) accessibility and physical access vulnerability—TI.2, TI.3, TI.4, TI.5, TI.10—shown in red shades; (iii) structural and market-driven transport vulnerability—TI.1, TI.6, TI.7—shown in green shades; and (iv) chronic transport vulnerability and transition barriers—illustrated through the inability to afford a private vehicle (Figure 5) and to purchase a new zero-emission vehicle (Figure 6).
By capturing both direct affordability challenges and increasing transport-related expenses, the first group of indicators shows the financial strain of transport-related expenses on Greek households, where both in 2017 and in 2022, over 36% of the population spent more than 6% of their total expenditures on transport (TI.8), while during the pandemic years (2020–2021), these figures dropped. Meanwhile, around 25% of lower-income households spent more than twice the national median share on transport (TI.9). This rate proves again the high exposure of this household category to rising fuel. Thus, while affordability presents clear constraints for households, access to transport systems—both physical and economic—creates another layer of vulnerability, especially for specific population groups.
Then, accessibility-related indicators point to physical and mobility barriers: although only a small share of the population reported poor access to public transport (TI.2, TI.4) in 2013–2014, there is a significant data gap in recent years, limiting the ability to draw conclusions. Indicators on “very difficult access” (TI.3) and “commutes over 30 min” (TI.5) are also missing, further complicating assessment. However, the high share of households not using public transport at all (TI.10) implies ongoing accessibility issues that contribute to vulnerability—particularly among people with limited mobility or those living in poorly connected areas. Nevertheless, beyond accessibility, structural factors such as car dependency and exposure to fuel price volatility make transport vulnerability in Greece even more concerning.
Lastly, the third group informs us about structural dependency on cars and market exposure. In 2023, 43.7% of materially and socially deprived individuals owned a car (TI.1), suggesting financial pressure to maintain private vehicles despite deprivation. The proportion of people who could not afford a car (TI.6) dropped to 7.7%, possibly indicating a shift back to private transport due to public transport shortcomings. Meanwhile, only about 3% reported that public transport was too expensive (TI.7), reinforcing its general affordability—but possibly also its underuse in certain areas. Thus, to get an estimate of transport poverty in Greece, averaging the indicators of both affordability and accessibility—excluding the ones with data before 2020, a percentage of 33.3% of households (1,416,964 in total) are considered transport-poor. Beyond these market-driven and structural vulnerabilities, actual and chronic risks remain for households that cannot transition to cleaner mobility solutions.
For this reason, the final consideration captures the chronic risks of transport vulnerability and highlights the households’ constrained ability to adapt. In fact, not only are around 1 million Greek citizens constantly unable to afford a private vehicle (Figure 5), but this also prove that a significant number of people rely heavily on affordable and reliable public means of transportation. But also, the research showed that if households had to purchase a new emissions-free vehicle, only 10% of the population would be able to do so, leaving roughly 1.33 million households that would instead be unable to purchase a new one (Figure 6).

3.3. Estimating Vulnerable Groups Under ETS2

Learning from the indicator outcomes, this section quantifies the population groups in Greece that are specifically classified as energy-vulnerable or transport-vulnerable under the SCF Regulation’s definition of vulnerability to ETS2. By applying the income thresholds and vulnerability criteria defined earlier in the methodology, this study estimated the number of households likely to be most impacted by ETS2, allowing the identification of those groups that should be prioritized for support under SCF. In Table 3, the total number of households corresponding to each part of the vulnerability definitions, along with their share of the overall number of Greek households, is calculated. Narrowing down the vulnerable households to the ones affected by the ETS2, as target groups of the SCF, these calculations included only the subset of households that use fossil fuels for heating, cooling, or transport.
Next, to refine the analysis, the number of vulnerable households exposed to ETS2 is distributed across the four income categories eligible under the SCF. As presented in Table 4, the majority of these households fall below the income threshold for transport vulnerability, while the data on household vulnerability also signals struggles to cope with the measure, reinforcing the relevance of income-based targeting in mitigation efforts.
It is important to stress that the specific poverty threshold can vary annually based on income distribution data. For reference, according to the 2024 Poverty Watch Report by the European Anti-Poverty Network (EAPN) Greece, the poverty threshold was set at EUR 6030 annually for a single-person household and EUR 12,663 for households with two adults and two dependent children. As it stands, this quantitative profiling of vulnerable groups provides the baseline for targeting support under ETS2. Through these findings, experts can inform policy discussion, design, and implementation.

4. Discussion

The unsolidified terminology and approach on energy vulnerability for households and transport users on behalf of the EU Commission, and subsequently on behalf of the Member States, does not allow for creating a sound methodological path for detecting such phenomena. Instead, a variety of indicators must be employed for their justification.
The use of different indicators leads to diverging estimates of vulnerable or energy-poor households, as each indicator measures a specific aspect of vulnerability, differing in terms of how they capture financial issues, energy consumption and need, comfort levels, etc. The same applies to transport. As a result, the choice of indicators directly affects the vulnerability assessment and the detection of the relevant households.

4.1. Discussion on the Results Derived from the Greek Case Study

Addressing the primary goal of this study, the research results made it evident that a multilevel approach, which takes into account both income-based and circumstantial aspects, can allow a more accurate targeting of energy and transport-vulnerable groups.
In particular, indicators on affordability and economic burden emphasized the increasing financial strain on Greek households due to energy costs, with the transport-related costs comprising an exuberant load for the low-income population. As energy affordability issues often reflect broader societal inequalities [41], these takeaways underscore the need for further recognizing the status and needs of the vulnerable groups, in order to proceed with distributing the relevant equitable support measures.
The same applies to the lessons learned from indicators related to structural and hidden poverty. Such indicators showed that a significant portion of the population continues to experience energy-related financial difficulties, despite some improvements in housing conditions. Simultaneously, efficiency and chronic vulnerability indicators revealed persistent structural challenges, particularly for households trapped in poverty or constrained by inefficient housing. Once again, recognizing the embedded societal issues, including health-related aspects [42], and aiming to distribute knowledge and raise awareness over beneficial practices towards energy efficiency become imperative [43].
Accessibility and physical vulnerability indicators pointed to concerns about the availability of transportation, especially for lower-income households, highlighting a potential lack of necessary materials/infrastructure for energy and transport services [44]. Such parameters point out the value of material and service distribution toward a just transition to equal provisions.
Lastly, market-driven vulnerability indicators reflected the compounded effects of external shocks, such as rising energy prices, and long-standing issues, such as inefficient housing and low income. A growing reliance on private vehicles was revealed, particularly among low-income groups, due to limited public transport options and rising fuel prices. However, for many households, purchasing new, low-emission vehicles remains financially out of reach. Hence, issues of distributional justice come to the forefront, with vulnerable groups remaining exposed to market price volatilities, while secluded by available transportation alternatives.
Although this study’s results managed to capture and highlight the value of recognition and distributional justice within the process of targeting energy- and transport-vulnerable groups, it is important to acknowledge that aspects pertaining to procedural justice are missing to a certain extent. This fact derives first from the per se process of synthesizing these indicators, which refers to primarily top-down, siloed, and literature-dependent methodologies. Second, the manner in which the relevant data were acquired (primarily via annual surveys), cannot guarantee and accurate depiction of the phenomena. Instead, we can argue that the optimal process for defining energy and transport vulnerability indicators, as well as for acquiring data, should give significant consideration to testimonies and views expressed by civil society, gathered via large-scale and regular participatory processes. Such inclusive processes could not only provide greater clarity on the definition of vulnerability but also raise greater awareness among citizens about these topics.

4.2. Recommendations

Since the results indicated a significantly larger group—when compared to the group identified following the SCF vulnerability definitions only—it is imperative to align the findings with the current policy framework and identify areas of legislative criteria adjustments or expansions to better capture the needs of households facing both energy and transport poverty or vulnerability. Such adjustments would require a two-fold process. First, the proposed criteria for optimum vulnerability detection must align with the terms defined by the SCF frameworks. Next, these criteria must be supplemented with additional parameters already existing in the regulation, allowing for a more meticulous approach to identifying vulnerable groups.
According to the research results, the most impoverished households are not necessarily the most affected by energy and transport vulnerability. This suggests the need to further explore the income group configurations referring to the most vulnerable and define more precise vulnerability criteria, such as household size or composition. This would ensure that the proposed measures will result in relevant beneficial changes for the appropriate final number of vulnerable households.
The application of the transport poverty definition was hindered by the current limited availability and accessibility of relevant data. Hence, it is highly recommended to establish a data-collection system by designating a responsible entity at the national level to oversee the collection, monitoring, and interpretation of the relevant data needed. Such systemic improvements will allow a better understanding of the transport poverty patterns at different spatial levels and within demographic groups. Lastly, regarding transport vulnerability, it is suggested that further research should be conducted on the indicator described as the “inability to buy a zero-emissions vehicle”, which might not be relevant for low-income groups in Greece due to lower income levels, although many vulnerable households still rely on car ownership. This is supported by Greece’s high level of the “TI.1” indicator (see Table A2), which tracks car ownership among materially and socially deprived individuals.
Although the indicators employed within this research were highly dictated and refined according to the contextual parameters of their application in Greece, we suggest that a similar methodological approach could be adopted and adapted to the contexts of other EU MSs, enabling better targeting of vulnerable groups. Such an adaptation process would require a deep understanding of the methodology, high flexibility from the researchers and policy-making authorities, updated datasets, as well as collaboration between all national and regional actors.

4.3. Limitations and Future Research Steps

The lack of updated national and EU-level databases with information vital to depicting the energy and transport vulnerabilities in Greece hindered the processes of accurate results production. Although this obstacle is common within research, it is important to underscore the parameter of time margins in which this research was performed, within the frameworks of the SCF implementation in Greece. The restricted time frame did not allow for further exploration of alternative solutions to fill in the detected data gaps or to perform additional surveys and conduct activities such as workshops, which would have allowed for the creation of complete datasets and the acquisition of invaluable insights.
The findings of this research will serve as input for assessing the impact of the effectiveness of the SCF implementation and allow for creating a comprehensive overview of vulnerability in other legislative frameworks, helping in aligning and identifying target groups for vulnerability-related policies. The next steps would require a meticulous description of the relevant target groups for proposed measures, and further map data needs for comprehensive policy implementation.

5. Conclusions

This article examined the phenomena of energy and transport vulnerability in Greek households by elaborating on indicators based on income and behavioral dimensions. To achieve this, the authors first delved into the status quo of energy and transport vulnerabilities by elaborating on relevant literature as well as the regulatory frameworks established by the Social Climate Fund. Within the Greek context, data collection and assessment were conducted, aiming for solidifying indicators that allow a more accurate detection of vulnerable groups.
The analytical process was initiated by establishing income thresholds, while following criteria indicated by multidimensional indicators falling under the national and SCF vulnerability definitions. The results illustrated that targeting economically active groups can offer a more accurate portrayal of a household’s financial standing and vulnerability. It was also highlighted that the expenditure aspect is crucial, as it accounts for spending on investments in energy-saving measures like renovations or low-emission vehicles. Simultaneously, as some higher-income households were susceptible to increased vulnerability due to household composition and their continued reliance on fossil fuels, the article underscored that vulnerability isn’t strictly correlated with income status alone. Furthermore, the study pointed out that the vulnerable households identified may not perfectly align with those defined by the SCF legislative frameworks.
Finally, the authors proposed the need for aligning households’ energy and transport vulnerability criteria with the SCF Framework, and refining vulnerability group definitions, via improved national data collection and monitoring processes.

Author Contributions

V.O., C.T., I.R. and S.S. initiated the article and carried out an analysis of the indicators on poverty and vulnerability. S.L. assisted in data validation and writing the original draft, while K.K. assisted in data curation and analysis, as well as in writing the original draft. All authors have read and agreed to the published version of the manuscript.

Funding

This research received no external funding.

Institutional Review Board Statement

Not applicable.

Informed Consent Statement

Not applicable.

Data Availability Statement

The data used in this study refer to the HBS conducted on a national and European level and can be found publicly from the National Statistical Authority of Greece (www.statistics.gr, accessed on 4 May 2025). The complete curated dataset can be retrieved from https://doi.org/10.6084/m9.figshare.28892639.v1, accessed on 4 May 2025.

Acknowledgments

The authors would like to acknowledge the valuable comments and contributions from Ulrich Laumanns and Niki Artemis Spyridaki from Deutsche Gesellschaft fuer Internationale Zusammenarbeit (GIZ) GmbH.

Conflicts of Interest

The authors declare no conflict of interest.

Abbreviations

The following abbreviations are used in this manuscript:
SCFSocial Climate Fund regulation
SCPSocial Climate Plan
EEDEnergy Efficiency Directive
EUEuropean Union
ECEuropean Commission
MSMember States
ETS2Emission Trade System (2)
HBSHousehold Budget Survey
SILCStatistics on Income and Living
LFSLabour Force Survey
EQLSEuropean Quality of Life Surveys

Appendix A

Table A1. Energy poverty indicators: EC-recommended indicators. The indicators including an asterisk are also specified for consideration by Member States in their assessment of energy poverty in the Energy Efficiency Directive EU/2023/1979 Art.8.3 [45].
CodeIndicatorDescriptionData
RI.1(a) Inability to keep home adequately warm *
(b) Inability to keep home adequately cool
Most common consensus indicator on energy poverty. The inability to retain a warm home reflects individuals’ preferences and perceptions.
The indicator allows for differentiation between income groups.
EU-SILC (2023) [39]
RI.2Arrears on utility bills *Households that have been unable to pay utility bills due to financial difficulties within the past 12 months.EU-SILC (2023) [39]
RI.3High share of energy expenditure in relation to income (2M)The proportion of households whose share of energy/transport expenditure within their income is more than twice the national average.Eurostat HBS (2022) [40]
RI.4Low absolute energy expenditure (M/2)Low absolute energy expenditure. Share of households whose absolute energy expenditure is below half the national median.Eurostat HBS (2022/2023) [40]
RI.5Residential energy spending > 10% of budgetShare of individuals living in households that spend more than 10% of their budget on residential energy, including electricity, natural gas, liquid fuels for heating, solid fuels for heating.Eurostat HBS (2022/2023) [40]
RI.6Expenditure on energy as percentage of total household expenditureExpenditure as % of the total gives a broader indication of the burden of energy costs.Eurostat HBS (2022/2023) [40]
RI.7Electricity prices average householdElectricity prices for households, average consumption band, (2500–5000 kWh/year).Eurostat, [nrg_pc_204]) [46]
RI.8Gas prices average householdGas prices for household average consumption band (20–200 GJ/year).Eurostat, [nrg_pc_202]) [47]
RI.9Gas prices low consumption householdGas prices for household, lowest consumption band.Eurostat, [nrg_pc_202]) [47]
RI.10Share of population with leak, damp or rot in their dwelling *This indicator is linked to the quality of homes, which is an important underlying factor in determining energy poverty. This can particularly link to negative health outcomes.EU-SILC (2023) [39]
RI.11Final energy consumption per m2 or per dwelling in the residential sector, climate correctedImportant as it relates to energy performance of buildings.Odyssee-MURE project database [48]
RI.12LIHC (Low-Income, High-Costs)Household is at risk of poverty, i.e., expenditures are less than 60% of the national median AFTER paying for energy/transport AND share of energy/transport in total expenditures/income is larger than the national median. Note this includes spending on both energy and transport.Eurostat HBS 2022/2023 [40]
RI.13AROPE * (At-risk-of-poverty)This indicator captures households at risk of poverty, i.e., below 60% of the median equivalent income after social transfers.EU-SILC (2023) and ECHP [ilc_li02] [49]
Table A2. Transport poverty and vulnerability indicators. Source: OEKO institute for DG EMPL.
CodeIndicatorDescriptionData
TI.1Share of the population that is both materially and socially deprived individuals and owns a carSelf-assessmentEU-SILCAvailability
TI.2Share of the population for which the next public transport stop is ‘too far away’Self-assessment2014 (2013) EU-SILC ad-hoc module ‘Material deprivation’
2024 rolling module on ‘Access to services’
Availability
TI.3Share of the population with ‘very difficult’ access to public transportSelf-assessmentEQLS 2016 by EurofoundAvailability
TI.4Share of the population with ‘too difficult’ access to public transport because of reduced mobility.Self-assessment2014 (2013) EU-SILC ad-hoc module ‘Material deprivation’
2024 rolling module on ‘Access to services’
Availability
TI.5Share of the population with a one-way commute to work of more than 30 minSelf-assessmentLFS 2019 ad-hoc module on work organization and working time arrangements.
Spatial data would be very useful at the national level
Accessibility
TI.6Share of the population facing enforced lack of a car (answering ‘No-cannot afford’ to the question of whether they own a car)Self-assessmentEU-SILCAffordability
TI.7Share of the population for which public transport is ‘too expensive’Self-assessment2014 (2013) EU-SILC ad-hoc module ‘Material deprivation’
2024 rolling module on ‘Access to services’
Affordability
TI.8Share of the (household) population that spends more than 6% of total expenditures on transport (only including recurrent expenditures such as fuels, tickets) and household is in the bottom half of expenditure distributionExpenditure-basedHBS 2022
Likely need to exclude pandemic years
Affordability
TI.9Share of the (household) population for which the share of transport expenditures in total expenditures exceeds twice the national median and household is in the bottom half of expenditure distributionExpenditure-basedHBS 2022Affordability
TI.10Share of households with no use of public transport from no member on an annual basisSelf-assessmentSpecial issue of HBS 2021Accessibility

References

  1. European Commission. Regulation (EU) 2021/241 of the European Parliament and of the Council of 12 February 2021 Establishing the Recovery and Resilience Facility. 12 February 2021. Available online: https://eur-lex.europa.eu/legal-content/EN/TXT/PDF/?uri=CELEX:32021R0241 (accessed on 4 May 2025).
  2. European Commission. Regulation (EU) 2021/1056 of the European Parliament and of the Council of 24 June 2021 Establishing the Just Transition Fund. 24 June 2021. Available online: https://eur-lex.europa.eu/legal-content/EN/TXT/PDF/?uri=CELEX:32021R1056 (accessed on 4 May 2025).
  3. Regulation (EU) 2023/955 of the European Parliament and of the Council of 10 May 2023 Establishing a Social Climate Fund and Amending Regulation (EU) 2021/1060. 2024. Available online: http://data.europa.eu/eli/reg/2023/955/2024-06-30/eng (accessed on 3 February 2025).
  4. Rogulj, I.; Peretto, M.; Oikonomou, V.; Ebrahimigharehbaghi, S.; Tourkolias, C. Decarbonisation Policies in the Residential Sector and Energy Poverty: Mitigation Strategies and Impacts in Central and Southern Eastern Europe. Energies 2023, 16, 5443. [Google Scholar] [CrossRef]
  5. Liu, Y.; Dong, K.; Jiang, Q. Assessing energy vulnerability and its impact on carbon emissions: A global case. Energy Econ. 2023, 119, 106557. [Google Scholar] [CrossRef]
  6. Hihetah, C.; Ó Gallachóir, B.; Dunphy, N.P.; Harris, C. A systematic review of the lived experiences of the energy vulnerable: Where are the research gaps? Energy Res. Soc. Sci. 2024, 114, 103565. [Google Scholar] [CrossRef]
  7. Jenkins, K.; McCauley, D.; Heffron, R.; Stephan, H.; Rehner, R. Energy justice: A conceptual review. Energy Res. Soc. Sci. 2016, 11, 174–182. [Google Scholar] [CrossRef]
  8. Jones, E.C.; Reyes, A. Identifying Themes in Energy Poverty Research: Energy Justice Implications for Policy, Programs, and the Clean Energy Transition. Energies 2023, 16, 6698. [Google Scholar] [CrossRef]
  9. Biely, K. Paradigm changes in research: Kuhn meets socio-ecological transition theory. J. Clean. Prod. 2024, 480, 144057. [Google Scholar] [CrossRef]
  10. Siksnelyte-Butkiene, I.; Streimikiene, D.; Lekavicius, V.; Balezentis, T. Energy poverty indicators: A systematic literature review and comprehensive analysis of integrity. Sustain. Cities Soc. 2021, 67, 102756. [Google Scholar] [CrossRef]
  11. Deller, D.; Turner, G.; Waddams Price, C. Energy poverty indicators: Inconsistencies, implications and where next? Energy Econ. 2021, 103, 105551. [Google Scholar] [CrossRef]
  12. Boardman, B. Fixing Fuel Poverty: Challenges and Solutions; Routledge: London, UK, 2013; ISBN 1-84977-448-X. [Google Scholar]
  13. Middlemiss, L.; Gillard, R. Fuel poverty from the bottom-up: Characterising household energy vulnerability through the lived experience of the fuel poor. Energy Res. Soc. Sci. 2015, 6, 146–154. [Google Scholar] [CrossRef]
  14. Madudova, E.; Corejova, T. The Issue of Measuring Household Consumption Expenditure. Economies 2023, 12, 9. [Google Scholar] [CrossRef]
  15. Hitchings, R.; Day, R. How older people relate to the private winter warmth practices of their peers and why we should be interested. Environ. Plan. A 2011, 43, 2452–2467. [Google Scholar] [CrossRef]
  16. Kowsari, R.; Zerriffi, H. Three dimensional energy profile: A conceptual framework for assessing household energy use. Energy Policy 2011, 39, 7505–7517. [Google Scholar] [CrossRef]
  17. Stańczyk, E.; Szalonka, K.; Niklewicz-Pijaczyńska, M.; Nowak, W.; Stańczyk, P.; Witczyńska, K.; Ziobrowska-Sztuczka, J. Rationalization of Energy Expenditure: Household Behavior in Poland. Energies 2024, 17, 5329. [Google Scholar] [CrossRef]
  18. Drago, C.; Gatto, A. Measuring energy poverty and energy vulnerability. Sustain. Cities Soc. 2023, 92, 104450. [Google Scholar] [CrossRef]
  19. European Commission. Energy Efficiency Directive. 13 September 2023. Available online: https://eur-lex.europa.eu/legal-content/EN/TXT/?uri=OJ%3AJOL_2023_231_R_0001&qid=1695186598766 (accessed on 4 May 2025).
  20. Mattioli, G.; Lucas, K.; Marsden, G. Transport poverty and fuel poverty in the UK: From analogy to comparison. Transp. Policy 2017, 59, 93–105. [Google Scholar] [CrossRef]
  21. Lucas, K.; Mattioli, G.; Verlinghieri, E.; Guzman, A. Transport poverty and its adverse social consequences. Proc. Inst. Civ. Eng. 2016, 169, 353–365. [Google Scholar] [CrossRef]
  22. Lowans, C.; Furszyfer Del Rio, D.; Sovacool, B.K.; Rooney, D.; Foley, A.M. What is the state of the art in energy and transport poverty metrics? A critical and comprehensive review. Energy Econ. 2021, 101, 105360. [Google Scholar] [CrossRef]
  23. Glossary: At-Risk-of-Poverty Rate. Available online: https://ec.europa.eu/eurostat/statistics-explained/index.php?title=Glossary:At-risk-of-poverty_rate (accessed on 13 February 2025).
  24. Boemi, S.N.; Papadopoulos, A.M. Papadopoulos Energy poverty and energy efficiency improvements: A longitudinal approach of the Hellenic households. Energy Build. 2019, 197, 242–250. [Google Scholar] [CrossRef]
  25. LAW No. 4001 On the Operation of Electricity and Natural Gas Energy Markets, on Hydrocarbon Exploration, Production and Transmission Networks, and Other Provisions, Government Gazette A 179/22.8.2011, Greece, 2011. Available online: http://elib.aade.gr/elib/view?d=/gr/act/2011/4001/ (accessed on 4 May 2025).
  26. Commission Staff Working Document EU Guidance on Energy Poverty—European Commission. Available online: https://energy.ec.europa.eu/publications/commission-staff-working-document-eu-guidance-energy-poverty_en (accessed on 12 February 2025).
  27. Galvin, R. Letting the Gini out of the fuel poverty bottle? Correlating cold homes and income inequality in European Union countries. Energy Res. Soc. Sci. 2019, 58, 101255. [Google Scholar] [CrossRef]
  28. Piao, X.; Managi, S. Household energy-saving behavior, its consumption, and life satisfaction in 37 countries. Sci. Rep. 2023, 13, 1382. [Google Scholar] [CrossRef]
  29. Statistics|Eurostat. Available online: https://ec.europa.eu/eurostat/databrowser/view/sdg_07_60/default/table (accessed on 12 February 2025).
  30. National Action Plan to Combat Energy Poverty. Available online: https://www.energypoverty.gr/en/action_plan.html (accessed on 13 February 2025).
  31. Droutsa, K.G.; Kontoyiannidis, S.; Dascalaki, E.G.; Balaras, C.A. Mapping the energy performance of hellenic residential buildings from EPC (energy performance certificate) data. Energy 2016, 98, 284–295. [Google Scholar] [CrossRef]
  32. Thomson, H.; Simcock, N.; Bouzarovski, S.; Petrova, S. Energy poverty and indoor cooling: An overlooked issue in Europe. Energy Build. 2019, 196, 21–29. [Google Scholar] [CrossRef]
  33. EEA. Cooling Buildings Sustainably in Europe: Exploring the Links Between Climate Change Mitigation and Adaptation, and Their Social Impacts. 10 November 2022. Available online: https://www.eea.europa.eu/publications/cooling-buildings-sustainably-in-europe/cooling-buildings-sustainably-in-europe (accessed on 4 May 2025).
  34. Eurostat. EU—Labour Force Survey Microdata 1983-2023, release 2024. 2024. Available online: https://ec.europa.eu/eurostat/documents/203647/20621087/EU+LFS+DOI+2024.pdf (accessed on 4 May 2025).
  35. European Quality of Life Surveys (EQLS)|European Foundation for the Improvement of Living and Working Conditions. Available online: https://www.eurofound.europa.eu/en/surveys/european-quality-life-surveys-eqls (accessed on 13 February 2025).
  36. Directorate-General for Employment, Social Affairs and Inclusion. Transport Poverty: Definitions, Indicators, Determinants, and Mitigation Strategies—Final Report. 15 November 2024. Available online: https://employment-social-affairs.ec.europa.eu/transport-poverty-definitions-indicators-determinants-and-mitigation-strategies-final-report_en (accessed on 4 May 2025).
  37. Verhorst, T.; Fu, X.; van Lierop, D. Definitions matter: Investigating indicators for transport poverty using different measurement tools. Eur. Transp. Res. Rev. 2023, 15, 21. [Google Scholar] [CrossRef]
  38. Adolfsen, J.F.; Kuik, F.; Schuler, T.; Lis, E. The Impact of the War in Ukraine on Euro Area Energy Markets. June 2022. Available online: https://www.ecb.europa.eu/press/economic-bulletin/focus/2022/html/ecb.ebbox202204_01~68ef3c3dc6.en.html (accessed on 12 February 2025).
  39. EU Statistics on Income and Living Conditions-Microdata-Eurostat. Available online: https://ec.europa.eu/eurostat/web/microdata/european-union-statistics-on-income-and-living-conditions/ (accessed on 13 February 2025).
  40. Overview—Household Budget Surveys—Eurostat. Available online: https://ec.europa.eu/eurostat/web/household-budget-surveys (accessed on 13 February 2025).
  41. Nicolini, D. Practice Theory, Work, and Organization: An Introduction; OUP Oxford: Oxford, UK, 2012; ISBN 0-19-164462-5. [Google Scholar]
  42. Bouzarovski, S.; Petrova, S. A global perspective on domestic energy deprivation: Overcoming the energy poverty–fuel poverty binary. Energy Res. Soc. Sci. 2015, 10, 31–40. [Google Scholar] [CrossRef]
  43. Shove, E. What is wrong with energy efficiency? Build. Res. Inf. 2018, 46, 779–789. [Google Scholar] [CrossRef]
  44. Shove, E.; Pantzar, M.; Watson, M. Social Practice: Everyday Life and How It Changes; Sage: Los Angeles, CA, USA; London, UK; New Delhi, India; Singapore; Washington, DC, USA, 2012; 181p. [Google Scholar]
  45. Decision of the EEA Joint Committee No 177/2020 of 11 December 2020 Amending Annex I (Veterinary and Phytosanitary Matters) to the EEA Agreement [2023/1979]. Available online: https://eur-lex.europa.eu/eli/dec/2023/1979/oj/eng (accessed on 4 May 2025).
  46. Electricity Prices—Bi-Annual Data (from 2007 Onwards) (nrg_pc_204), EUROSTAT (2024). Available online: https://ec.europa.eu/eurostat/databrowser/product/page/NRG_PC_204 (accessed on 4 May 2025).
  47. Gas Prices for Household Consumers—Bi-Annual Data (from 2007 Onwards) (nrg_pc_202), EUROSTAT. Available online: https://ec.europa.eu/eurostat/databrowser/product/page/NRG_PC_202 (accessed on 4 May 2025).
  48. The Odyssee Database, ODYSEE-MURE Project, Accessed April 2025. Available online: https://www.indicators.odyssee-mure.eu/energy-efficiency-database.html (accessed on 4 May 2025).
  49. At-Risk-of-Poverty Rate by Poverty Threshold, Age and Sex. The European Community Household Panel (ECHP), EUROSTAT (2025). Available online: https://ec.europa.eu/eurostat/databrowser/product/page/ILC_LI02 (accessed on 4 May 2025).
Figure 1. Average annual individual income for all indicators.
Sustainability 17 04275 g001
Figure 2. Energy poverty indicators for households in Greece.
Sustainability 17 04275 g002
Figure 3. Number of households unable to renovate.
Sustainability 17 04275 g003
Figure 4. Transport poverty indicators in Greece. Please note that TI.3 and TI.5, respectively, “Population reporting very difficult public transport access” and “Commute time exceeds 30 min one way”, are not reported in the table as no data were available.
Sustainability 17 04275 g004
Figure 5. Population that can afford a private vehicle.
Sustainability 17 04275 g005
Figure 6. Households with the inability to purchase a new emission-free vehicle.
Sustainability 17 04275 g006
Table 1. Household and transport vulnerability according to the income threshold.
TypeIndicatorsIncome Threshold
Non-Zero Declared IncomeAll Household Members
Household vulnerabilityIn1—Inability to renovate10,7827811
Transport vulnerabilityIn2—Inability to purchase new zero-emission vehicle10,9177950
Table 2. Household structure and number (Household Budget Survey 2023).
Household CompositionTotal<EUR 750<EUR 1100<EUR 1450<EUR 1800<EUR 2200<EUR 2800≤EUR 3500≥EUR 3501
Single person below 65 years old704,697198,380202,301134,67685,37521,84035,79917,0749251
Single person 65 years old and above673,523284,559188,584112,14353,13315,81914,78828391659
Single couple953,25681,873163,520189,367140,566137,984130,76563,80145,380
Couple with 1 child above 16 years old312,050713939,76548,54943,98059,17755,48424,92533,030
Couple with 1 child up to 16 years old262,01410,92221,63429,90240,87849,33257,20118,65933,486
Couple with 3 children and more above 16 years old100,3492083889618,07213,15813,11419,34214,06211,622
Single parent with 1 child or more up to 16 years old47,50113,99213,11310,13943471658279914530
Couple or single parent with children above 16 years old740,34628,72955,88974,80296,991126,025150,974103,976102,959
Other type of household463,29832,62545,81966,30462,10474,22582,84951,47147,902
Table 3. Number of vulnerable households and transport users.
Households with Non-Zero Income
TypeIndicatorsNr Households and % Total HouseholdsNr of Households Under ETS2 and % of Total Households
Energy-poor households 859,843 (20.2%)x
Vulnerable households (4 income categories)Inability to renovate1,617,828 (38%)826,826 (19.4%)
Transport-poor households 1,416,964 (33.3%)x
Vulnerable transport users (4 income categories)Inability to purchase new car1,820,498 (42.8%)965,574 (22.7%)
Table 4. Number and percentage of vulnerable households under ETS2 in the first four income categories.
<EUR 750<EUR 1100<EUR 1450<EUR 1800
Vulnerable households ETS2290,221179,865237,918118,821
%44.0%53.6%55.7%60.9%
Vulnerable transport ETS2195,994172,631290,322306,626
%29.7%51.5%68%77.1%
Disclaimer/Publisher’s Note: The statements, opinions and data contained in all publications are solely those of the individual author(s) and contributor(s) and not of MDPI and/or the editor(s). MDPI and/or the editor(s) disclaim responsibility for any injury to people or property resulting from any ideas, methods, instructions or products referred to in the content.

